Q1 FY2012
Operating Results
DeNA Co., Ltd.
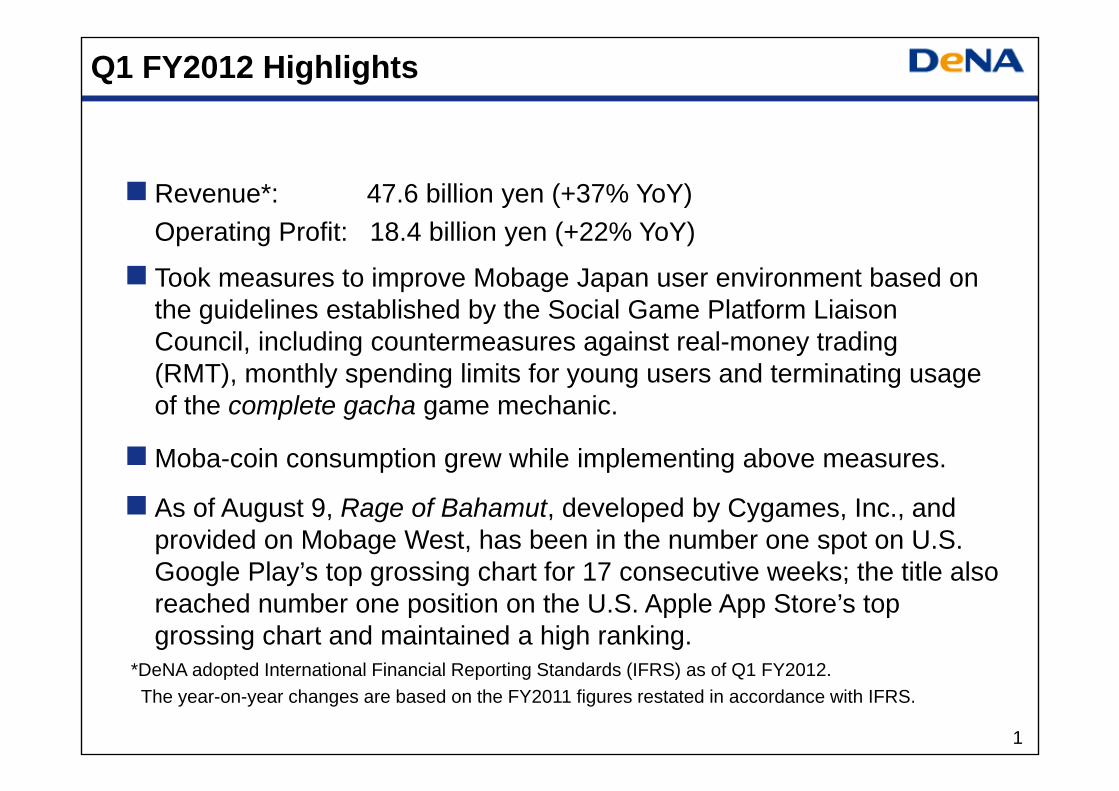
Q1 FY2012 Highlights
1
As of August 9, Rage of Bahamut, developed by Cygames, Inc., and provided on Mobage West, has been in the number one spot on U.S. Google Play’s top grossing chart for 17 consecutive weeks; the title also reached number one position on the U.S. Apple App Store’s top grossing chart and maintained a high ranking.
Took measures to improve Mobage Japan user environment based on the guidelines established by the Social Game Platform Liaison Council, including countermeasures against real-money trading(RMT), monthly spending limits for young users and terminating usage of the complete gacha game mechanic.
Moba-coin consumption grew while implementing above measures.
Revenue*: 47.6 billion yen (+37% YoY)Operating Profit: 18.4 billion yen (+22% YoY)
*DeNA adopted International Financial Reporting Standards (IFRS) as of Q1 FY2012. The year-on-year changes are based on the FY2011 figures restated in accordance with IFRS.
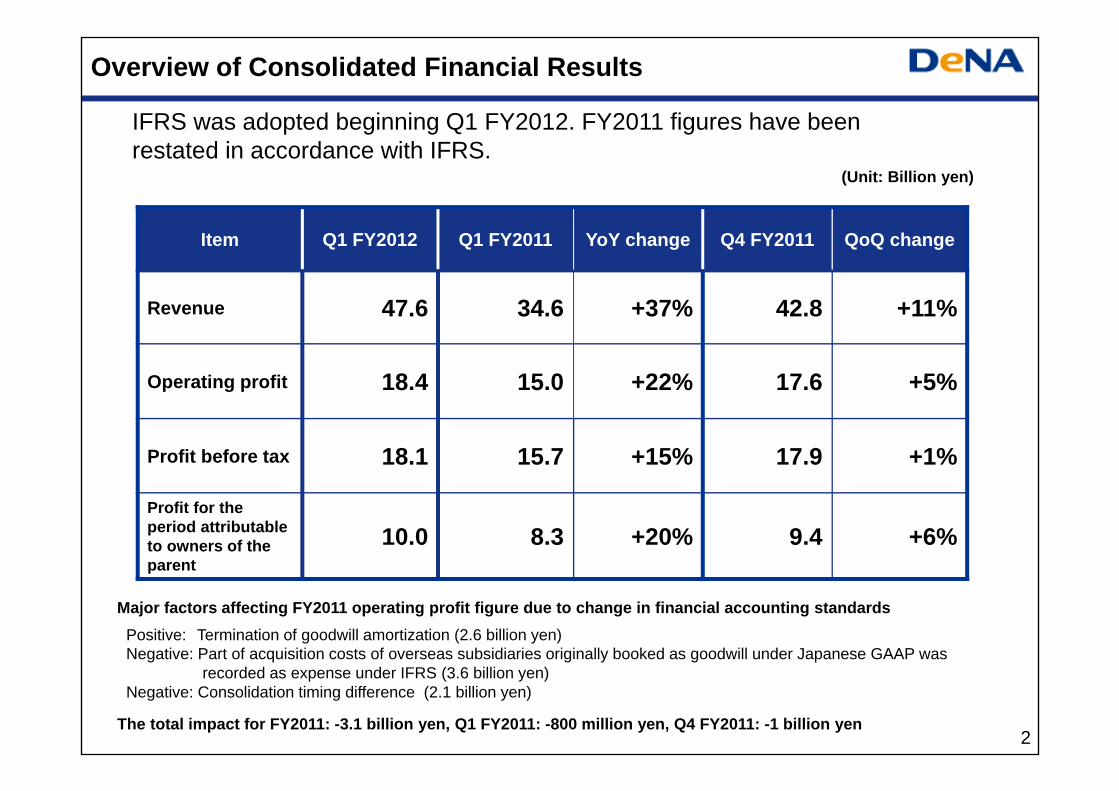
Item Q1 FY2012 Q1 FY2011 YoY change Q4 FY2011 QoQ change
Revenue 47.6 34.6 +37% 42.8 +11%
Operating profit 18.4 15.0 +22% 17.6 +5%
Profit before tax 18.1 15.7 +15% 17.9 +1%
Profit for the period attributable to owners of the parent
10.0 8.3 +20% 9.4 +6%
Overview of Consolidated Financial Results
(Unit: Billion yen)
2
IFRS was adopted beginning Q1 FY2012. FY2011 figures have been restated in accordance with IFRS.
Major factors affecting FY2011 operating profit figure due to change in financial accounting standardsPositive: Termination of goodwill amortization (2.6 billion yen)Negative: Part of acquisition costs of overseas subsidiaries originally booked as goodwill under Japanese GAAP was
recorded as expense under IFRS (3.6 billion yen)Negative: Consolidation timing difference (2.1 billion yen)
The total impact for FY2011: -3.1 billion yen, Q1 FY2011: -800 million yen, Q4 FY2011: -1 billion yen
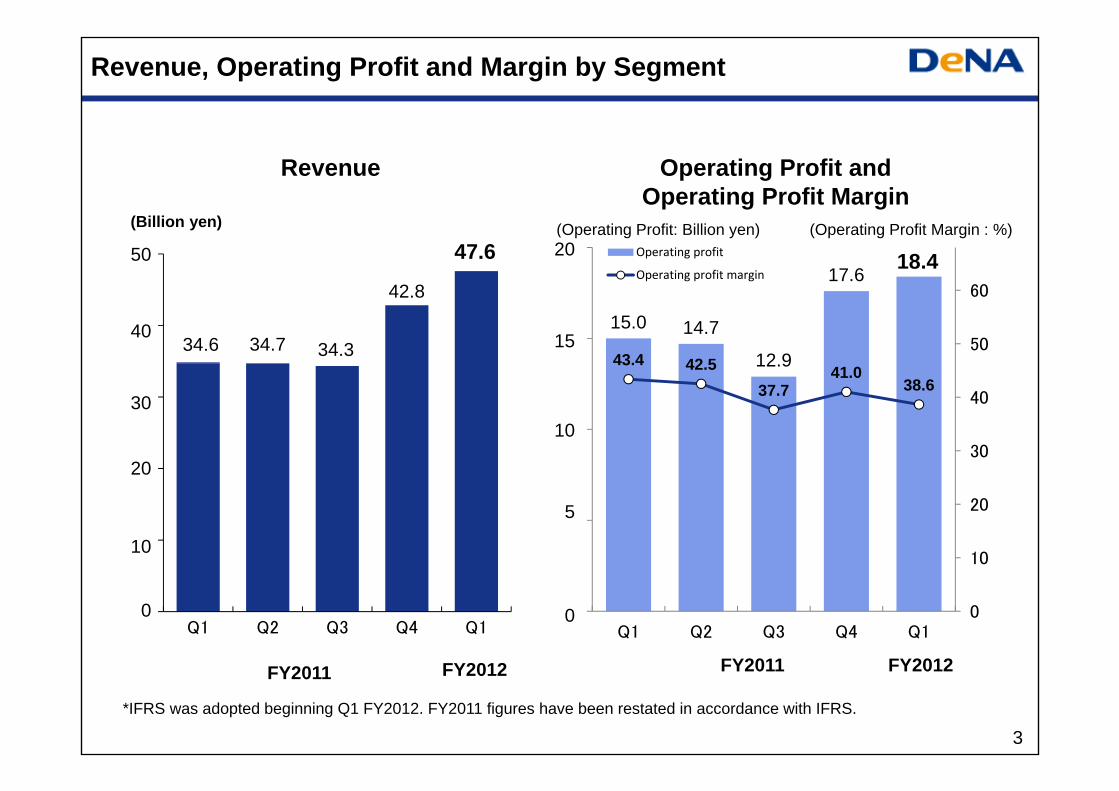
15.0 14.7
12.9
17.6 18.4
43.4 42.537.7
41.038.6
0
10
20
30
40
50
60
0
50
100
150
200
Q1 Q2 Q3 Q4 Q1
Operating profit
Operating profit margin
Revenue, Operating Profit and Margin by Segment
3
Revenue Operating Profit and Operating Profit Margin
(Billion yen) (Operating Profit: Billion yen) (Operating Profit Margin : %)
FY2012FY2011 FY2012FY2011
34.6 34.7 34.3
42.8
47.6
0
100
200
300
400
500
Q1 Q2 Q3 Q4 Q1
50
40
30
20
10
0
20
15
10
5
0
*IFRS was adopted beginning Q1 FY2012. FY2011 figures have been restated in accordance with IFRS.
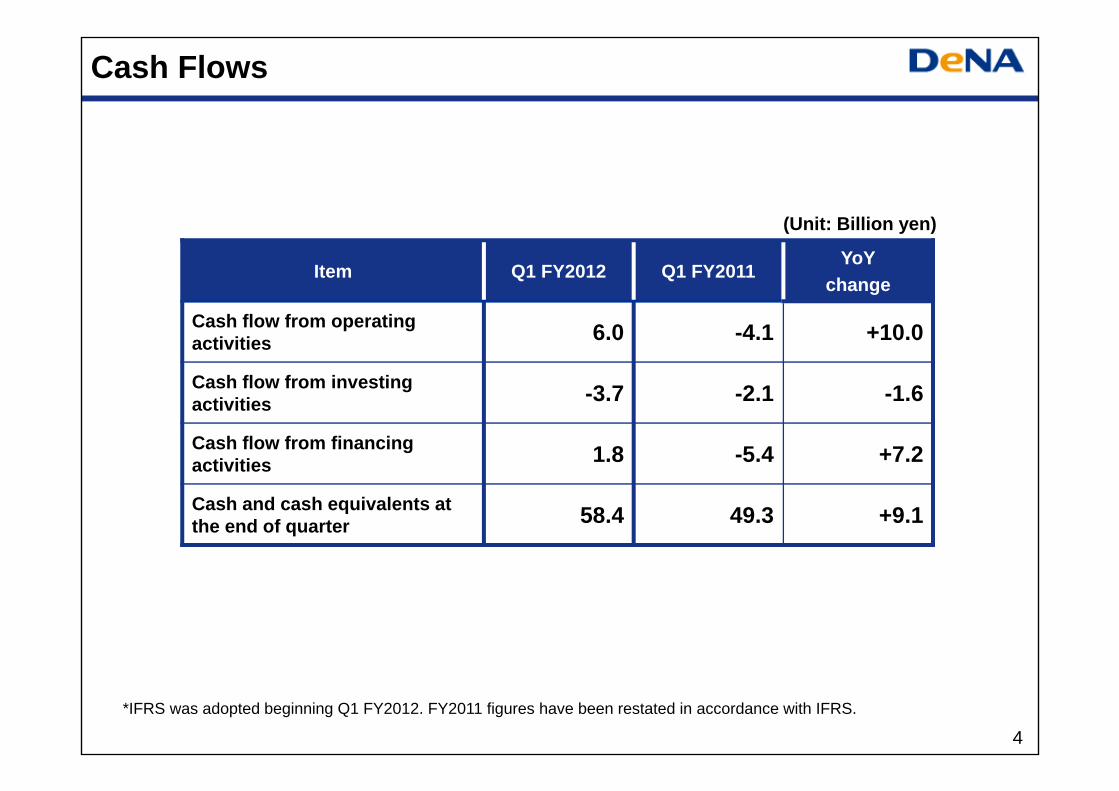
Item Q1 FY2012 Q1 FY2011YoY
change
Cash flow from operating activities 6.0 -4.1 +10.0
Cash flow from investing activities -3.7 -2.1 -1.6
Cash flow from financing activities 1.8 -5.4 +7.2
Cash and cash equivalents at the end of quarter 58.4 49.3 +9.1
4
Cash Flows
(Unit: Billion yen)
*IFRS was adopted beginning Q1 FY2012. FY2011 figures have been restated in accordance with IFRS.
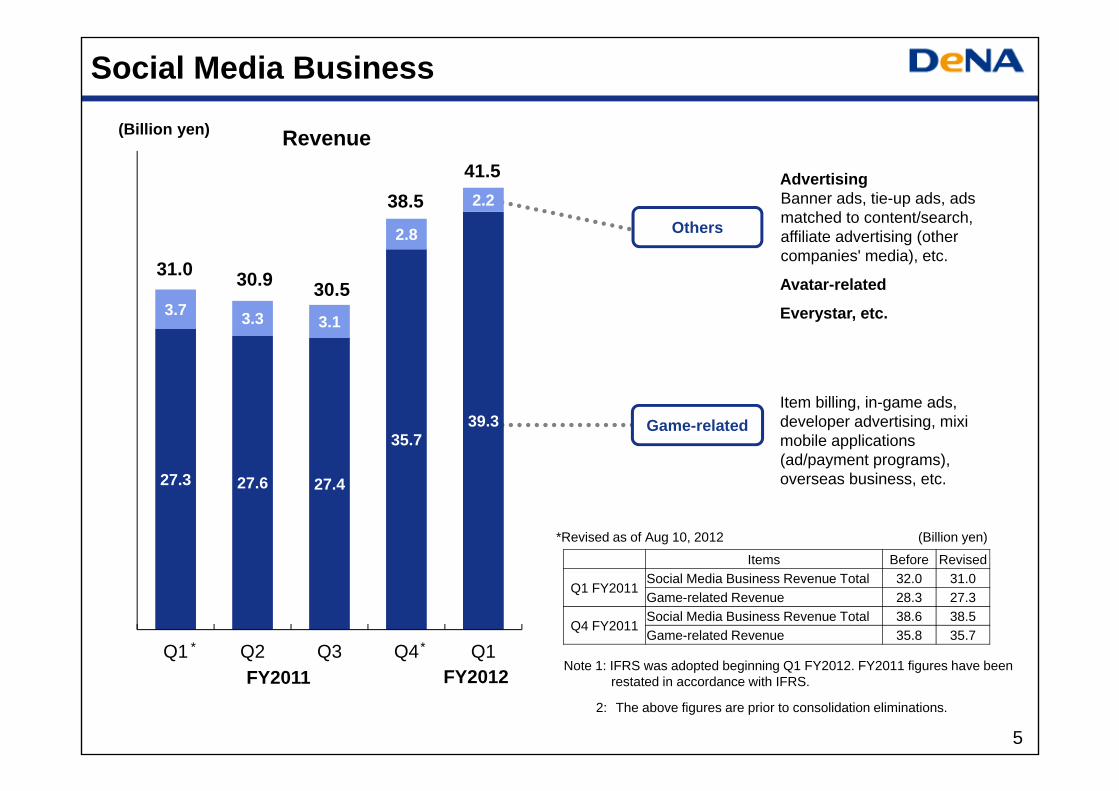
AdvertisingBanner ads, tie-up ads, ads matched to content/search, affiliate advertising (other companies' media), etc.
Avatar-related
Everystar, etc.
Item billing, in-game ads, developer advertising, miximobile applications (ad/payment programs), overseas business, etc.
5
Others
Game-related
27.3 27.6 27.4
35.739.3
3.7 3.3 3.1
2.8
2.2
Q1 Q2 Q3 Q4 Q1
31.0 30.9 30.5
38.541.5
Social Media Business
Revenue(Billion yen)
FY2011 FY2012* *
Items Before Revised
Q1 FY2011Social Media Business Revenue Total 32.0 31.0Game-related Revenue 28.3 27.3
Q4 FY2011Social Media Business Revenue Total 38.6 38.5Game-related Revenue 35.8 35.7
*Revised as of Aug 10, 2012 (Billion yen)
Note 1: IFRS was adopted beginning Q1 FY2012. FY2011 figures have been restated in accordance with IFRS.
2: The above figures are prior to consolidation eliminations.
6
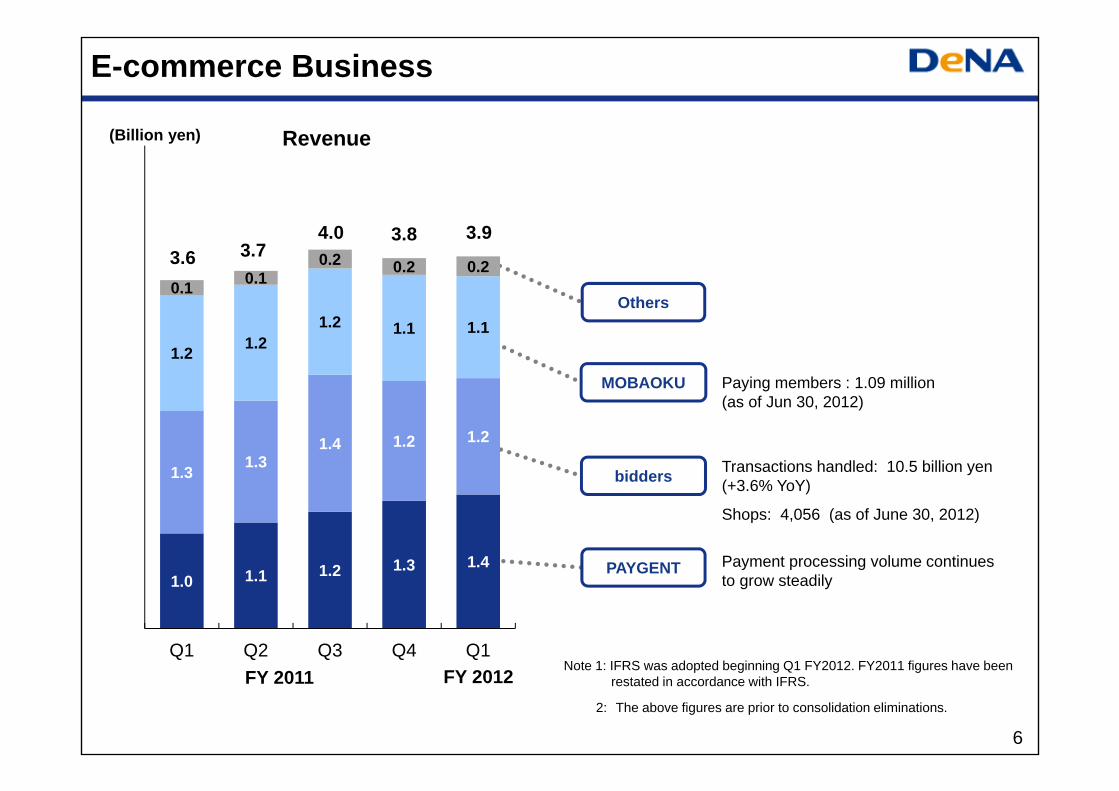
1.0 1.1 1.2 1.3 1.4
1.3 1.31.4 1.2 1.2
1.2 1.21.2 1.1 1.1
0.1 0.10.2 0.2 0.2
Q1 Q2 Q3 Q4 Q1
3.73.64.0 3.93.8
Note 1: IFRS was adopted beginning Q1 FY2012. FY2011 figures have been restated in accordance with IFRS.
2: The above figures are prior to consolidation eliminations.
E-commerce Business
(Billion yen) Revenue
Payment processing volume continues to grow steadily
Paying members : 1.09 million(as of Jun 30, 2012)
Transactions handled: 10.5 billion yen (+3.6% YoY)
Shops: 4,056 (as of June 30, 2012)
bidders
PAYGENT
Others
MOBAOKU
FY 2011 FY 2012

Mobage Japan: Moba-coin Consumption Trends
7
0
100
200
300
400
500
600
1Q 2Q 3Q 4Q 1Q
内製・協業
オープン
(BillionMoba-coins)
FY2011
54.1
FY2012
0
50
100
150
200
4月 5月 6月 7月
FY2012
Quarterly
Moba-coin Consumption* (Japan only)
(BillionMoba-coins)
Monthly
First- and Second-party
Third-party
* Includes consumption of Moba-coins, monthly membership service fees for social games and ticket sales
Apr May Jun Jul
Coin consumption increased quarter-on-quarter despite the termination of complete gacha game mechanics, adoption of monthly spending limits for young users and implementation of other measures to improve the user environment.
Monthly coin consumption remained consistent even after the implementation of above-mentioned measures began in May.
60
50
40
30
20
10
0
20
15
10
5
0
51.1
40.937.033.4
17.7 18.4 18.0 18.3
Moba-coin consumption on smartphones in July reached approximately 44% of total coin consumption.

Mobage Japan: Q2 FY2012 Moba-coin Consumption Forecast
8
Q2 FY2012 Moba-coin consumption forecast:55 billion Moba-coins (+ Appx. 1 billion QoQ)
Guidelines 1st- and 2nd- party 3rd-party
Termination of complete gacha Implemented by end of May Implemented by end of June
Termination of completegacha-like mechanics, etc.
Mostly implemented by June 22, completed implementation by end of June Implemented by end of June
Clear in-game display Implementation started at beginning of Juneand mostly completed as of today
To be implemented by end of August
Status of Guideline Adaption
Coin consumption will be accelerated by integrating new game elements into existing titles and releasing new titles
Moba-coin consumption in first- and second-party titles showed no drop after implementing above guidelines; similar performance is expected for third-party titles.
User Environment Improvement
• Aim to form a tentatively-named Liaison Council on Improvement of Social Game Users’ Environment in October 2012
Initiatives by Preparation Committee
• Lead discussion among experts and industry members to establish an appropriate environment for social game users
The preparation committee chaired by Masao Horibe, Professor Emeritus at Hitotsubashi University, has met to establish a tentatively-named Liaison Council on Improvement of Environment for Social Game Users. The initiative was led by the Social Game Platform Liaison Council, which has determined a set of social gaming guidelines.
By forming working groups, the preparation committee is developing detailed steps to build a framework in which social game companies effectively implement voluntary regulations
9
10
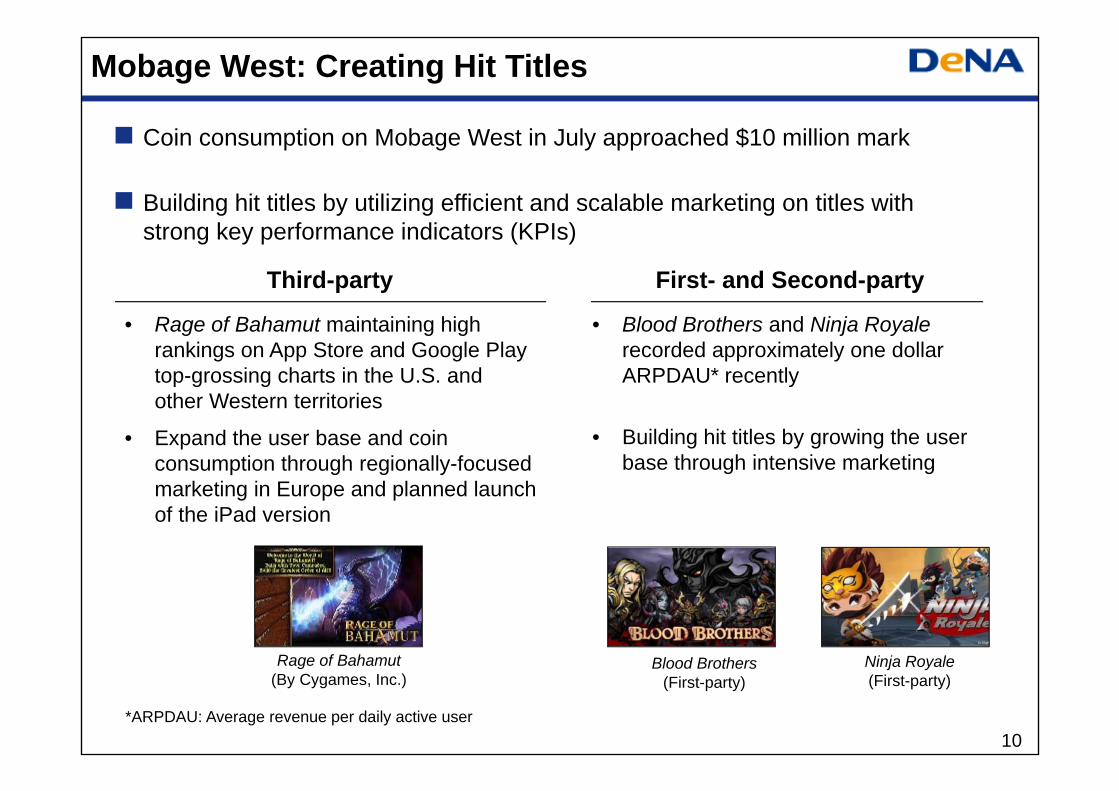
Mobage West: Creating Hit Titles
Coin consumption on Mobage West in July approached $10 million mark
Blood Brothers(First-party)
Ninja Royale(First-party)
Building hit titles by utilizing efficient and scalable marketing on titles with strong key performance indicators (KPIs)
Rage of Bahamut(By Cygames, Inc.)
Third-party
• Rage of Bahamut maintaining high rankings on App Store and Google Play top-grossing charts in the U.S. and other Western territories
• Expand the user base and coin consumption through regionally-focused marketing in Europe and planned launch of the iPad version
First- and Second-party
• Blood Brothers and Ninja Royale recorded approximately one dollar ARPDAU* recently
• Building hit titles by growing the user base through intensive marketing
*ARPDAU: Average revenue per daily active user

Mobage West: Expanding Game Lineup
Selected titles to be released in Q2 FY2012
…and more titles to be launched during FY2012
Monster TrackerGalaxy Assault Rites of DeltaKAYAC Inc.
Deity WarsCROOZ, Inc.
FantasicaSilicon Studio Corporation
Kingdom ChronicleAXEL MARK, INC.
Metal Shock
Fatal Frontier
First- and Second-party Third-party
Pocket PlanesNimbleBit LLC
Monster MonsterSakurasoft Co., Ltd.
Legend Cardsgloops International Inc.
Time Teens
11
3D Card Battle Game
ETERNAL REQUIEMKLab Global Pte.Ltd.
Expanding first-, second- and third-party lineups
• Create first-party titles with proven Japanese game development know-how• Release key titles with globally-recognized strong intellectual properties• Expand attractive game lineup by partnering with leading third-party developers worldwide
Strategy for expanding lineups
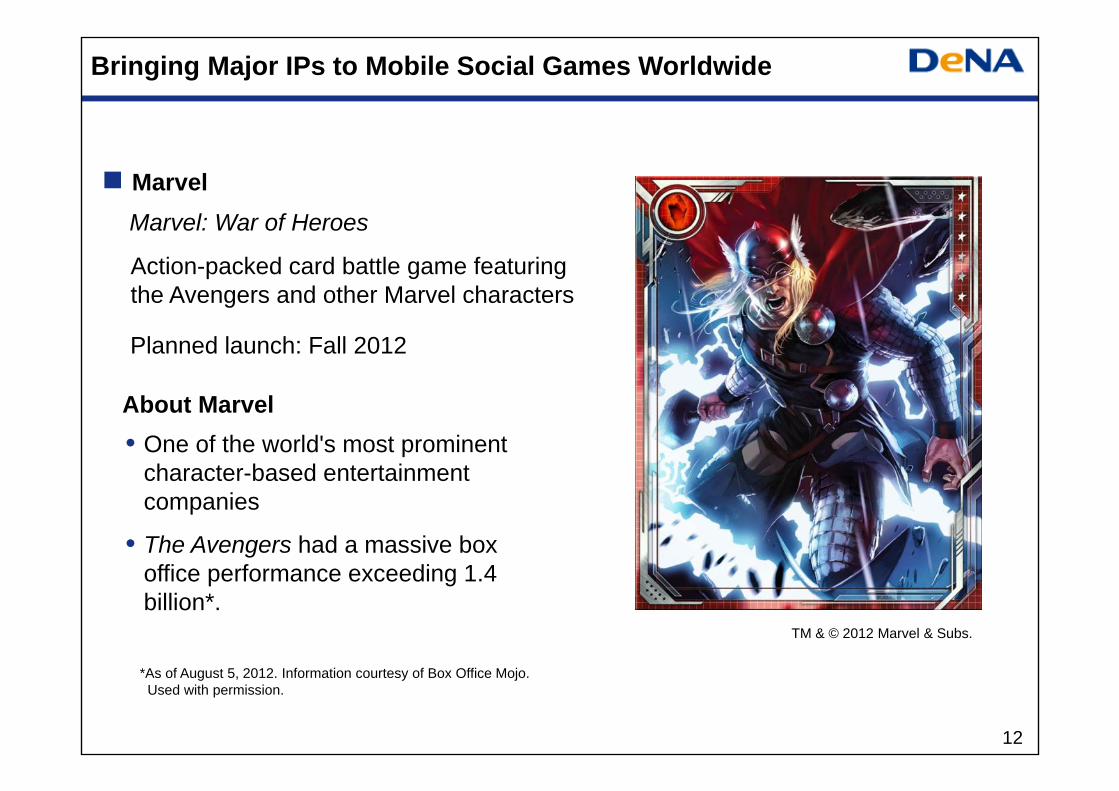
Bringing Major IPs to Mobile Social Games Worldwide
Action-packed card battle game featuring the Avengers and other Marvel characters
TM & © 2012 Marvel & Subs.
Marvel: War of Heroes
About Marvel• One of the world's most prominent
character-based entertainment companies
• The Avengers had a massive box office performance exceeding 1.4 billion*.
Marvel
*As of August 5, 2012. Information courtesy of Box Office Mojo. Used with permission.
Planned launch: Fall 2012
12
13
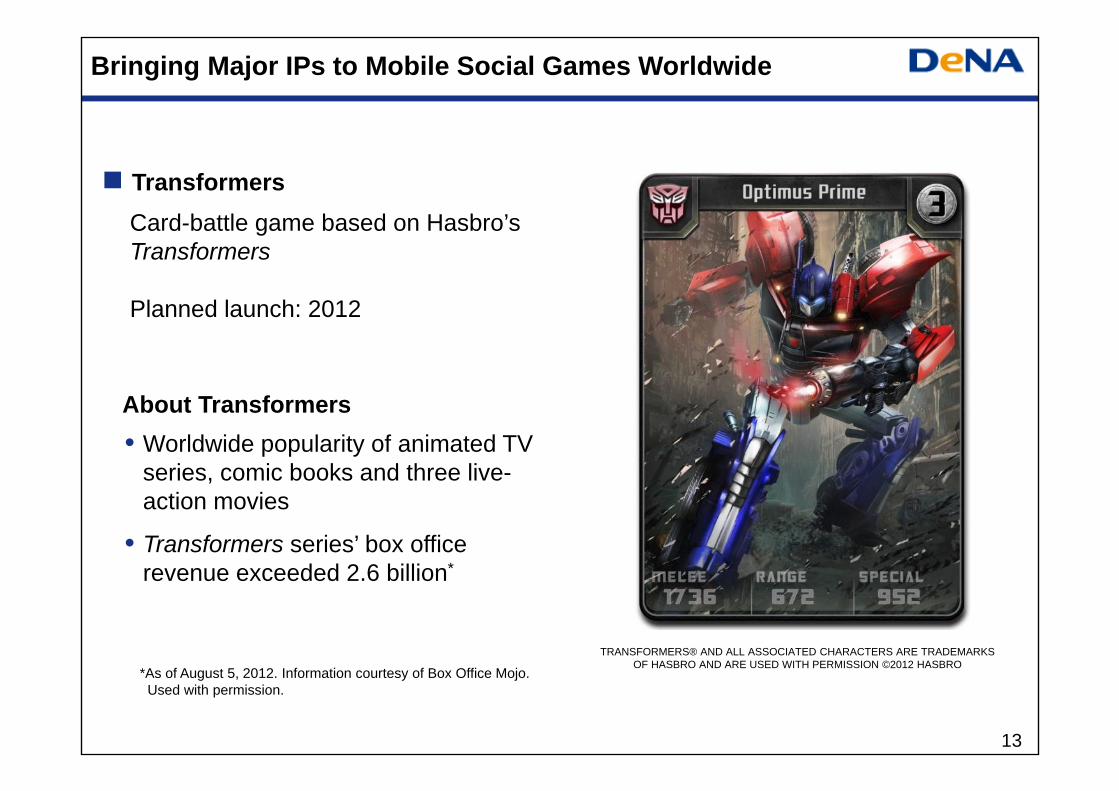
Transformers
TRANSFORMERS® AND ALL ASSOCIATED CHARACTERS ARE TRADEMARKSOF HASBRO AND ARE USED WITH PERMISSION ©2012 HASBRO
Card-battle game based on Hasbro’s Transformers
Planned launch: 2012
• Worldwide popularity of animated TV series, comic books and three live-action movies
• Transformers series’ box office revenue exceeded 2.6 billion*
Bringing Major IPs to Mobile Social Games Worldwide
*As of August 5, 2012. Information courtesy of Box Office Mojo. Used with permission.
About Transformers
14
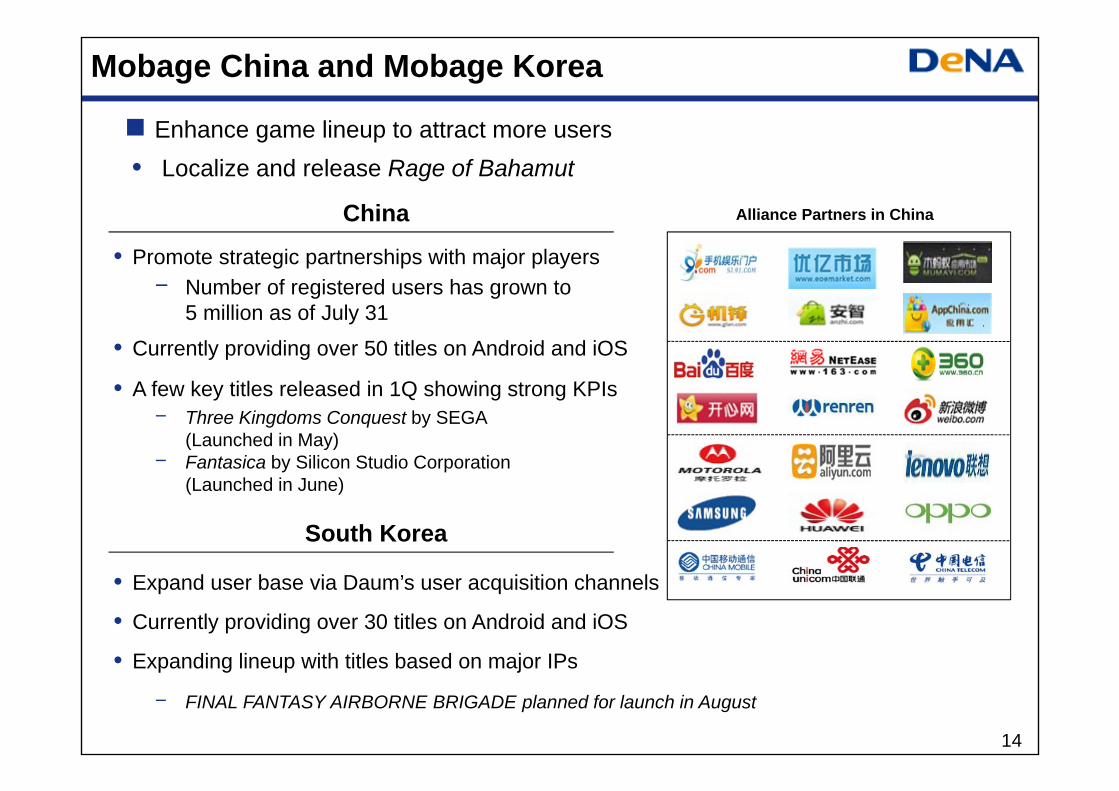
Mobage China and Mobage Korea
China
• A few key titles released in 1Q showing strong KPIs‒ Three Kingdoms Conquest by SEGA
(Launched in May)‒ Fantasica by Silicon Studio Corporation
(Launched in June)
• Expand user base via Daum’s user acquisition channels
• Promote strategic partnerships with major players‒ Number of registered users has grown to
5 million as of July 31
• Currently providing over 50 titles on Android and iOS
‒ FINAL FANTASY AIRBORNE BRIGADE planned for launch in August
• Expanding lineup with titles based on major IPs
• Currently providing over 30 titles on Android and iOS
Alliance Partners in China
South Korea
• Localize and release Rage of Bahamut Enhance game lineup to attract more users
15
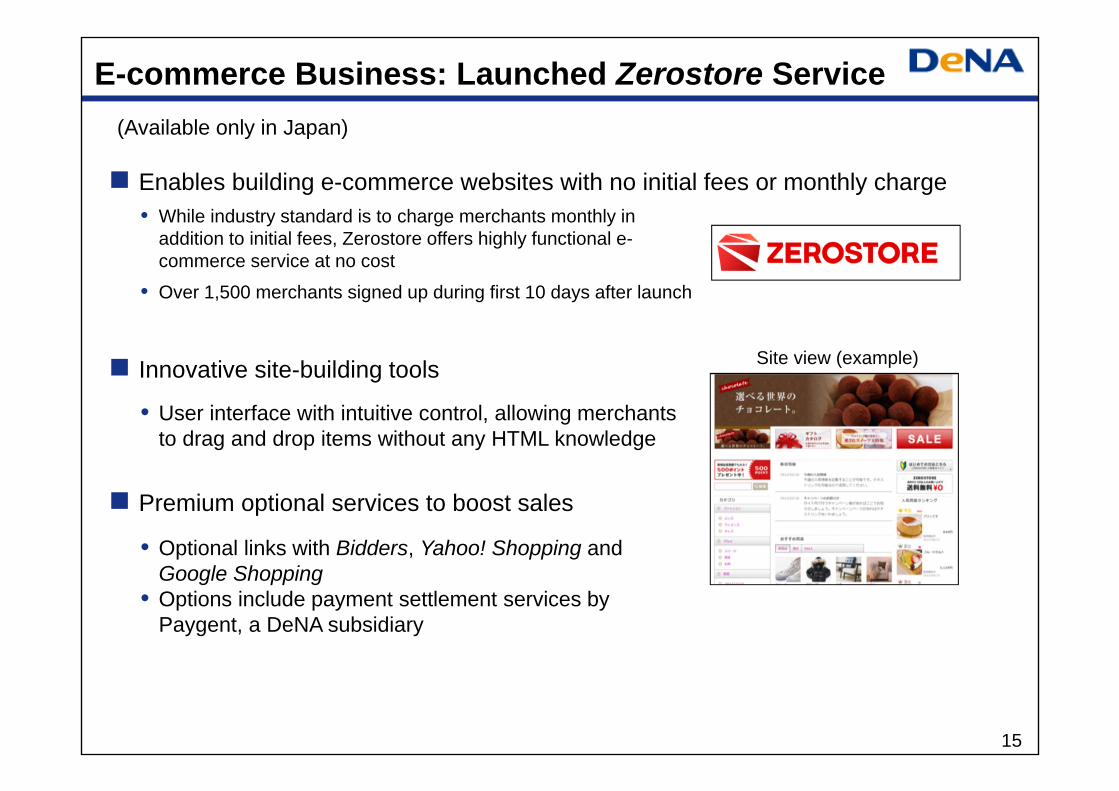
E-commerce Business: Launched Zerostore Service
Enables building e-commerce websites with no initial fees or monthly charge• While industry standard is to charge merchants monthly in
addition to initial fees, Zerostore offers highly functional e-commerce service at no cost
• Over 1,500 merchants signed up during first 10 days after launch
Innovative site-building tools
• User interface with intuitive control, allowing merchants to drag and drop items without any HTML knowledge
Site view (example)
Premium optional services to boost sales
• Optional links with Bidders, Yahoo! Shopping and Google Shopping
• Options include payment settlement services by Paygent, a DeNA subsidiary
(Available only in Japan)

1H FY2012 Forecasts
Item1H FY2012(Forecast)
1H FY 2011(Actual)
YoYchange
Revenue 97.1 69.3 +40%
Operating profit 37.9 29.8 +27%
Profit for the period attributable to owners of the parent
21.4 15.2 +40%
16
(Billion yen)
IFRS was adopted beginning Q1 FY2012. FY2011 figures have been restated in accordance with IFRS.
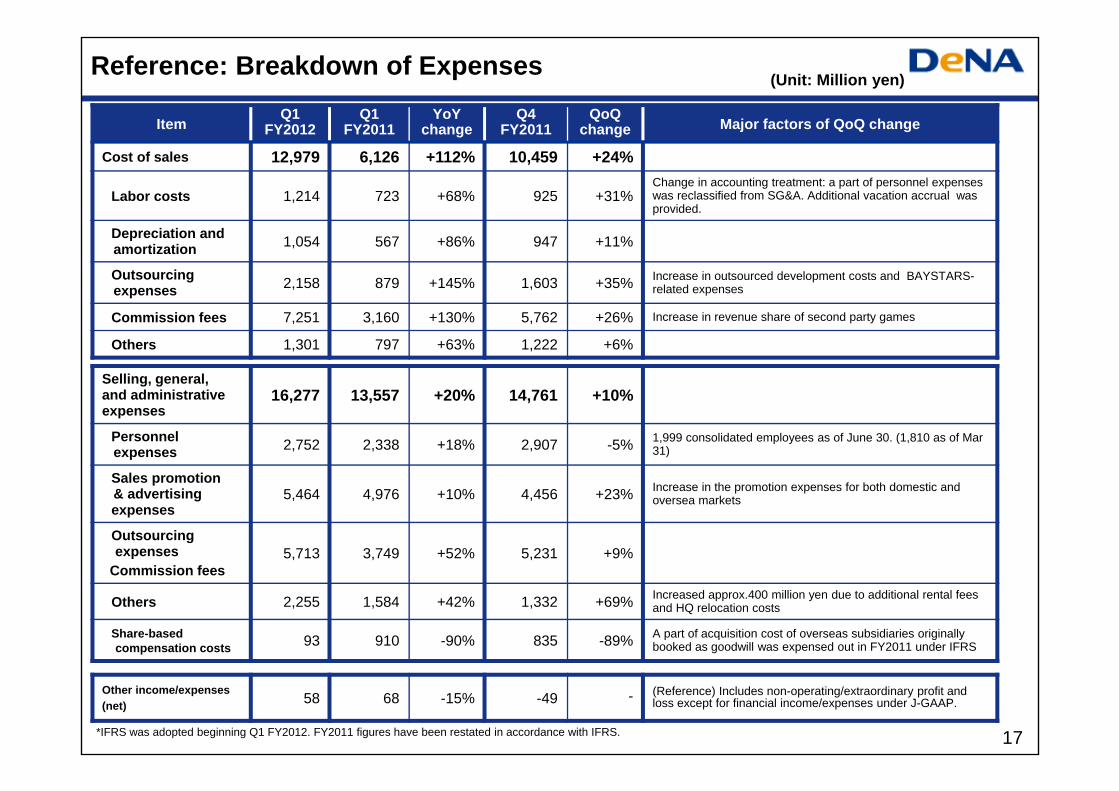
Selling, general,and administrativeexpenses
16,277 13,557 +20% 14,761 +10%
Personnelexpenses 2,752 2,338 +18% 2,907 -5% 1,999 consolidated employees as of June 30. (1,810 as of Mar
31)
Sales promotion& advertisingexpenses
5,464 4,976 +10% 4,456 +23% Increase in the promotion expenses for both domestic and oversea markets
Outsourcingexpenses
Commission fees5,713 3,749 +52% 5,231 +9%
Others 2,255 1,584 +42% 1,332 +69% Increased approx.400 million yen due to additional rental feesand HQ relocation costs
Share-based compensation costs 93 910 -90% 835 -89% A part of acquisition cost of overseas subsidiaries originally
booked as goodwill was expensed out in FY2011 under IFRS
Other income/expenses (net) 58 68 -15% -49 - (Reference) Includes non-operating/extraordinary profit and
loss except for financial income/expenses under J-GAAP.
Item Q1 FY2012
Q1 FY2011
YoYchange
Q4 FY2011
QoQchange Major factors of QoQ change
Cost of sales 12,979 6,126 +112% 10,459 +24%
Labor costs 1,214 723 +68% 925 +31%Change in accounting treatment: a part of personnel expenses was reclassified from SG&A. Additional vacation accrual was provided.
Depreciation and amortization 1,054 567 +86% 947 +11%
Outsourcing expenses 2,158 879 +145% 1,603 +35% Increase in outsourced development costs and BAYSTARS-
related expenses
Commission fees 7,251 3,160 +130% 5,762 +26% Increase in revenue share of second party games
Others 1,301 797 +63% 1,222 +6%
Reference: Breakdown of Expenses
17
(Unit: Million yen)
*IFRS was adopted beginning Q1 FY2012. FY2011 figures have been restated in accordance with IFRS.
18
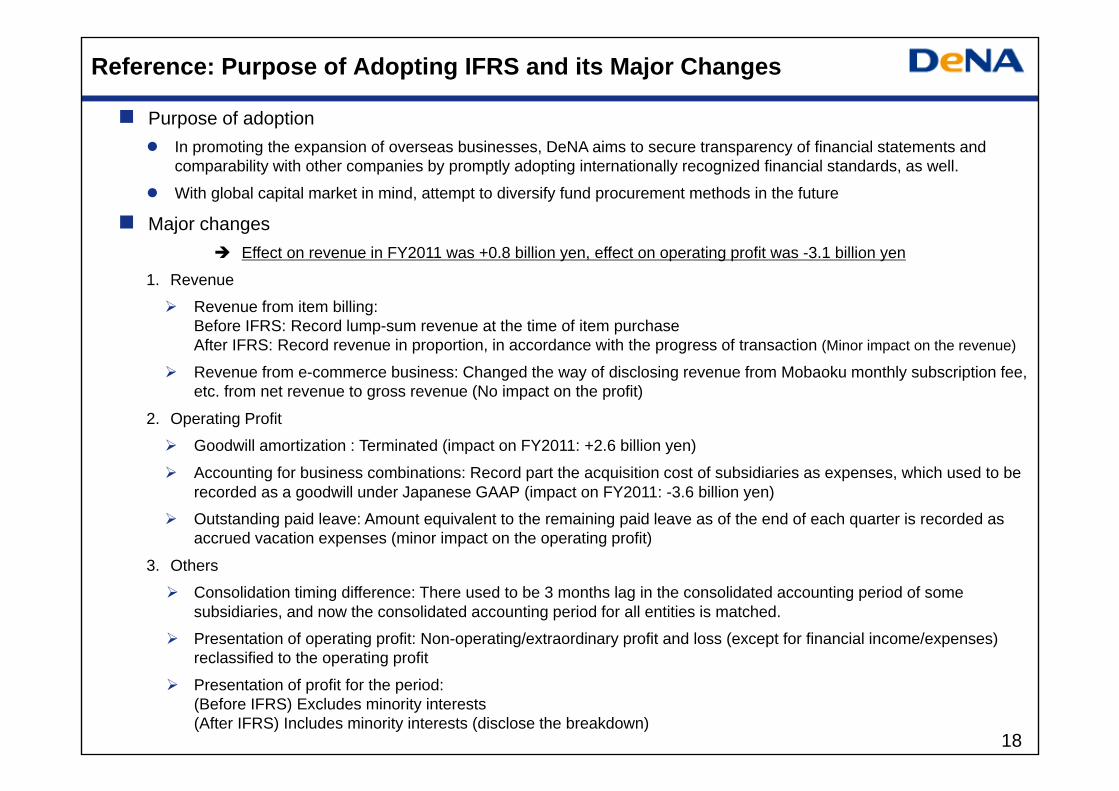
Reference: Purpose of Adopting IFRS and its Major Changes
Purpose of adoption In promoting the expansion of overseas businesses, DeNA aims to secure transparency of financial statements and
comparability with other companies by promptly adopting internationally recognized financial standards, as well.
With global capital market in mind, attempt to diversify fund procurement methods in the future
Major changes Effect on revenue in FY2011 was +0.8 billion yen, effect on operating profit was -3.1 billion yen
1. Revenue
Revenue from item billing:Before IFRS: Record lump-sum revenue at the time of item purchaseAfter IFRS: Record revenue in proportion, in accordance with the progress of transaction (Minor impact on the revenue)
Revenue from e-commerce business: Changed the way of disclosing revenue from Mobaoku monthly subscription fee, etc. from net revenue to gross revenue (No impact on the profit)
2. Operating Profit
Goodwill amortization : Terminated (impact on FY2011: +2.6 billion yen)
Accounting for business combinations: Record part the acquisition cost of subsidiaries as expenses, which used to be recorded as a goodwill under Japanese GAAP (impact on FY2011: -3.6 billion yen)
Outstanding paid leave: Amount equivalent to the remaining paid leave as of the end of each quarter is recorded as accrued vacation expenses (minor impact on the operating profit)
3. Others
Consolidation timing difference: There used to be 3 months lag in the consolidated accounting period of some subsidiaries, and now the consolidated accounting period for all entities is matched.
Presentation of operating profit: Non-operating/extraordinary profit and loss (except for financial income/expenses) reclassified to the operating profit
Presentation of profit for the period: (Before IFRS) Excludes minority interests(After IFRS) Includes minority interests (disclose the breakdown)
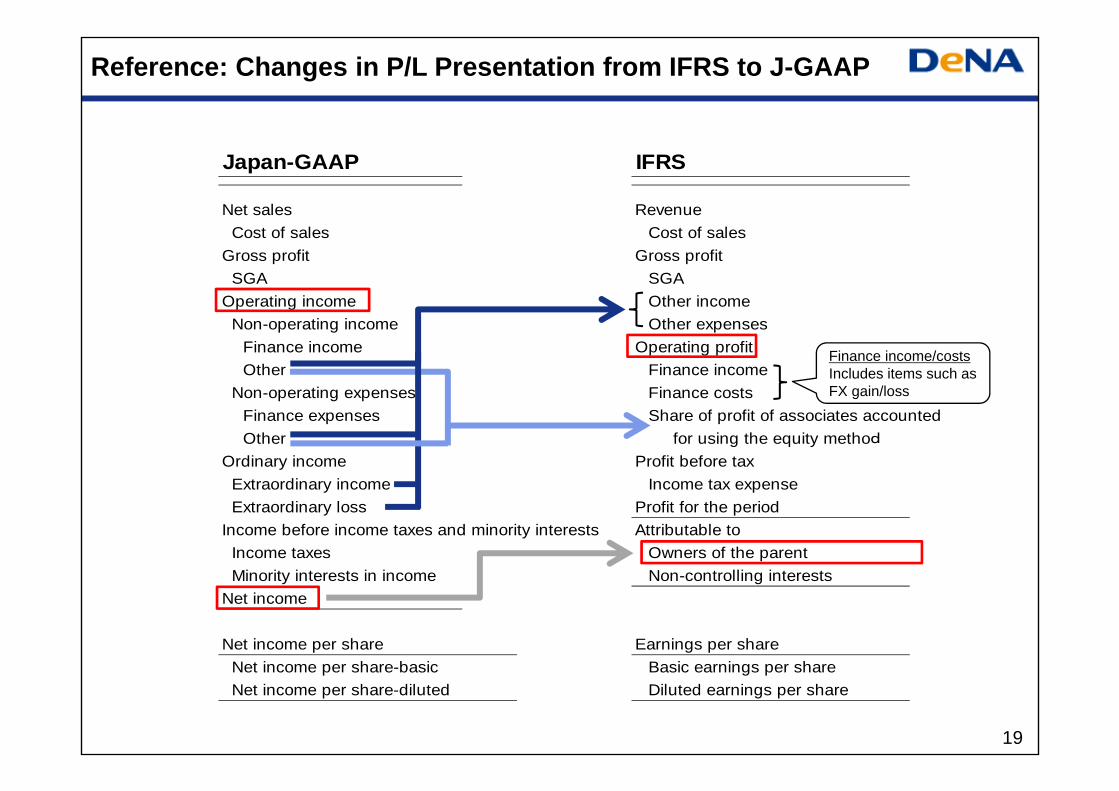
Japan-GAAP IFRS
Net sales RevenueCost of sales Cost of sales
Gross profit Gross profitSGA SGA
Operating income Other incomeNon-operating income Other expenses
Finance income Operating profitOther Finance income
Non-operating expenses Finance costsFinance expenses Share of profit of associates accountedOther for using the equity method
Ordinary income Profit before taxExtraordinary income Income tax expenseExtraordinary loss Profit for the period
Income before income taxes and minority interests Attributable toIncome taxes Owners of the parentMinority interests in income Non-controlling interests
Net income
Net income per share Earnings per share Net income per share-basic Basic earnings per shareNet income per share-diluted Diluted earnings per share
Finance income/costsIncludes items such as FX gain/loss
Reference: Changes in P/L Presentation from IFRS to J-GAAP
19

Above 30
20-29
10-19
20
43.07 million
Men60%
Women40%
First- andsecond-party
Third-party
Feature phone 48 917
PC 7 202
Smartphone(browser-based) 35 355
Smartphone(app-based) 16 42
26 20 18
4238 38
3242 44
Registered Users
As of Jun 30, 2012
Registered Users by Gender
As of 06/30/10
As of 06/30/11
As of 06/30/12
Breakdown by RegisteredUser Age Group (%)
Number of Mobage Social Games
Reference: Mobage Japan

DeNA Co., Ltd.
The forecast data contained within this presentation and these presentation materials have been determined based on information available to date, but may contain an element of uncertainty.Please be aware that the actual performance data and similar information are subject to influence from diverse factors, and may differ from the forecasts presented herein.
Recommended