Delivering High-Performance Ecommerce with Magento
Commerce Cloud
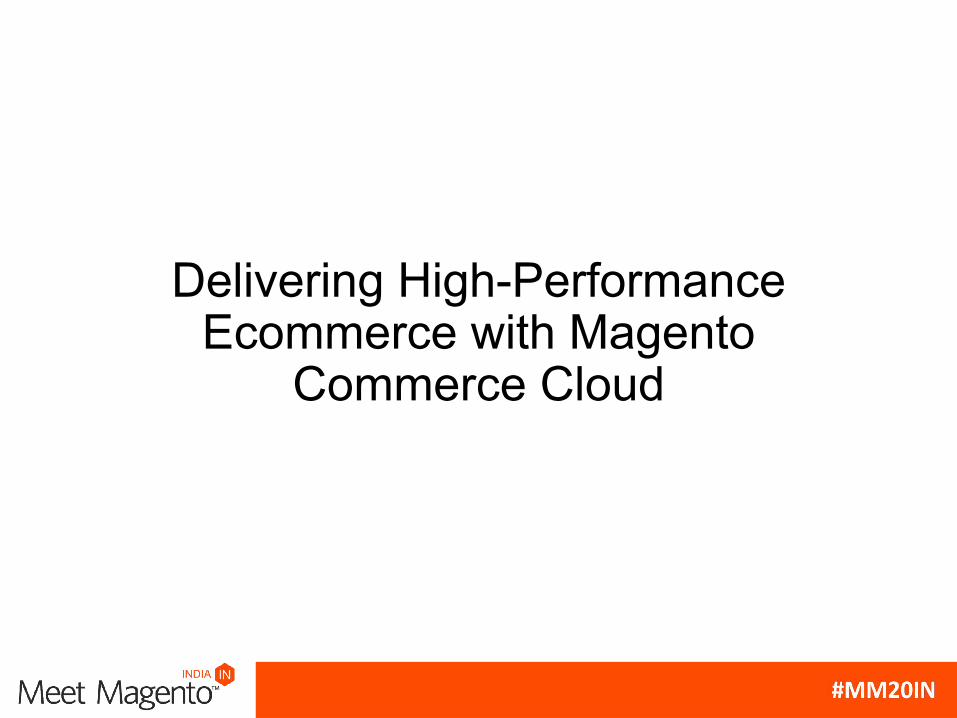
Source Mash | WHO WE ARE
Magento Certified Developers
Projects and Team
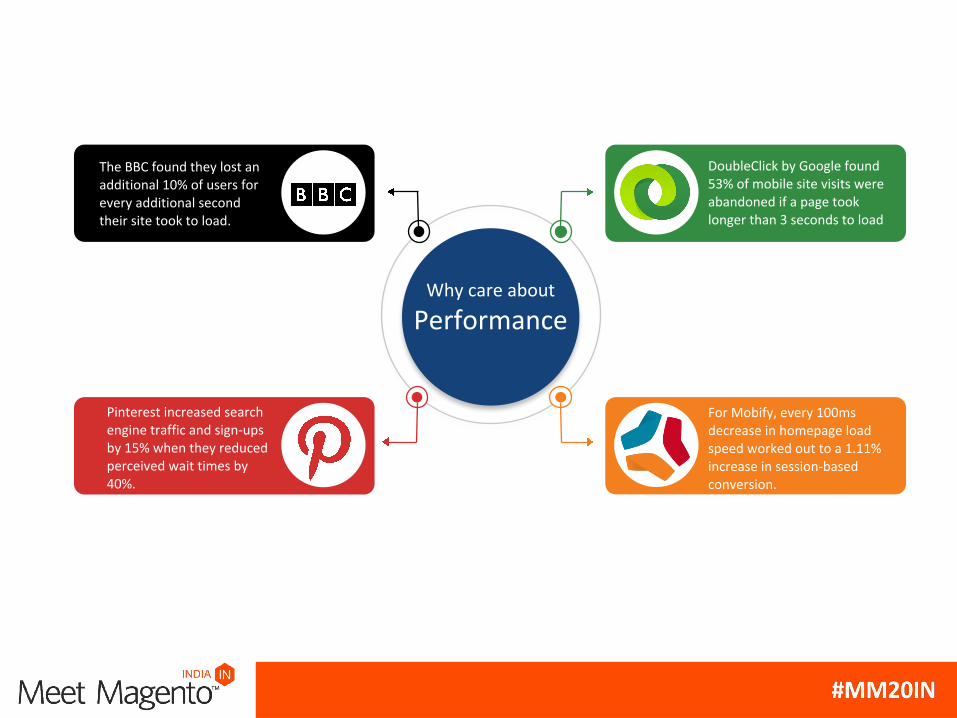
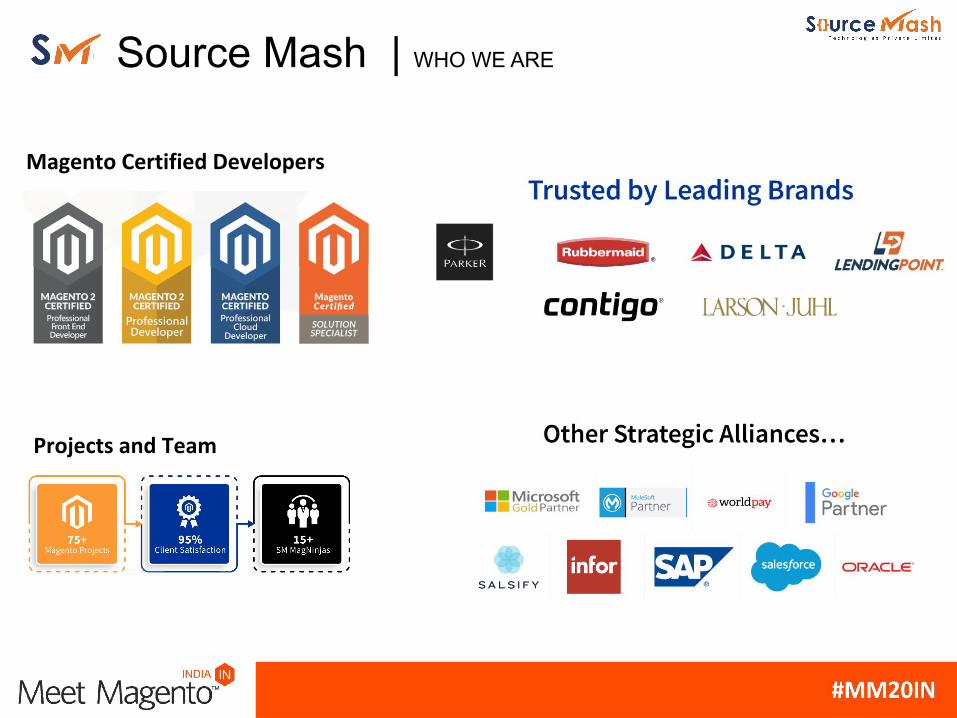
The BBC found they lost an additional 10% of users for every additional second their site took to load.
Pinterest increased search engine traffic and sign-ups by 15% when they reduced perceived wait times by 40%.
DoubleClick by Google found 53% of mobile site visits were abandoned if a page took longer than 3 seconds to load
For Mobify, every 100ms decrease in homepage load speed worked out to a 1.11% increase in session-based conversion.
Why care about
Performance
Agenda
• Featured tools provided by Magento Commerce Cloud to facilitate Performance Driven Development.
• Performance monitoring and analysis with New Relic.
• Analyzing issues and bottlenecks with the help of Blackfire.
• Delivering performance-driven development with Blackfire.
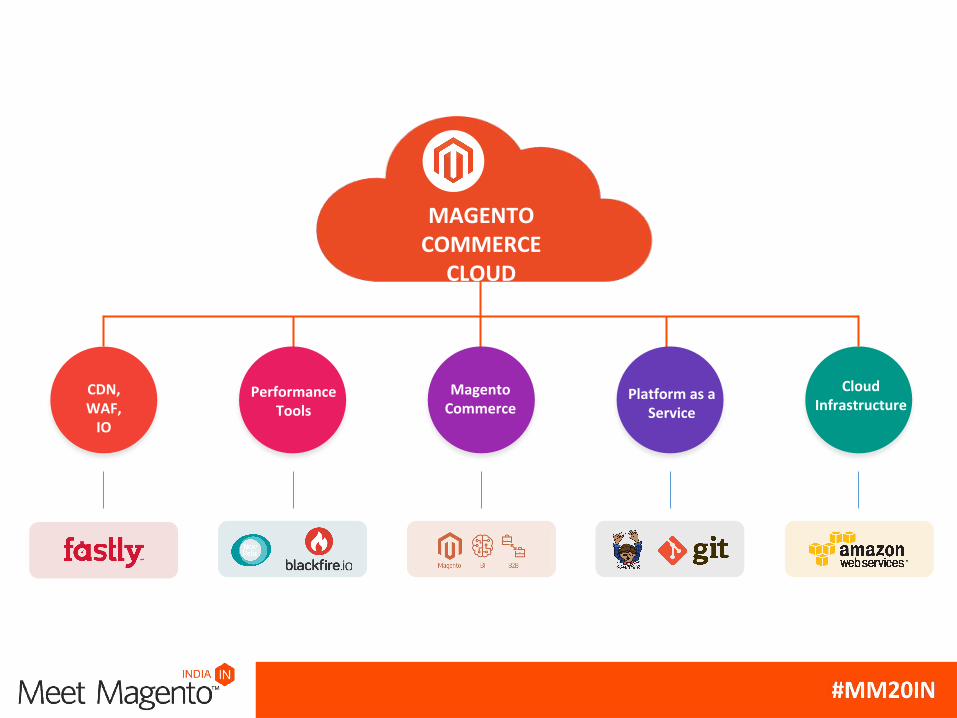
MAGENTOCOMMERCE
CLOUD
CDN,WAF,
IO
PerformanceTools
MagentoCommerce
Platform as aService
CloudInfrastructure
Scalability
Multi-tenantSaas artchitecture
Auto upgradeSecurity
APMNew Relic
SERVERSNew Relic
PLUGINS BROWSERNew Relic
SYNTHETICSNew Relic
MOBILENew Relic
ALERTS DASHBOARDS API EXCHANGE
INSIGHTS
New Relic
PLATFORMSOFTWARE ANALYTICSNew Relic.
New Relic
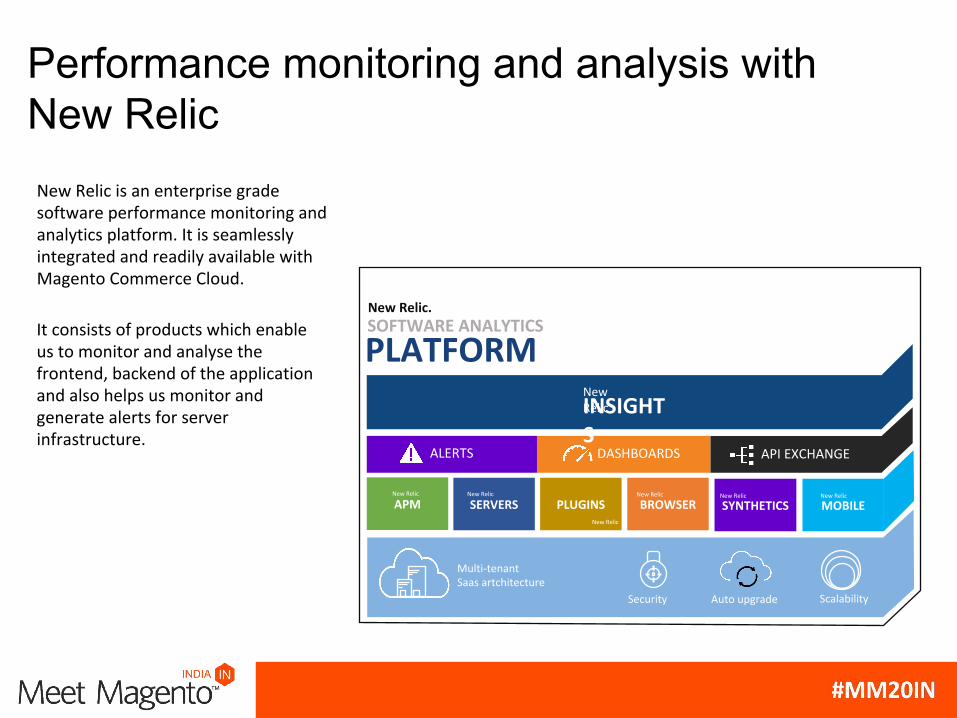
Performance monitoring and analysis with New Relic
New Relic is an enterprise grade software performance monitoring and analytics platform. It is seamlessly integrated and readily available with Magento Commerce Cloud.
It consists of products which enable us to monitor and analyse the frontend, backend of the application and also helps us monitor and generate alerts for server infrastructure.
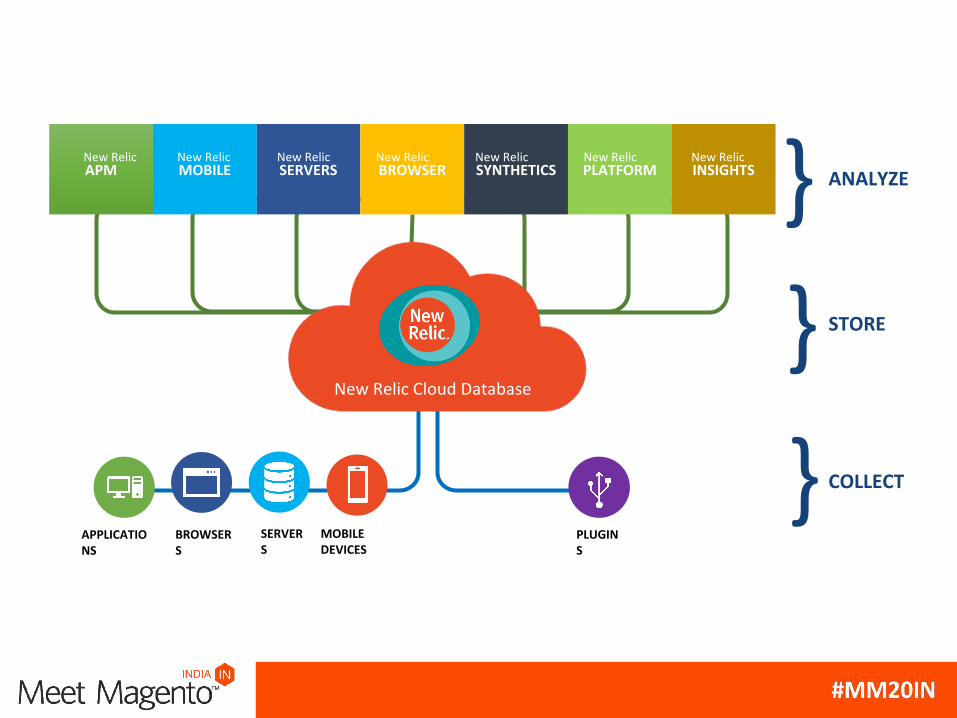
MOBILE DEVICES
SERVERS
BROWSERS
APPLICATIONS
PLUGINS
SERVERSAPM MOBILE BROWSER SYNTHETICS PLATFORM INSIGHTS
New Relic Cloud Database
ANALYZE
STORE
COLLECT
}
}
}New Relic New Relic New Relic New Relic New Relic New Relic New Relic
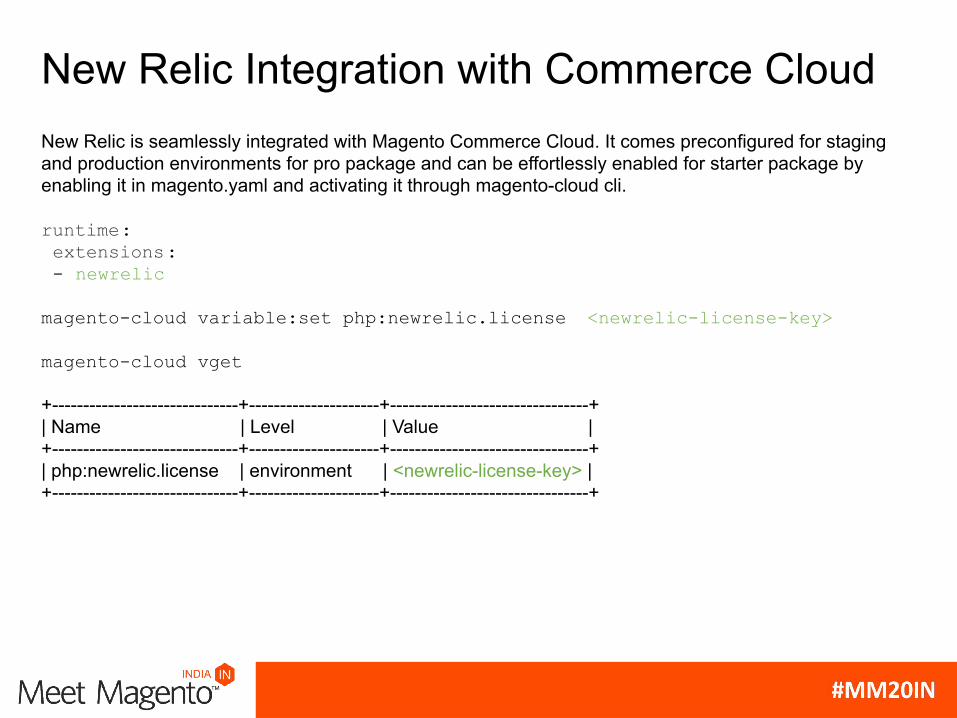
New Relic is seamlessly integrated with Magento Commerce Cloud. It comes preconfigured for staging and production environments for pro package and can be effortlessly enabled for starter package by enabling it in magento.yaml and activating it through magento-cloud cli.
runtime: extensions: - newrelic
magento-cloud variable:set php:newrelic.license <newrelic-license-key>
magento-cloud vget
+------------------------------+---------------------+--------------------------------+| Name | Level | Value |+------------------------------+---------------------+--------------------------------+| php:newrelic.license | environment | <newrelic-license-key> |+------------------------------+---------------------+--------------------------------+
New Relic Integration with Commerce Cloud
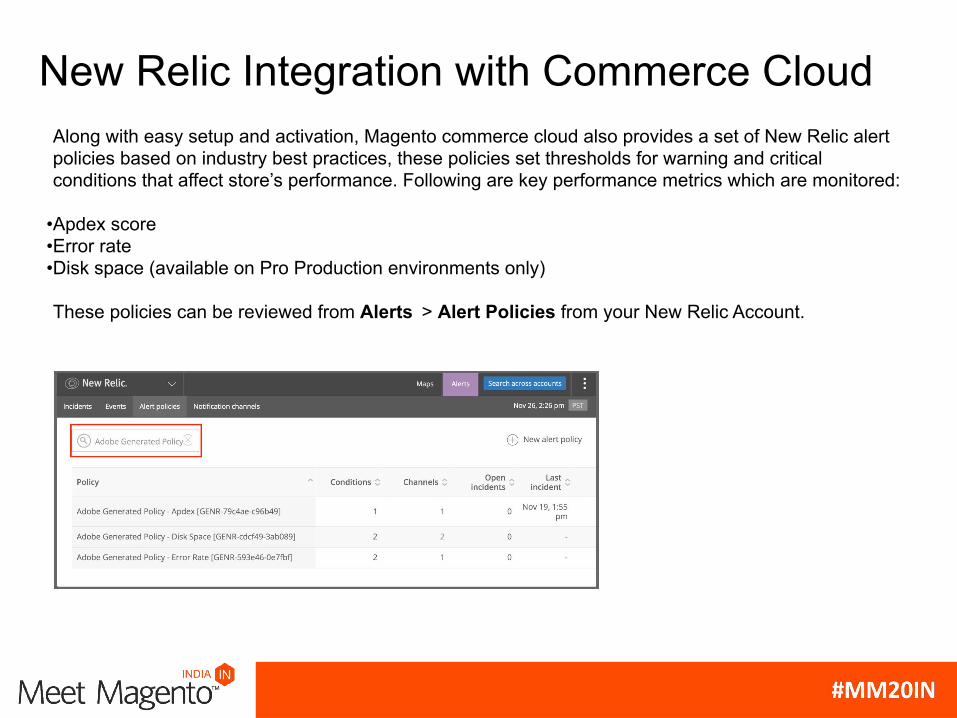
Along with easy setup and activation, Magento commerce cloud also provides a set of New Relic alert policies based on industry best practices, these policies set thresholds for warning and critical conditions that affect store’s performance. Following are key performance metrics which are monitored:
•Apdex score•Error rate•Disk space (available on Pro Production environments only)
These policies can be reviewed from Alerts > Alert Policies from your New Relic Account.
New Relic Integration with Commerce Cloud
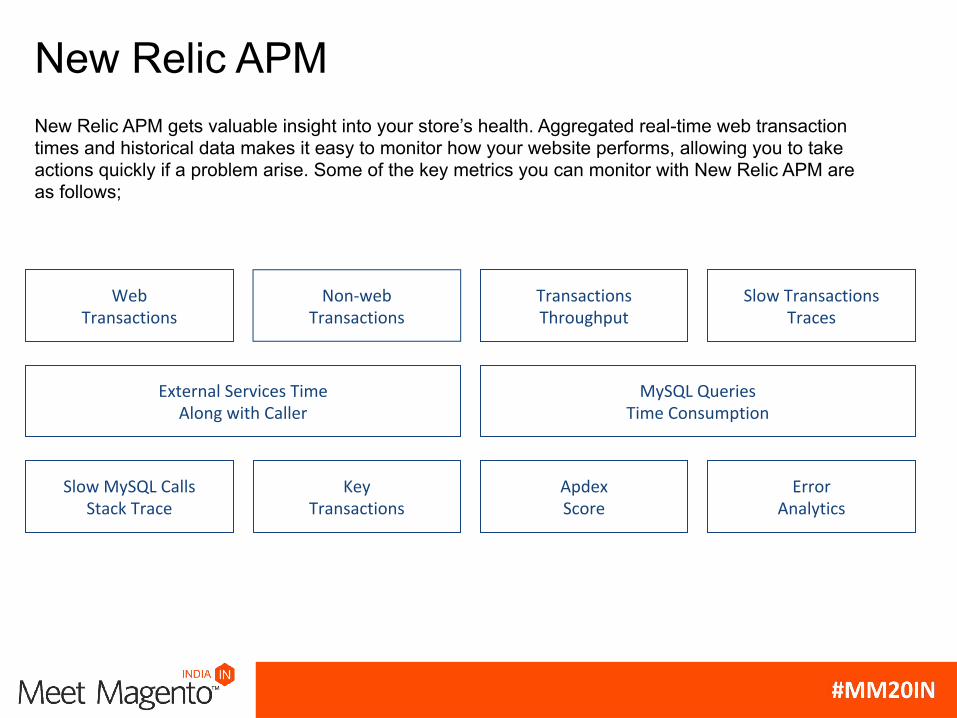
New Relic APM gets valuable insight into your store’s health. Aggregated real-time web transaction times and historical data makes it easy to monitor how your website performs, allowing you to take actions quickly if a problem arise. Some of the key metrics you can monitor with New Relic APM are as follows;
WebTransactions
Non-webTransactions
Transactions Throughput
Slow TransactionsTraces
Slow MySQL CallsStack Trace
KeyTransactions
ApdexScore
ErrorAnalytics
External Services TimeAlong with Caller
MySQL QueriesTime Consumption
New Relic APM
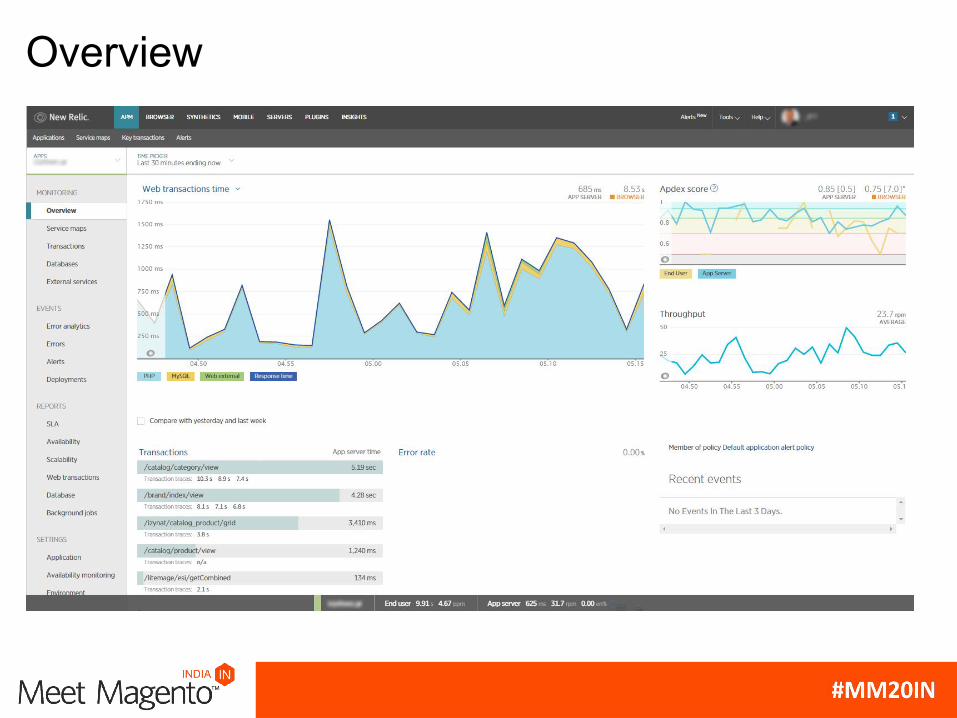
Overview
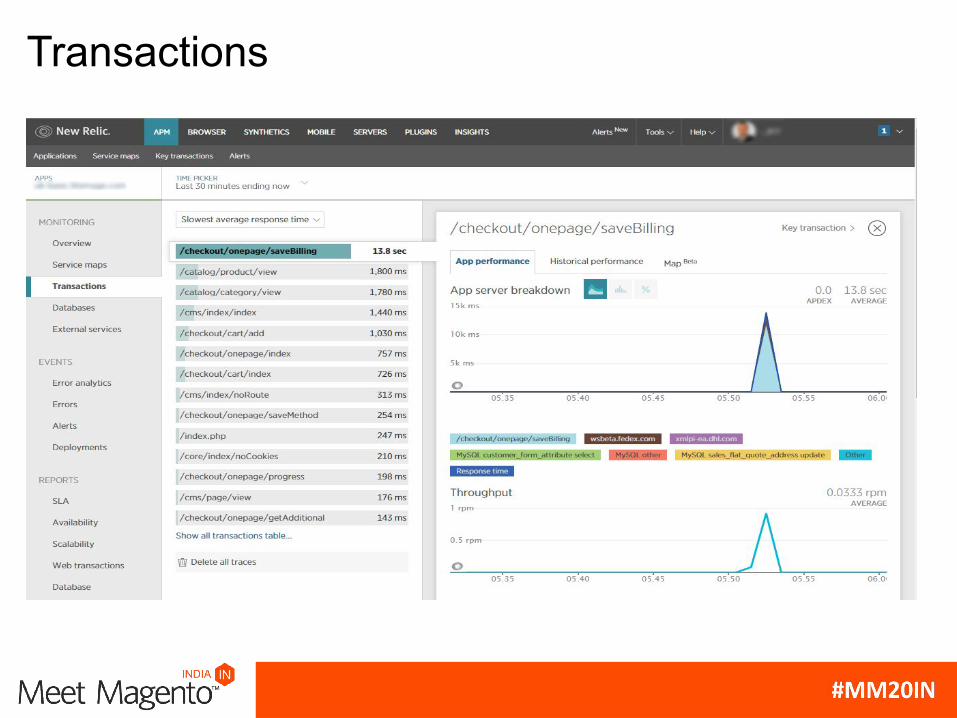
Transactions
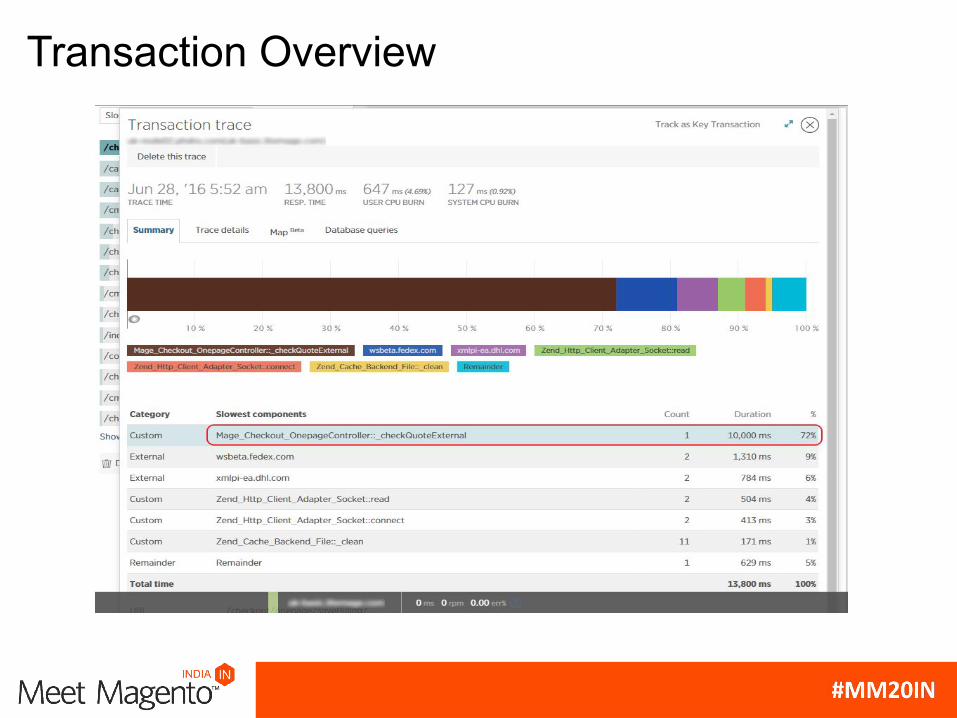
Transaction Overview
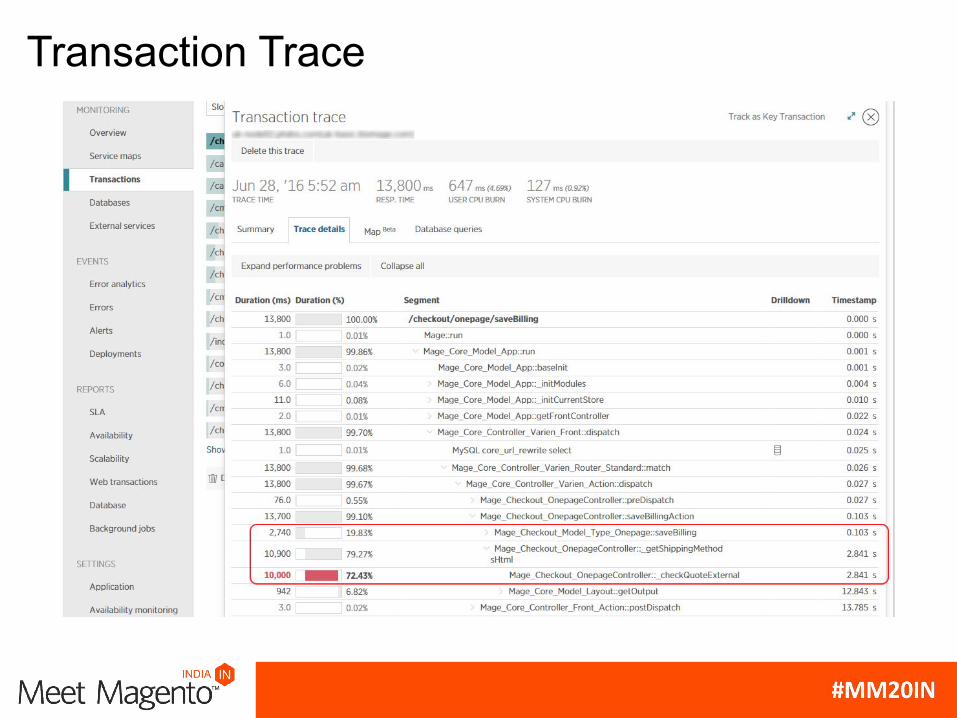
Transaction Trace
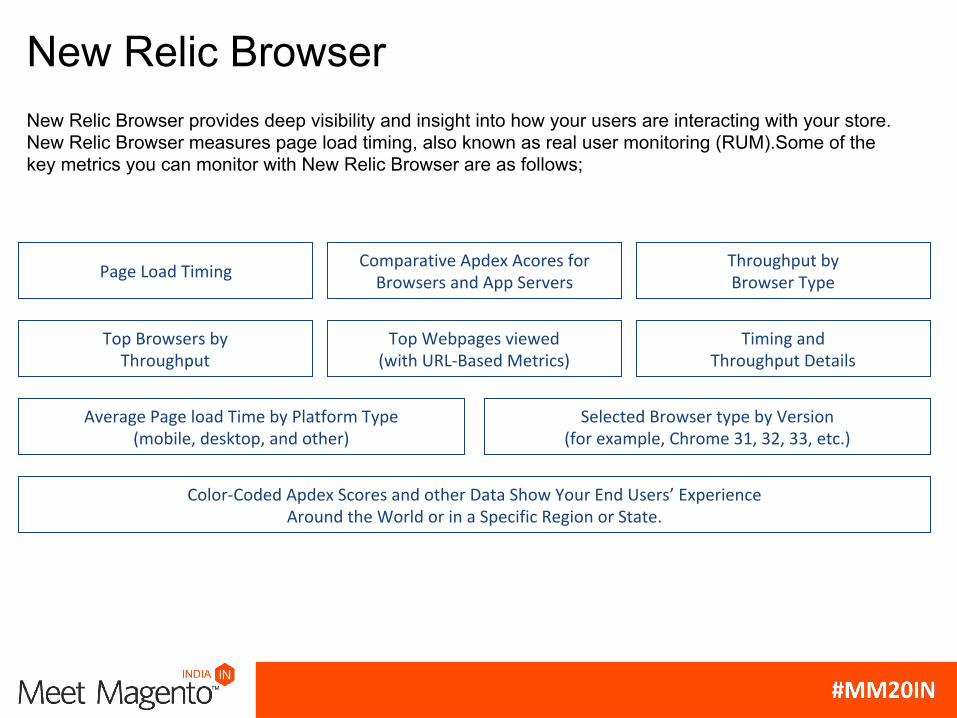
New Relic BrowserNew Relic Browser provides deep visibility and insight into how your users are interacting with your store. New Relic Browser measures page load timing, also known as real user monitoring (RUM).Some of the key metrics you can monitor with New Relic Browser are as follows;
Page Load TimingComparative Apdex Acores for
Browsers and App ServersThroughput byBrowser Type
Top Browsers by Throughput
Top Webpages viewed(with URL-Based Metrics)
Timing andThroughput Details
Average Page load Time by Platform Type(mobile, desktop, and other)
Selected Browser type by Version(for example, Chrome 31, 32, 33, etc.)
Color-Coded Apdex Scores and other Data Show Your End Users’ ExperienceAround the World or in a Specific Region or State.
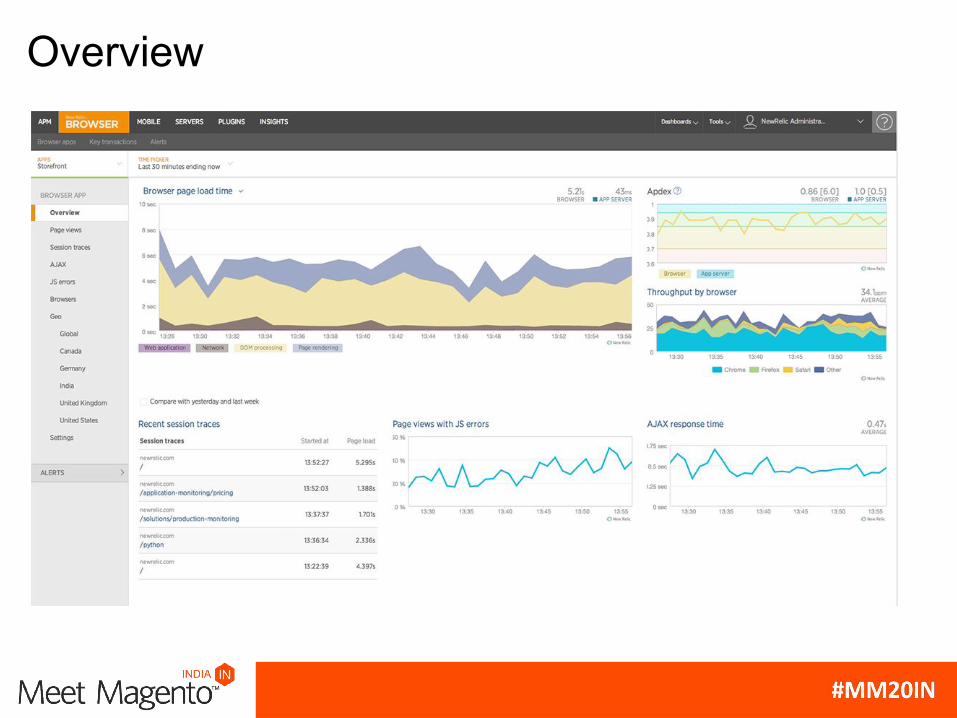
Overview
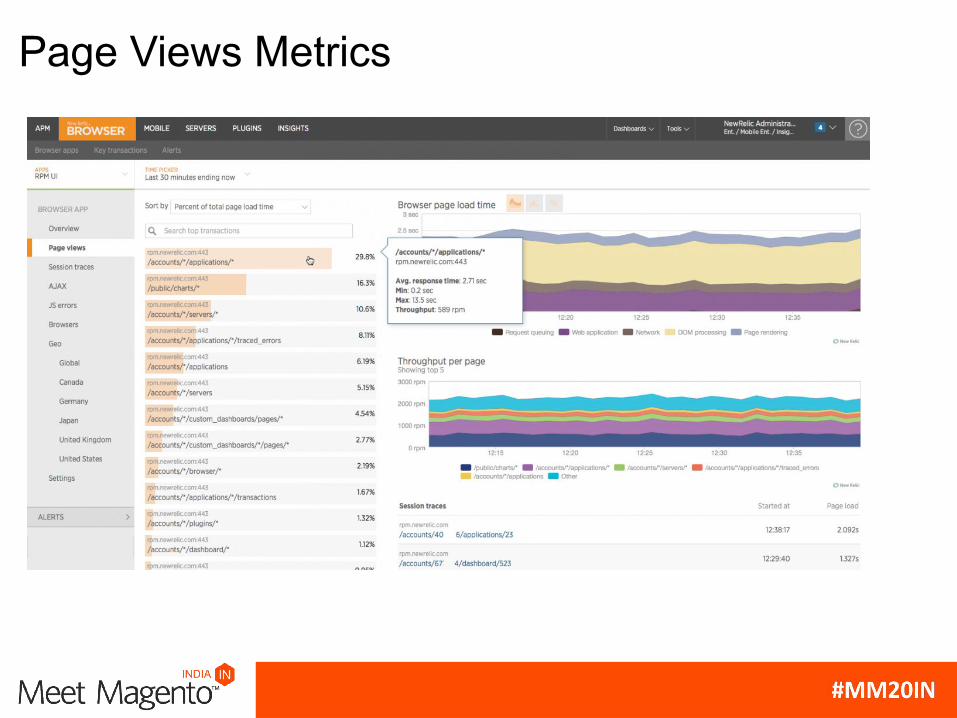
Page Views Metrics
BlackfireBlackfire is a PHP profiler and automated performance testing tool that can be used in the development, Integration, Staging, and Production environments. It instruments PHP applications to gather data about consumed server resources and provides targeted granular performance analytics. Following are few features of blackfire ;
•It gathers profiling data on Time, CPU, I/O Wait, Memory, Network calls, HTTP Requests and SQL Requests.
•Profiling is done on demand. The only request showing overhead is the one being profiled, only for the profiling session. No other session or request is impacted. You can safely use Blackfire on production servers.
•Profiling can be requested either via our CLI utility, or with an intuitive Companion Extension.
•It provides call graphs ordered by wall time and several other metrics which helps us identify bottlenecks effortlessly.
•Compare two different profiles to measure which metric has improved by what amount.
•Write performance test cases and scenarios and integration with deployment cycles.
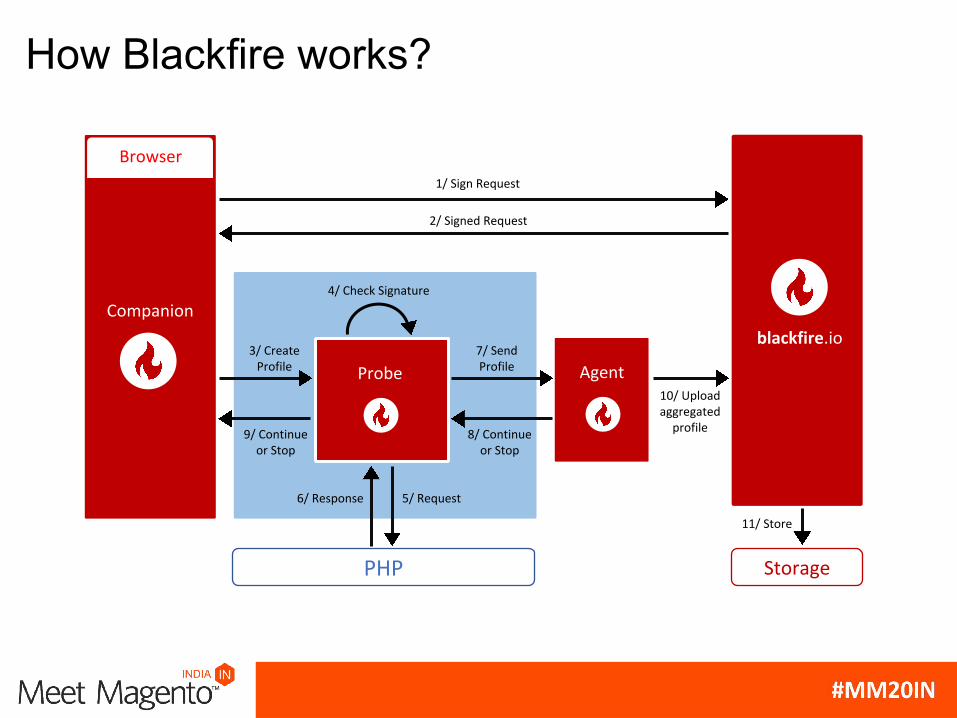
How Blackfire works?
1/ Sign Request
2/ Signed Request
4/ Check Signature
7/ SendProfile
3/ CreateProfile
9/ Continueor Stop
8/ Continueor Stop
6/ Response 5/ Request
Probe
Companion
Browser
blackfire.io
10/ Uploadaggregated
profile
11/ Store
StoragePHP
Agent
Blackfire Magento Commerce Cloud Integration
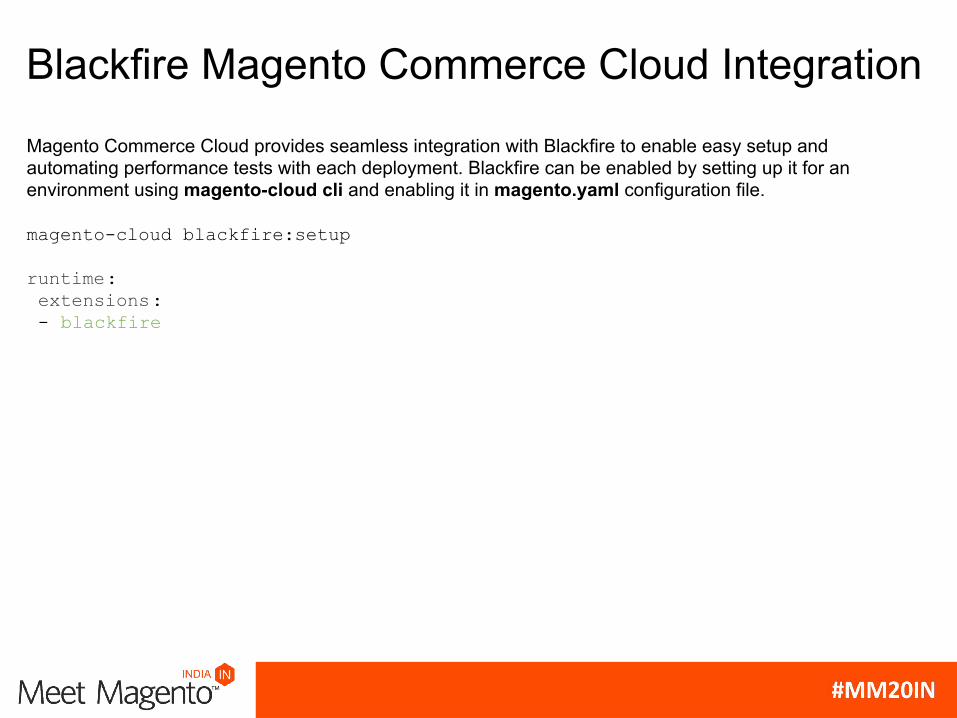
Magento Commerce Cloud provides seamless integration with Blackfire to enable easy setup and automating performance tests with each deployment. Blackfire can be enabled by setting up it for an environment using magento-cloud cli and enabling it in magento.yaml configuration file.
magento-cloud blackfire:setup
runtime: extensions: - blackfire
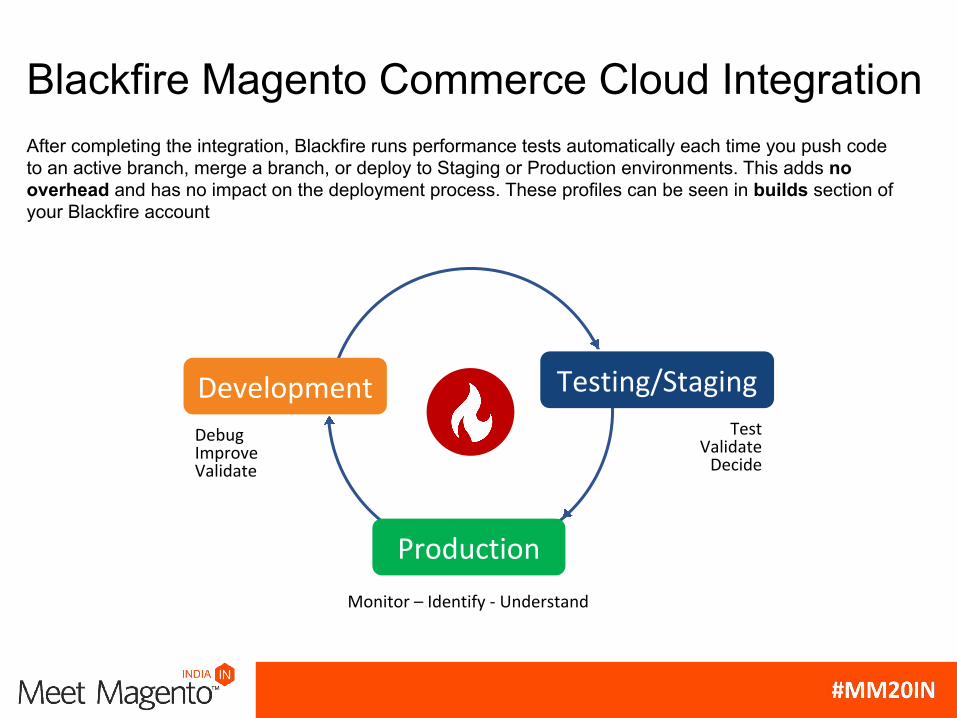
Blackfire Magento Commerce Cloud IntegrationAfter completing the integration, Blackfire runs performance tests automatically each time you push code to an active branch, merge a branch, or deploy to Staging or Production environments. This adds no overhead and has no impact on the deployment process. These profiles can be seen in builds section of your Blackfire account
Testing/Staging
Production
Development
DebugImproveValidate
Monitor – Identify - Understand
TestValidate
Decide
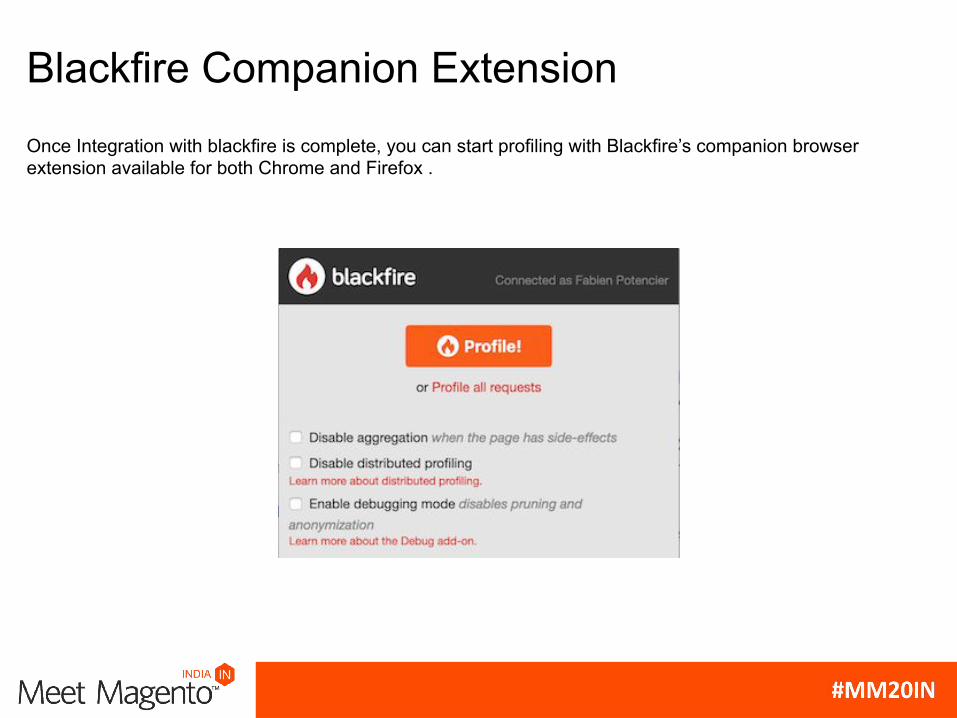
Blackfire Companion ExtensionOnce Integration with blackfire is complete, you can start profiling with Blackfire’s companion browser extension available for both Chrome and Firefox .
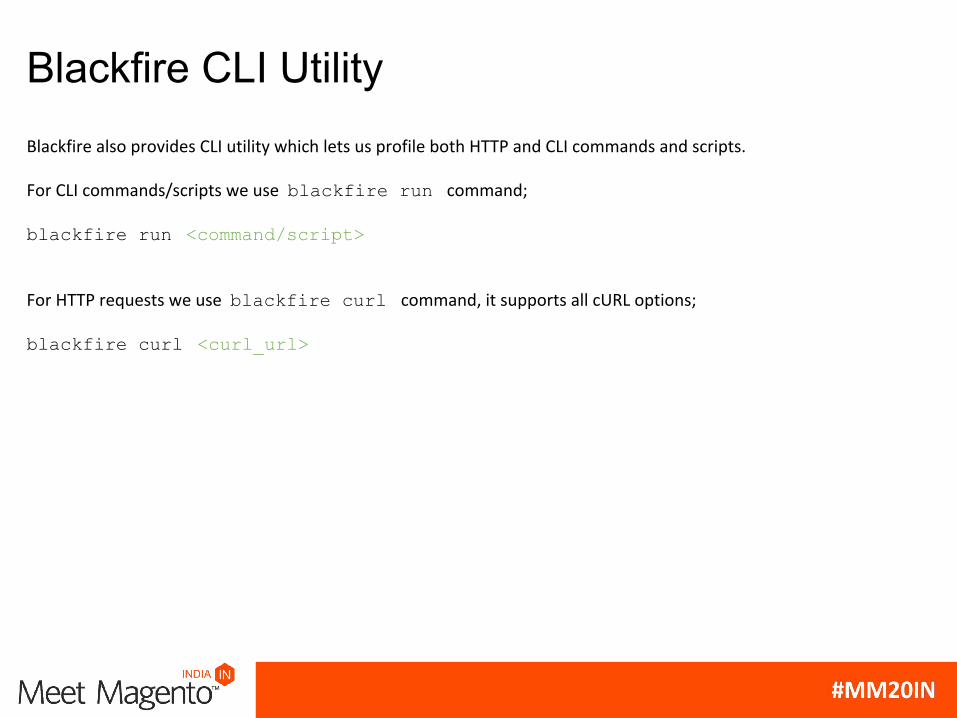
Blackfire CLI UtilityBlackfire also provides CLI utility which lets us profile both HTTP and CLI commands and scripts.
For CLI commands/scripts we use blackfire run command;
blackfire run <command/script>
For HTTP requests we use blackfire curl command, it supports all cURL options;
blackfire curl <curl_url>
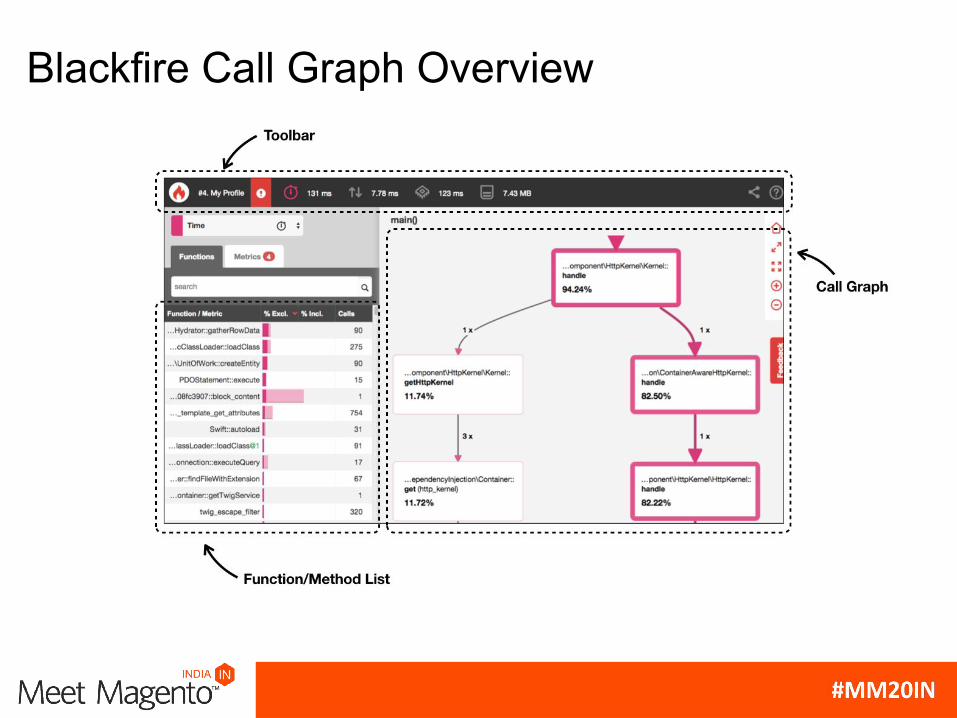
Blackfire Call Graph Overview
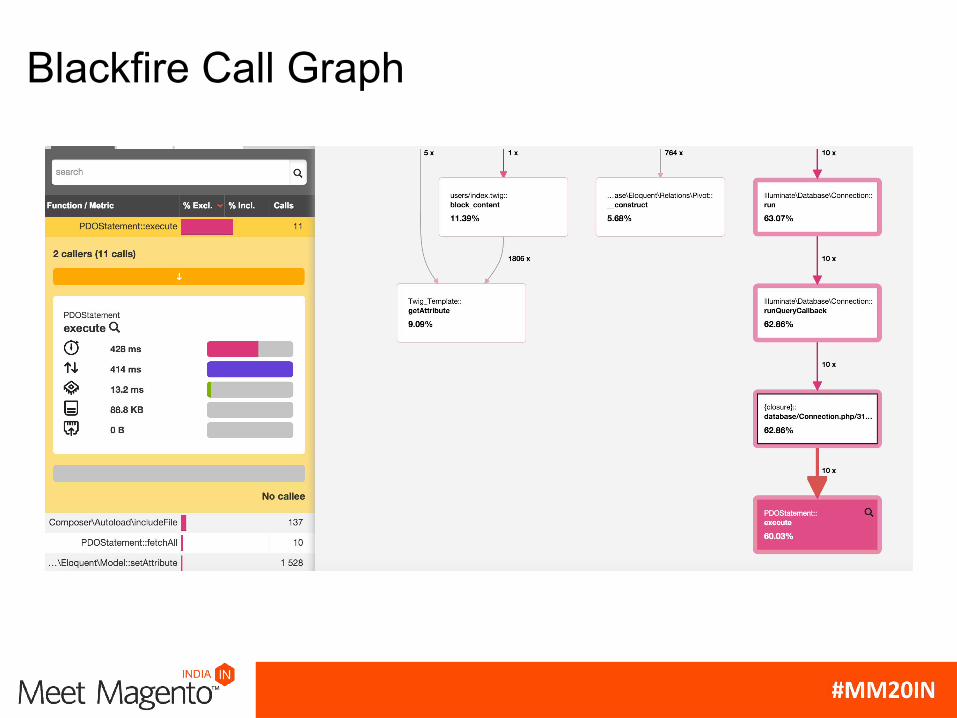
Blackfire Call Graph
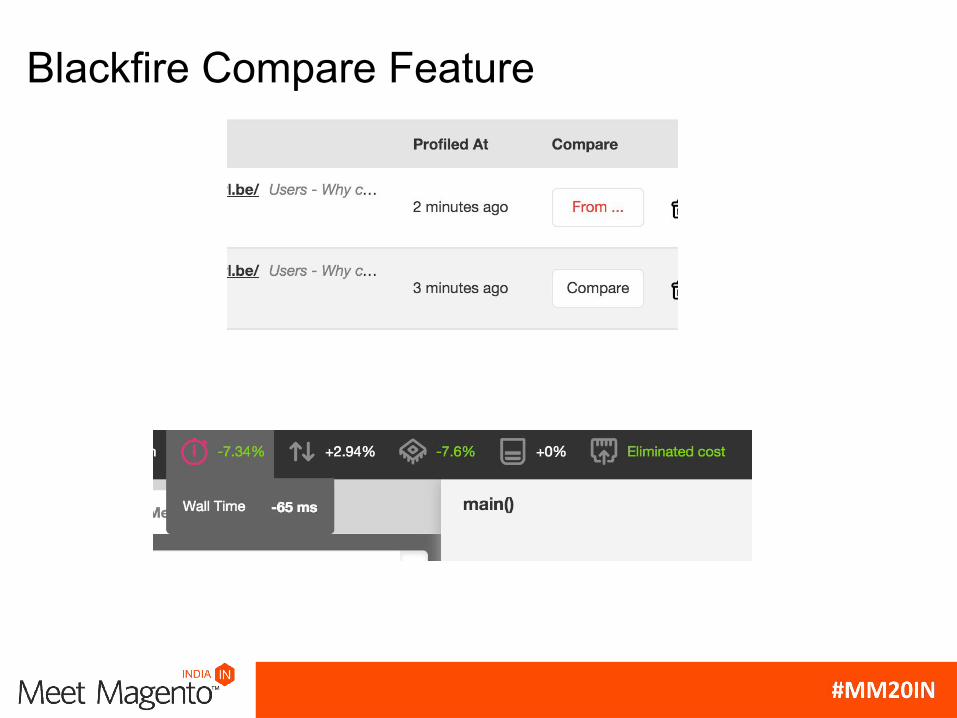
Blackfire Compare Feature
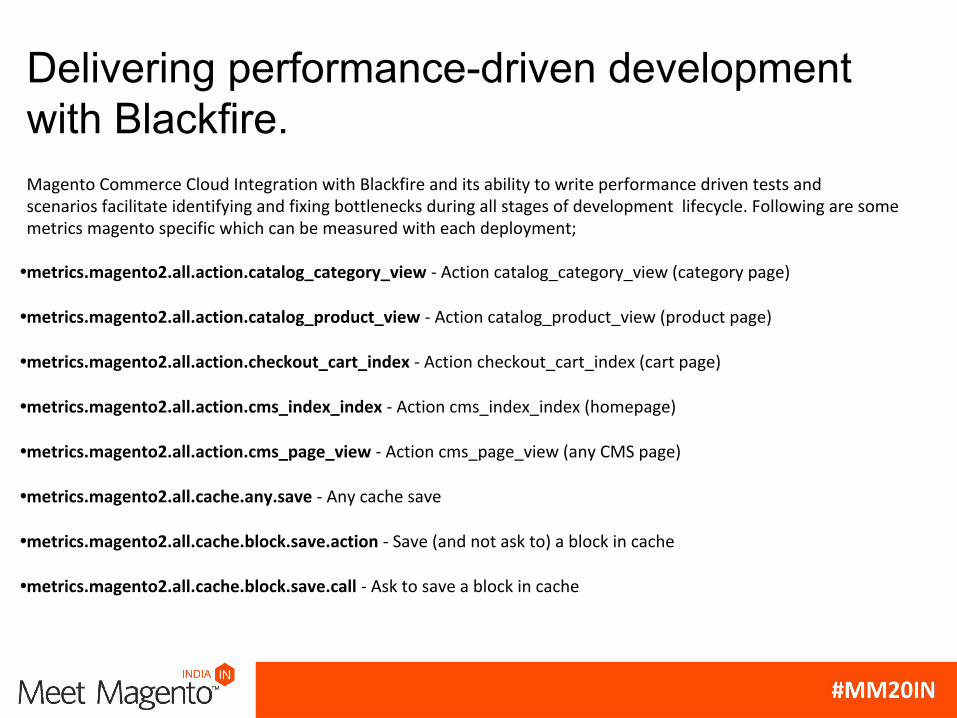
Delivering performance-driven development with Blackfire.Magento Commerce Cloud Integration with Blackfire and its ability to write performance driven tests and scenarios facilitate identifying and fixing bottlenecks during all stages of development lifecycle. Following are some metrics magento specific which can be measured with each deployment;
•metrics.magento2.all.action.catalog_category_view - Action catalog_category_view (category page)
•metrics.magento2.all.action.catalog_product_view - Action catalog_product_view (product page)
•metrics.magento2.all.action.checkout_cart_index - Action checkout_cart_index (cart page)
•metrics.magento2.all.action.cms_index_index - Action cms_index_index (homepage)
•metrics.magento2.all.action.cms_page_view - Action cms_page_view (any CMS page)
•metrics.magento2.all.cache.any.save - Any cache save
•metrics.magento2.all.cache.block.save.action - Save (and not ask to) a block in cache
•metrics.magento2.all.cache.block.save.call - Ask to save a block in cache
Writing Performance Test with Blackfire
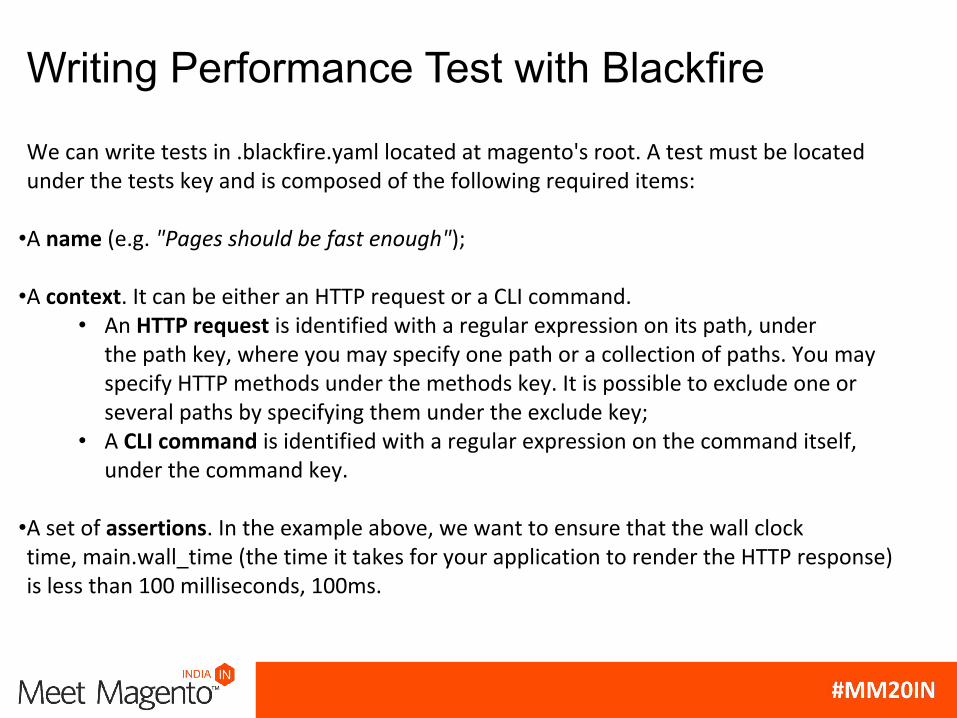
We can write tests in .blackfire.yaml located at magento's root. A test must be located under the tests key and is composed of the following required items:
•A name (e.g. "Pages should be fast enough");
•A context. It can be either an HTTP request or a CLI command.• An HTTP request is identified with a regular expression on its path, under
the path key, where you may specify one path or a collection of paths. You may specify HTTP methods under the methods key. It is possible to exclude one or several paths by specifying them under the exclude key;
• A CLI command is identified with a regular expression on the command itself, under the command key.
•A set of assertions. In the example above, we want to ensure that the wall clock time, main.wall_time (the time it takes for your application to render the HTTP response) is less than 100 milliseconds, 100ms.
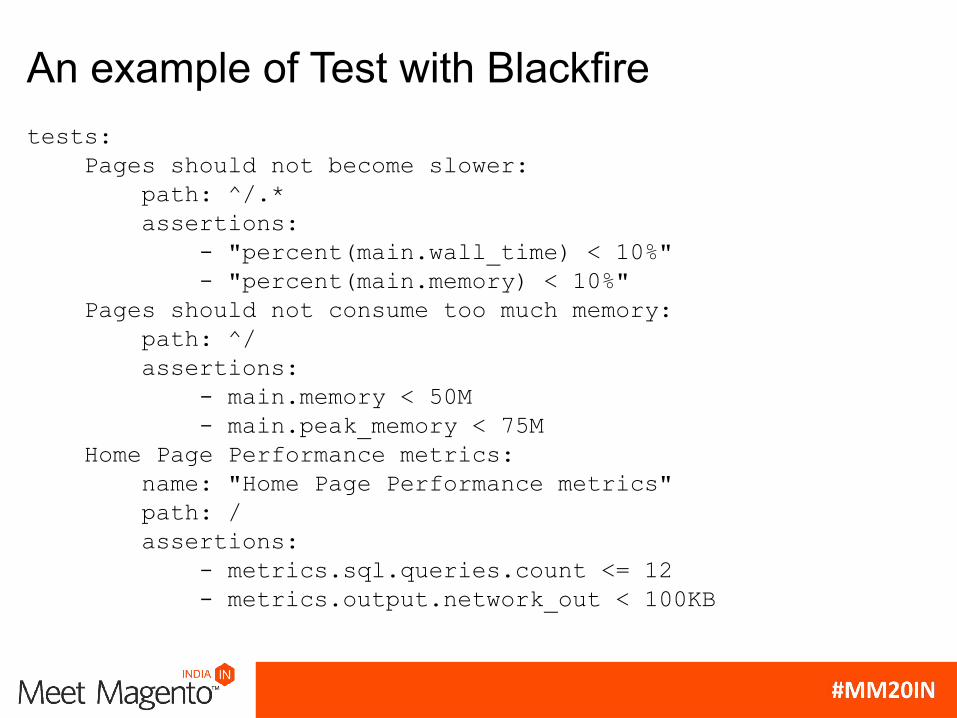
An example of Test with Blackfiretests: Pages should not become slower: path: ^/.* assertions: - "percent(main.wall_time) < 10%" - "percent(main.memory) < 10%" Pages should not consume too much memory: path: ^/ assertions: - main.memory < 50M - main.peak_memory < 75M Home Page Performance metrics: name: "Home Page Performance metrics" path: / assertions: - metrics.sql.queries.count <= 12 - metrics.output.network_out < 100KB
Writing scenarios with BlackfireBlackfire scenarios provides a powerful way to test your application on a regular basis, for e.g. Magento Commerce Cloud blackfire integration lets run scenerios automatically you deploy your code on a any cloud environment, or when you create a pull-request to add a new feature or fix a bug. The idea is to assess the performance of your code and to check its behavior.
The scenarios are run by the Blackfire Player. It provides a nice DSL to crawl HTTP services, assert responses, and extract data from HTML/XML/JSON responses.It is installed as a separate CLI utility.
Build Reports have an overall status (pass or fail). The availability of a new report and its status can be sent as a notification to users with a wide variety of configurable Notification Channels.
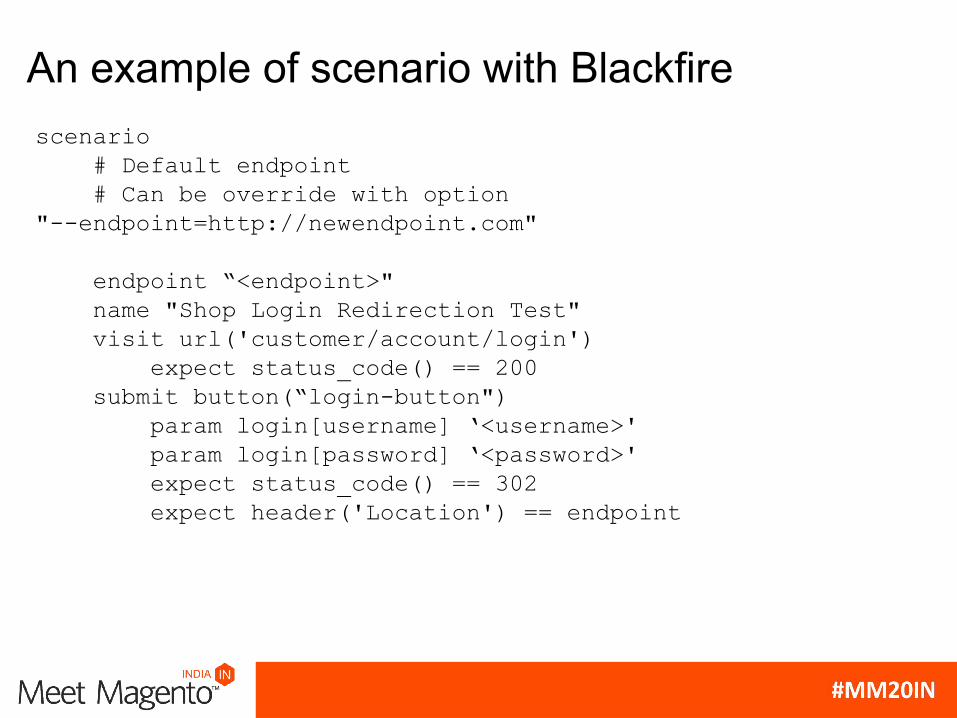
An example of scenario with Blackfirescenario # Default endpoint # Can be override with option "--endpoint=http://newendpoint.com"
endpoint “<endpoint>" name "Shop Login Redirection Test" visit url('customer/account/login') expect status_code() == 200 submit button(“login-button") param login[username] ‘<username>' param login[password] ‘<password>' expect status_code() == 302 expect header('Location') == endpoint

Thank You
Recommended