V16.0 | 2018-07-30
Data Mining and Report Examples – Offline Analysis
CANape/vSignalyzer

Tools
Offline Evaluation
� On-line Tools
� CANalyzer. Messages
� CANoe. Messages
� CANape. Signals
� Off-line Tools
� vSignalyzer
� Other tools
2/18

Load Measurement Files into the Symbol Explorer
Offline Evaluation of MDF-Files
� Drag & Drop the file channels to a display window
3/18
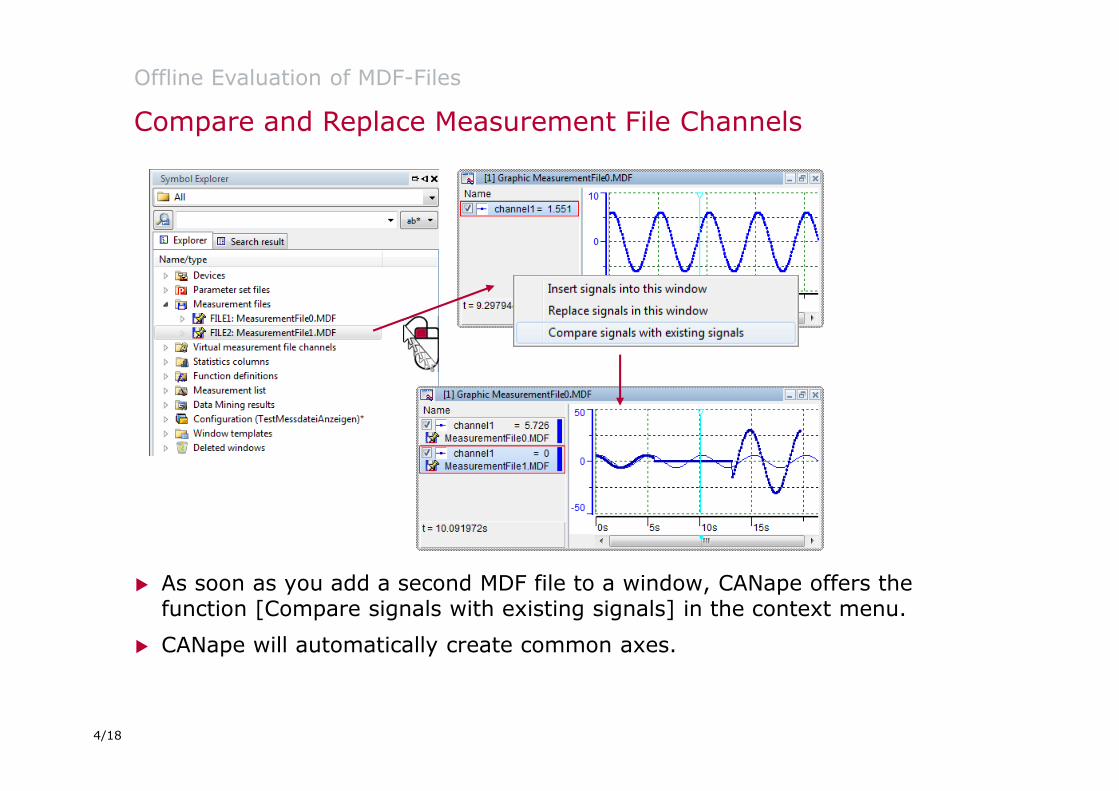
Compare and Replace Measurement File Channels
Offline Evaluation of MDF-Files
� As soon as you add a second MDF file to a window, CANape offers the function [Compare signals with existing signals] in the context menu.
� CANape will automatically create common axes.
4/18

Possibility 2: Functions Overview
Offline Evaluation of MDF-Files
� Load
� Load a selected measurement file into the Symbol Explorer
� Display
� Display the selected file channels of a MDF file in a graphic window
� Replace
� Replace an already loaded measurement file with another file.
5/18

Load Measurement File Sequences
Offline Evaluation of MDF-Files
� CANape detects when a MDF–file belongs to a series of measurement files from the same measurement.
� [Always Load as Measurement] loads automatically all files from the measurement.
6/18

[Signal values | Compare events]
Offline Evaluation of MDF-Files
� CAN be used for files with
� Triggers
� Results of a Data Mining analysis
� Signal value comments
7/18

Exporting and Importing Measurement Data
Offline Evaluation of MDF-Files
� The measurement files can be exported into different formats automatically using [Analysis | Measurement files | Export options]:
� In order to evaluate measurement data in other formats the menu [Analysis | Measurement files | Import options] offers various converters:
8/18
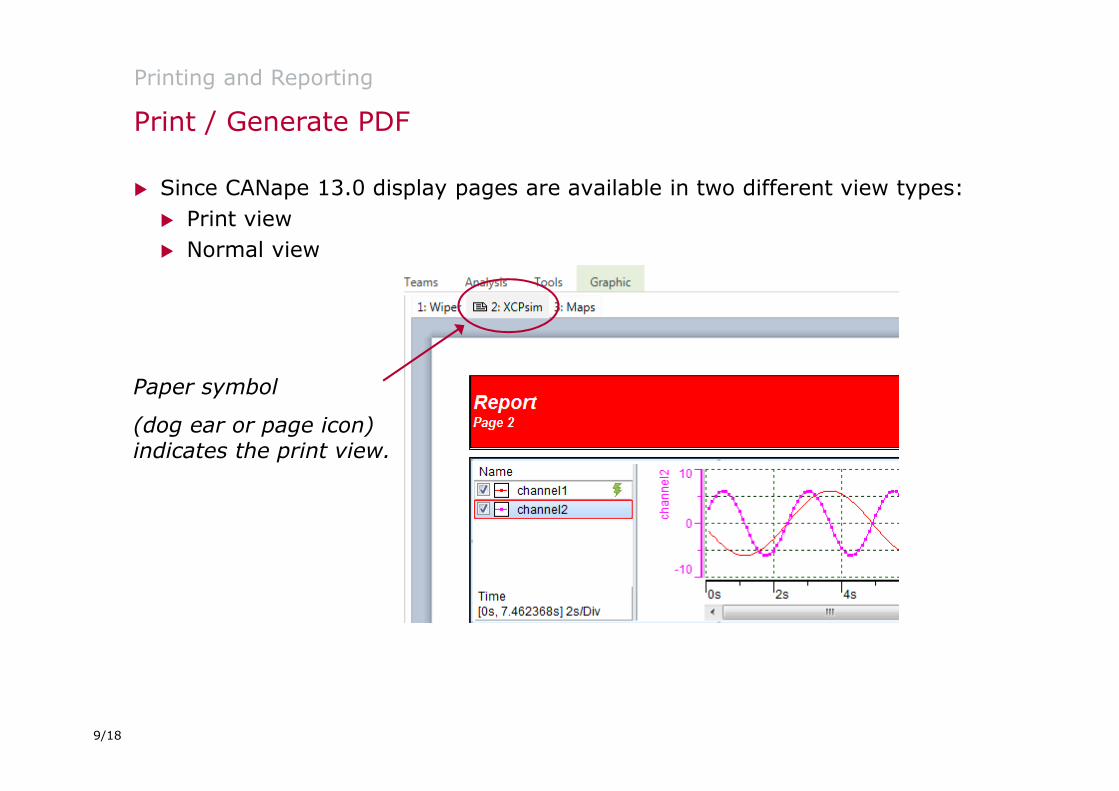
Print / Generate PDF
Printing and Reporting
� Since CANape 13.0 display pages are available in two different view types:
� Print view
� Normal view
Paper symbol
(dog ear or page icon) indicates the print view.
9/18
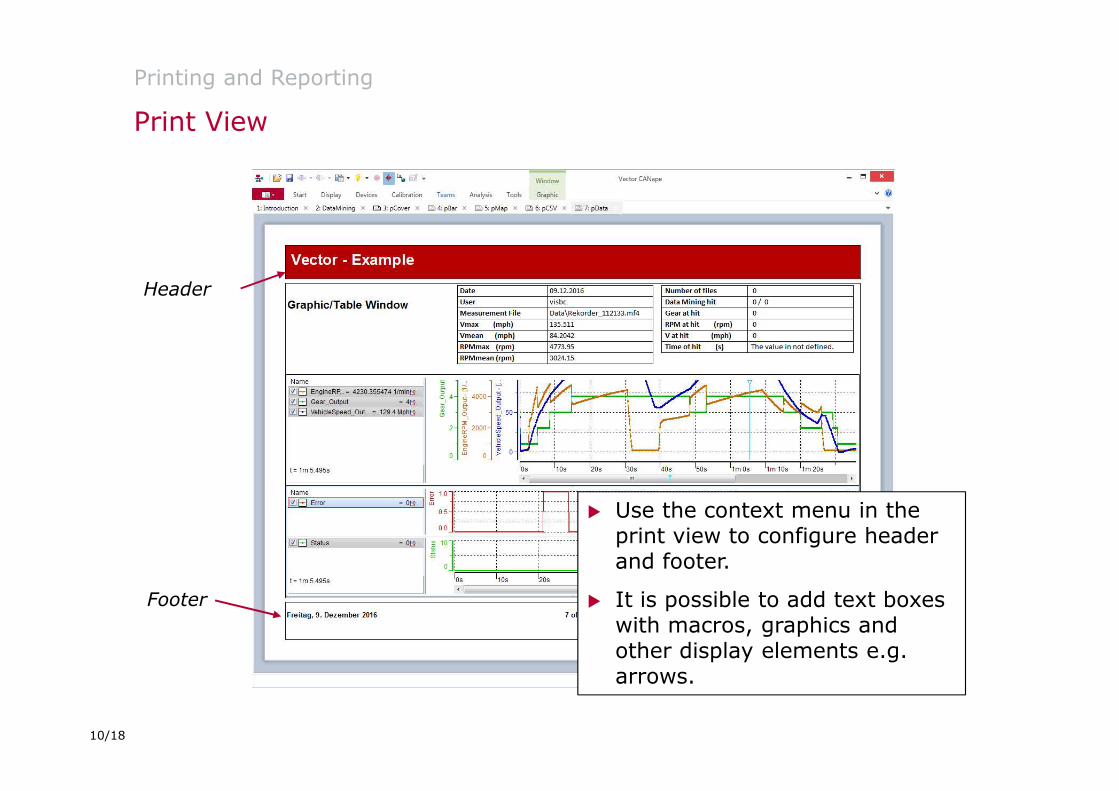
Print View
Printing and Reporting
� Use the context menu in the print view to configure header and footer.
� It is possible to add text boxes with macros, graphics and other display elements e.g. arrows.
Header
Footer
10/18

Page Configuration
Printing and Reporting
� Paper settings
� Paper size: A4/A5 ..
� Layout: portrait / landscape
� Margins
� Header and footer settings
� Height and distance
� Scaling of the windows
� Miscellaneous
� Show title bars of the windows
11/18

Text box / Graphic
Printing and Reporting
Text box with Macros
� Text box with macros for
� date
� measurement file / configuration name
� evaluate script file� E.g.: Vmax (mph) -
calculation
12/18

Motivation
Data Mining with Algebraic condition
� Methods overview
� Function (library)
> MaxValue >= 100
� Matlab/Simulink model
> Complex algorithm
� Algebraic condition
> Signal1 >=90 && Signal2==1
� Script
� Mathematical methods provide a systematic analysis of large amounts of measurement files.
� Different measurement file formats are possible (MDF,DAT,BLF…)
� A report file provides you with hits to analyze.
13/18

Checklist for the Data Mining Analysis
Data Mining with Algebraic condition
1. Preparation of the CANape configuration
a. Use just one file to visualize the file channels to be analyzed
2. Configuration of the Data Mining analysis
a. Definition of the file filter list
b. Definition of the method(s)
c. Configuration of the options
3. Evaluation of the report file
a. Sighting of the hits navigated over the Symbol Explorer or the Data Mining GUI
14/18

Step 2a of the Checklist
Data Mining with Algebraic condition
� Definition of the file filter list
� Whole directories
� Single files (different formats)
15/18

Step 2b: Algebraic Condition as Method
Data Mining with Algebraic condition
� Definition of the method
� Enter the algebraic condition with a “pocket calculator “
Syntax Check
16/18

Editor Overview
Functions for Online Use Cases
compile
Tree view
List view
Editor window
Message window
17/18

Virtual measurement signals
Functions for Online Use Cases
function Add(double A,double B ){
return A+B; }
function AverageValue3(double signal)
{
return ((signal[-2]+signal[-1]+signal)/3);
}
function Add ( A, B ){
return A+B; }
� Device-spanning assignment of measurement and calibration variables
� Processing of values from history (buffer) using brackets
� Graphic display of results using the return instruction
� Useful function calls/measurement modes:
� on input
� on event
18/18
Recommended