Embed Size (px)
Citation preview
7 u)
(CODE)
z_,3(CATEGORY)
NASA CR- 66378
CONCEPTUAL MECHANIZATION STUDIES
FOR A HORIZON DEFINITION SPACECRAFT
ELECTRICAL POWER SUBSYSTEM
Horizon Definition Study
Distribution of this report is provided in the interest ofinformation exchange. Responsibility for the contentsresides in the author or organization that prepared it.
May 1967
Prepared under Contract No. NAS 1-6010 by
HONEYWELL INC., Systems & Research Division,
Minneapolis, Minn.; GULTON INDUSTRIES INC.;
and TEXTRON ELECTRONICS INC.;
for
Spectrolab Division
NATIONAL AERONAUTICS AND SPACE ADMINISTRATION
https://ntrs.nasa.gov/search.jsp?R=19670022677 2019-04-01T12:27:32+00:00Z
May 1967 NASA CR-66378
CONCEPTUAL MECHANIZATION STUDIESFOR A HORIZON DEFINITION
SPACECRAFT ELECTRICAL POWER SUBSYSTEM
By Otto L. Jourdan, Honeywell Inc.
Jay A. Cox, Gulton Industries, Inc.John D. Gum, SpectrolabKarl Preusse, Gulton Industries, Inc.James J. Baltes, Honeywell Inc.David J. Hartman, Honeywell Inc.Fred E. Betz, Gulton Industries, Inc.Burton J. McComb, Gulton Industries, Inc.
ABSTRACT
A solar cell-battery electrical power subsystem was developed whichis compatible with the Horizon Definition Study spacecraft. Thissubsystem is capable of delivering 70 watts ot continuous electricalpower for one year in a sun-synchronous, 3 o'clock nodal crossing,500 km orbit.
NASA CR ° 66378
CONCEPTUAL MECHANIZATION STUDIES FOR A HORIZON DEFINITIONSPACECRAFT ELECTRICAL POWER SUBSYSTEM
By Otto L. Jourdan, Honeywell Inc.Jay A. Cox, Gulton Industries Inc.John D. Gum, SpectrolabKarl Preusse, Gulton Industries Inc.James J. Baltes, Honeywell Inc.David J. Hartman, Honeywell Inc.FredE. Betz, GultonIndustries Inc.Burton J. McComb, GultonIndustries Inc.
HORIZON DEFINITION STUDY
Distribution of this report is provided inthe interest of information exchange.Responsibility for the contents resides inthe author or organization that prepared it.
MAY 1967
Prepared under Contract No. NAS 1-6010 byHoneywell Inc.
Systems and Research DivisionMinneapolis, Minne sota;
Gulton Industries Inc. ; andTextron Electronics Inc., Spectrolab Division
for
NATIONAL AERONAUTICS AND SPACE ADMINISTRATION
FOREWORD
This report documents Phase A, Part II of An Analytical and Conceptual De-sign Study for an Earth Coverage Infrared Horizon Definition Study performedunder National A eronau tic s and Space Administration Contrac t NAS 1- 6010forLangley Research Center.
The Horizon Definition Study was performed in two parts. Part I, which waspreviously documented, provided for delineation of the experimental data re-quired to define the infrared horizon on a global basis for all temporal andspatial periods. Once defined, the capabilities of a number of flight techniquesto collect the experimental data were evaluated. The Part II, documented inthis report, provides a measurement program plan which satisfies the datarequirements established in the Part I study. Design requirements and theconceptual design for feasibility of the flight payload and associated subsystemsto implement the required data collection task are established and documentedwithin this study effort.
Honeywell Inc., Systems and Research Division, performed this study programunder the technical direction of Mr. L. G. Larson. The program was con-ducted from 28 March 1966 to 10 October 1966 (Part I) and from 10 October1966 to 29 May 1967 (Part II). This Part II portion of the study was the jointeffort of Gulton Industries Inc. ; Textron Electronics Inc., Spectrolab Divi-sion; and Honeywell Inc.
Gratitude is extended to NASA Langley Research Center for their technicalguidance, under the program technical direction of Messrs. L. S. Keafer andJ. A. Dodgen with direct assistance from Messrs. W. C. Dixon, Jr., E. C.Foudriat, H. J. Curfman, Jr., and G. A. Haynes, Jr., as well as the manypeople within their organization.
- iii -
PRECEDING PAGE BLANK NOT FILMED.
CONTENTS
FOREWORD
SUMMARY
INTRODUC TION
STUDY REQUIREMENTS AND OBJECTIVES
Basic RequirementsElectrical Power Subsystem Requirements
ELECTRICAL POWER UTILIZATION
Electrical LoadsElectrical Power Characteristics
ELECTRICAL POWER SYSTEM
System ConstraintsPower System TradeoffsPower System ConceptSpacec raft Elec trical Interface s
CONCLUSIONS AND RECOMMENDATIONS
APPENDICES
A SHUNT REGULATOR EFFICIENCY
B POWER OUTPUT OF PANELS ROTATED ABOUT THEHINGE LINE
C POWER OUTPUT OF PANELS ROTATED ABOUT A LINERADIAL FROM SPIN AXIS
D SOLAR ARRAY RADIATION DEGRADATION
E SOLAR ARRAY RELIABILITY ANALYSIS
REFERENCES
Pageiii
9
913
17
17195198
105
107
iii
121
129
145
167
- v -
P_,ECEDING PAGE BLAL_II_NOT. FILL_ED.
Figure
12
345678
9
10
1112
13
14
15
16
17
18
1920212223
24
25
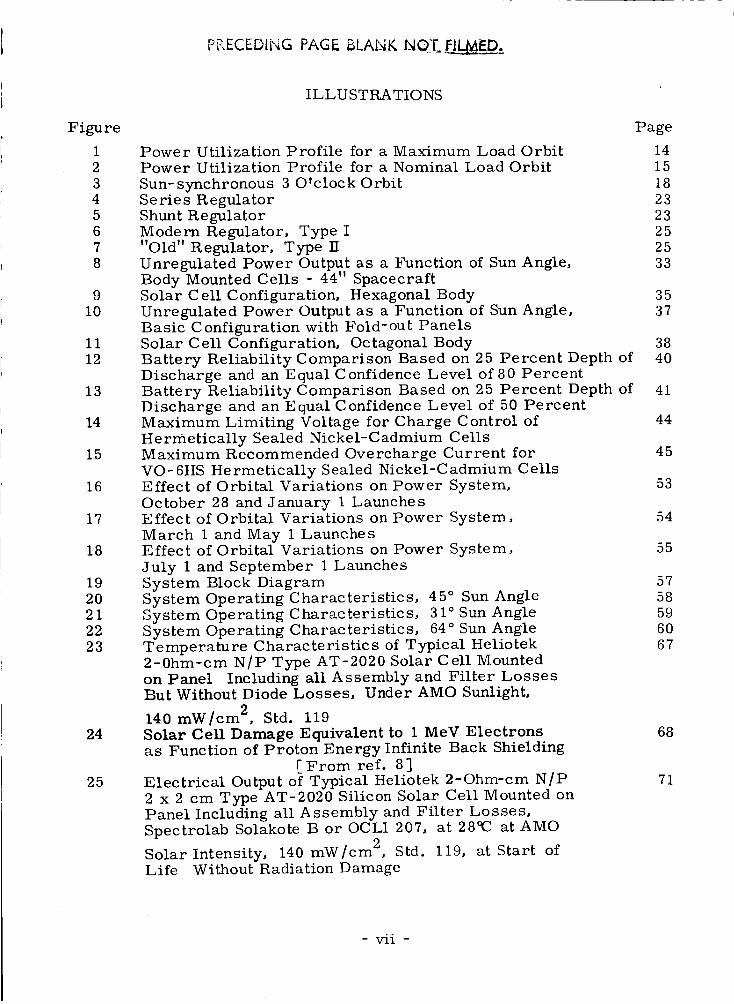
ILLUSTRATIONS
Page
Power Utilization Profile for a Maximum Load Orbit 14Power Utilization Profile for a Nominal Load Orbit 15
Sun-synchronous 3 O'clock Orbit 18Series Regulator 23Shunt Regulator 23Modern Regulator, Type I 25"Old" Regulator, Type II 25Unregulated Power Output as a Function of Sun Angle, 33Body Mounted Cells - 44" SpacecraftSolar Cell Configuration, Hexagonal Body 35Unregulated Power Output as a Function of Sun Angle, 37Basic Configuration with Fold-out PanelsSolar Cell Configuration, Octagonal Body 38Battery Reliability Comparison Based on 25 Percent Depth of 40Discharge and an Equal Confidence Level of 80 PercentBattery Reliability Comparison Based on 25 Percent Depth of 41Discharge and an Equal Confidence Level of 50 PercentMaximum Limiting Voltage for Charge Control of 44
Hermetically Sealed Nickel-Cadmium CellsMaximum Recommended Overcharge Current for 45
VO- 6HS He rmetically Sealed Nickel-C admium C ellsEffect of Orbital Variations on Power System, 53
October 28 and January 1 LaunchesEffect of Orbital Variations on Power System, 54
March i and May i LaunchesEffect of Orbital Variations on Power System, 55
July 1 and September 1 Launches
System Block Diagram 57System Operating Characteristics, 45 ° Sun Angle 58
System Operating Characteristics, 31 ° Sun Angle 59System Operating Characteristics, 64 ° Sun Angle 60Temperature Characteristics of Typical Heliotek 672-0hm-cm N/P Type AT-2020 Solar Cell Mountedon Panel Including all Assembly and Filter LossesBut Without Diode Losses, Under AMO Sunlight,
140 mW/cm 2, Std. 119
Solar Cell Damage Equivalent to 1 MeV Electrons 68as Function of Proton Energy Infinite Back Shielding
EFrom ref. 8]Electrical Output of Typical Heliotek 2-Ohm-cm N/P 71
2 x 2 cm Type AT-2020 Silicon Solar Cell Mounted onPanel Including all Assembly and Filter Losses,Spectrolab Solakote B or OCLI 207, at 28_C at AMO
Solar Intensity, 140 mW/cm 2, Std. 119, at Start of
Life Without Radiation Damage
- vii -
_RECED|NG pAGE BLANF, NOT. E_L_.'.ED,.
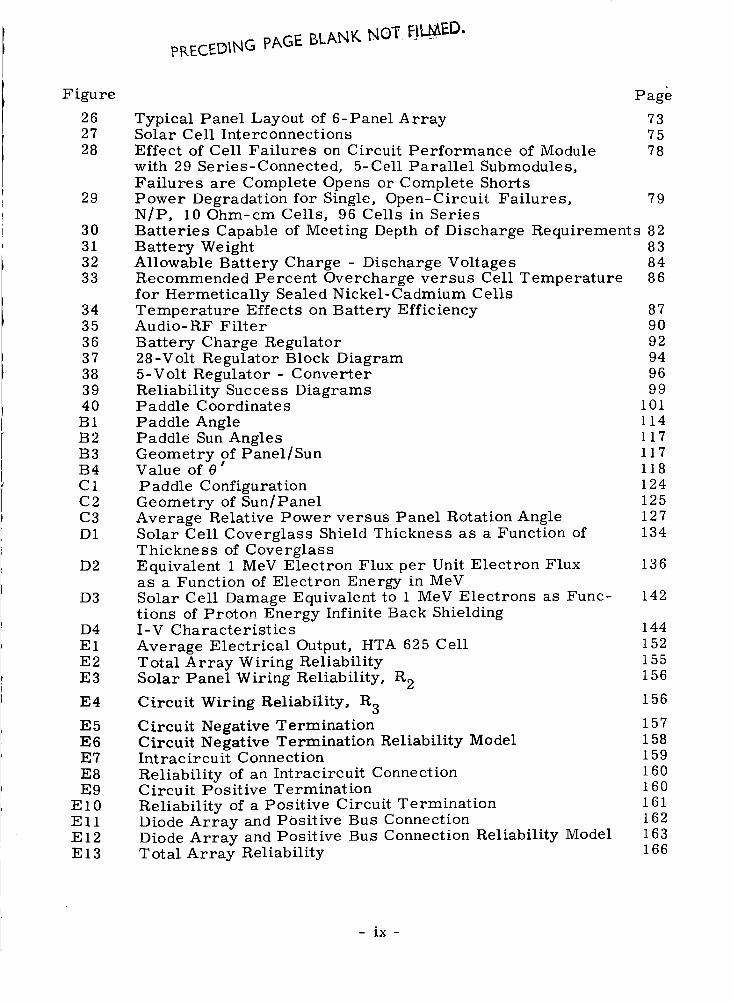
Figure
262728
29
30
313233
34
353637383940
B1B2B3B4C1C2C3D1
D2
D3
D4E1E2E3
E4
E5E6E7
E8E9
El0EllEl2El3
Typical Panel Layout of 6-Panel ArraySolar Cell InterconnectionsEffect of Cell Failures on Circuit Performance of Modulewith 29 Series-Connected, 5-Cell Parallel Submodules,
Failures are Complete Opens or Complete ShortsPower Degradation for Single, Open-Circuit Failures, 79N/P, 10 Ohm-cm Cells, 96 Cells in Series
Batteries Capable of Meeting Depth of Discharge Requirements 82
Page
737578
Battery We ight 83Allowable Battery Charge - Discharge Voltages 84Recommended Percent Overcharge versus Cell Temperature 86for Hermetically Sealed Nickel-Cadmium CellsTemperature Effects on Battery Efficiency 87Audio-RF Filter 90
Battery Charge Regulator 9228-Volt Regulator Block Diagram 945-Volt Regulator - Converter 96
Reliability Success Diagrams 99Paddle Coordinates 101
Paddle Angle 114Paddle Sun Angles 117
Geometry of Panel/Sun 117Value of 0 118
Paddle Configuration 124Geometry of Sun/Panel 125Average Relative Power versus Panel Rotation Angle 127Solar Cell Coverglass Shield Thickness as a Function of 134
Thickness of CoverglassEquivalent 1 MeV Electron Flux per Unit Electron Flux 136as a Function of Electron Energy in MeVSolar Cell Damage Equivalent to 1 MeV Electrons as Func- 142tions of Proton Energy Infinite Back ShieldingI-V Characteristics 144
Average Electrical Output, HTA 625 Cell 152Total Array Wiring Reliability 155
Solar Panel Wiring Reliability, R 2 156
Circuit Wiring Reliability, R 3 156
Circuit Negative Termination 157Circuit Negative Termination Reliability Model 158Intracircuit Connection 159
Reliability of an Intracircuit Connection 160Circuit Positive Termination 160
Reliability of a Positive Circuit Termination 161Diode Array and Positive Bus Connection 162Diode Array and Positive Bus Connection Reliability Model 163Total Array Reliability 166
- ix-
PRECEDING PAGE BLANK NOT, FILMED..
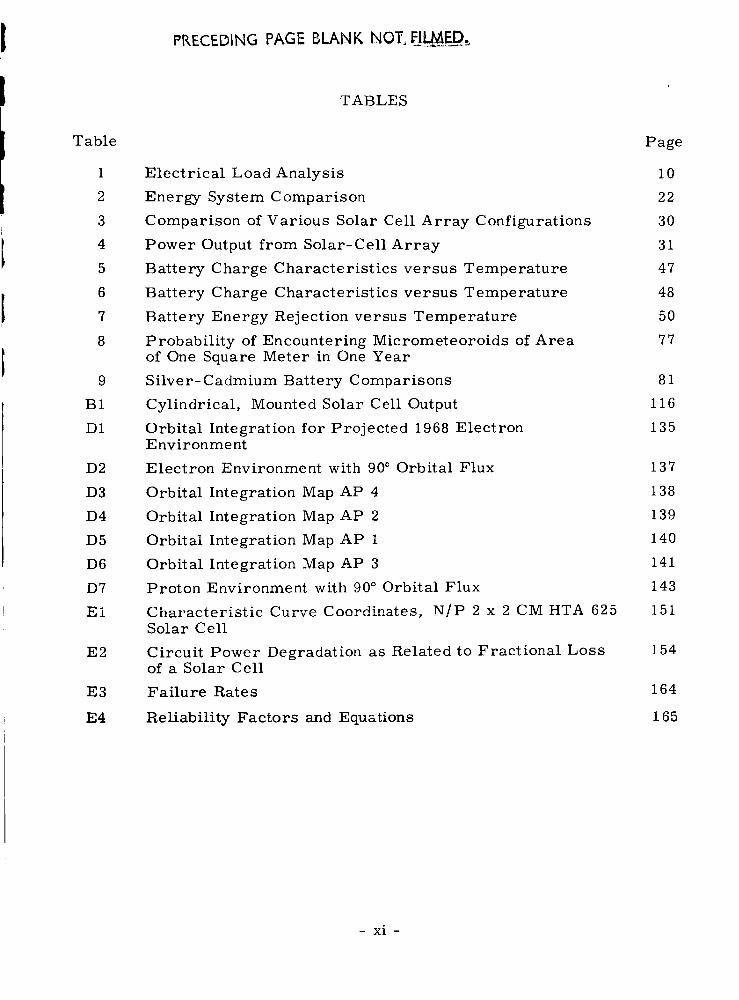
Table
1
2
3
4
5
6
7
8
9
B1
D1
D2
D3
D4
D5
D6
D7
E1
E2
E3
E4
TABLES
Electrical Load Analysis
Energy System Comparison
Comparison of Various Solar Cell Array Configurations
Power Output from Solar-Cell Array
Battery Charge Characteristics versus Temperature
Battery Charge Characteristics versus Temperature
Battery Energy Rejection versus Temperature
Probability of Encountering Micrometeoroids of Areaof One Square Meter in One Year
Silver-Cadmium Battery Comparisons
Cylindrical, Mounted Solar Cell Output
Orbital Integration for Projected 1968 ElectronE nvironme nt
Electron Environment with 90 ° Orbital Flux
Orbital Integration Map AP 4
Orbital Integration Map AP 2
Orbital Integration Map AP 1
Orbital Integration Map AP 3
Proton Environment with 90 ° Orbital Flux
Characteristic Curve Coordinates, N/P 2 x 2 CM HTA 625
Solar Cell
Circuit Power Degradation as Related to Fractional Lossof a Solar Cell
Failure Rates
Reliability Factors and Equations
Page
10
22
3O
31
47
48
5O
77
81
116
135
137
138
139
140
141
143
151
154
164
165
- xi -
CONCEPTUAL MECHANIZATION STUDIES FOR A HORIZON DEFINITIONSPACECRAFT ELECTRICAL POWER SUBSYSTEM
By Otto L. Jourdan, Honeywell Inc.Jay A. Cox, Gulton Industries Inc.John D. Gum, SpectrolabKarl Preusse, Gulton Industries Inc.
James J. Baltes, Honeywell Inc.
David J. Hartman, Honeywell Inc.Fred E. Betz, Gulton Industries Inc.Burton J. McComb, Gulton Industries Inc.
SUMMARY
This report describes the electrical power utilization of a spacecraft systemconcept which satisfies the requirements of the Horizon Definition Study. Afeasible electrical power subsystem capable of supplying the required elec-
trical power is recommended.
The recommended electrical power subsystem is capable of deliverying 70watts of continuous electrical power for one year in a sun-synchronous,3 o'clock nodal crossing, 500 km orbit. The subsystem basically consists
of six passively oriented solar panels, two nickel-cadmium electrical storagebatteries, battery charge regulators, system controls, and two bus regulators.
System protection and isolation of redundant loads are provided.
INTRODUC TION
The electrical power subsystems study documented herein is a portion of theHorizon Definition Study (HDS) conducted for NASA Langley Research C enter,Contract NAS 1-6010, Part II. The purpose of the Horizon Definition Study is
to develop a complete horizon radiance profile measurement program to pro-vide data which can be used to determine the earth's atmospheric state, es-
pecially at high altitudes. These data can then be effectively used in manyatmospheric sciences studies and in the design of instruments and measure-ment systems which use the earth's horizon as a reference.
Part I of the HDS resulted in the following significant contributions to thedefinition of the earth's radiance in the infrared spectrum:
The accumulation of a significant body of meteorological datacovering a major portion of the Northern Hemisphere.
Computation of a large body of synthesized horizon radianceprofiles from actual temperature profiles obtained by rocketsoundings.
Generation of a very accurate analytical model and computerprogram for converting the temperature profiles to infraredhorizon profiles (as a function of altitude}.
An initial definition of the quantity, quality, and samplingmethodology required to define the earth's infrared horizon
in the CO 2 absorption band for all temporal and spatial conditions.
An evaluation of the cost and mission success probabilities of aseries of flight techniques which could be used to gather theradiance data. A rolling-wheel spacecraft was selected in anominal 500 km polar orbit.
The Part II study effort was directed toward the development of a conceptuallyfeasible measurement system, which includes a spacecraft to accomplish themeasurement program developed in Part I. In the Part II HDS, a number ofscientific and engineering disciplines were exercised simultaneously to designconceptually the required system. Accomplishments of Part II of the studyare listed below:
The scientific experimenter refined the sampling methodologyused by the measurement system. This portion of the studyrecommends the accumulation of approximately 380 000 radi-ance profiles taken with a sampling rate that varies with thespacecraftts latitudinal position.
A conceptual design was defined for a radiometer capable ofresolving the earth's radiance in the 15-micron spectrum to0.01 watt]meter2-steradian with an upper level of responseof 7.0 watt/meter2-steradian.
A starmapper and attitude determination technique weredefined capable of determining the pointing direction of thespacecraft radiometer to an accuracy of 0.25 km in tangentheight at the earth's horizon.
The combination of the radiometer and starmapper instrumentsis defined as the mission experiment package.
A solar cell-battery electrical power subsystem conceptualdesign was defined which is completely compatible with theorbital and experiment constraints. This system is capableof delivering 70 watts of continuous electrical power for oneyear in the sun-synchronous, 3 o'clock nodal crossing, 500 kmorbit.
A data-handling subsystem conceptual design was definedwhich is capable of processing in digital form all scientificand status data from the spacecraft. This subsystem iscompletely solid state and is designed to store the 515 455bits of digital information obtained in one orbit of the earth.This subsystem also includes command verification andexecute logic.
A communications subsystem conceptual design was definedto interface between the data-handling system of the space-craft and the STADAN network.- The 136 MHz band is used
for primary data transmission and S band is used for therange and range-rate transponder.
A spacecraft structural concept was evolved to contain, align,and protect the spaceborne subsystems within their prescribedenvironmental constraints. The spacecraft is compatible withthe Thor-Delta launch vehicle.
An open-loop, ground-commanded attitude control subsystemconceptual design was defined utilizing primarily magnetictorquing which interacts with the earth's field as the forcefor correcting attitude and spin rates.
The Thor-Delta booster, which provides low cost and adequatecapability, was selected from the 1972 NASA "stable".
Western Test Range was selected as the launch site due topolar orbit requirements. This site has adequate facilities,except for minor modifications, and is compatible with thepolar orbital requirements.
This report contains documentation of those areas of study directly related tothe conceptual design of the electrical power subsystem on the vehicle. Theobjectives of these studies were as follows:
To determine the electrical power utilization of all on-boardelectrical subsystems.
To define design requirements for an electrical power sub-system and develop a feasible concept which would realizethe program objectives and achieve compatibility with theoverall spacecraft concept, experiment requirements, andall the constraints which have evolved during both phasesof the Horizon Definition Study.
The detailed study performed to meet these objectives is presented in thefollowing pages.
STUDY REQUIREMENTS AND OBJECTIVES
Basic system requirements are those defined by the original statement of work,Phase A Part I results, and NASA instructions.
The following list itemizes the primary and secondary requirements of theHorizon Definition Study.
BASIC REQUIREMENTS
Radiance Profile Measurements
-1Spectral interval: 615 to 715 cm (14.0 to 16.28_)
Profile accuracy
_- Tangent height range: +80 km to -30 km
_- Instantaneous value of radiance measured must be
assignable to a tangent height value to within +0. 25 kin.
Radiance characteristics and resolution:
Maximum peak radiance = 7. 0 W/m 2 - sr.
Minimum peak radiance = 3. 0 W/m 2 sr.
Maximum slope = 0. 6 W/m 2 - sr - km.2
Minimum slope = 0. 02W/m - sr - km.
Maximum slope change = 0. 15 W/m 2 - sr - km 2.2
Radiance magnitude resolution = 0. 01 W/m - st.
_- Horizontal resolution: 25 km
Data reauirements - Data reauirements for the HorizonDefiniti6n Study (HDS) experihaent, as refined during thestudy, are as follows:
Minimum requirements. --
One-year c ontinuou s cove rage
"Uniform" time sampling in each space cell over eachtime cell, i.e., no more than two samples/space cell/day
b- 13 time cells (28 days/cell)
b. 408 space cells
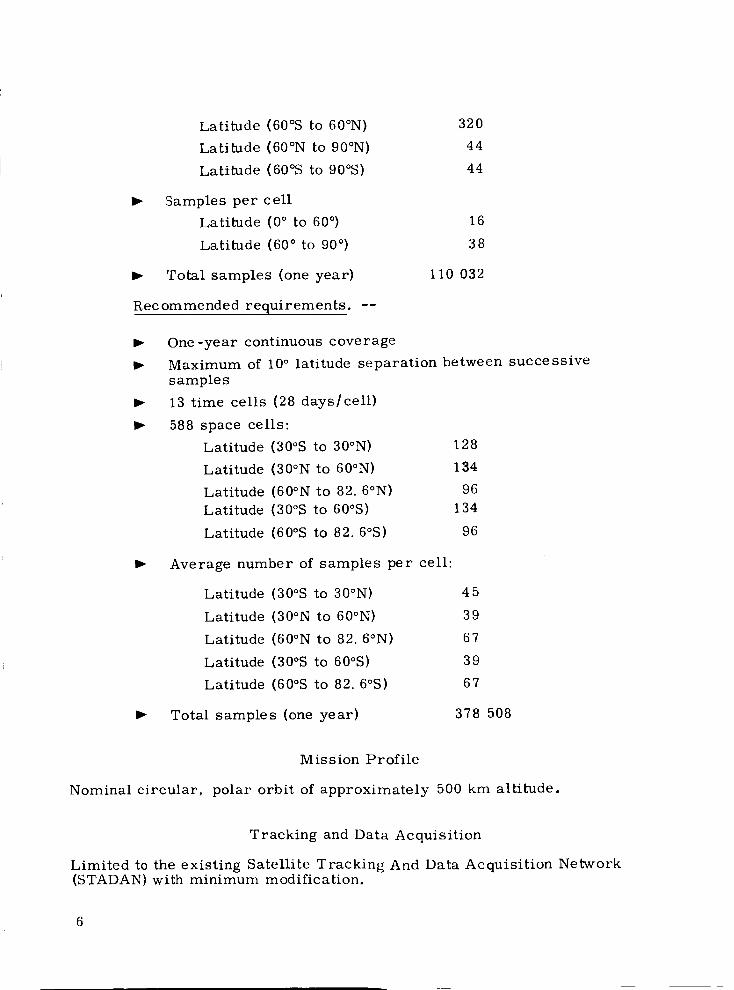
Latitude (60°S to 60°N)
Latitude (60°N to 90°N)
Latitude (60°S to 90°S)
Samples per cell
Latitude (0 ° to 60 °)
Latitude (60 ° to 90 °)
• Total samples (one year}
Recommended requirements.
320
44
44
16
38
1 i0 032
• One-year continuous coverage
• Maximum of 10 ° latitude separation between successive
samples
13 time cells (28 days/cell)
588 space cells:
Latitude (30°S to 30°N) 128
Latitude (30°N to 60°N) 134
Latitude (60°N to 82. 6°N) 96
Latitude (30°S to 60°S} 134
Latitude (60°S to 82. 6°S) 96
Average number of samples per cell:
Latitude (30°S to 30°N) 45
Latitude (30°N to 60°N} 39
Latitude (600N to 82. 60N) 67
Latitude (30°S to 600S) 39
Latitude (600S to 82. 60S} 67
378 508Total samples (one year)
Mission Profile
Nominal circular, polar orbit of approximately 500 km altitude.
Tracking and Data Acquisition
Limited to the existing Satellite Tracking And Data Acquisition Network(STADAN) with minimum modification.

Experiment Package
Passive radiometric and attitude measurements with redundancy(more than one unit} in the research package for the radiometerand attitude determination device.
Minimum scan rate >0. 5 scans]min average.
Maximum scan angle with respect to orbit plane <5 ° .
Space craft
Rolling-wheel configuration (spin axis normal to the orbit plane}.
Weight in less than 800 pound class mandatory.
State of the Art
Proven subsystems shall be employed wherever possible.
Mission Effec tivenes s / Reliability
Reliability shall be approached on the basis of "designing in" successful per-formance of the one-year, data-collection mission, i.e., the effort is to bebiased strongly toward mission effectiveness. Consequently, the missioneffectiveness/reliability effort should involve continuing tradeoffs in each sub-function area against the criteria of maximum effectiveness. A numericalestimate of the probable system MTBF shall be made on the final configuredsys tern.
Strong consideration should be given to the use of reserve spacecraft as a"backup" means rather than as a continuously ready standby. Specifically,the "backup" concept (as opposed to continuously ready} is of more signifi-cance on a Thor-Delta sized vehicle than on a Scout vehicle.
E LEC TRICA L POWER SUBSYS TEM REQUIREMENTS
The electrical power subsystem requirements are the result of the functionalanalysis and other Part II studies. These subsystem requirements state whatis necessary to satisfy the mission and basic requirements and are listedbelow.
Provide spacecraft electrical power source - The solar arraymust supply load plus system losses and charge battery underfollowing conditions:
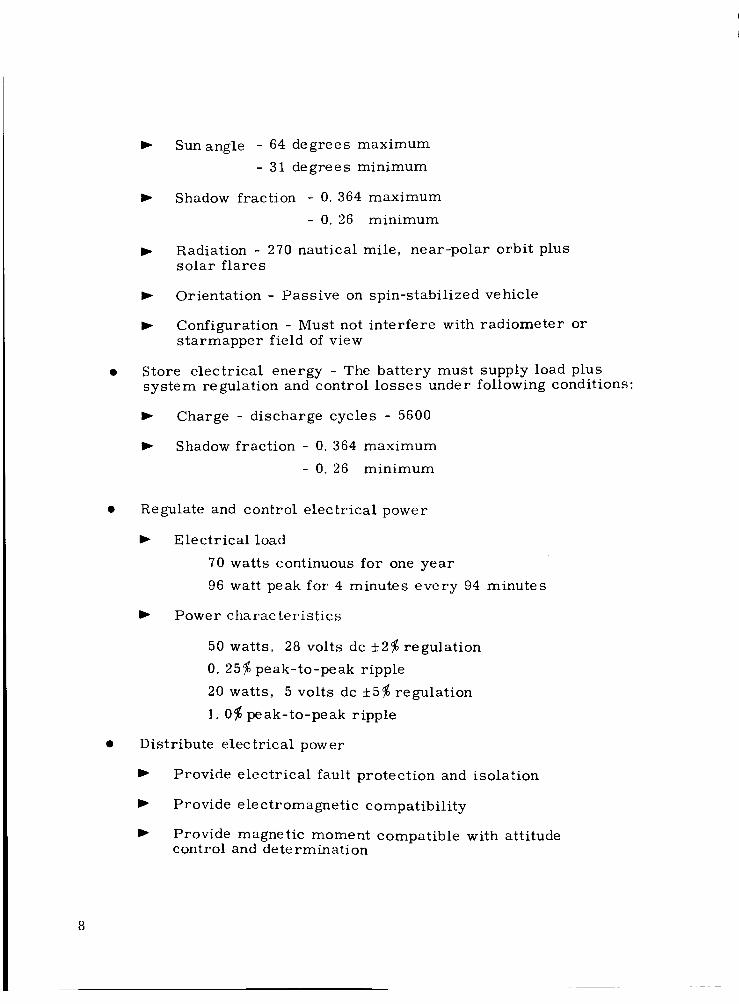
_," Sun angle - 64 degrees maximum
- 31 degrees minimum
Shadow fraction - 0. 364 maximum
- 0. 26 minimum
_- Radiation - 270 nautical mile, near-polar orbit plussolar flares
P- Orientation - Passive on spin-stabilized vehicle
m,- Configuration - Must not interfere with radiometer or
starmapper field of view
Store electrical energy - The battery must supply load plussystem regulation and control losses under following conditions:
P- Charge - discharge cycles - 5600
_- Shadow fraction - 0. 364 maximum
- 0. 26 minimum
Regulate and control electrical power
P- Electrical load
70 watts continuous for one year
96 watt peak for 4 minutes every 94 minutes
P" Power characteristics
50 watts, 28 volts dc ±2_regulation
0. 25_ peak-to-peak ripple
20 watts, 5 volts dc +5_regulation
I. 0_ peak-to-peak ripple
Distribute electrical power
Provide electrical fault protection and isolation
Provide electromagnetic compatibility
Provide magnetic moment compatible with attitudecontrol and determination
8
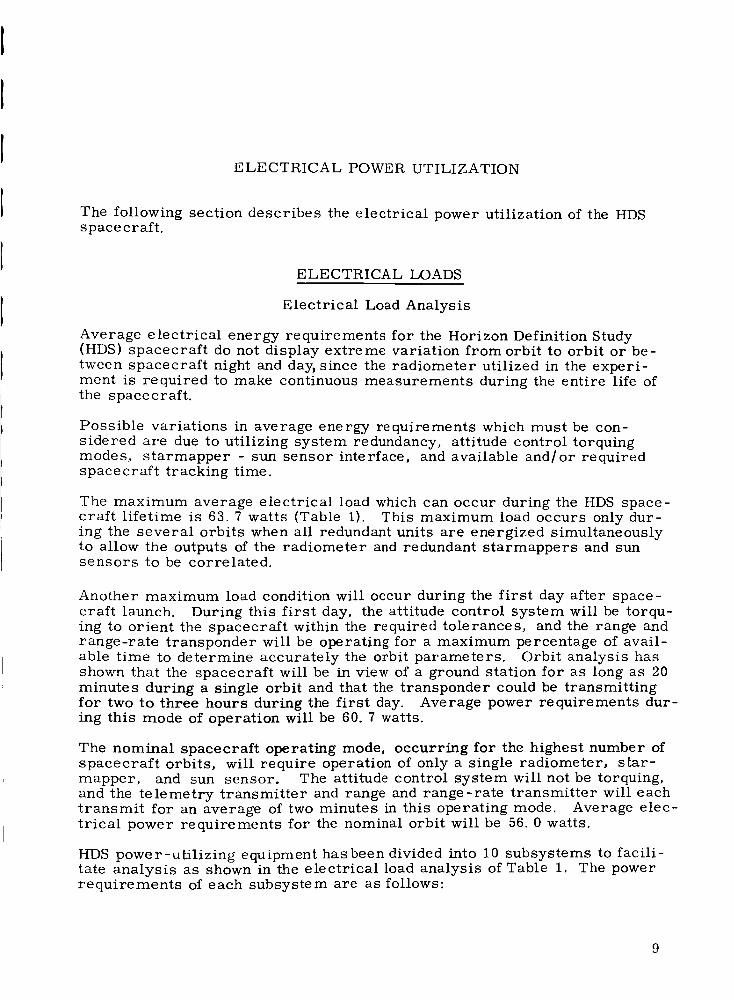
ELECTRICAL POWER UTILIZATION
The following section describes the electrical power utilization of the HDSspacecraft.
ELECTRICAL LOADS
Electrical Load Analysis
Average electrical energy requirements for the Horizon Definition Study(HDS) spacecraft do not display extreme variation from orbit to orbit or be-
tween spacecraft night and day, since the radiometer utilized in the experi-ment is required to make continuous measurements during the entire life ofthe spacecraft.
Possible variations in average energy requirements which must be con-
sidered are due to utilizing system redundancy, attitude control torquingmodes, starmapper - sun sensor interface, and available and/or requiredspacecraft tracking time.
The maximum average electrical load which can occur during the HDS space-craft lifetime is 63. 7 watts (Table 1}. This maximum load occurs only dur-
ing the several orbits when all redundant units are energized simultaneouslyto allow the outputs of the radiometer and redundant starmappers and sunsensors to be correlated.
Another maximum load condition will occur during the first day after space-
craft launch. During this first day, the attitude control system will be torqu-ing to orient the spacecraft within the required tolerances, and the range andrange-rate transponder will be operating for a maximum percentage of avail-
able time to determine accurately the orbit parameters. Orbit analysis hasshown that the spacecraft will be in view of a ground station for as long as 20
minutes during a single orbit and that the transponder could be transmittingfor two to three hours during the first day. Average power requirements dur-
ing this mode of operation will be 60. 7 watts.
The nominal spacecraft operating mode, occurring for the highest number of
spacecraft orbits, will require operation of only a single radiometer, star-mapper, and sun sensor. The attitude control system will not be torquing,
and the telemetry transmitter and range and range-rate transmitter will eachtransmit for an average of two minutes in this operating mode. Average elec-trical power requirements for the nominal orbit will be 56. 0 watts.
HDS power-utilizing equipment hasbeen divided into 10 subsystems to facili-tate analysis as shown in the electrical load analysis of Table 1. The power
requirements of each subsystem are as follows:
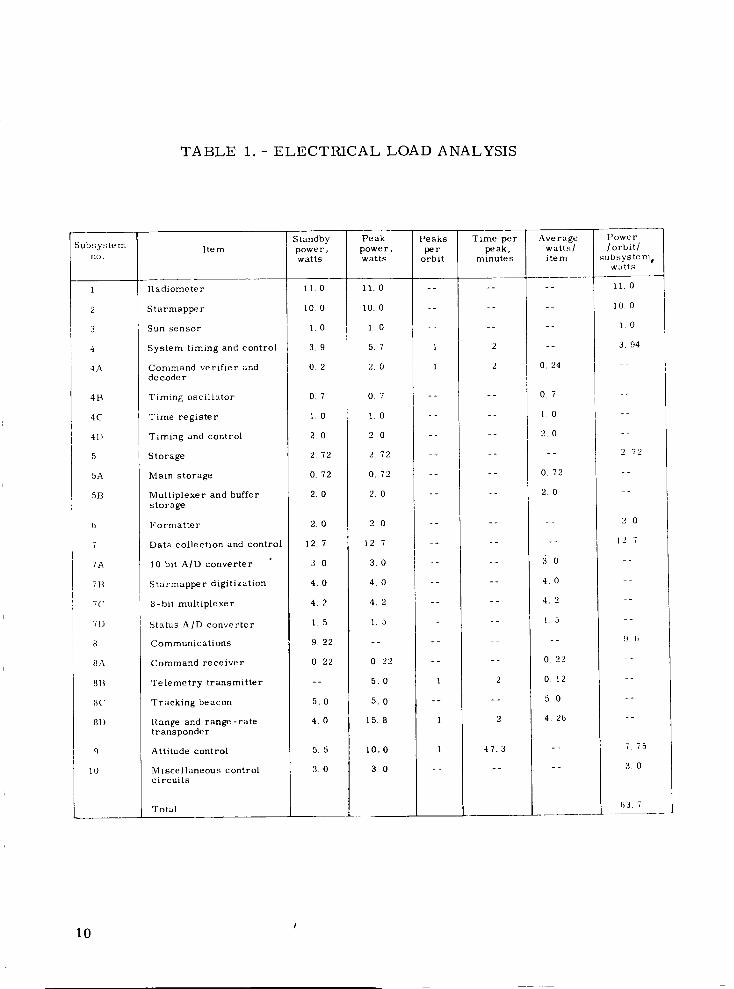
TABLE i. - ELECTRICAL LOAD ANALYSIS
Subsystem
no.
i
2
3
4
4A
4B
4C
4I)
5
5A
5B
7
7A
7B
7('
71)
8
8A
8B
8C
8D
9
10
Item
Radiometer
Starmappe r
Sun sensor
System timing and control
Command verifier and
decoder
Timing oscillator
Time register
Timing and control
Storage
Main storage
Multiplexer and buffer
storage
Formatter
Data collection and control
10 bit A/D converter
Starmapper digitization
8-bit multiplexer
Status A/D converter
Communications
Command receiver
Telemetry transmitter
Tracking beacon
Range and range-rate
transponder
Attitude control
Miscellaneous control
circuits
Total
Standby
powe r,watts
ll.O
10.0
1.0
3.9
02
0.7
1.0
2.0
2.72
072
2.0
2.0
12.7
3.0
4.0
4.2
1.5
9.22
0.22
5.0
4.0
5.5
3.0
Peak
power.watts
11.0
1O. 0
1.0
5.7
2.0
07
1.0
2.0
2.72
0.72
2.0
2 O
12.7
3.0
4.0
4.2
1.5
0 22
5.0
5.0
158
I0.0
3.0
Peaks
perorbit
1
1
1
1
1
Time per
peak,minutes
2
2
2
2
47.3
Average Power
watts/ /orbit/
item subsystempwatts
-- Ii. 0
-- 10 0
-- 1.0
-- 3. 94
O. 24 --
0 7 --
1,0 --
2.0 --
-- 272
072 --
2.0 --
__ 20
-- 127
3.0 --
4.0 --
4. 2 --
I. 5 --
-- 9 (i
022 --
0.12 --
5.0 --
4. 26 --
-- 775
-- 3 0
63. 7
10
l) Radiometer - 11 watts average/orbit.
The radiometer utilizes redundant calibration sources, choppers,electronics, and detectors within a single optical system. Bothradiometer detectors, detector preamplifiers, and telemetryinput preamplifiers are normally energized along with a singlechopper and a single calibration unit. The stepper for the cali-bration unit draws five three- watt-millisecond pulses of powereach revolution of the spacecraft about its spin axis.
2) Starmapper - 5 watts average/orbit each.
Two starmappers are provided on the spacecraft, only one ofwhich is normally energized. Power-utilizing components arethe detector electronics and filters and the photomultipler high-voltage power supply. The starmapper operates only during thedark portions of each orbit; however, a reverse potential mustbe applied to the photomultiplier tube during the sunlit portionof the orbit. Therefore, input power requirements do not varysignificantly between spacecraft day and night. The alternatestarmapper is shuttered when it is de-energized.
3) Sun sensor - 0. 5 watt average/orbit each.
Two sun sensors are provided on the spacecraft, only one isnormally energized. Power is required for signal amplifica-tion.
4) System timing and control - 3.94 watts average/orbit.
The system timing and control subsystem verifies and decodesground commands, provides the spacecraft time reference, andprovides control commands from the time register. This sub-system requires 3. 94 watts average per orbit and has a 5. 7watt peak for approximately two minutes each orbit.
5) Storage - 2. 72 watts average/orbit.
This subsystem stores experiment and spacecraft status data.The subsystem requires 2. 72 watts and is energized continuously.
6) Formatter - 2 watts average/orbit.
This subsystem adds synchronizing and parity checking bits tothe data. The subsystem requires two watts and is energizedcontinuously.
11
7) Data collection, and control - 12. 7 watts average/orbit.
This subsystem provides analog-to-digital conversion andselects the data source and formats for uniform storage words.
This subsystem requires 12. 7 watts and is energized continuously.
8) Communication subsystem - 9. 6 watts average/orbit.
The communications subsystem provides a data link for transfer
of experiment and engineering information between the spacecraft
and ground stations, and it provides a means of determining the
exact orbit of the spacecraft.
A vhf system basically consisting of a command receiver and atransmitter is used for the data link. The command receiver
is on continuously and requires 0. 22 watts of electrical power.
The transmitter is used for two minutes each orbit and requires
five watts of power while transmitting.
HDS spacecraft orbit determination is supplied by a trackingbeacon and an S-band, range and range-rate transponder. The
tracking beacon is supplied by a vhf transmitter, identical to thedata-link transmitter, which is energized continuously. The
tracking-beacon transmitter can also be used to transfer experi-ment and engineering data in the event of a failure of the data-link transmitter.
The range and range-rate transponder requires four watts of
power in the standby mode and 15. 8 watts during interrogation.
The transponder can be transmitting as much as 20 minutes
per orbit during early orbits; however, the average "on" time
during the one-year operation will not exceed two minutes per
orbit. The range and range-rate transponder can also be used
as a spacecraft data link.
9) Attitude control subsystem - 7. 75 watts average/orbit.
The attitude control subsystem controls the spin rate and attitude
of the spacecraft. The spacecraft is initially spun up to approxi-mately three rpm and oriented to the correct sun angle by thelaunch vehicle prior to separation. The spacecraft system then
maintains the spin rate and correct sun angle.
The attitude control V-head horizon sensor, logic, and residual
coil are energized continuously and require 5. 5 watts of electricalpower. The torquer and spin coils require an additional 4. 5watts and are energized for one-half orbit every 5 to 20 orbits.
12

i0) Miscellaneous control circuits 3 Watts average/orbit.
Three watts have been allocated for control circuits which are
not part of any specific subsystem. These circuits includesystem monitoring, magnetic compensation, system protection,etc.
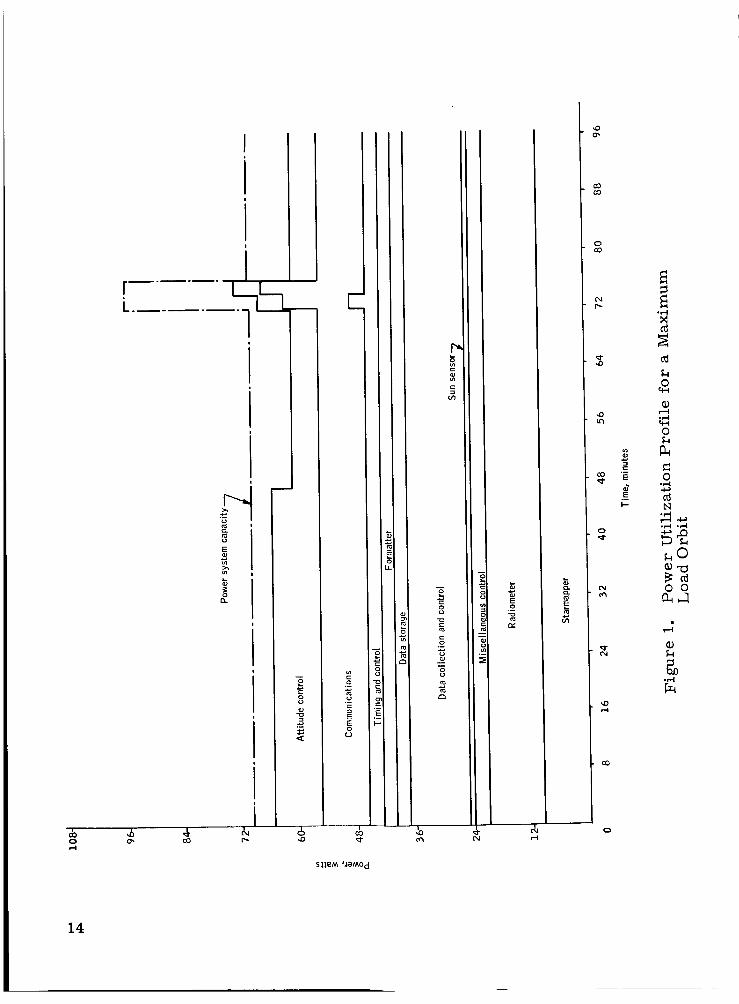
Electrical Power Profile
Figure 1 shows a power utilization profile for the maximum load conditionsshown by the load analysis. Peak system load is 73 watts.
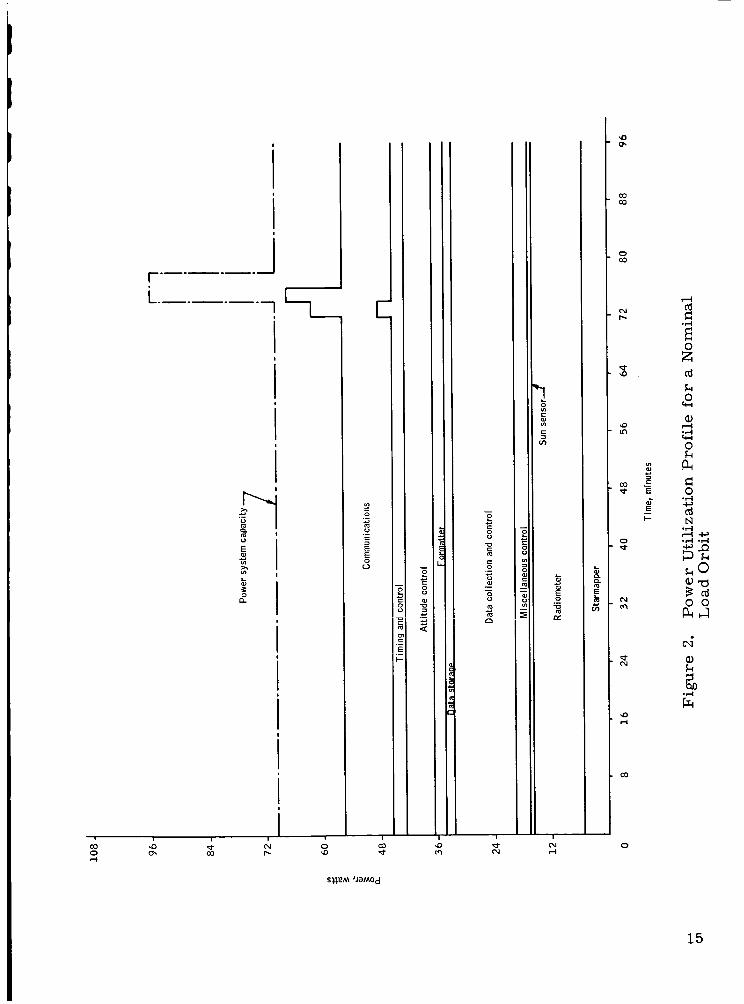
Figure 2 shows a power utilization profile for the electrical load which willbe typical for the greatest number of orbits during the year. Nominal peakload is 67. 5 watts.
Power system capacity at the load bus is also shown by the power profiles.The HDS electrical power system is configured to supply 70 watts of elec-trical power to the load continuously for one year and, in addition, to supplya 96-watt peak for four minutes every orbit.
The configured electrical system has a load capacity approximately 10 per-cent greater than the present maximum load requirements and 25 percentgreater than present nominal power requirements. This reserve capacity isprovided for distribution losses and contingency power.
ELECTRICAL POWER CHARACTERISTICS
Two bus voltages will be supplied: one at 28 volts for general purpose appli-cation and one at 5 volts primarily for systems utilizing integrated circuits.Regulation and power characteristics for the two buses have been chosen so asto provide the highest quality power consistent with a reliable power system.
From the power user's point of view, the ideal power system would supplyperfectly regulated and noise-free voltage. Clearly, as soon as any linelength is introduced between the power supply and the using subsystems, theeffective power supply at the end of the line is degraded from the ideal byeffects of the resistance and reactance of the lines. These factors set a
fundamental lower limit to the effective output impedance of the power supplyas seen by the subsystem.
The power system itself deviates from the ideal in two significant respects:first, it impresses a ripple upon the subsystem, and second, its output im-pedance is not zero; therefore, other using subsystems contribute an addi-itional unwanted voltage to the output.
13
I
i
E
n
I
• _- &
SIIeM '.lg MO d
&
COcO
o
o
E
I--
°w,.I
Nc_
0q,-I
r-I
0
0
bl°f-4
°_,-I
0
.,.I-:'
0"0c_0
14
ii
I
iI
Li
L
iiiJi|
Iw l ! i
,-I
r-
i I
o co_0 _"
SIIeM 'J_MOd
o
oo
lO
o
I
_O
O0O0
CO
_4
E
O0
O
==
E
cd
°,ll
O
c_
O
O
O
c_b_
°,ll
°rll °_-ll
_Oa)_o
o o
.Ill
15
Constancy of the value of the output voltage is another question of interest tosubsystem power users. In general, there are two levels of stability re-quired. The most stable finds general applications in reference circuitswhere some comparison is made between a measurand and the reference.
The stabilities are generally of the orders of fractions of a percent. Thenext order of stability required is that necessary to ensure that solid-stateamplifier bias points are adequately stable. An adequate level here is of theorder of a few percent. In view of the above-mentioned noise and common
power supply difficulties, power of the reference quality should be regulatedat the component level rather than at the general purpose bus.
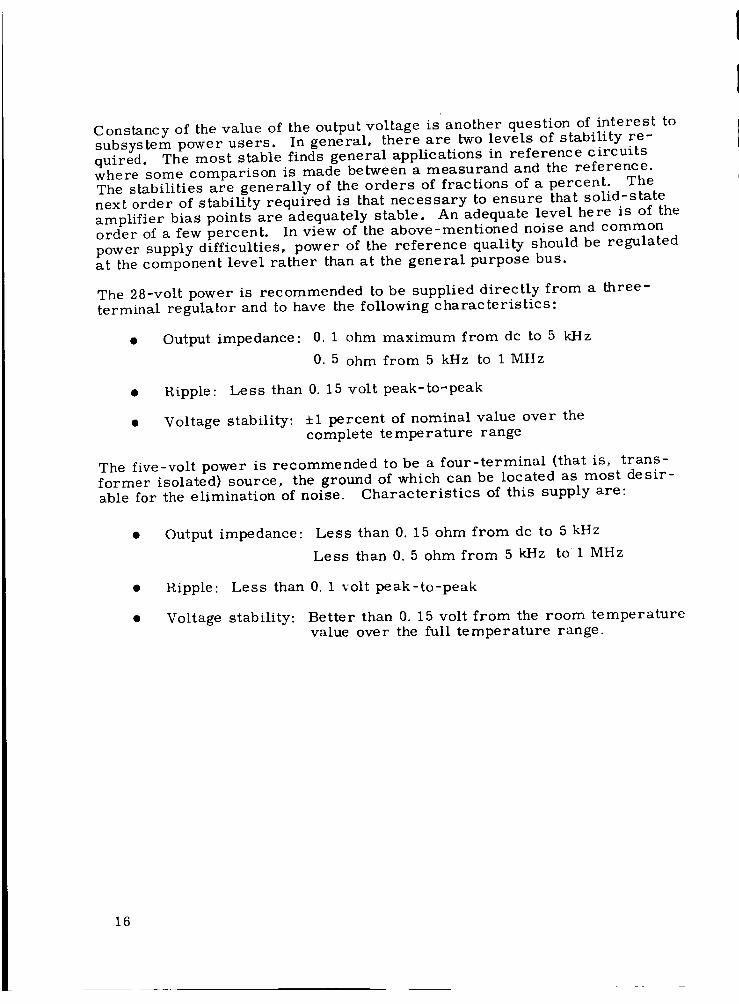
The 28-volt power is recommended to be supplied directly from a three-terminal regulator and to have the following characteristics:
Output impedance: 0. 1 ohm maximum from dc to 5 kI-Iz
0. 5 ohm from 5 kHz to 1MHz
• Ripple: Less than 0. 15 volt peak-to-peak
Voltage stability: +1 percent of nominal value over thecomplete temperature range
The five-volt power is recommended to be a four-terminal (that is, trans-
former isolated) source, the ground of which can be located as most de sir-
able for the elimination of noise. Characteristics of this supply are:
Output impedance: Less than 0. 15 ohm from dc to 5 kHz
Less than 0. 5 ohm from 5 kHz to 1 MHz
Ripple: Less than 0. 1 volt peak-to-peak
Voltage stability: Better than 0. 15 volt from the room temperature
value over the full temperature range.
16
ELECTRICAL POWER SYSTEM
This section describes the power system constraints, the tradeoff studiesconducted to select a feasible concept, and a description of the recommended
concept.
SYSTEM CONSTRAINTS
Orbit Constraints
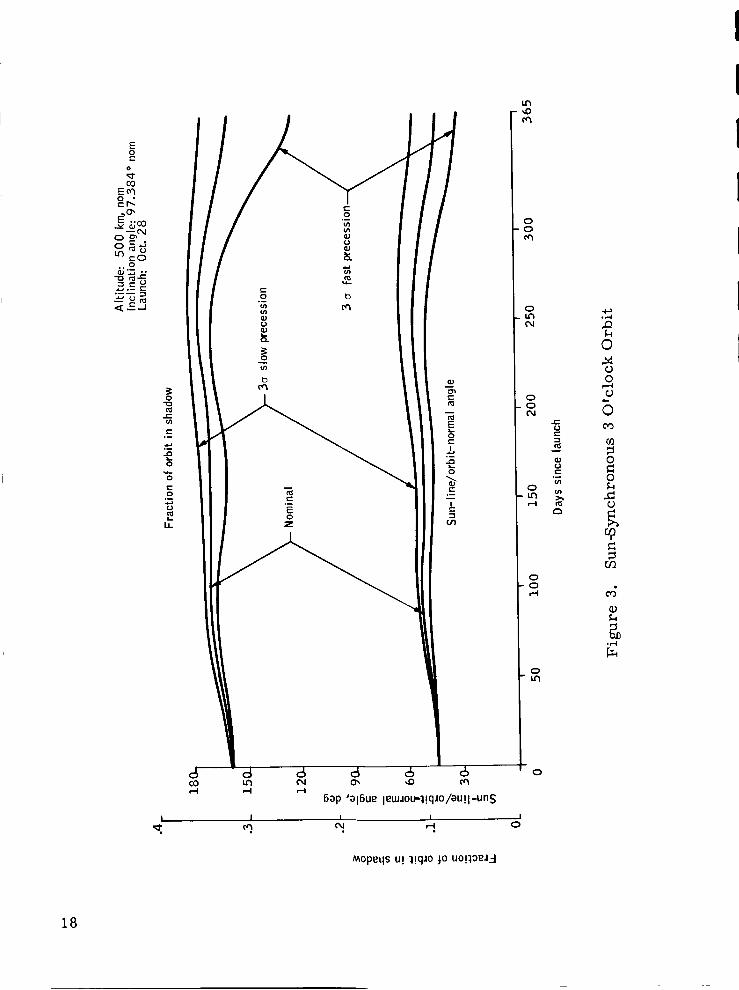
The shadow fraction per orbit and the angle between the sun-line and thevehicle spin axis are shown in Figure 3 for the first year after launch. Theangle of incidence relative to the vehicle spin axis will vary throughthe yearon either side of the 45-degree nominal value. Taking into account theanticipated three-sigma limits for launch error, the angle of incidence fromthe sun-line to the spin axis can vary from a minimum of 31 ° to a maximum of64 ° and is accompanied by variations in the magnitude of the shadow fraction.A limiting requirement for the power system is the 64-degree sun angle.The solar array must be approximately twice as large at a 64-degree sunangle (without active orientation} as the array required at a 31-degree sunangle and 1-112 times the size of the array required at a 45-degree sun angle.The one-year operation and the fact that the spacecraft enters the earth'sshadow every orbit during the year also establishes the battery cycle liferequirement at 5600 cycles. The orbit altitude, 500 km, establishes theradiation level and, consequently, the necessary allowance for solar celldegradation. The selected altitude is an optimum altitude as far as radiationdegradation is concerned.
Spacecraft Constraints
The spacecraft is spin stabilized, rotating at 3 rpm, with the spin axis main-tained in an orientation perpendicular to an earth radius and to the planedefined by the orbit.
The shape of the spacecraft is in the general form of a hexagonal right prism.This shape determines the number of solar panels (six} and the maximumwidth of each panel (27 inches).
The attitude of the spacecraft must be accurately known at all times. Thisprohibits the use of moving parts such as an actively oriented solar array.Also, the location and mounting angle of the solar array are restricted by theradiometer and starmapper field-of-view requirements. The attitude controlsystem uses magnetic torquing. Attitude determination and control constraintsalso require an electrical power system whose magnetic moment is small anddoes not vary greatly during the life of the spacecraft.
17
Ln
C_
I
o
ooc_
o
o,I
ooo4
r-I
0
0
,--I
ou_
o
MOpeqs U! l!qJo JO uo!13e_-I
¢-¢,Jc
e-
(/l
.,-4
©a4
o
b03
r_
0
0
_9
r_
_4
18
Launch Vehicle Interface
The maximum spacecraft envelope is a cylinder 54 inches in diameter and48 inches high. Maximum cylindrical diameter is limited by the Thor-Deltashroud. Cylindrical length is limited by spacecraft balance requirementsand could be increased only in the event of an urgent conflicting design re-quirement. The above constraints determine the allowable length of the solarpanels. The power system will also place a requirement on the launchvehicle for a signal to erect the solar panels prior to spin-up.
Environmental Effects
Environmental requirements for the power system are not severe. Thetemperature of internally mounted electrical power system components isbeing held to the relatively narrow 0° to 35 ° C range. The launch environ-ment normally seen from the Thor-Delta system can be tolerated within thenormal rating of standard aerospace components. The radiation environ-ment, as previously noted, is low due to the low orbit. The most importantenvironmental constraint will probably be the wiring and terminations to theexperiment and low temperature baseplate, as well as the requirement thatthe electrical system shall not provide good heat conduction paths to theseareas.
POWER SYSTEM TRADEOFFS
Energy Source
Three energy sources were considered to be potentially feasible for the HDSspacecraft. These three systems were: i) fuel cell, 2) radioisotope-
u_l,-b_e_y. To be _ihl_. the sys-thermoelectric system, and 3) solar -- 1 _** _ . .......tern must meet technical performance requirements, be available in time tomeet program flight schedules, and not add excessive costs to the program.Evaluation of the major characteristics of each system has led to the con-clusion that a solar array-battery system is the best system for HDS.
Fuel cell. -- A cursory analysis immediately reveals that a fuel cellsystem is not technically feasible due to two factors:
The life expectancy of available fuel batteries does not approachthe one-year operational requirement.
The weight of fuel and fuel tanks is prohibitive. For the HDSmission, fuel andfuel-tank weight would be in the range of 700to 900 pounds, to which the weight of cells and system controlsmust be added to arrive at the total system weight.
19
Radioisotope. -- A radioisotope-thermoelectric source has the advantage
of allowing complete flexibilityin the choice of a spacecraft orbit. Theisotope-thermoelectric system has the following interfaces with the space-craft:
A considerable amount of shielding is required to protect thespacecraft instruments from the isotope radiation.
Special precautions are required to prevent the inherent hightemperatures of the power system from limiting the life of thelow temperature coolant associated with the radiometer.
A battery charge control and regulator will be required to supply
system peak loads to avoid sizing the system for the short durationpeak load.
Results of the tradeoff study indicate that all of the foregoing interfaceproblems can be solved within the power system weight allowances on theHDS spacecraft.
Cost and schedule considerations present more serious problems. As todelivery schedule, it seems clear that the development of a generator intime for an October 1969 launch is difficult although not impossible.Application of existing designs such as SNAP 19 or SNAP 27 do not seemfeasible, since their existing configurations would impose restrictions onthe design of the vehicle. Availability of the fuel is another considerationand is potentially limiting. Since the total fuel quantity is in short supply,program success would depend upon the allocation of an adequate priorityin comparison to all other proposed programs competing for the fuel.
Development cost of an optimum generator is estimated at 10 milliondollars; however, this cost probably would not be borne by the project.
Cost of the thermoelectric generator is estimated at $100 000 to $300 000.Based on Plutonium 238 as the probable fuel, fuel cost is estimated at$2 300 000 per charge. Most of this cost, however, could be recovered ifthe fuel system is returned from orbit. Any such reckoning of costreduction must, of course, include the probability of failure to recover dueto all possible causes.
Certain other costs would be incurred. It will be necessary to provideradiation shielding, special handling and cooling procedures, and equipmentfor prelaunch operations. This total cost is estimated to be $200 000. Amajor cost is that of providing for radioisotope re-entry and recovery.Existing recovery systems used by the military could probably be adaptedfor this program. Cost of the adaptation, to this program, is estimated tobe $1 000 000.
2O
Solar cells. -- The solar array-battery system has the most extensiveflight history, the lightest weight, and the lowest cost. This system doeshave the disadvantage of requiring either restrictions on the allowable space-craft orbits or use of active orientation of the solar panels with attendentsolar array reliability and attitude control system interface problems. How-ever, this disadvantage is not a limiting consideration since a 3 o'clock sun-synchronous orbit has been selected for the HDS experiment. With theselected orbit, the vehicle spin axis is always between 31 and 64 degreesfrom the sun-line; therefore, one vehicle face normal to the spin axis iscontinuously illuminated except during earth shadow. This permits thedesign of an array which can extract energy from solar radiation incidentto surfaces which are always illuminated and avoids the necessity oforientation mechanisms with their adverse effects on reliability and vehicle
stability.
A summary of the salient points of comparison is presented in Table 2.Evidently the solar cell-battery system is best for the HDS program, al-though an isotope-battery system is a feasible backup. Program require-ments are beyond the present state of the art for fuel cell systems.
Control and Regulation
Bus regulator. -- A great variety of dc power regulation circuits, eachwith different characteristics, are available due to recent advances in semi-
conductors and magnetics. Available regulator circuit configurations mustbe evaluated for each specific power system application since no one of theregulation circuits has characteristics which are best for all applications.Analysis of system requirements and regulation circuits shows that a seriespulse-width-modulated (PWM) regulator is the optimum bus regulator forthe HDS spacecraft.
HDS electrical system perforn_lance requirements can be met with eitherthe dissipative (Class A) or nondissipative (PWM) type. The dissipativetype uses transistors operating as a series or shunt valve of varying"resistance". This type regulator characteristically has low weight, lowoutput impedance, fast response, low efficiency (hence thermal problems),and straightforward design. EMI problems are minimized.
Operation of both types is based on comparison of the output to a referenceand amplification of the difference to control the output (Figures 4 and 5).
With modern components, it is possible to design the series regulator suchthat shunt losses are negligibly small with respect to the load. In this
Ecase, the efficiency n of this regulator is approximately n = _ showing
iE EO O
to E.--7--that for a range of E i, the efficiency varies from Ei min. i max.
E. must be about E + 1 volt, so that for a i. 5: i input range and 28-i rain, o
volt output the efficiency varies from about 97 percent to about 64 percent.
21
TABLE 2. - ENERGY SYSTEM COMPARISON
Charac teristic
Flight history
Life
Limitations on mission
growth capability
Availability, schedule
Relative cost
Weight
Intact recovery required
Solar array-battery
combination
Considerable
Limited bybattery
Some; growthis possibleat moderatecost
Readilyavailable
$1
75 to 100
poundsdependingon redun-
dancy used
No
Fuel cell
None for
longmissions
500 to1000hours
700 to900
poundsfuel +cells,tanks
No
Isotope-battery
Some
Limited bybattery
Some ; c os tis high
Marginallyavailable
$4
60 to 200
pounds
Yes
22
TSeries 1
transistor I
TE.
in Amplifier_Sense
Eout
Reference
Load I
Figure 4. Series Regulator
Rsource
TEin Shunt
transistor
ense
Reference
tEout I
I Load I
Figure 5. Shunt Regulator
23
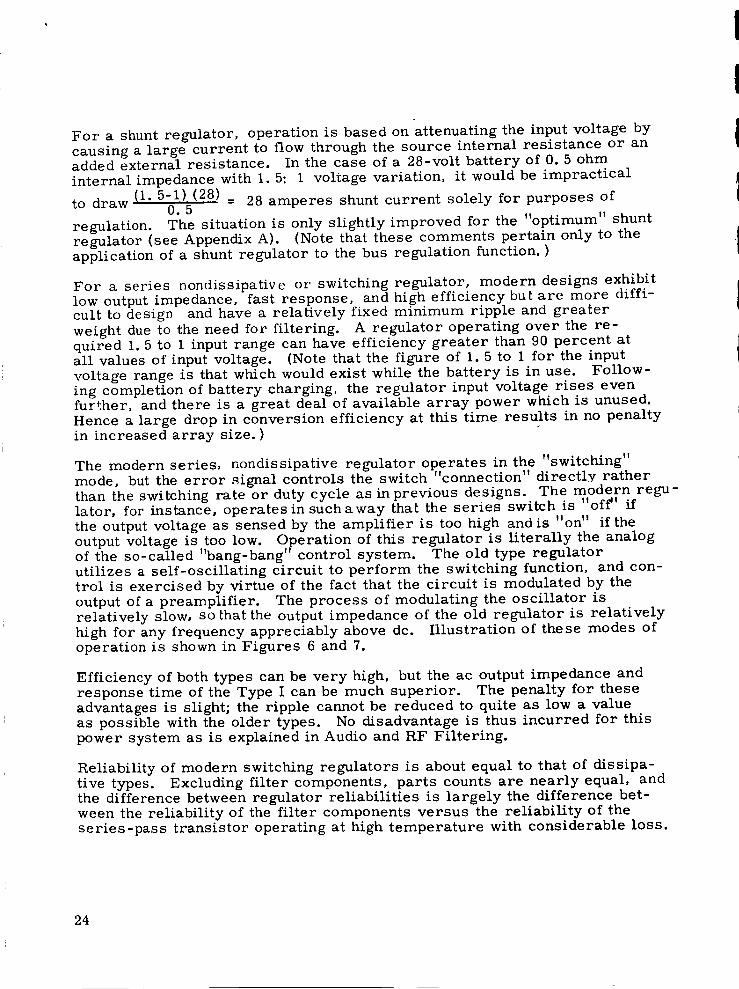
For a shunt regulator, operation is based on attenuating the input voltage bycausing a large current to flow through the source internal resistance or anadded external resistance. In the case of a 28-volt battery of 0. 5 ohminternal impedance with 1. 5:1 voltage variation, it would be impractical
to draw (1. 5-1.) (28) = 28 amperes shunt current solely for purposes of0.5
regulation. The situation is only slightly improved for the "optimum" shuntregulator (see Appendix A}. (Note that these comments pertain only to theapplication of a shunt regulator to the bus regulation function. )
For a series nondissipativc or switching regulator, modern designs exhibitlow output impedance, fast response, and high efficiency but are more diffi-cult to design and have a relatively fixed minimum ripple and greaterweight due to the need for filtering. A regulator operating over the re-quired i. 5 to 1 input range can have efficiency greater than 90 percent atall values of input voltage. (Note that the figure of I. 5 to 1 for the inputvoltage range is that which would exist while the battery is in use. Follow-ing completion of battery charging, the regulator input voltage rises evenfurther, and there is a great deal of available array power which is unused.Hence a large drop in conversion efficiency at this time results in no penaltyin increased array size. )
The modern series, nondissipative regulator operates in the "switching"mode, but the error signal controls the switch "connection" directly ratherthan the switching rate or duty cycle as in previous designs. The modern regu-lator, for instance, operates in suchaway that the series switch is "ofi _' ifthe output voltage as sensed by the amplifier is too high and is "on" if theoutput voltage is too low. Operation of this regulator is literally the analogof the so-called "bang-bang"control system. The old type regulatorutilizes a self-oscillating circuit to perform the switching function, and con-trol is exercised by virtue of the fact that the circuit is modulated by theoutput of a preamplifier. The process of modulating the oscillator isrelatively slow, so that the output impedance of the old regulator is relativelyhigh for any frequency appreciably above dc. Illustration of these modes ofoperation is shown in Figures 6 and 7.
Efficiency of both types can be very high, but the ac output impedance andresponse time of the Type I can be much superior. The penalty for theseadvantages is slight; the ripple cannot be reduced to quite as low a valueas possible with the older types. No disadvantage is thus incurred for thispower system as is explained in Audio and RF Filtering.
Reliability of modern switching regulators is about equal to that of dissipa-tive types. Excluding filter components, parts counts are nearly equal, andthe difference between regulator reliabilities is largely the difference bet-ween the reliability of the filter components versus the reliability of theseries-pass transistor operating at high temperature with considerable loss.
24
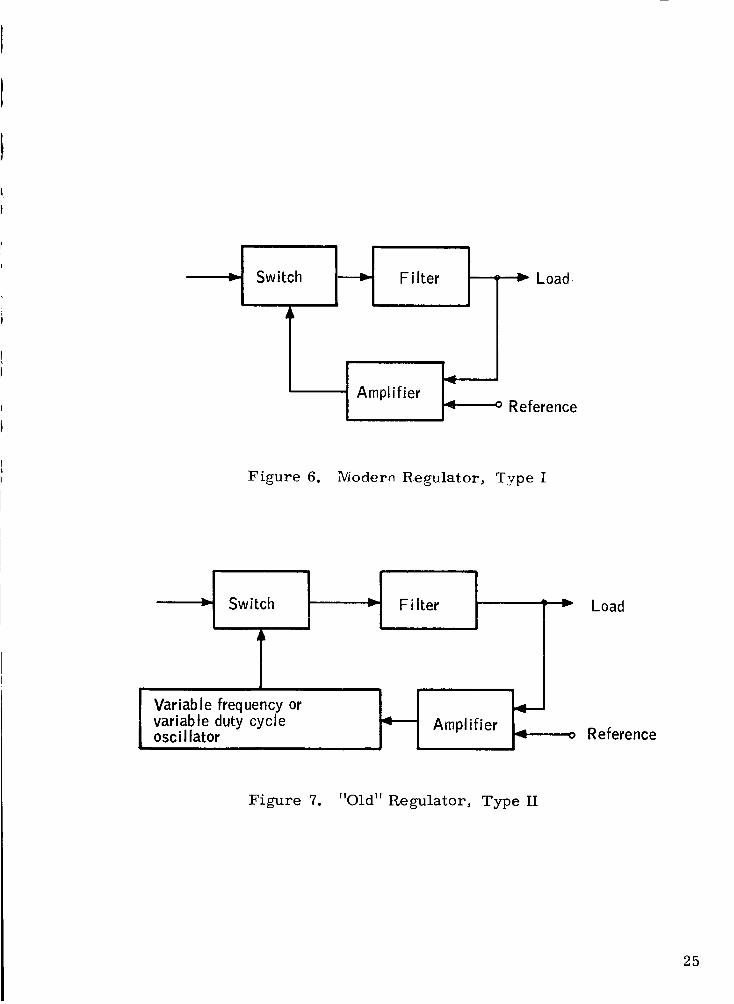
Switch _ Filter _ _ Load
Reference
Figure 6. Modern Regulator, Type I
_I Switch
l Variable frequency orvariable duty cycleoscillator
_] FilterLoad: y
Amplifier _ Reference
Figure 7. "Old" Regulator, Type II
25
Using the minimum efficiency figures of 0.64 and 0.90, it can be seen thatJ 4t ° ossnnon.s...e o. s 0,0'00 .n.
1 -i I = 39.4 watts, most of which is a
i - Iin the dissipative regulator is 70
Isingle series element.
The difference between 39.4 and 7. 7 watts, or 31. 7 watts, must then be
generated by an array of appreciably greater size and weight. The some-what greater simplicity of the dissipative regulator is not worth the largesize penalty imposed on the power system and the thermal problem imposedon the structure.
It is also possible to construct a nondissipative regulator which could be
called a shunt type, in contrast to those which have been discussed above
which could be called the series type. These regulators can also be quiteefficient and are distinguished by the fact that the switching element operateswith respect to ground so as to charge an inductance with a relatively high
current, which is then discharged into the load through a series diode. Thisregulator is also called a boost regulator, since its operation is to provide avoltage step up from the output. This type of regulator would be best used
for reducing the array voltage. For this type of regulator the array wouldbe designed for a maximum voltage somewhat less than the minimum battery
voltage, so that a step-up in voltage would always be required of the regula-tor. The chief advantage of this type of regulator is that the transistorvoltage rating could be lower than that needed to place the transistor in theseries mode. For the system in question, however, modern transistors are
completely adequate to hold off the highest voltage to be encountered, so thisis no longer a factor against the series type. In view of its lower efficiencyand the fact that current limiting cannot be obtained, the shunt switchingregulator is not considered to be a candidate.
Charge re_ulator. -- Requirements for the charge regulator differ fromthose for the bus regulator. Output of the charge regulator must be con-
trolled so that the battery-charging requirements are observed. Failure toobserve these requirements will result in either undercharge or damage dueto overcharge. To meet these requirements, the reference must vary
appropriately with battery temperature. A sensor located within the batteryprovides this function.
The element which directly controls charging current can be operated in
either the dissipative or nondissipative mode. As with the bus regulator,there is appreciable heat loss associated with a dissipative regulator and a
greatly reduced heat loss with the nondissipative regulator.
Following is a discussion of the factors which influence the size of the solar
array for both types of regulators. It is assumed that 78-watts, continuous
power output is required from each. Since the output voltage of theseassumed configurations varies considerably from charge to discharge con-ditions, the constant-power assumption implies that the bus regulator
26
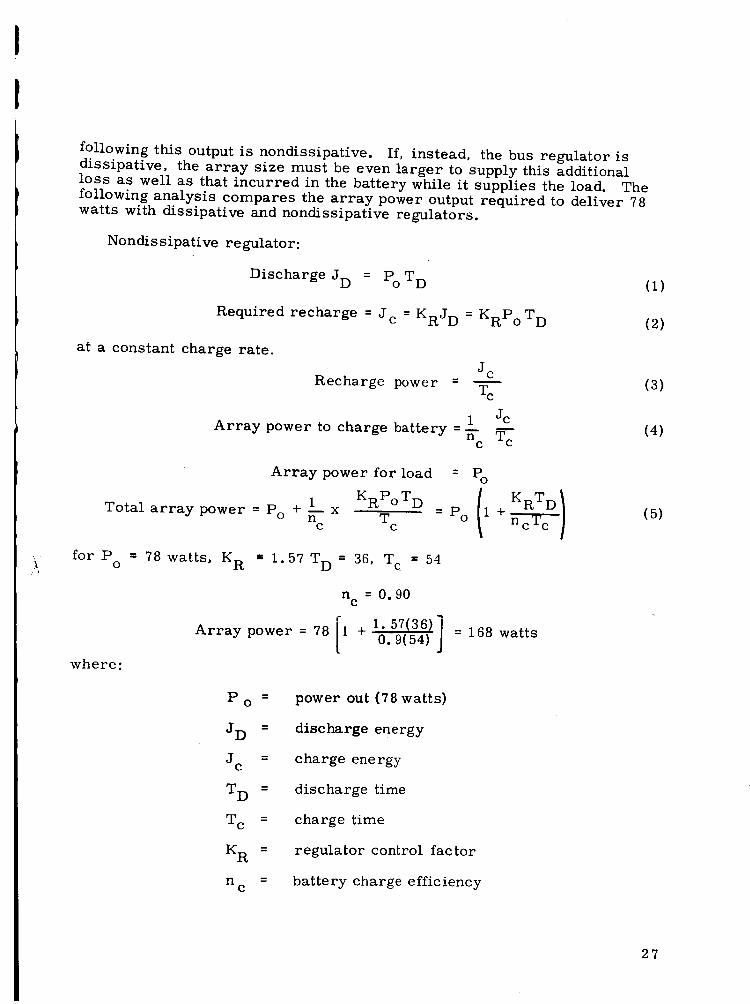
following this output is nondissipative. If, instead, the bus regulator isdissipative, the array size must be even larger to supply this additionalloss as well as that incurred in the battery while it supplies the load. Thefollowing analysis compares the array power output required to deliver 78watts with dissipative and nondissipative regulators.
Nondissipative regulator:
Discharge JD = PoTD
Required recharge = Jc = KRJD = KRPoTD
at a constant charge rate.
Jc
Recharge power - Tc
i JcArray power to charge battery =n-c T"_
Array power for load = Po
KRPo TD ( KRTD /Total array power = Po + 1 x T - Po i +
nc c nc--c'r_c _
for Po = 78 watts, K R = 1.57 T D = 36, T c = 54
Array power = 78
n = 0.90C
0.9(54)= 168 watts
where:
Po =
JD =
j =C
T D =
T c =
K R =
n =c
power out (78 watts)
discharge energy
charge energy
discharge time
charge time
regulator control factor
battery charge efficiency
(1)
(2)
(3)
(4)
(5)
27
EO =
EBD =
EBC =
bus voltage
battery discharge voltage
battery charge voltage
To meet this requirement, the number of series solar cells must be suffi-
cient to develop a voltage of EBC + 1 or 44 volts at the 31 ° sun angle. Under
conditions of 64 ° sun angle, the array voltage rises to about 55 volts due todrop in temperature. The number of parallel cells must then be such as to
168supply _ = 3.0 5 amperes.
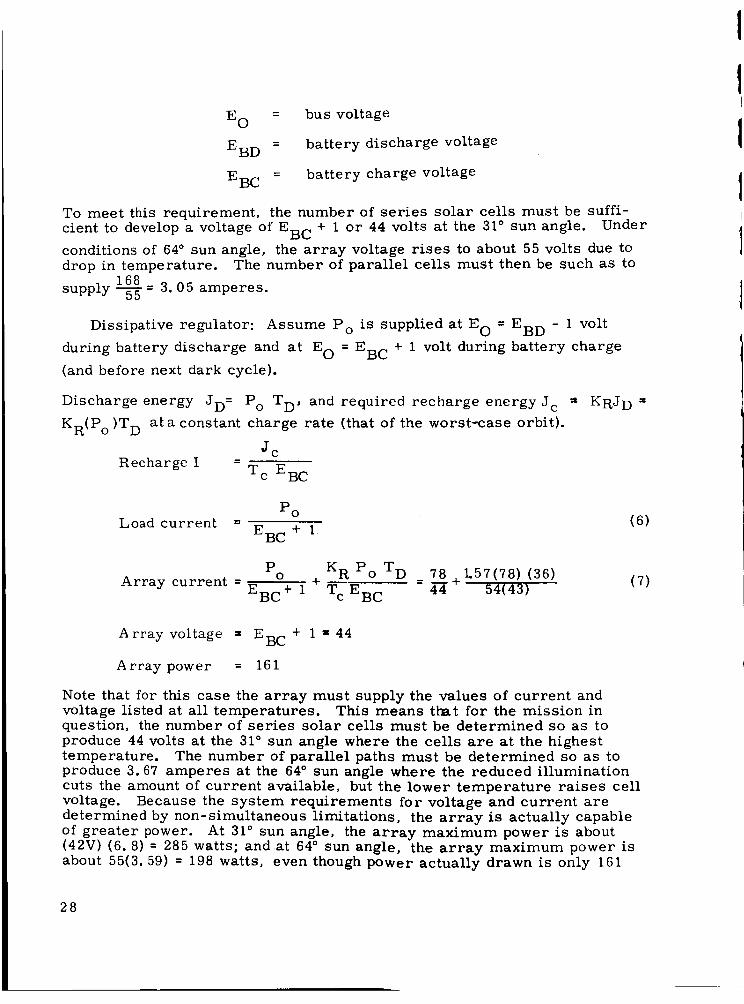
Dissipative regulator: Assume Po is supplied at E O = EBD - 1 volt
during battery discharge and at E O = EBC + 1 volt during battery charge
(and before next dark cycle).
Discharge energy JD = Po TD" and required recharge energyJc
KR(P o)T D at a constant charge rate (that of the worst-case orbit).
JcRecharge I =
Tc EBC
_, KRJ D -,
PoLoad current -- (6)
E +1BC
Array current = Po + KR Po TD
EBC + 1 T c EBC
78 L57(78) (36)= 4--_+ " 54(43)
(7)
Array voltage - EBC + 1" 44
Array power = 161
Note that for this case the array must supply the values of current andvoltage listed at all temperatures. This means that for the mission inquestion, the number of series solar cells must be determined so as toproduce 44 volts at the 31 ° sun angle where the cells are at the highesttemperature. The number of parallel paths must be determined so as toproduce 3.67 amperes at the 64 ° sun angle where the reduced illuminationcuts the amount of current available, but the lower temperature raises cellvoltage. Because the system requirements for voltage and current aredetermined by non-simultaneous limitations, the array is actually capableof greater power. At 31 ° sun angle, the array maximum power is about(42V) (6.8) = 285 watts; and at 64 ° sun angle, the array maximum power isabout 55(3.59) = 198 watts, even though power actually drawn is only 161
28
watts. In addition, it should be recognized that, since array size was basedon extreme values of current and voltage which are not simultaneous, noneof the apparently surplus power is available to the system. The array mustthus be larger in order to supply a smaller amount of power, relative to thesystem utilizing "nondissipative" charge regulation.
Solar Cell Array
Two different basic configurations were considered: one in which the solarcells were mounted on the body of the spacecraft and the other where all orpart of the cells are mounted on deployable panels. In addition, manyalternatives of this latter arrangement were studied and three of the mostpromising are presented here.
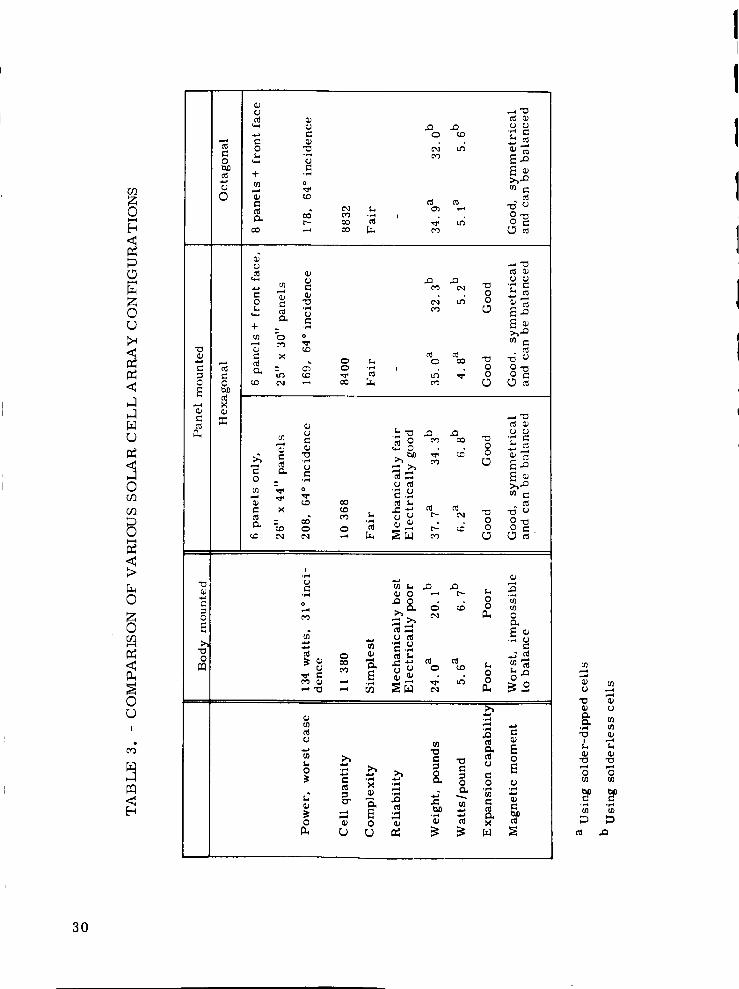
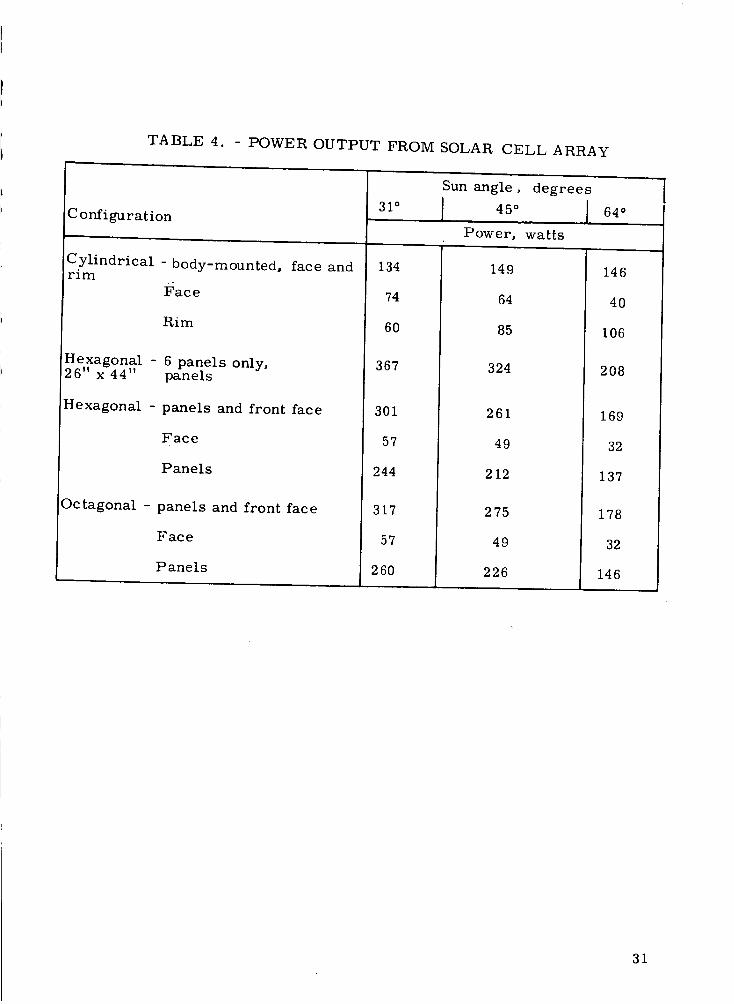
The basic criteria for evaluation were 168 watts under the worst conditionsof sun angle, simplicity, low weight, high reliability, and a minimum mag-netic moment. These items are discussed for the various configurations,and a summary of the features is presented as Table 3. A comparison ofthe power available is presented in Table 4. It should be noted that basicpower requirements increased to 189 watts and array temperatures in-creased as the design concept evolved and calculations were refined. Allof these changes are reflected in the configuration selected.
C2rlindrical - body-mounted cells. -- The simplest configuration from amechanical standpoint is to mount the solar ceils to the body of the space-craft. Using the entire vehicle front face and cylindrical area (except forports) for cells, it is possible to generate approximateiy 134 watts of arraypower in the worst case (sun-line spin*axis angle of 31 °) using a little over11 000 body-mounted 2 x 2 cm solar ceils. Further system refinement mightshow that it is marginally possible to meet the power requirement withoutthe need for any auxiliary solar array surfaces, but additional growth couldbe met only by lengthening the cylinder, and the cost would be relativelyhigh because of the large number of cells needed.
This power was estimated assuming the mean effective temperature for the
front faceand cylindrical areas would be respectively 89° C and 2° C for the31° sun-line tospin-axis angle,75 ° C and 18° C for the 45° angle, and40 ° C and
33 ° C for the 64 ° angle.
The body-mounted configuration analyzed is for a spacecraft concept wtiichconsists of a 44-inch long spacecraft with end-mounted starmappers and sun-shaded radiometer. The present configuration, which is a spacecraft 40-inches long with rim-mounted starmappers and sunshaded radiometer, hassufficient cell mounting area for approximately 100-_vatts array power out-put at 64-degrees sun angle. The present configuration also would presentcell connection problems since available rim area is not evenly dividedbetween the six sides.
29
rT_Zo
Z0D
N
50
0
2:0
0
!
_4
_a
e_
e_ _ ._0 _
(J _ o,q,
e_
t'-
,1_ ,.Q 0 0.,-4 _
0
..0 o
C_ _ X0 L
m _
0
0 ._5 _'_.._ _ _.
"0
0
0
C_
I
o _ c_ _
_ = _ o
• _
3O
TA BLE 4. - POWER OUTPUT FROM SOLAR CELL ARRAY
Configuration
Cylindrical - body-mounted, face andrim
Face
Rim
Hexagonal - 6 panels only,26" x 44" panels
Hexagonal - panels and front face
31 °
134
74
60
367
Face
Panels
Octagonal - panels and front face
Face
Panels
301
57
244
317
57
260
Sun angle, degrees
45° I
Power, watts
149
64
85
324
261
49
212
275
49
226
64 °
146
40
106
208
169
32
137
178
32
146
31
The optimum design would utilize 133 cells in series on the front face and 106cells in series on the cylindrical elements to provide the best overall balancefor the requirement of 44 volts (after isolation diode drop). For the casesdefined above, the maximum power voltages of these solar cell strings on thefront face would be 44, 47.5, and 55.7 volts, respectively, for the 31% 45°,
and 64 ° cases. For the cylindrically mounted strings, the maximum powervoltages would be 52.2, 49.0, and 46.0 volts, respectively, for the threespacecraft orientations.
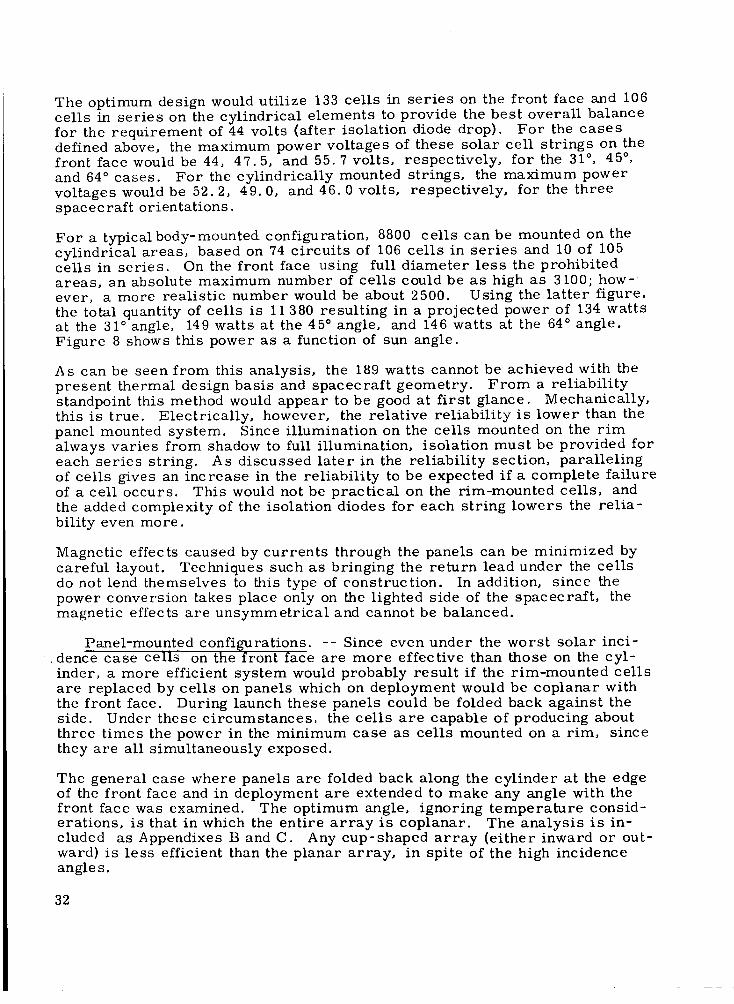
For a typical body-mounted configuration, 8800 cells can be mounted on thecylindrical areas, based on 74 circuits of 106 cells in series and 10 of 105cells in series. On the front face using full diameter less the prohibitedareas, an absolute maximum number of ceils could be as high as 3100; how-ever, a more realistic number would be about 2500. Using the latter figure,the total quantity of cells is 11 380 resulting in a projected power of 134 wattsat the 31 ° angle, 149 watts at the 45 ° angle, and 146 watts at the 64 ° angle.Figure 8 shows this power as a function of sun angle.
As can be seen from this analysis, the 189 watts cannot be achieved with thepresent thermal design basis and spacecraft geometry. From a reliabilitystandpoint this method would appear to be good at first glance. Mechanically,this is true. Electrically, however, the relative reliability is lower than thepanel mounted system. Since illumination on the cells mounted on the rimalways varies from shadow to full illumination, isolation must be provided foreach series string. As discussed later in the reliability section, parallelingof cells gives an increase in the reliability to be expected if a complete failureof a cell occurs. This would not be practical on the rim-mounted cells, andthe added complexity of the isolation diodes for each string lowers the relia-bility even more.
Magnetic effects caused by currents through the panels can be minimized bycareful layout. Techniques such as bringing the return lead under the cellsdo not lend themselves to this type of construction. In addition, since thepower conversion takes place only on the lighted side of the spacecraft, themagnetic effects are unsymmetrical and cannot be balanced.
Panel-mounted configurations. -- Since even under the worst solar inci-•dence case cells on the front face are more effective than those on the cyl-inder, a more efficient system would probably result if the rim-mounted cellsare replaced by cells on panels which on deployment would be coplanar withthe front face. During launch these panels could be folded back against theside. Under these circumstances, the cells are capable of producing aboutthree times the power in the minimum case as ceils mounted on a rim, sincethey are all simultaneously exposed.
The general case where panels are folded back along the cylinder at the edgeof the front face and in deployment are extended to make any angle with thefront face was examined. The optimum angle, ignoring temperature consid-erations, is that in which the entire array is coplanar. The analysis is in-cluded as Appendixes B and C. Any cup-shaped array (either inward or out-ward) is less efficient than the planar array, in spite of the high incidenceangle s.
32
(/1
t13
,2(D
Of2.
360
320
280
24O
2O0
160
120
8O
4O
Face mounted, 85% __z
I I I I I I I
0 10 20 30 40 50 60 70
Sun angle, degrees
Figure 8. Uaregulated Power Output as a Fu;mtio_l of Sun Aklgle,Body-MouLated Cells - 44" Spacecraft
33
Several possible configurations have been examined, including large panelswhich wculd be mounted against the front surface and rotated or folded out asin the Lunar Orbiter Vehicle. It has been tentatively concluded that the best
approach would be to use panels folded back along the side surfaces duringlaunch. Two hexagonal configurations (one with cells on the front face, andone with cells only on the panels) and one octagonal configuration (cells on thefront face) were investigated. Total volume would be slightly reduced when
compared to the circular cylinder; however, the flat mounting faces would beeasier to fabricate and could be more easily employed as mounting surfaces
for internal hardware. The panels could also be readily separable from the
main body to minimize handling damage.
Although the panel arrangement is more complex than the body-mounted case,reliable hinge and erection mechanisms are available which allow a high con-fidence level in the deployment of the panels. Electrical reliability advantages
in the ability to parallel cells and the simpler design would seem to outweighmechanical disadvantages. Panels are also interchangeable; thus logistics
problems are reduced.
Expansion capabilities are easily obtained on two configurations by addingmore cells to the panels. In the case where no cells are used on the frontface, the panel is filled. Expansion is possible by increasing the length of
the panel or by adding cells to the front face.
The magnetic moment from the cell currents can be minimized and, if
necessary, virtually eliminated by careful cell layouts. Normal good prac-tice in laying out circuits so that loops are as small as possible and opposingcurrents are adjacent will usually suffice. If more reduction is necessaryand the added weight and expense can be tolerated, magnetic effects can be
virtually eliminated by returning the current through a conductor the widthof the circuit mounted directly below the cells. It should be noted that, unlike
the body mounted case where some of the ceils were always shadowed, this
array is symmetrical about the axis of the spacecraft, and the effects of cur-rents in the array should be virtually negligible. Although no absolute valuewas given for the magnetic moment, it is felt that normal good practice willbe sufficient.
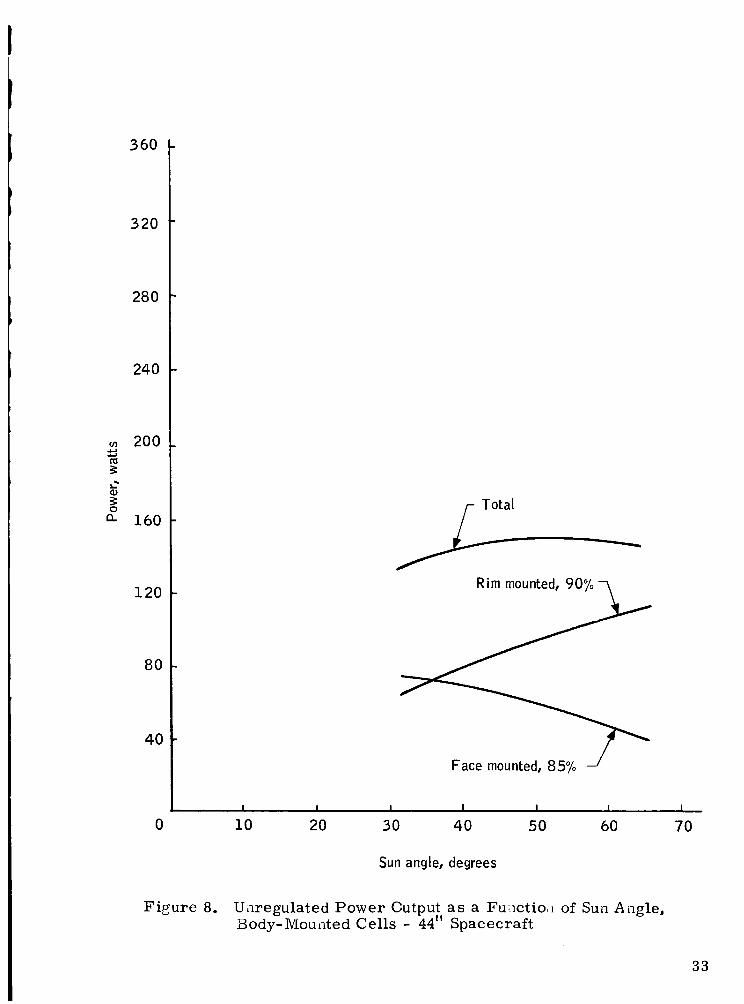
Hexagonal with cells on panels and front face: The first, illustrated in
Figure 9, utilizes a hexagonal body with six deployable paddles with cells onthe front face. For the minimum case, dimensions of these paddles are ten-
tatively 24. 13-inches wide by 30-inches long. On each paddle would be placecisix rows of cell groups. Each row consists of 36 series-connected submod-
ules, each with five 2x2 cm cells in parallel. Three of these rows would
make one string of 108 cells. Specific layouts were made on the front faceutilizing 1920 cells divided into two circuits of 8 in parallel by 120 in series.The maximum power output would be 57 watts at 31 ° incidence at 40.2 volts,49 watts at 45 ° incidence at 42.7 volts, and 32 watts at 64 ° incidence at 50.3volts.
The power levels from the six deployable units at equilibrium temperature at
the three incidence angles would be approximately 244 watts, 212 watts, and
34
(,#'i
i.i'i
X
i#i
o_
t'---
i#)
¢JI
0 cO• _..
fI
I
q
0
_× ='-,t
e- 0
- \-- ...__
ii
i <,,,
V_
\\
/
I
Ir-3
o
IB IB
C'd
C'
0
\I \
\
I/!i
r
0
O0
0
II
ill
0
0
I'--
0
II
0
C"0
l#)
¢.)
0
0
O0
II
'-0
0
I-
"oo
r--I
o
M(_
0
0
r.)
r-..t
r..)
0
.r..I
35
137 watts, respectively. Adding these outputs to the 1920 body-mounted cellsfor this design, the total system outputs would be 301 watts, 261 watts, md
169 watts at sun angles of 31 °,45 °, and 64 °, respectively.
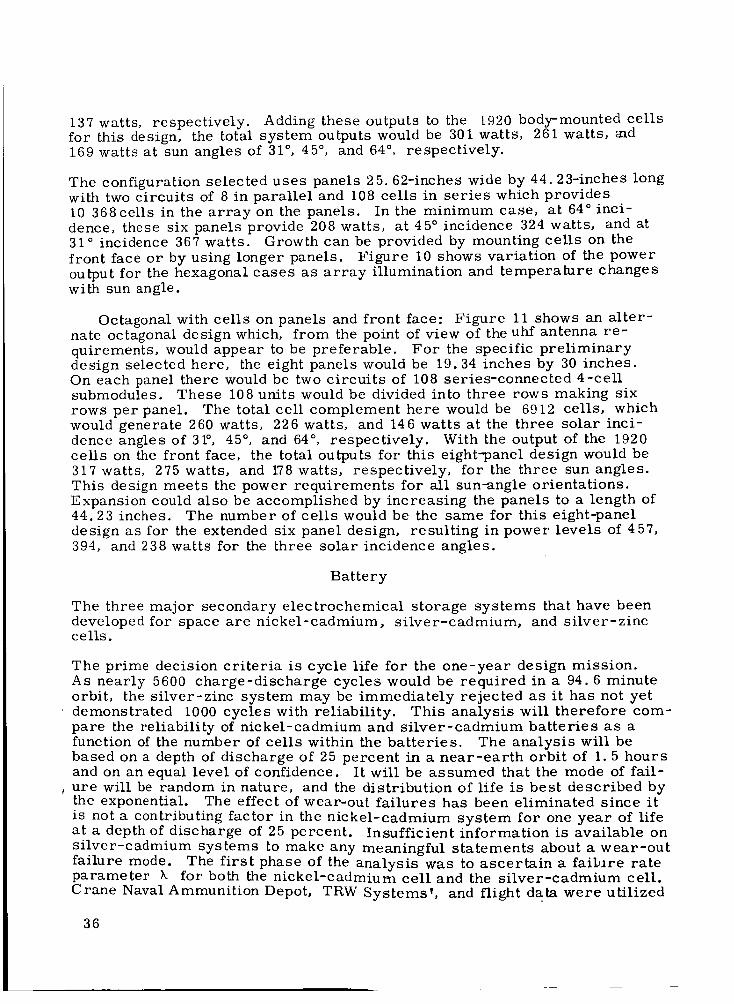
The configuration selected uses panels 25.62-inches wide by 44.23-inches longwith two circuits of 8 in parallel and 108 cells in series which provides10 368cells in the array on the panels. In the minimum case, at 64 ° inci-dence, these six panels provide 208 watts, at 45 ° incidence 324 watts, and at31 ° incidence 367 watts. Growth can be provided by mounting cells on thefront face or by using longer panels. Figure 10 shows variation of the poweroutput for the hexagonal cases as array illumination and temperature changeswith sun angle.
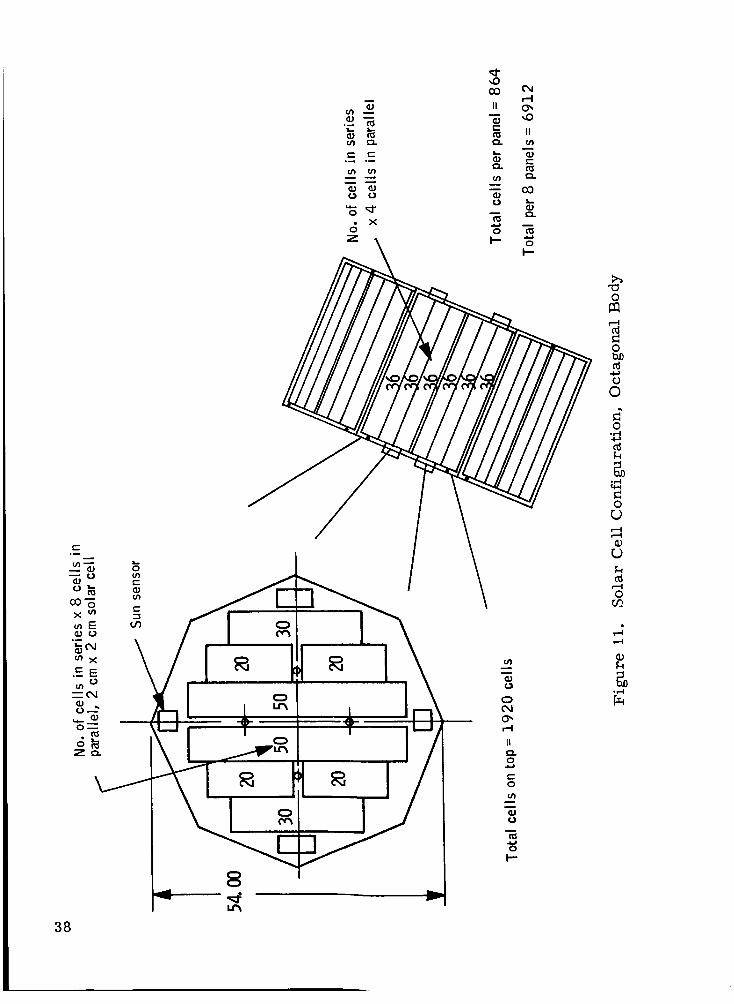
Octagonal with cells on panels and front face: Figure 11 shows an alter-nate octagonal design which, from the point of view of the uhf antenna re-quirements, would appear to be preferable. For the specific preliminarydesign selected here, the eight panels would be 19.34 inches by 30 inches.On each panel there would be two circuits of 108 series-connected 4-cellsubmodules. These 108 units would be divided into three rows making six
rows per panel. The total cell complement here would be 6912 cells, whichwould generate 260 watts, 226 watts, and 146 watts at the three solar inci-dence angles of 31°, 45 °, and 64 °, respectively. With the output of the 1920cells on the front face, the total outputs for this eight"panel design would be317 watts, 275 watts, and 178 watts, respectively, for the three sun angles.This design meets the power requirements for all sun--angle orientations.Expansion could also be accomplished by increasing the panels to a length of44.23 inches. The number of cells would be the same for this eight-paneldesign as for the extended six panel design, resulting in power levels of 457,394, and 238 watts for the three solar incidence angles.
Battery
The three major secondary electrochemical storage systems that have beendeveloped for space are nickel-cadmium, silver-cadmium, and silver-zinccells.
The prime decision criteria is cycle life for the one-year design mission.As nearly 5600 charge-discharge cycles would be required in a 94.6 minuteorbit, the silver-zinc system may be immediately rejected as it has not yetdemonstrated 1000 cycles with reliability. This analysis will therefore com-pare the reliability of nickel-cadmium and silver-cadmium batteries as afunction of the number of cells within the batteries. The analysis will bebased on a depth of discharge of 25 percent in a near-earth orbit of 1.5 hoursand on an equal level of confidence. It will be assumed that the mode of fail-
, ure will be random in nature, and the distribution of life is best described bythe exponential. The effect of wear_out failures has been eliminated since it
is not a contributing factor in the nickel-cadmium system for one year of lifeat a depth of discharge of 25 percent. Insufficient information is available onsilver-cadmium systems to make any meaningful statements about a wear-outfailure mode. The first phase of the analysis was to ascertain a failure rateparameter k for both the nickel-cadmium cell and the silver-cadmium cell.
Crane Naval Ammunition Depot, TRW Systems', and flight data were utilized
36
u_
"4
O
Oo.
360
320
28O
240
2OO
160
120
8O
4O
Power- configurationwith panels only
Power=total
I I I I I I 10
0 i0 20 30 40 50 60 70
Sun angle, degrees
180
160
140
120
100
80
60
4O
2O
(,.)o
E
I--
Figure 10. U::lregulated Power Output as a Function of Sun Angle,Basic Co.nfiguration with Fold-Out Pa,_els
37
38
C.)
(3",--I
II
oc-o
I--
0
0b_c_
¢.)C)
0.,-I
0
r-i,ml
c_
0
°,-I
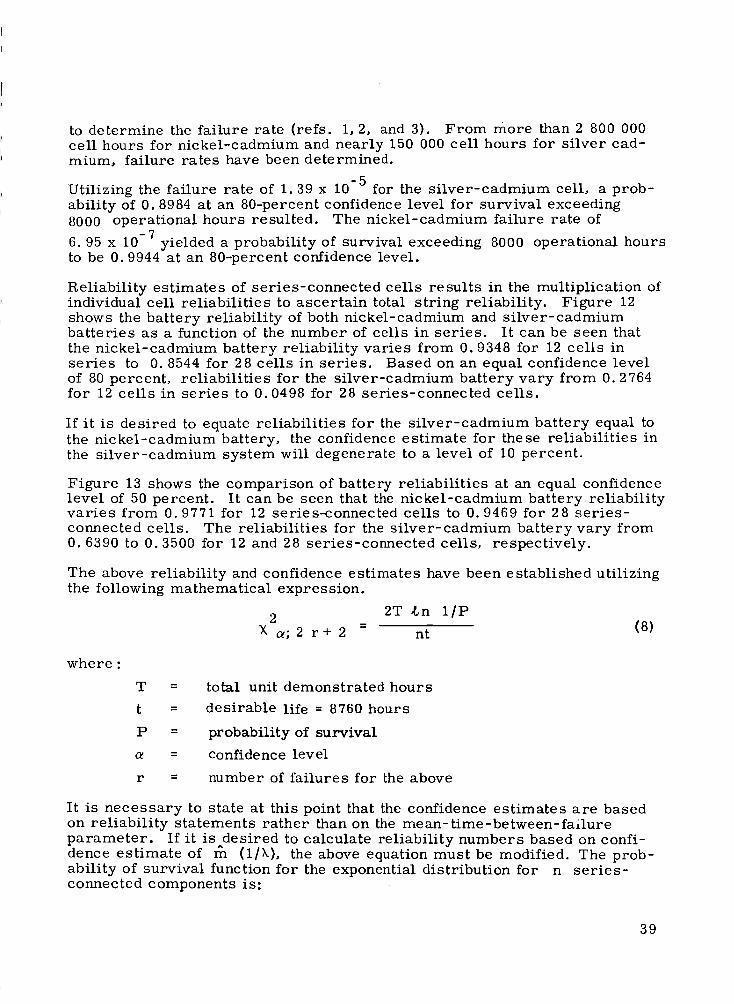
to determine the failure rate (refs. 1, 2, and 3). From more than 2 800 000cell hours for nickel-cadmium and nearly 150 000 cell hours for silver cad-mium, failure rates have been determined.
-5Utilizing the failure rate of 1.39 x 10 for the silver-cadmium cell, a prob-ability of 0. 8984 at an 80-percent confidence level for survival exceeding8000 operational hours resulted. The nickel-cadmium failure rate of
-76.95 x 10 yielded a probability of survival exceeding 8000 operational hoursto be 0. 9944 at an 80-percent confidence level.
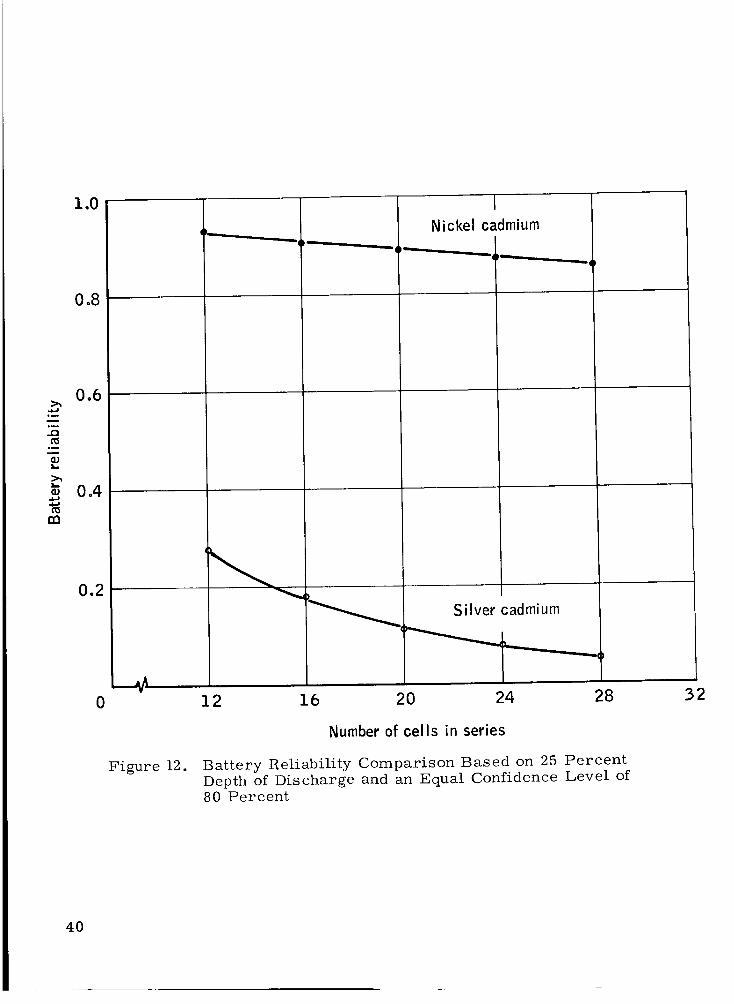
Reliability estimates of series-connected cells results in the multiplication ofindividual cell reliabilities to ascertain total string reliability. Figure 12shows the battery reliability of both nickel-cadmium and silver-cadmiumbatteries as a function of the number of ceils in series. It can be seen that
the nickel-cadmium battery reliability varies from 0. 9348 for 12 cells inseries to 0. 8544 for 28 cells in series. Based on an equal confidence levelof 80 percent, reliabilities for the silver-cadmium battery vary from 0. 2764for 12 cells in series to 0.0498 for 28 series-connected cells.
If it is desired to equate reliabilities for the silver-cadmium battery equal tothe nickel-cadmium battery, the confidence estimate for these reliabilities inthe silver-cadmium system will degenerate to a level of 10 percent.
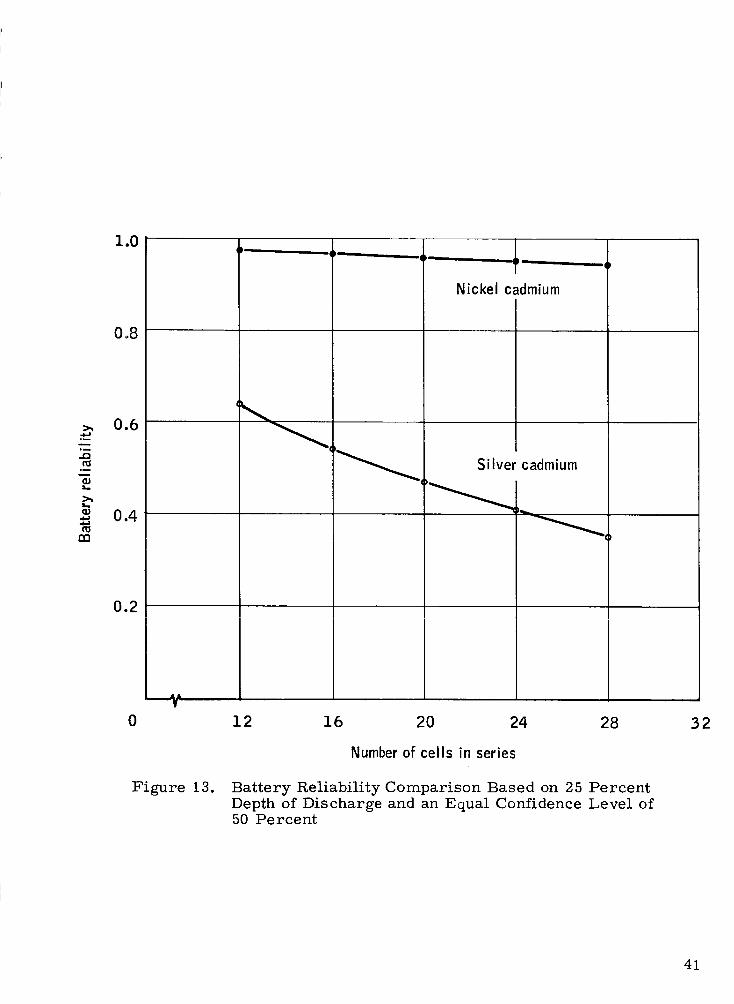
Figure 13 shows the comparison of battery reliabilities at an equal confidencelevel of 50 percent. It can be seen that the nickel-cadmium battery reliabilityvaries from 0. 9771 for 12 series-connected cells to 0. 9469 for 28 series-
connected cells. The reliabilities for the silver-cadmium battery vary from0. 6390 to 0. 3500 for 12 and 28 series-connected cells, respectively.
The above reliability and confidence estimates have been established utilizingthe following mathematical expression.
2T 2,n lIP2= (8)X _; 2 r + 2 nt
where :
W _.
t =
p =
=
r =
total unit demonstrated hours
desirable life = 8760 hours
probability of survival
confidence level
number of failures for the above
It is necessary to state at this point that the confidence estimates are basedon reliability statements rather than on the mean-time-between-failureparameter. If it is desired to calculate reliability numbers based on confi-dence estimate of r_a (l[k), the above equation must be modified. The prob-ability of survival function for the exponential distribution for n series-connected components is:
39
om
m
1.0
0.8
0.6
0.4
0.2
A^
0 12 16
I
Nickel cadmium
Silver cadmium
-----._..._.
20 24 28 32
Number of cells in series
Figure 12. Battery Reliability Comparison Based on 25 PercentDepth of Discharge and an Equal Confidence Level of80 Percent
4O
1.0
0.8
0.6
0.4
nn
0.2
|h L
Nickel cadmium
'_ Silver cadmium
0 12 16 20 24 28 32
Number of cells in series
Figure 13. Battery Reliability Comparison Based on 25 Percent
Depth of Discharge and an Equal Confidence Level of50 Percent
41
-nt/r_R(t) = P = e (9)
where n = number of cells.
Solving equation (9) for r_ and substituting into equation (8) we get:
2T 1
ten- 2 - k
Xa; 2r+ 2
(10)
Based on the total number of test hours (T = 2 876 242) and the number offailures (r=2), there is 50 percent confidence that l_n > 1 077 244.
Substituting this number in equation (9), a reliability can be calculated fora 28-cell battery having a reliable life of 8760 hours. The calculated relia-bility is 0. 795 based on a 50 percent confidence of the mean-time-betweenfailures. This calculation is not to be confused with the earlier calculation
which gives a confidence estimate of reliability number.
Based on the above analysis, the nickel-cadmium system has the higherreliability, and the reliability increases as the number of series-connectedcells decreases.
The prime use found for silver-cadmium batteries in space applications hasbeen in satellites where the nonmagnetic construction of batteries is neces-sary. The majority of applications of silver-cadmium has been in satelliteswith orbital periods of 5 to 24 hours, which allows lower charge rates andfewer actual discharge cycles. The apparent watt-hour per pound advantageof silver-cadmium over nickel-cadmium is approximately 17 W-hr]lb con-
sidering ceils only, and 12 W-hr/lb complete for batteries in the five to sixampere-hour capacity range.
One major difficulty with the silver-cadmium cell is its inability to be over-charged at rates above C]100. The more complex and less permeable sepa-rator system used in the silver-cadmium cell to control the migration ofsilver away from the silver electrode also restricts diffusion of oxygen tothe cadmium electrode, causing a higher oxygen equilibrium pressure in thecell for a given overcharge rate. However, the charge efficiency of thesilver electrode is high, on the order of 97 percent, and virtually no oxygenis produced until the electrode is about 90 percent charged. The silver-cadmium cell shows a sharp voltage rise near end of charge and provides amethod of charge control by voltage that appears quite attractive. Voltagelimited charging of the cell can be used to reduce current to the safe over-charge level as full charge is reached. While this method is effective forsingle-ceU charging, a problem is encountered in charging series strings ofcells. As the end-of-charge voltage rise is relatively rapid and overchargecapabilities limited, minor differences in charge efficiencycan cause severeimbalance in cell end-of-charge voltages. Individual cell voltages risingabove 1.65 volts thus generate internal gas pressures that do not readilyrecombine and limit the attainment of full charge on other cells in the string.
42
Extensive cell-selection procedures must be used to reduce this imbalance toan acceptable level.
A charge technique has been developed to minimize unbalance problems. Byreducing the charge voltage limit as current decreases to a particular value(indicating the approach of end of charge), the current is further reduced toa value well within overcharge ability without forcing voltage higher. Thetechnique has been used on IMP III successfully; however, maximum chargerate was approximately C / 10, indicating longer orbits than 100 minutes(ref. 4).
The charge characteristic of nickel-cadmium cells and batteries has no sharpvoltage transition at full charge. It is important when charging at high ratesto terminate or reduce the charge current before the cell potential rises to alevel high enough to permit the evolution of hydrogen. This limiting voltageis a function of temperature and is depicted by Figure 14. The nickel-cad-mium system does permit overcharging, and the rates of acceptable maxi-mum overcharge are defined in Figure 15. The current rates are acceptablefor continuous overcharge, but much lower rates may be used to maintainfull charge if desired.
The nickel-cadmium cell is less efficient during charge than the silver-cad-mium cell, and the efficiency is a function of charge rate and temperature.At C/2 rates, the watt-hour efficiency would vary from 80 percent at -4%_ toabout 65 percent at 40°C. Comparable ampere-hour efficiency to silver-cadmium's 95-percent efficiency would be 85 percent for nickel-cadmium at26_C.
A development that has added greatly to the simplification of rechargingnickel-cadmium batteries is the Adhydrode adsorbed, hydrogen third electrode.This third electrode is sensitive to oxygen and produces a signal which isproportional to its partial pressure within the cell. Within the nickel-cad-mium cell, oxygen is evolved from the positive (Ni) electrode as the cellapproaches a state of full charge. When connected to the negative electrodethrough external circuitry, oxygen within the cell is combined with adsorbedhydrogen on the third electrode. The combination requires electron flowbetween the third electrode and the negative electrode. It is this currentflow or the voltage drop across an external resistance that can readily beused to indicate a full state of charge.
The advantage of being able to determine end of charge can best be demon-strated by comparison with alternate charge techniques. Initially, satellitebatteries were sized to allow the energy discharged during eclipse to be re-placed at the battery safe overcharge rate. For example, if 1.5 amperehours were discharged during eclipse, and 60 minutes were available forrecharge and required overcharge, a two-ampere rate would be required.A battery capacity of 20 A-h would be used to allow recharge at the safe rateof C/ 10. As satellite power demand increased, battery size could becomeextremely large when limited to less than 10-percent usage. The next stepuzilized the high rate recharge capability of nickel-cadmium when partiallydischarged. A stepped, taper charge system, with initial rates of
43
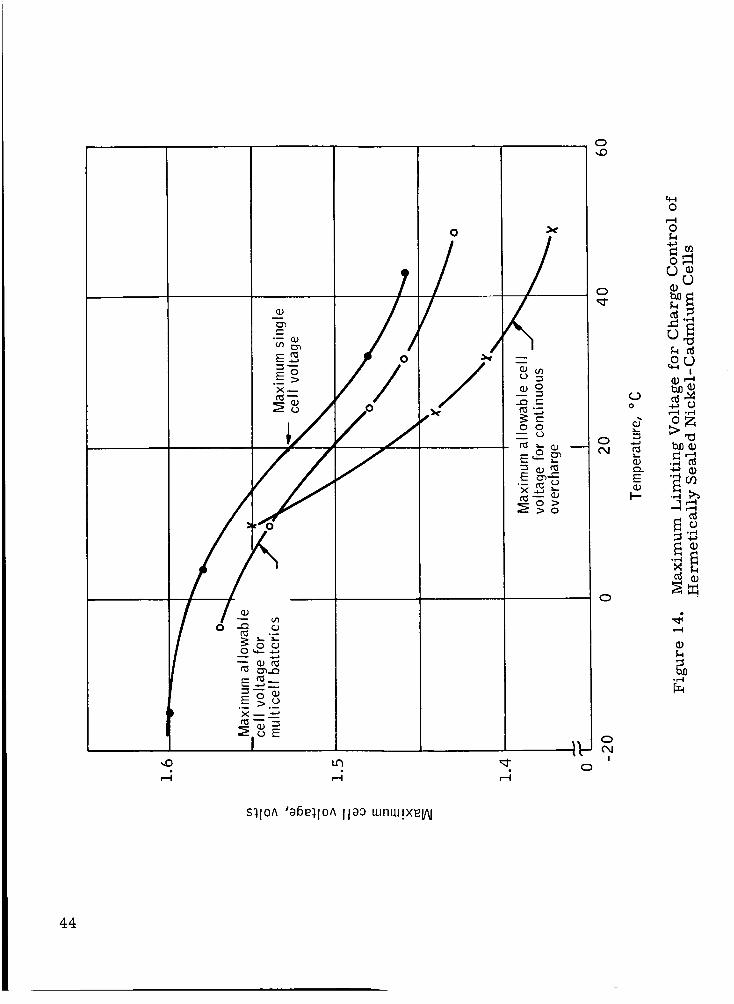
,,,0
E_=-8E>
f
E_--
) x_-_
E
u3
_40
I--
o
0(xl
I
0e=..t
0
_mi---I
_rj
r..) ,_
or,)%-t
I
e-..l .,=4
•4 _
i1)
.,,-4
S1IOA 'a6E:IIOA IlaO umu_!x_IA]
44
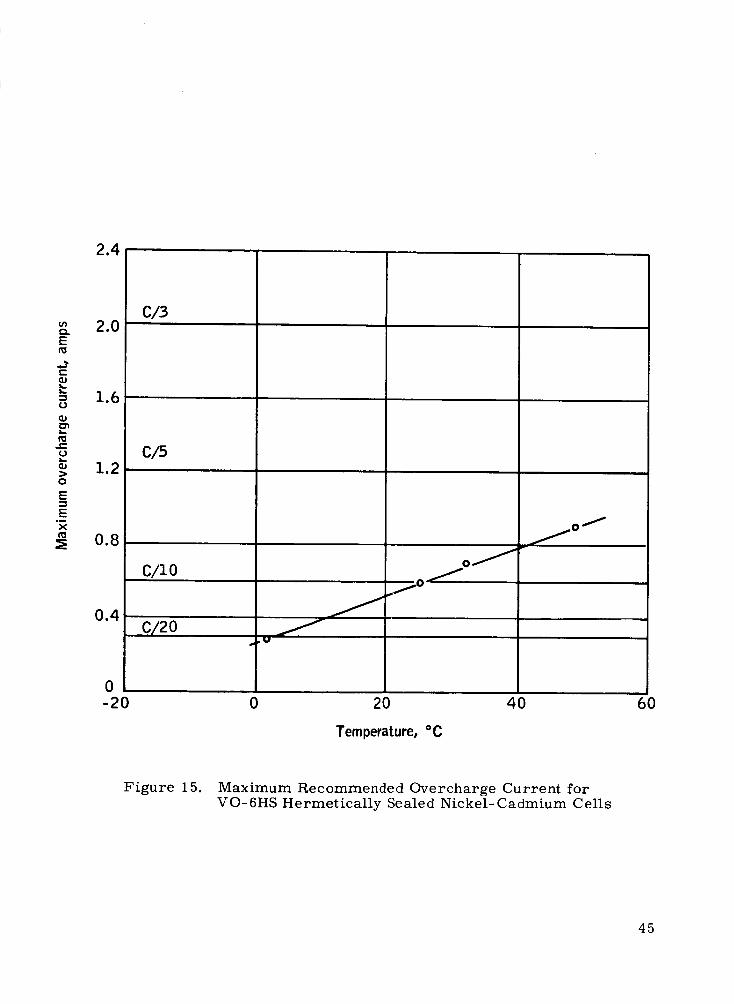
2.4 '
u_
Et_
¢-
¢-¢.)
O
E
E
xt_
2.0
1.6
1.2
0.8
0.4
0-20
C/3
C/5 ¸
C/lO
C/20_ p II.I
0 20 40
Temperature, oC
6O
Figure 15. Maximum Recommended Overcharge Current forVO-6HS Hermetically Sealed Nickel-Cadmium Cells
45
approximately C [2 and final rates within overcharge capability, has been
developed. Switching to lower current steps was accomplished by sensingbattery voltage. The charge cycle for a 20 A-h battery might be: charge atI0 amperes to voltage limit, switch to seven amperes to voltage limit, switchto five amperes to voltage limit, trickle charge at one ampere for remainderof charge period. This complex system, using temperature dependent voltagelimits, would be established based on empirieal testing to verify completion
of charge. Straight constant potential charging cannot be practically accom-plished because thermal runaway problems and associated temperature limit-ing methods are not compatible with long life in nickel-cadmium batteries.
There are two modes of charge-discharge cycling to which the HDS space-
craft battery can be subjected. The first mode is the more commonly usedand consists of a constant-current charge to a limiting voltage, which is com-pensated by temperature, followed by trickle charge. Based on the accuracyof injection into orbit, the charge-discharge cycle can vary between the ex-tremes of 70 rain charge/24 rain discharge, and 58 rain charge/36 rain dis-charge. If a two-ampere charge to a voltage limit, which is dependent ontemperature, followed by a trickle charge of 0.45 ampere is used, Table 5will show the capacity removed as a function of temperature as well as the ttotal capacity returned. Recharge requirements for 2 _C(35°F). 24°C(75°F),and 38_E(100°F) were assumed to be 108 percent, 115 percent and 125 percent,respectively. The voltage limits associated with the temperature were I. 56V,i. 50V, and I. 46V. Reviewing Table 5 shows that the cells are fully charged,and an excess amount of capacity is available. Some additional work must bedone to determine more accurately the charge efficiencies and voltage limitssince these are temperature dependent and hence are dependent upon vehiclethermal balance conditions.
Table 6 is similar to Table 5 except that it details the capacity removed andreturned for the 58 rain charge/36 min discharge mode of operation. It maybe seen that, ineither mode of operation, sufficient energy is available tocharge fully the battery when utilizing the two-step, constant-current chargeroutine.
The second mode of operation, utilizes the Adhydrode charge control tech-nique. Use of the Adhydrode enables maximum use of the energy availableand minimizes the heat dissipation within the battery. As the satellite entersthe sunrise portion of the orbit, the solar array is cold and, hence, able todeliver higher magnitudes of current. Since the battery is in a low state ofcharge when entering the sunrise portion, the charge efficiency is extremelyhigh and capable of accepting high charge currents. As the solar array in-creases in temperature, the current delivery capability decreases. Thestate of charge of the battery is increasing during the charge mode and,hence, its charge efficiency is decreasing. The two effects are compensatingeach other, resulting in a maximum and efficient energy utilization.
In the previous mode of operation, the charge rate was reduced to a tricklecharge when limiting voltage was reached. With the use of the Adhydrode, itis not necessary to reduce the current to a trickle charge at this point. Onecan continue charging at the maximum voltage limit until the Adhydrode
46
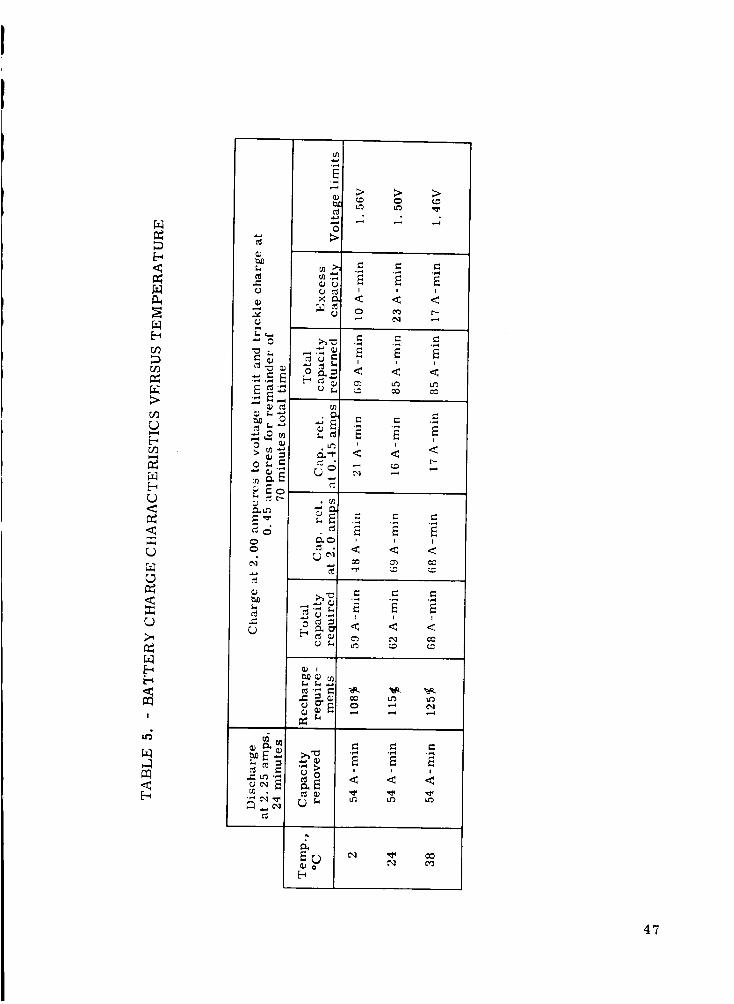
IzI
_q
_q
Ii4
O_Ii4
_q
_q
I
_q_q_q
I.
.el
¢2
"_ 0
0
I.
.[:'-' _" ;> I>
e-L ._.
m
. _. _. _-
._ CPI
•_ _ , , ,
47
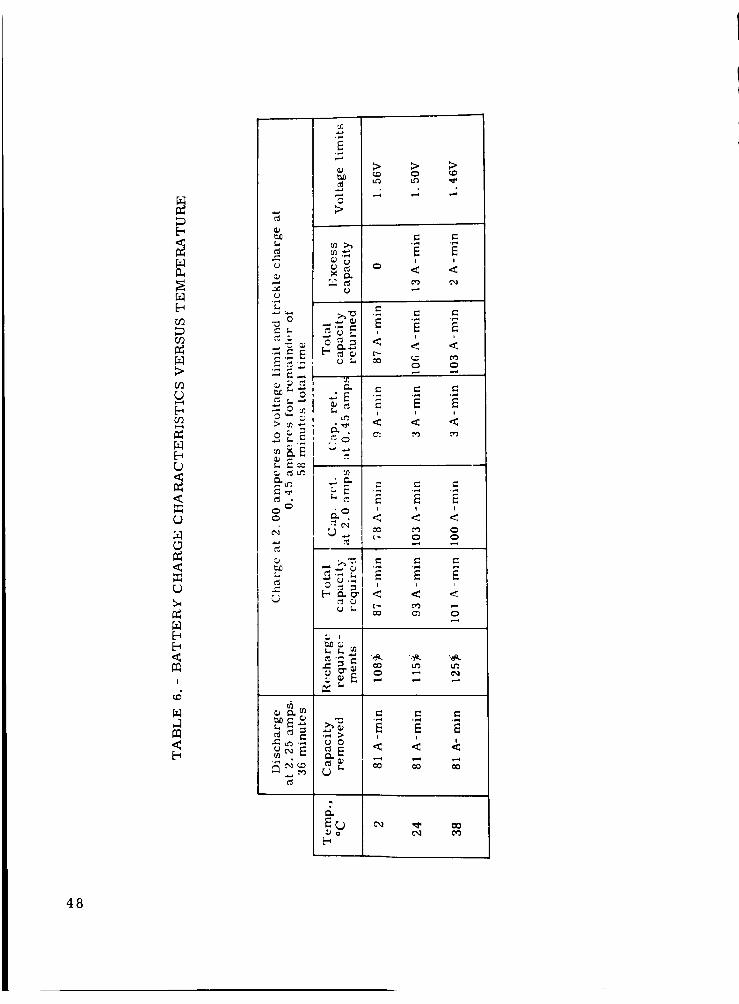
48
<
<
I
<
E
• , °
° - _ E "_ f:_ _'r_ ,_ ' ,
_ , , ,
i i I
E__o
[,-,
signals the end of charge, atwhich time the charge can be completely term-inated or the current may be reduced to some minimal value of about 0.1ampere.
If maximum energy utilization and minimum heat evolution are required, theAdhydrode charge control is recommended. If heat dissipation is not alimiting factor, a two-step, constant current charge control is recommended.Both techniques have demonstrated successful operation in excess of oneyear; however, the Adhydrode system has not been flown in a satellite to date.
Heat dissipation characteristics of a battery system is an important criteriain the design and selection of the battery. The objective here is to determinethe magnitude of energy which is being dissipated as waste heat in a 28-cell,six-ampere-hour battery using the third electrode charge control comparedto a standard 28-ce11, six-ampere-hour battery.
The amount of energy that will be dissipated when using the Adhydrode modeof charge control will be the difference between the total capacity requiredcolumn and the total capacity removed column (Tables 5 and 6). If theAdhydrode charge control mode is not used, the amount of energy that isbeing dissipated as heat will be the difference between the total capacity re-turned column and the total capacity removed column.
This information is summarized in Table 7. The associated power rejectionper orbit is tabulated with respect to the corresponding rejected capacity.Table 7 shows that the available power rejection of a 28-cell Adhydrodebattery is approximately five watts per orbit. The average power rejectionfor a standard 28-cell battery is approximately l0 watts per orbit. Thus,the power rejection for a standard battery is twice that of the Adhydrodebattery system, but the difference is of minor importance relative to thetotal electrical loss dissipated within the vehicle.
49
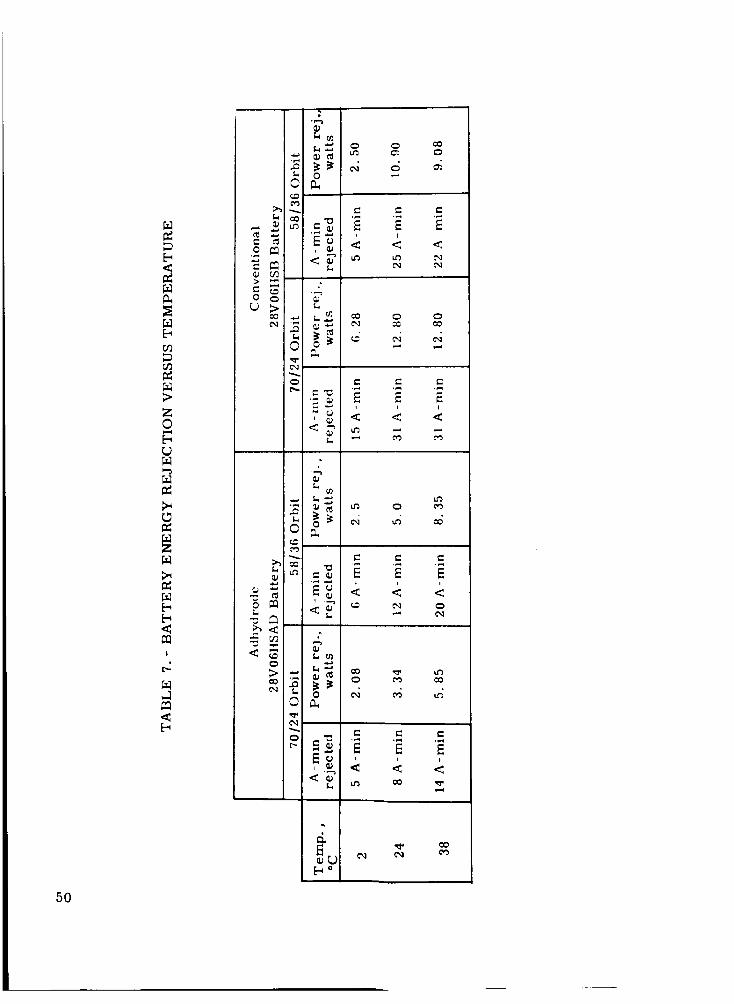
E_
E_
Z0
M
M
NI
N
b_
.r-,_
C _
o _
2 < :
° • _
_. e-,O '_ .,..,
,_'_
I
e- e-,
e., e-
l I
_4 _4
I
5O
_o

POWER SYSTEM CONCEPT
Electrical Power System
Philosophy of design. -- In accordance with the basic philosophy of the
study to achieve a reliable system design and not merely a high reliabilitynumber, certain fundamental requirements must be met as listed below:
The system must make minimum use of newly developed
components and must concentrate instead on the applicationof proven concepts and components.
The power system design must be coordinated with the require-
ments of other systems to minimize the possibility of difficultiesassociated with ground loops and other sources of interactionand error.
System operation should be independent of continual supervisionand control from the ground.
System requirements must be examined for worst case
operating conditions to avoid potentially marginal operationor over design.
Fault protection is required so that failure of any given sub-
system will not result in loss of the power system. In thisway, there is the maximum probability that any failure, evenone which results in loss of primary data, will not fail the
power supply and prohibit transmission to the ground ofevidence about the nature of the failure.
The fundamental requirements can immediately be translated into effects on
the tradeoff areas and design requirements and restrictions as follows:
The recommended battery is a proven type nickel-cadmiumbattery.
Power conditioning and all other subsystems must filter out noise
generated on their power and signal leads. They must also bedesigned for tolerance of line noise in accordance with uniformstandards.
Size of the solar array must be adequate to supply the requiredpower without possibility of a bistable operating point.
Design limitations. -- It is possible to translate the orbital performanceof the vehicle into a curve showing power availability, since this is a function
of the relationship of the spin axis to the sun line. It is also possible tocalculate an approximate value of power demand as a function of vehicle time
51
after launch, since the increased shadow fraction which occurs during certainportions of the year influences battery drain and, hence, the required powerto achieve recharge. It is to be expected that maximum power demand willoccur at precisely that time when minimum power is available, in view of thefact that maximum shadow fraction is correlated with least favorable sunangle. At the least favorable sun angle, the solar-array power capability isdrastically reduced from its maximum value. Therefore, at the time whenthe shadow fraction is highest, the battery will be required to supply greaterenergy, and the solar array will then be required to return this greateramount of energy in less time than for smaller shadow fractions. Thesefactors are plotted in Figures 16, 17, and 18 and clearly show that for theworst-case sun angle and shadow fraction associated with 3-sigma slow pre-cession for an October 28 launch the point in time at which the power systemhas the least available margin is at approximately 260 days after launch. Atthis time, the factors of increased battery drain and decreased power avail-ability are at their worst with respect to system margin. Examination of thepredicted performance for 3 sigma slow precession shows that for the nomi-nal launch date, October 28, there are approximately 90 days centered aboutday number 260 during which this orbit requires the power system to oper-ate with minimum margin. A study of the predicted sun-line angle showsthat the nominal orbit is by far the worst of all those studied from the view-point of maintaining a high performance margin by the power system. Otherorbits studied for alternate launch times show that at no time before daynumber 300 do any of the alternates reach 62-degrees inclination. For aSeptember i launch, there is a period of approximately 50 days centeredabout day number 325 during which the maximum excursion is only 63degrees. For a July i launch, there is a period of approximately 15daysfollowing day number 350 during which the sun angle is greater than 62degrees.
Refinement and finalizing of the performance requirements for the worst-case limitations result in the following requirements for the solar array:
Array area is determined by the need for load power andbattery charging, plus adequate margin at the 64-degreesun angle where least power is available and drain require-ments are highest.
Since array size is directly related to power demand, notenergy required, battery charging must be arranged, insofaras possible, to take place over the longest feasible time soas to minimize total power demand.
Peak power demands are not used to size the array becausethere is little load energy demanded, and the loss in batterycharge energy is negligible even if the array is loaded to thehigh current side of the maximum power point.
Required margin of array minimum power (at 64-degree sunangle) over actual average power demand is determined byexpected current fluctuations above average value.
52
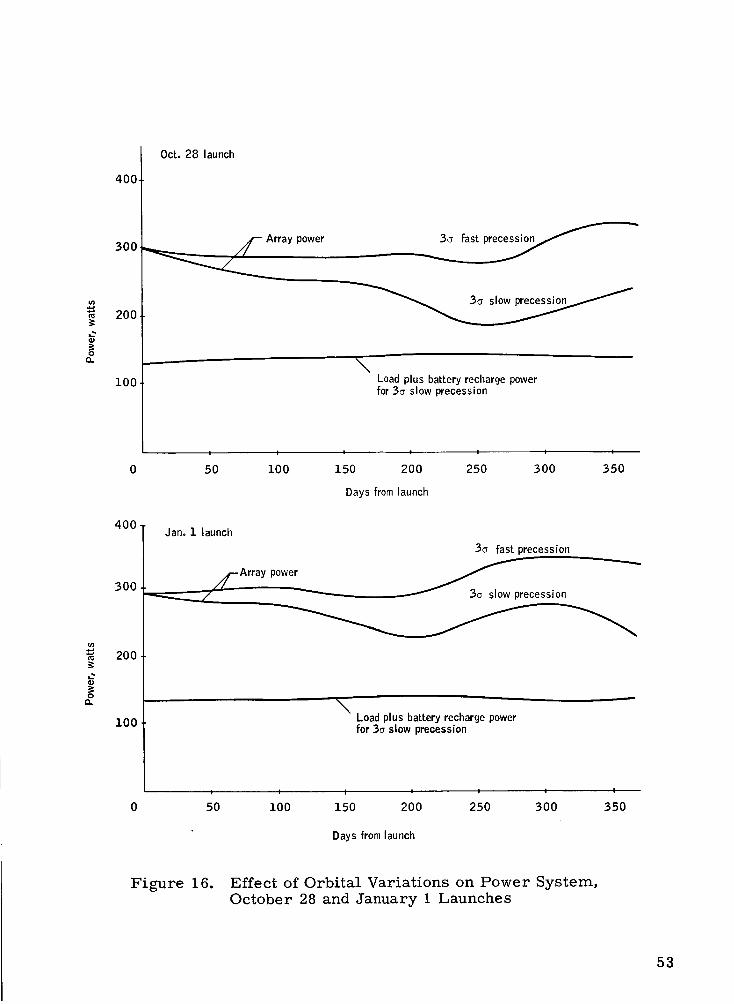
.w.,
(M
or,
,..?
o
400-
300
200
i00
400
300
200
i00
Oct. 28 launch
,___,- Array power
\Load plus battery recharge powerfor 3_ slow precession
I | i I I I I
50 i00 150 200 250 300 350
Days fromlaunch
Jan. 1 launch
30 fast precession
,_-Array power
\Load plus battery recharge powerfor 3_ slow precession
I i I I I I I
0 50 100 150 200 250 500 350
Days from launch
Figure 16. Effect of Orbital Variations on Power System,October 28 and January 1 Launches
53
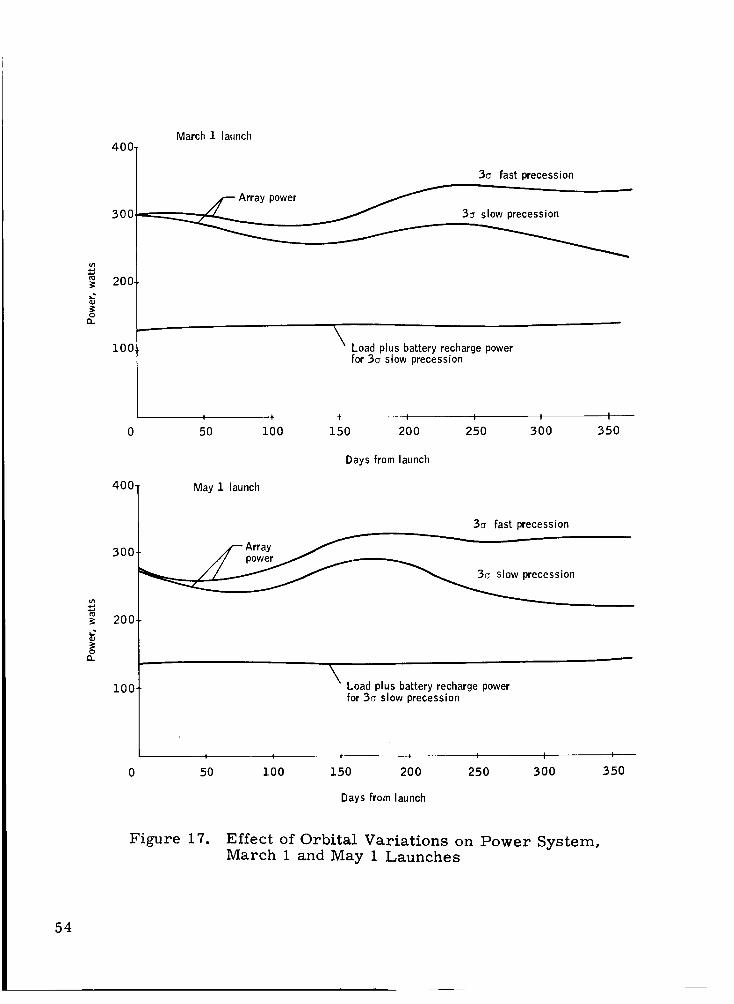
u_
,2_J
on
400,
500
200•
i00
400
March 1 launch
50 fast precession
Array power _
3_ slow precession
X Load plus battery recharge power
for 3c_ stow precession
I I I I I I I
50 i00 150 200 250 300 350
Days from launch
May 1 launch
o
o0_
300
200-
i00"
3s fast precession
• //-- Array// p°weL..-" __
__._ precession
\Load plus battery recharge powerfor 3a slow precession
I I I i I I I
50 i00 150 200 250 500 350
Days from launch
Figure 17. Effect of Orbital Variations on Power System,March 1 and May 1 Launches
54
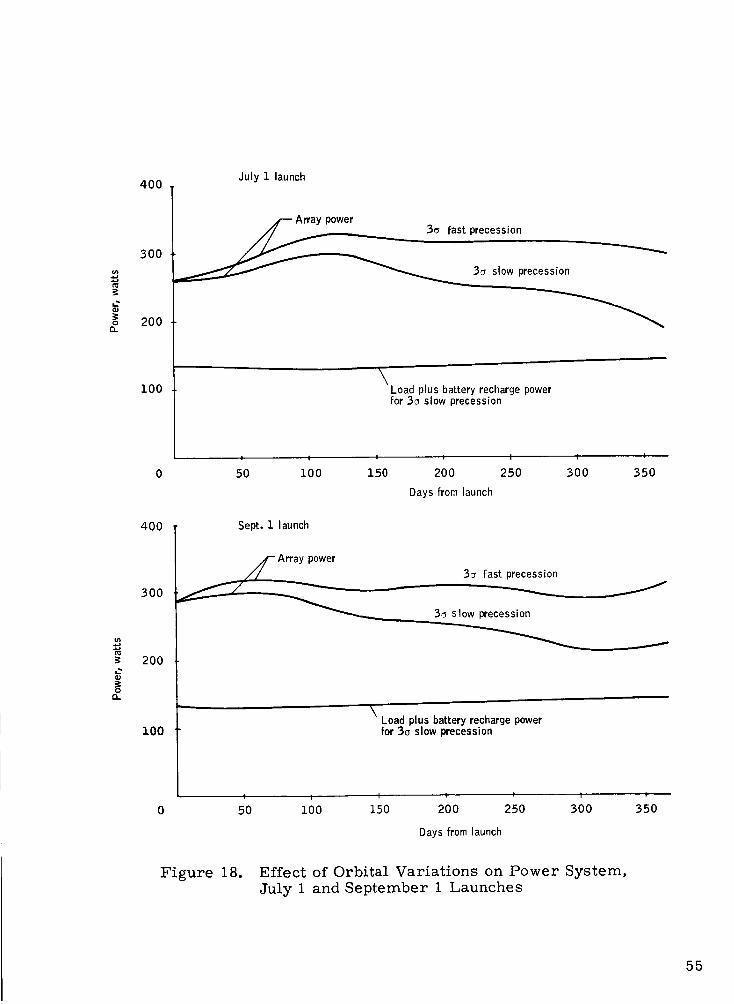
400July i launch
.,,a
0(3.
0(3.
300
200
i00
ast precession3o slow precession
"__ Load plus battery recharge power
for 3o slow precession
I I I I I I I
50 i00 150 200 250 300 350
Days from launch
400 Sept. 1 launch
-Array power
2OO
100
3o fast precession
3_ slow precession
Load plus battery recharge powerfor 3o slow precession
I I I I ) I I
0 50 i00 150 200 250 300 350
Days from launch
Figure 18. Effect of Orbital Variations on Power System,
July i and September I Launches
55
For the power conditioning equipmerft, the optimum number
of series solar cells is that which produces at the 31-degree
sun angle (where output voltage is lowest) sufficient voltageto permit operation of the charge regulators into the highest
battery voltage. Since it is unlikely that the exact desiredvoltage corresponds to a feasible panel layout, the optimumis that nearest to the minimum allowable. Parallel cell re-
quirements are those needed to produce the necessary currentplus margin at the 64-degree sun angle. Final solar arraypanel layout and voltage may be influenced by other factors.
Worst power demand occurs for simultaneous conditions of35 minutes shadow at 64-degree sun angle.
Power system limitations in regard to vehicle magneticmoment must be observed.
Battery requirements of temperature and charging for theactual installed conditions of thermal transfer must be strictly
observed to assure against destructive gassing.
Block diagram description.-- The power subsystem concept incorporates
the most applicable components studied into a subsystem capable of providingthe required power. Operation is described with reference to Figure 19.Power users will be provided with dc buses of +28 and +5 volts with respect
to common. Design value of the power usage is 20 watts at 5 volts and 50watts at 28 volts, with a 26-watt periodic load on the 28-volt line. Regulated
outputs are supplied by switching regulators which operate from the unregu-lated power bus.
The unregulated bus derives its power from the solar array during satelliteday and from the battery during satellite night. The battery is diode coupled
to the unregulated bus so that load power is automatically taken from the
array when it is available and from the battery when array power is notavailable. The standby battery and charger are available for use if theworking set fails.
A switching type charge regulator is used to obtain constant-current control
capability, which is the desired mode of charging for the battery.
If either of the regulated bus voltages are pulled significantly below theirregulated value, a large fault current is supplied by means of a rectifier
which couples the lower cells of the battery directly to the line. Thus, large
currents are available for actuating protection devices or clearing faults.
Subsystem operating characteristics. -- The power subsystem operating
characteristics are represented by the Figures 20, 21 and 22. These figuresdepict the approximate volt-amp characteristics for the solar array for the
nominal and the two 3-sigma conditions of 31-degree and 64-degree sun angle.These plots represent the array characteristics expected after one year ofoperation in the expected environment, that is, all deteriorations expected
56
I ISolar I J Audio - rf
array _'] filter ---_ Unregulated bus
Unregulated bus .__ 28V
regulator
.._ 28 Vregulator
28 v
regulator
28 VI regulator
-t ChargereguI ator
I Battery
t select
switchM.B.B.
Chargeregulator
28 V
dc/dcdc/dc
L T_mperature I.... Battery
, iI iI LTemp. _1 /LV_age_ --_--'-
Commands< -_/ PCU r
irVolt---age _._'-- _]I 'l Temp" '
I I Ground command
7emp_ra_'ure Battery
0
+ 5V
o + 28V
Figure 19. System Block Diagram
57
E
10
q8,
6
4
2
0
Figure 20.
k
h
m
PI I
2O 4O 6O 80
Volts
System Operating Characteristics,
Charger plus loads
96-watt load
70-watt load
100
45 ° Sun Angle
58
I._
E
10
8
6
4
2
h
q
C
a n
hm
Charger plus loads
96-watt load
70-watt load
I I
0 20 40 60 8O 100
Volts
Figure 21. System Operating Characteristics, 31 ° Sun Angle
59
10
8
6
1_q __.__
41Charger plus loads
70.watt load
I
0 20 40 60 80 100
Volts
Figure 22. System Operating Characteristics, 64 ° Sun Angle
6O
during the one-year operating period have already been included. The open-
circuit voltages and short-circuit currents to be expected are indicated bypoints p and q, respectively. Volt-amp characteristics (Figure 20) for the
regulators at normal load and the charger as reflected to the array are givenby the curve through points a - m and c - n, respectively. During peak loads,the curves pass through b and d instead of a and c. With increase involtage, the load plus charger current is shown to fall off, as would be ex-
pected from the nearly constant efficiency of the power conditioning. Fordecreasing voltage, the constant-power mode of operation terminates at the
voltage where the switching regulators have insufficient differential voltageacross them. Where the differential is not adequate, operation is typified bycessation of regulator switching and approximately one-to-one transfer ofcurrent from input to output.
The line through b and a, extended back to the zero-current line, represents
the volt-amp curve of the battery and, hence, the unregulated bus duringsatellite night. During satellite day, unregulated bus characteristics are
represented by the curvep-c-d-j-k. Intersection of the load and the supplycurves at a represents the operating point during satellite night and averageload. Addition of peak-load conditions moves the operation to b.
Assuming vehicle operation at the nominal 45-degree sun angle and that the
charger does not immediately draw current from the array, emergence ofthe vehicle from earthls shadow would result in shift of operating point from
a to h. Addition of the charger load would result in a change in operatingpoint from h to c. At this time there is a surplus current of about 3.8
amperes array current. The above statement neglects the fact that, when thearray first supplies current after earthls shadow, the volt-amp curve is
somewhat different from that shown. It is clear that normal operation isrepresented by one of the four points a, b, c, or d.
If the vehicle moves to a 31-degree sun angle, all of the above statements
hold except that there is a surplus of array current of about 5.3 amperes(Figure 21).
The limiting case, however, is the 64-degree sun angle represented onFigure 22. For this condition, there is an intersection of two additional
points on the load curve with that of the array curve, namely e and f. Forthose voltages between about 41 and 49, the load requires more power thanthe array is capable of delivering. Because of this, point e is not a stable
operating point, and any transient operation at this point would immediatelybe followed by degeneration to point f, where decrease in voltage is accom-
panied by decreased load requirement and increased power capability. Pointd is also a stable operating point, for the same reason, although marginallySO.
The significance of the above discussion is that if, for any reason, load re-quirements should exceed that represented by point d, there would follow an
immediate degeneration to the operating point f. Change of operating pointfrom d to f could result from a load transient or a peak of ripple current.
61
Gradual availability of current from the array, such as that which occursfollowing earth's shadow during each orbit, could latch operation at this point.All of this discussion has been with respect to operation during peaks ofpower drain, and is not a power system limitation since the peak power drainexists for only a short period of time. For "normal" load conditions, opera-tion is at point c until the batteries are charged. For this point, stableoperation is unconditional and essential to a satisfactory system design.
The ultimate system limitation on maximum sun angle is associated with thefact that in normal operation the current fluctuates about the average opera-ting point c. This fluctuation is the result of peak currents required byswitching regulators, warm-up transients associated with the attitude controlsystem, and other as yet undefined current surges due to switching. Peakcurrents drawn by all sources must be maintained at a value less than thatwhich would pass the peak power point for the solar array. Filtering for theregulators in question will hold the ac current reflected into the array to lessthan 0.250 amp peak to peak. If the peaks due to three regulators occursimultaneously, unlikely since switching is entirely noncoherent for the threeregulators, the current peak would be drawn only occasionally. Normal oper-ating current is 3.0 amps, and current peak would be under 3.3 amps forsimultaneous load peaks, assuming worst-case distortion. Array current atmaximum power is 4.2 amps, a marginof 27 percent over the 3.3 amp value.Added protection against the effects of a one-time current peak is provided bythe circuit monitor described below.
Operation at point f represents a "power limited" condition, that is thepower required for "normal" system operation in the constant power region(through points e and d) is not available from the array at this value ofvoltage. This results in the battery charge current being reduced to a valuelower than programmed. Since this condition can exist only for the shortduration of the high-value peak load and for a very short time immediatelyfollowing satellite night, there are no adverse consequences (see later dis-cussion). Over a longer period of time, the "latch up", corresponding to anoperating point such as f, would cause battery failure through inadequate re-charge. Reference to Figure I0 shows that for increasing sun angle above64 degrees, there is only a degree or two of margin until this limitation isencountered. Increase in the sun angle, at which the system fails for lack ofarray power, can be achieved by delaying application of the charger loadfollowing availability of array power at satellite sunrise. If this is done,operating point a will be followed by operation at point h and, immediatelyafter application of the charger load, by operation at point c, which is thedesired stable operating point. Alternatively, a circuit which would detect"switching" in the charge regulator could be used in the absence of switching,but with the flow of array current, the charger would then be switched off fora short period of time to allow the array to achieve higher voltage. Immedi-ately following earth's shadow, the array has reached very low temperaturesand hence has a different volt-amp characteristic. This is shown by thedotted array curve in Figure 22. As the array warms, the characteristicgradually changes back to that through c and h, the characteristic assumedfor the previous discussion.
62
Battery charging. -- Battery charging is accomplished with a constant-
current charge for the duration necessary to reach the maximum limitingvoltage, followed by a moderate rate trickle charge. This charge regimenis adequate for maintaining battery operation over the entire, expected tem-perature range. For the worst-case orbit, the battery charge will continue
at the initiallyestablished high rate for nearly the complete orbit. For theleast severe case, the duration of the high rate battery charge will be con-
siderably shorter. During this period, the standby battery will be charged ata constant-current rate about half that for the working battery, which should
maintain the standby battery in essentially new, unused condition. A drop inbattery voltage below a predetermined value will show that the working bat-tery is unable to supply the required load. Continuous monitoring of the bat-
tery voltage permits the system to switch to the standby battery whenever anabnormal, low-voltage condition exists so as to maintain continuous, uninter-
rupted power to the spacecraft control and data handling subsystems. After
switchover, the standby battery becomes the working battery and experiencesthe same charge program as the original working battery.
The charge regulators provide one of two charge programs to each of thebatteries:
lo
o
Working battery - charge at 2.0 amp until "limiting voltage"is reached. Charge thereafter at 0.45 amp.
Standby battery - charge at 0.1 amp until "working" battery
reaches "limitin_ voltage". Charge at 1.65 amp until "standby"battery reaches limiting voltage . Charge thereafter at 0.1amp.
The life and reliability considerations of this study are based on completeswitch-out and abandonment of the failed battery since this results in a sys-tem of minimum complexity. Further optimization of the charge controlsystem may be possible in the early design period since redundant batterychargers are provided. Options, other than complete switch-out of the failedbattery, would include application of a trickle charge, application of all avail-able excess array power, or an attempt to recondition the failed battery byremedial discharge and recharge measures. Use of any of these alternatecontrol modes is dependent on the ability to determine the type of batteryfailure from available status monitoring data, the effect of possible releaseof battery gases on the spacecraft, and circuit complexity.
Ground command. -- Ground command provisions allow ground control orselection of any mode of system operation in the event of revisions in opera-tional requirements or problems in system operation after spacecraft launch.Ground command requirements are also established by automatic controlversus ground control complexity tradeoffs and by requirements for automaticcontrol override. The specific identification of each ground command isestablished in the preliminary design stage as system interfaces are deter-mined. The following command requirements have been established:
63
• Power system override - five commands• Power reclosure - seven commands
• Emergency and mission termination - four commands
Status monitoring. -- Electrical power system status monitoring willindicate ground command requirements, will monitor protective systemstatus and will provide a system history for failure analysis. Status moni-toring also monitors redundant equipment to indicate the need for launch ofa back-up spacecraft. A monitoring points budget has been established to en-sure adequate provisions for power system monitoring:
Battery status - six points
Array status - six points
Load status - eleven points
Redundancy status - three points
Subsystem Operation
For the purpose of this discussion, the orbital flight will be separated intothree distinct phases during each of which the mode of operation differs fromthat of the others. These conditions are prelaunch, launch, and steady-stateorbit.
During the prelaunch period, the power system will be in an essentiallysteady-state operation, and all power will be applied from an external powersource. External power will be coupled to the system at the unregulated bus.Presence or absence of power on this external lead will then simulate presenceor absence of illumination of the solar array. If in addition to this the ex-ternal supply has a volt-amp characteristic similar to that of the solar array,a very good degree of simulation of orbital conditions can be accomplished.During this mode, the charge regulators will be effective in maintaining thebatteries at full charge, and removal of the external power supply will resultin assumption of the load by the battery. By means of the ground override, itwill be possible to test the capability of either battery to supply the load, andalso by means of monitor points it will be possible to ascertain that both bat-teries are fully charged before deciding whether launch should proceed. It isnecessary, in addition, that switching be provided so the batteries can betotally disconnected from the load to avoid undesired discharge.
The launch phase of the flight commences when connections to external powerare broken permanently and ends when the vehicle is in orbit at the properangle with respect to the sun and deriving power through the deployed solararray.
64
If all goes well, the length of time between assumption of the load by the bat-teries and the flow of power from the deployed array will be approximately11 minutes. If array deployment proceeds on schedule, the battery will havesupplied approximately 15 watt-hours of output during the interim, or abouteight percent of the capacity of one battery. If there are 20 minutes of re-maining sunlight following deployment of the array, the working battery willbe fully charged before the commencement of the first earth shadow, Forthis sequence of events, the vehicle has then achieved the equivalent of thesteady-state orbital conditions in approximately 30 minutes.
In the event of a failure which prevents acquisition of the sun in the length oftime required, there are approximately five-hours operation available fromboth batteries operating at full load. This figure is extremely pessimisticbecause it assumes absolutely no power available from the solar array. Thefive-hour period can be extended considerably if portions of the load areremoved during early phases of the flight.
The steady-state orbital operation of the power system is determined largelyby the orbital condition of sun angle and shadowfraction. Effects of thesevariations on the power system are discussed in the previous section.During normal operation, represented on the operating characteristicsdiagram for the nominal 45° sun angle (Figure 20), operation is representedat either point a or b during satellite night, depending upon whether or notcommunications equipment is in operation.
During satellite day, operation is at point c or d, once again depending uponoperation of the communications equipment. Normal variation through sunangles to 31 ° shows that points c and d are slightly changed in their location,as shown in Figure 21,due to the change in the volt-amp characteristic ofthe array. The limiting condition at 64 ° sun angle is also shown (Figure 22)with the multiple crossover of the supply and demand characteristics repre-sented as points d, e, and f. Potential difficulties associated with this factare dealt with as discussed in the power system description.
During the period of a year, there may be failures within the power systemand other subsystems. These possibilities are dealt with by either discon-necting the subsystem in which the failure occurs, or in the case of the powersystem, by redundant components designed into the system.
All parts involved are in active redundancy, except in the case of the batterywhere one of the batteries is held in standby redundancy simply being main-tained near or at full charge by means of the charge regimen described.Switchover in this case is automatic. Switchover is based on either exces-
sire battery temperature or low end-of-discharge voltage. If a conditionarises in which there is instability in the battery resulting in undesiredswitching between batteries, this can be overridden by ground commands andthe battery selection made permanent.
65
Solar Array
Solar cell and cover glass. -- Because of possible large temperatureexcursions due to the various sun-angle orientations to which the spacecraft
may be subjected, and because of the desire to use a relatively high voltage(44 V) from the array for better power system efficiency, it would be desir-able to use a low resistance cell. The main disadvantage to the use of sucha cell is its lower resistance to radiation degradation.
Temperature coefficients of the voltage at maximum power are typically2.35 mV]°C for a Heliotek 10-ohm-cm cell as compared to 2. 15 mv]_C fora Heliotek 2-ohm-cm cell. Figure 23 shows typical temperature character-istics for a 2 x 2 cm, 2-ohm-cm N-on--P solar cell.
Similarly, the filter characteristic was chosen to reflect the shorter bluesand ultraviolet portions of the spectrum where the solar cell conversionefficiency is low, thus reducing the solar cell temperature at the low anglesof incidence.
The radiation environment that will have an appreciable influence on solarcell performance will be comprised of high-energy protons and electronstrapped in the earth's radiation belts, high-energy solar protons from solarflare activity, and ultraviolet solar radiation. The high-energy proton andelectron radiation causes damage to the silicon crystal lattice which resultsin a degradation in the voltage-current characteristics of the solar cell inboth the voltage and current axes. These high-energy particles also causedarkening in glass or silica cover shields and the adhesive used to bond them.Ultraviolet radiation does not damage the solar cell; however, it does causedarkening of the cover shield materials and the adhesive used to bond them.Darkening of these materials decreases light transmission, thus degradingthe current output of the solar-cell voltage-current characteristic.
The radiation analysis was divided into two basic types: 1) the resulting solarcell output degradation due to high energy particles on the crystal lattice, and2) the darkening effects of the cover slide and adhesives.
Trapped particle radiation environment was determined from reference 5.Solar proton prediction and probabilities were determined from references 6and 7. Solar protons were projected such that there is a 0.99 probabilitythat the actual protons encountered in a year will be less than the estimateused.
As can be seen from Figure 24, by using a cover slip of six-mil thick
(0.035 g /cm 2) fused silica, complete shielding of low-energy protons
(below 4 MeV) results. Using this choice of cover material the remainderof the radiation analysis was made.
Using a Heliotek nominal 2-ohm-cm solar cell with a six-mil, fused silicacover slide, a radiation analysis for the prescribed orbit including an esti-mate of solar protons was made (Appendix D). This analysis indicated thatat end of life the loss from hard-particle damage would amount to eight mV
66
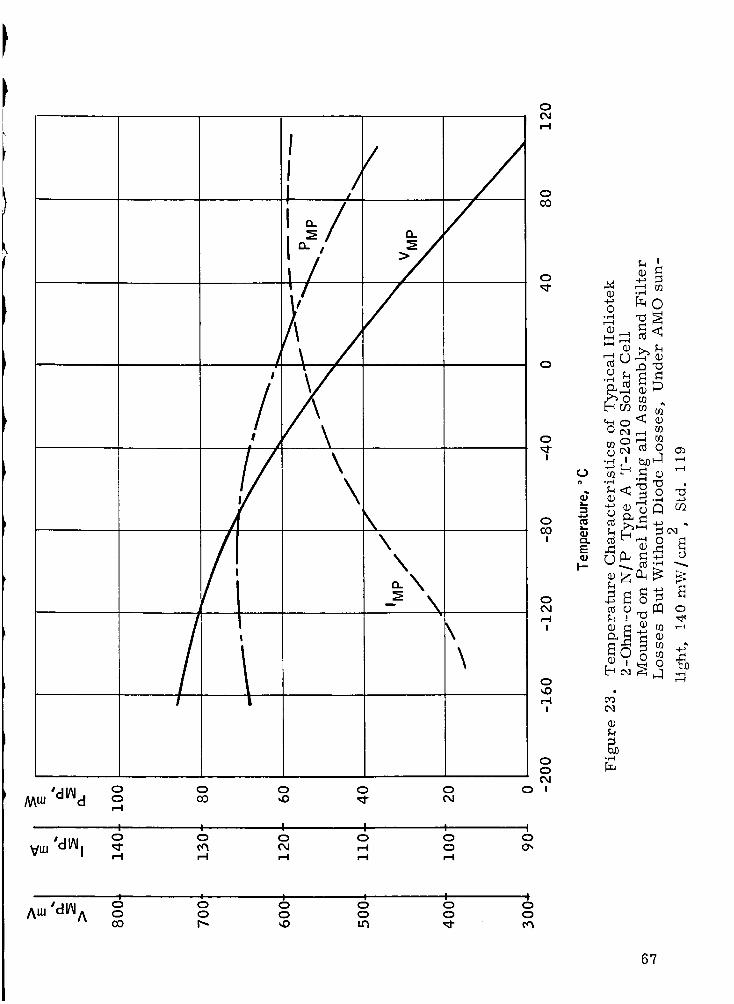
I /I /L
7
\\
\
\\
,diAld o o o o o,--I
I I I I I
/
s 0 0 0 0 0
d_ I _ _ _ _ oV_
0C%1I,M
0CO
0
0
0
I
0CO
I
00,1,_1
I
0
,-,4I
00
0 I
I00',
f-i I
o,-i_ _00
• ,-' _
0,--I _
° "_ .o _
_? 0_ _-:
_4
%
gor-4
_ I I I I0 0 0 0 0 00 0 0 0 0 0O0 I"'- _,_ U"I _" C_
67
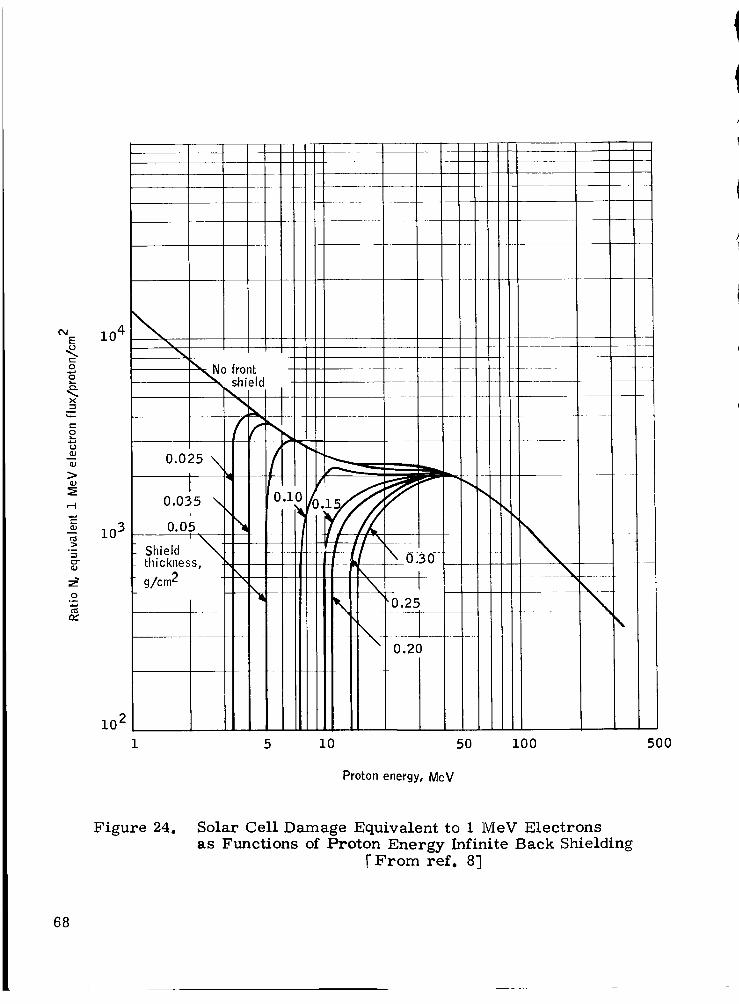
Oq
E
c-O
X
mw-.
v-
o¢J(D
(D
(D
O9
n3
,_
(D
Oo_
¢V
10 4
103
102
0.025
Shieldthickness,
g/cm 2
No frontshield
'0°25
0.20
5 10 50 100
Proton energy, MeV
I
500
Figure 24. Solar Cell Damage Equivalent to 1 MeV Electrons
as Functions of Proton Energy Infinite Back Shielding
[From ref. 8]
68
per cell in voltage at maximum power and 3.5 percent in the correspondingcurrent.
It has been assumed that the satellite will be located in a position in spacethat would receive all the protons anticipated. In fact, this is not the case
because the HDS orbit is at a low altitude, and in most cases the protons fromthe sun must pass through the earth's magnetic field before reaching the satel-lite. The protons are not likely to pass through the earth's magnetic fieldwithout being trapped. Therefore, the only solar protons which are likely tobombarrt directly the satellite are the ones coming in from the polar regions,which comprise a small percentage of the total flux. Use of the solar protonflux without the magnetosphere shielding thus incorporates into the designsome safety factor.
Cover glass particle radiation damage will have a darkening effect on thecover slip, thus decreasing the current from the solar cell. In addition,ultraviolet radiation can cause darkening of some cover glass and adhesivematerials (refs. 9, 10, and 11).
Heliotek has also done extensive ultraviolet radiation testing on fused silicaadhesive covers and these have shown a 0. 7 percent degradation in I after
scexposure to 170 hours to an ultraviolet source which was equivalent to 25 suns.This would correspond to about one-half year exposure. It is assumed thata 1. 5 percent degradation in short-circuit will cover the darkening effectsanticipated from fused silica, bonded either with RTV 602 or Sylgard 182.
Solar array performance calculations. -- The HDS orbit has been tenta-tively defined as: sun synchronous, 97.38 ° inclination, 500 km altitude, witha 3:00 p. m. launch in late October 1969. The angle of incidence relative tothe vehicle spin axis will vary through the year on either side of the nominal45 ° initial value. Taking into account the anticipated three-sigma limits forlaunch error, the angle of incidence from the sun line to the spin axis canvary from a minimum of 31 ° to a maximum of 64 °
The maximum spacecraft envelope is generally described as a cylinder 54inches in diameter and 44-inches high. Cylinder diameter is limited by theThor-Delta shroud while cylinder length is somewhat flexible. The space-craft will rotate about its axis at approximately 3 rpm. The axis itself willbe maintained in close orientation perpendicular both to an earth radius andto the plane defined by the orbit plane. In this oriented mode, the top face(opposite to the booster interface) will be illuminated in accordance with thesun-line angle variation from 31 ° to 64 ° as discussed above. The rim of thecylinder will be rotating about the spin axis, and the incidence angle of theelement in the plane defined by the sun line and spin axis will range from 59 °to 25 ° to the sun line. The rear end-face of the spacecraft would not beilluminated after orientation.
The actual spacecraft surface will require several openings which cannot beobstructed or have any objects within given field angles. On the cylindricalsurface of the spacecraft there will be a radiometer port 16 inches in diameter
69
and a sun shade which shades the rear 18 inches of one side. On each face
adjoining to the radiometer port will be a seven-inch diameter starmapper
viewport. In addition, near and parallel to the center cross-sectional planeare eight (8) uhf antenna slots spaced at 45 ° intervals. On the rim just belowthe front face (opposite the booster) are two areas 3-I/2 inches wide by 7
inches long reserved for horizon sensors which are 180 °apart. There arealso 3 inch by 3 inch areas reserved for sun attitude sensors, which will belocated near the baseplate on the rim. There are also four (4) vhf antennason the surface constructed of I/8 inch diameter rod, 21-i/2 inches long, each
end extending at an angle of 45 ° from the face outwards from the spin axis.The mount points of these antennas are one-inch diameter and are 90 ° apartaround the spin axis, forming a square with 21 - I/2 inch diagonals.
Based upon the above constraints, the most satisfactory approach was con-cluded to be that, upon deployment, the array would be planar at the frontface of the spacecraft with cells mounted on panels only or on panels and onthe front face. Further temperature considerations of the spacecraft pre-cluded use of the latter.
With the choice of a tentative configuration of six panels only, the next stepis a satisfactory electrical and mechanical cell layout. The basic criteriato meet were:
• Power under worst conditions: 189 watts
Angle of incidence from
sun line to spin axis:4 5° nominal varyingfrom 31 ° to 64 °
Temperature on face of panels: 45 ° angle: 43%:
31 ° angle: 56
64 ° angle: 17 °C
Minimum unregulated maximum
power voltage from array: 44 volts (189 watts)
The minimum maximum-power voltage could be met under the worst con-
ditions at the 31 ° angle utilizing 108 nominal 2-ohm-cm Heliotek N-on-P
cells. Figure 25 shows the output of such a cell mounted on a panel inctud-
ing all assembly losses, but not including diode drops or radiation damage.Figure 23 is a plot of the temperature characteristics of this cell.
With the above as a starting point, a power analysis was made to determine
the number of series strings required to meet the power requirement at the64 ° angle of incidence, the worst case.
The radiation analysis indicated that at end-of-life the loss from hard-par-ticle damage to nominal 2-ohm-cm Heliotek N-on-P cells would amount to
eight mV per cell in voltage and 3.5 percent in current. An additional
1-1/2 percent loss in current can be anticipated from ultraviolet damage to
the cover glass and adhesive system. Another 2.6 percent was allowed in thedesign to account for various rms instrument and radiometry measurement
7O
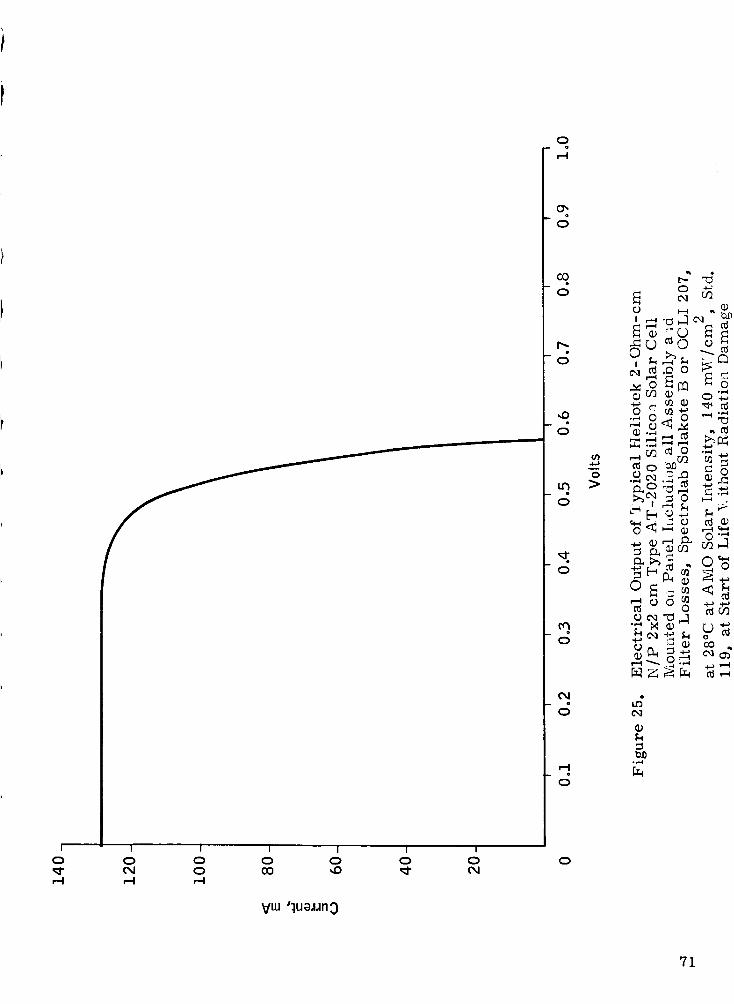
I I I I I I I
0 0 0 0 0 0 0
VLU 'lueJ.mO
0o
r-i
o0
_ o
0
r-I
0
0
_4
o
._,_
71
uncertainties, and an additional 3.5 percent to reflect the minimum anticipated
solar constant. Specific allowances were further made for the fall-off of both
voltage and current with angle of incidence as well as the thermal character-istics of solar cells. Figure 10 indicates the anticipated fall-off due to sun
angle.
This analysis indicates that this power requirement of 189 watts could bemet with 96 strings at the 64 ° angle.
Solar cell array construction. -- The solar cell array would be made upof six identical hinged panels of half-inch aluminum honeycomb construction.Mounted on each panel are two circuits of eight cells in parallel by 108 cellsin series. Each circuit would be isolated by redundant diodes to add relia-
bility in the event of a circuit short. The circuits are laid out symmetricallyso that the magnetic effect of each circuit is cancelled by the circuit immedi-
ately adjacent to it. Figure 26 shows such a layout.
The resultant assembly consists of a 0. 002- to 0. 005-inch-thick insulation
sheet of epoxy impregnated glass cloth bonded to the aluminum substrate.The solar cell circuits are bonded to this insulating layer by means of a
one- to two-rail layer of adhesive. This latter adhesive is of resilient sili-cone rubber such as RTV 41 or RTV 511. The cover slides are mounted on
the cells by means of an elastic adhesive such as RTV 602 or Sylgard 182.
The problem of interconnections in the solar cell arrays, though apparently
simple, is a critical area and merits careful consideration. There arevarious aspects of this problem, ranging from inter cell connections tointerpanel connections. This discussion particularly relates to intercellconnections within groups of cells in an unbroken, interconnected, series-
parallel arrangement. It is understood that such groups are series con-nected to other such groups to form the complete circuits; such connectionsshould always be completed with redundance to maintain high reliability.Such redundancy is particularly important where complex circuits withnumerous circuit reversals are involved. The problems arising from the
thermal and mechanical stresses within rigid assemblies led to the parallel
submodule system of interconnection. The "Solaflex ''_;' technique is based
upon the use of a tab strip system. In this arrangement cells are connectedinto small parallel groups, using a "tab strip" soldered along the bottom
of the ceils. Upon mounting, each cell is independently suspended on its ownresilient adhesive pad, isolated from the other cells except for electricalcontact through flexible, stress-relieved tabs. Thus, virtually no stressesare transmitted from cell to cell. As a result, thermal stresses are mini-
mized and, since the array is relatively flexible, it is less likely to faildue to vibration or shock.
The arrangements described above, and developed by Spectrolab,are covered byU. S. Patent No. 3094439, now reissued as PatentNo. Re 25, 647, assigned to Spectrolab, Division of Textron Electronics,
Inc., and by additional pending patents.
72
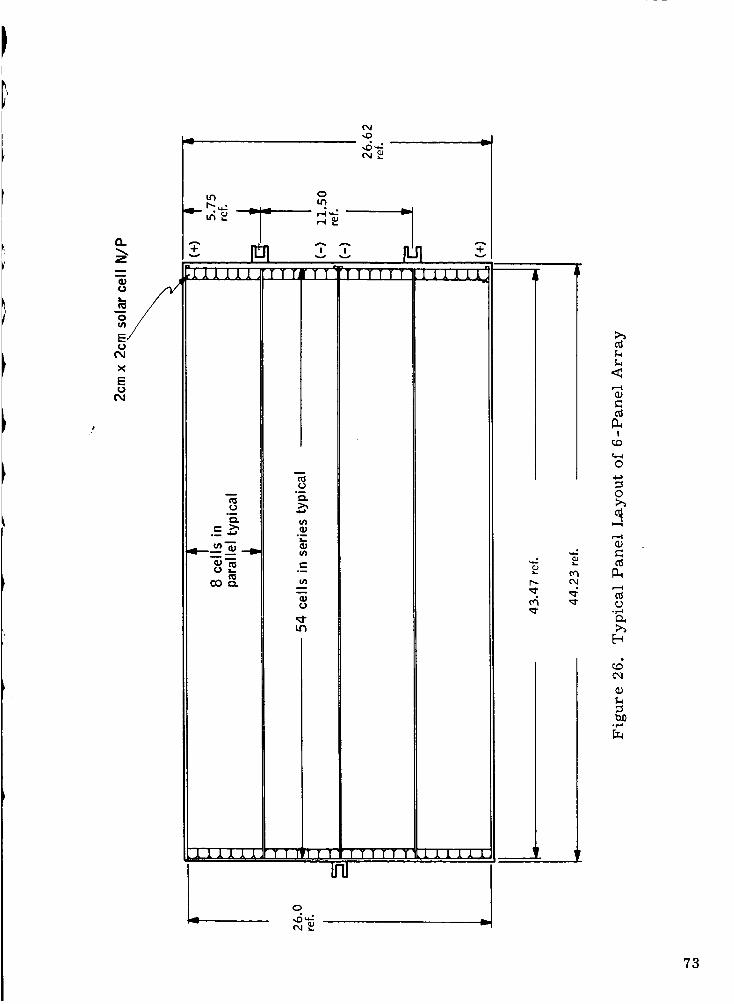
0
X
E0
m
(.,)
_111111
k
0.)(/)
o_
1.)
TT T_rTT '
0
TTTTTT IIIIII
_4
I
o
o
._-_
73
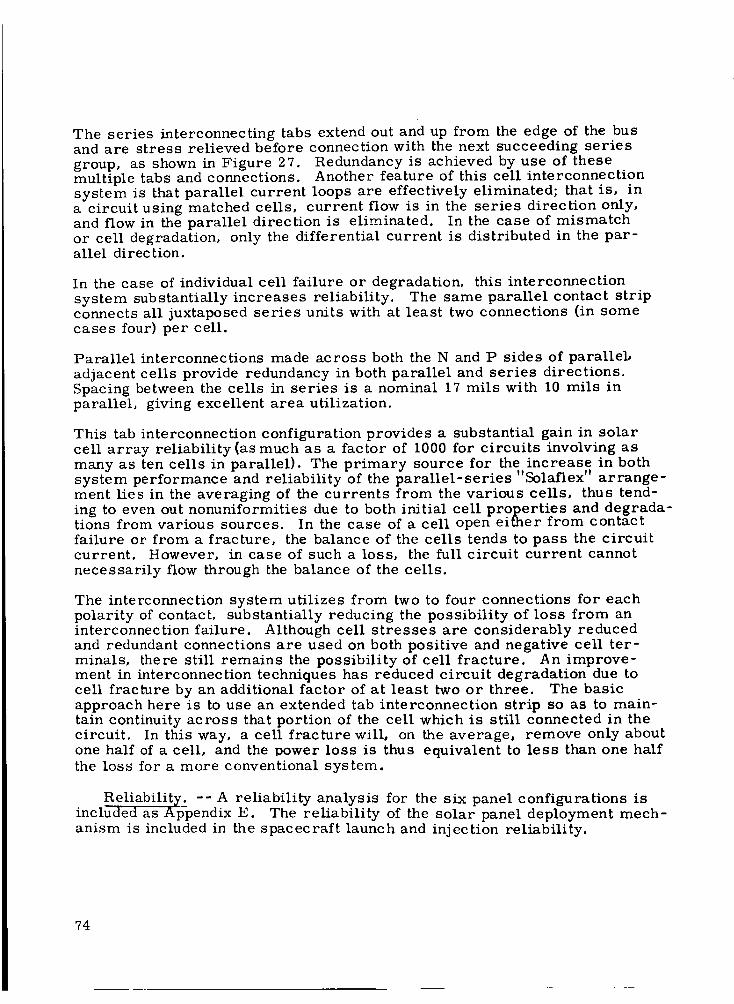
The series interconnecting tabs extend out and up from the edge of the busand are stress relieved before connection with the next succeeding series
group, as shown in Figure 27. Redundancy is achieved by use of thesemultiple tabs and connections. Another feature of this cell interconnectionsystem is that parallel current loops are effectively eliminated; that is, ina circuit using matched ceils, current flow is in the series direction only,and flow in the parallel direction is eliminated. In the case of mismatchor cell degradation, only the differential current is distributed in the par-allel direction.
In the case of individual cell failure or degradation, this interconnectionsystem substantially increases reliability. The same parallel contact stripconnects all juxtaposed series units with at least two connections (in somecases four} per cell.
Parallel interconnections made across both the N and P sides of parallel,
adjacent cells provide redundancy in both parallel and series directions.Spacing between the cells in series is a nominal 17 mils with 10 mils inparallel, giving excellent area utilization.
This tab interconnection configuration provides a substantial gain in solarcell array reliability (as much as a factor of 1000 for circuits involving asmany as ten ceils in parallel}. The primary source for the increase in bothsystem performance and reliability of the parallel-series "Solaflex" arrange-ment lies in the averaging of the currents from the various cells, thus tend-ing to even out nonuniformities due to both initial cell properties and degrada-tions from various sources. In the case of a cell open either from contact
failure or from a fracture, the balance of the cells tends to pass the circuitcurrent. However, in case of such a loss, the full circuit current cannot
necessarily flow through the balance of the cells.
The interconnection system utilizes from two to four connections for eachpolarity of contact, substantially reducing the possibility of loss from aninterconnection failure. Although cell stresses are considerably reducedand redundant connections are used on both positive and negative cell ter-minals, there still remains the possibility of cell fracture. An improve-ment in interconnection techniques has reduced circuit degradation due tocell fracture by an additional factor of at least two or three. The basicapproach here is to use an extended tab interconnection strip so as to main-tain continuity across that portion of the cell which is still connected in thecircuit. In this way, a cell fracture will, on the average, remove only aboutone half of a cell, and the power loss is thus equivalent to less than one halfthe loss for a more conventional system.
_Reliability. -- A reliability analysis for the six panel configurations isincluded as Appendix E. The reliability of the solar panel deployment mech-anism is included in the spacecraft launch and injection reliability.
74
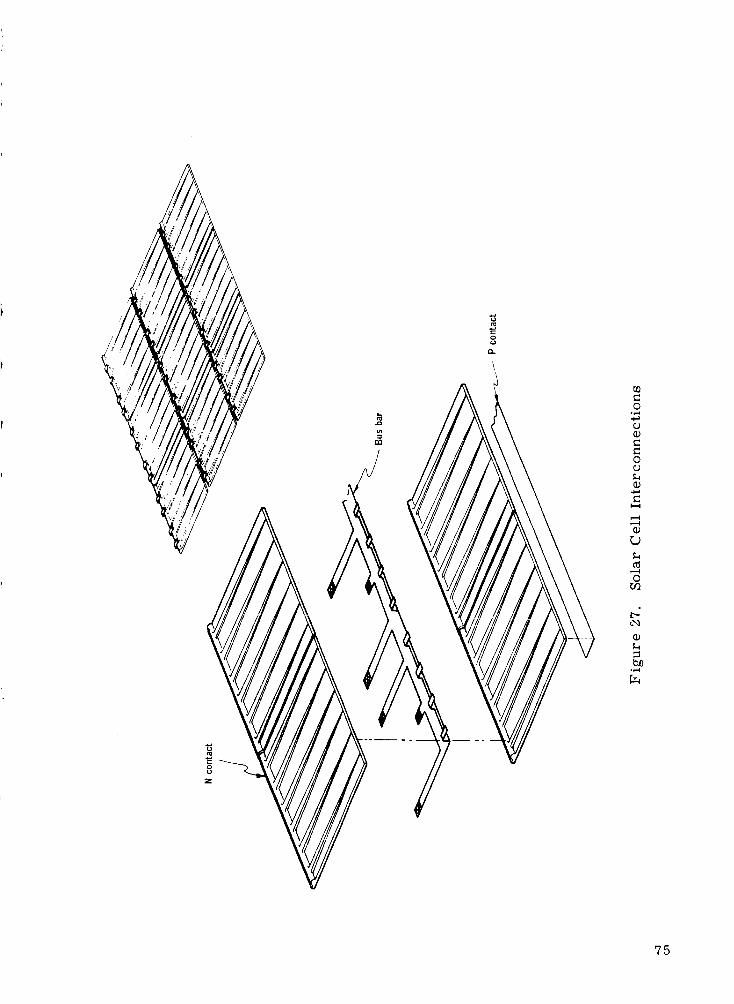
/////
,__ii_/V
8
0.,-d
0
(Dr..)
Or_
t_
75
Reliability figures have been obtained from published data available forsuch items as diodes, solder connections, etc. In the absence of such
numbers engineering judgment has been used. Testing of completed cir-cuits to verify numbers of this magnitude is not feasible. Losses are mostlikely to come from temperature shock and collision damage.
The figures used for cell breakage in the analysis reflect some thought ofthese occurrences. The probabilities of encounters with micrometeoroidswith an area of one square meter in one year are given in Table 8 for variouskinetic-energy particles (ref. 12). The exact correlation with cell loss isopen to interpretation and judgment.
In establishing the optimum circuit design, basic cell characteristics andthe current-limiting effects of solar cells must be considered. In Figure 28is shown the effect of loss of a single cell both by open circuiting, one cellat a time, and short circuiting across a given submodule of a module com-posed of 29 series-connected, five-cell parallel submodules. It is clearthat in both cases the loss is substantially greater than the proportionateloss of the number of cells.
Consider for example the circuit which has 96 solar cells in series, fivein parallel. If such a circuit has a single, open, total cell failure, therewill be a total of 95 submodules, which have five ceils in parallel, all inseries with a single submodule,which has four cells in parallel. Since allsubmodules are in series, the current through each will be equal, but thecurrent through each cell will not. The effect of the loss of a conductingpath (an open-circuit cell) will be to produce a current-limiting effect onthe affected circuit. Composite characteristic curves are formed for sucha module in the following manner: composite characteristic curves areconstructed for a "short string" of five parallel by 95 series Cells. Also,a characteristic curve for a single submodule of four cells is constructed.The composite characteristic curve for one open-circuit failure is thenformed by adding together the values of voltage for equal values of current.The effect in maximum power for such a circuit with various numbers ofceils in parallel is presented as Figure 29. It should be pointed out thatthis curve is representative of what can be expected by paralleling solarcells in all configurations, although this particular curve is for 10-ohm-cmcells with 96 in series. The Reliability Analysis, Appendix E, utilizes theactual data for the HDS.
Battery
Selection of the HDS battery requires an analysis of battery life, batterycycle, power storage requirements, available charge time, discharge rate,voltage limits, and battery environment. As previously indicated, the HDSmission duration and cycle life requires a nickel-cadmium battery.
A primary factor necessary for the battery conception is the power requiredfrom the battery in each orbit. Given the design power]orbit demand of70 watts in a 94.6 minute orbit of which the maximum expected occult is
76
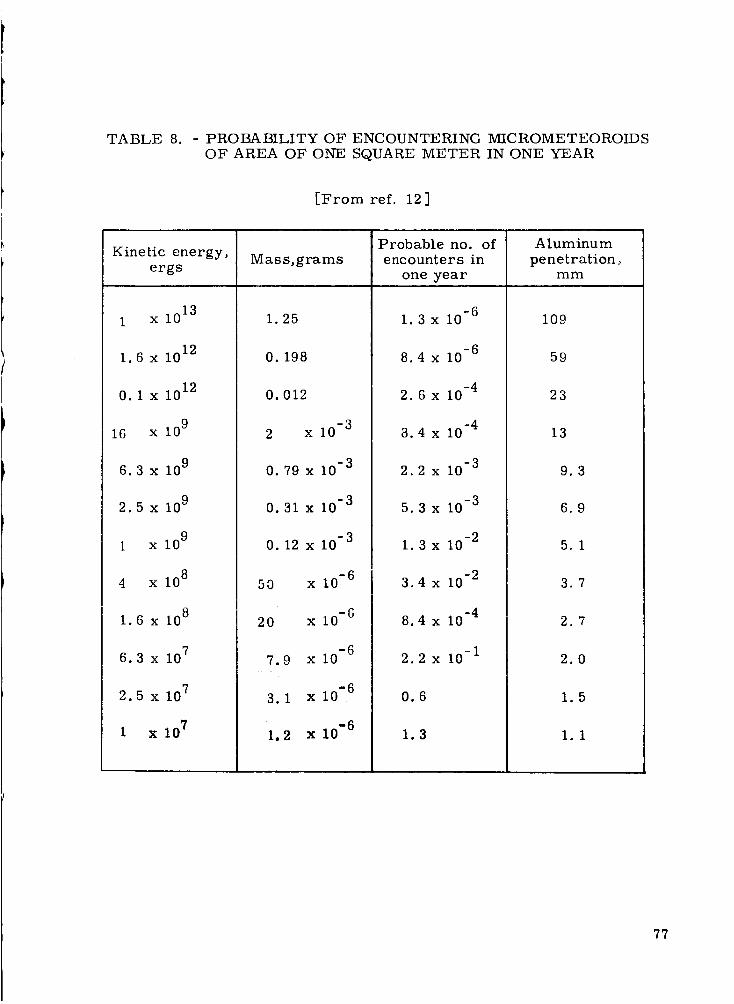
TABLE 8. - PROBABILITY OF ENCOUNTERING MICROMETEOROIDSOF AREA OF ONE SQUAREMETER IN ONE YEAR
[From ref. 12]
Kinetic energy,ergs
i x 1013
I. 6 x 10¹²
O.1 x 1012
16 x 109
6.3 x 10⁹
2.5 x 10⁹
1 x 10⁹
4 x 10⁸
i. 6 x 10⁸
6.3 x 10⁷
2.5 x 107
i x 107
Mass,grams
1.25
O.198
Probable no. ofencounters in
one year
0.012
1.3x I0
8.4x i0
-6
-6
2.6x 10⁻⁴
Aluminum
penetration,mm
109
-32 x i0
O. 79 x I0-3
-3O. 31 x lO
-3O. 12 x 10
50 x 10 -6
-620 x i0
-67.9 x i0
3.1 x 10 -6
i. 2 x 10 -6
3.4 x 10⁻⁴
-32.2xi0
5.3 x I0 -3
1.3 x 10 .2
3.4 x 10 -2
8.4 x 10 -4
-12.2x I0
0.6
1.3
59
23
13
9.3
6.9
5.1
3.7
2.7
2.0
77
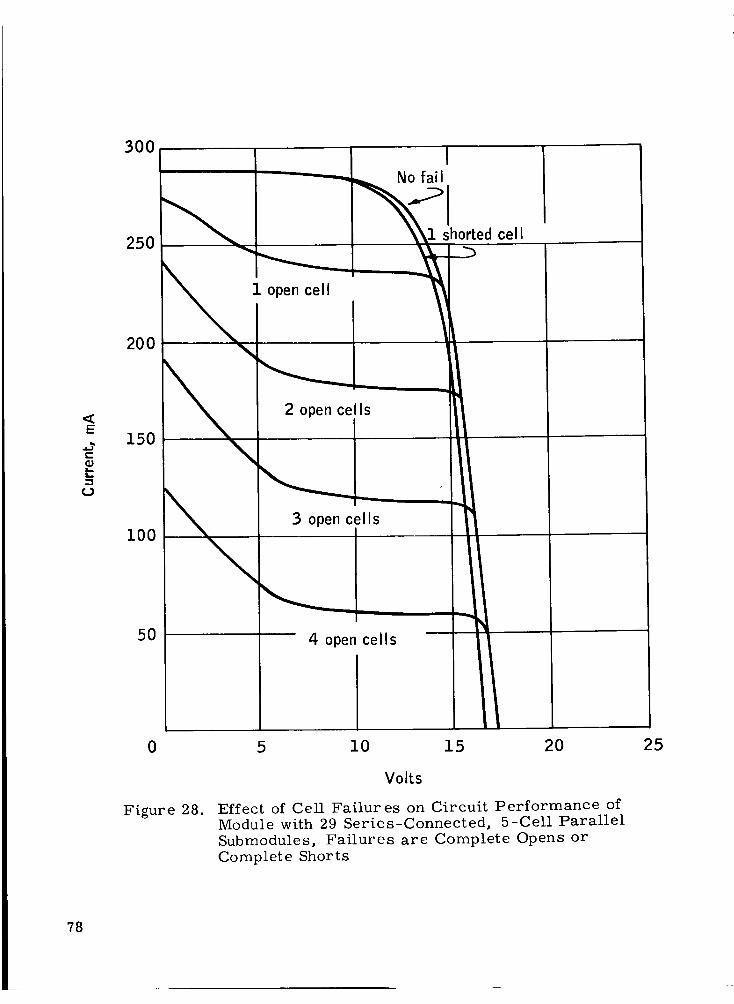
<E.,2¢-
e_
300
250
1 open cell ed cell
200
150
i00
5O
2 open cells
3 open cells
4 open cells
0 5 i0 15 20
Figure 28.
Volts
Effect of Cell Failures on Circuit Performance of
Module with 29 Series-Connected, 5-Cell Parallel
Submodules, Failures are Complete Opens or
Complete Shorts
25
78
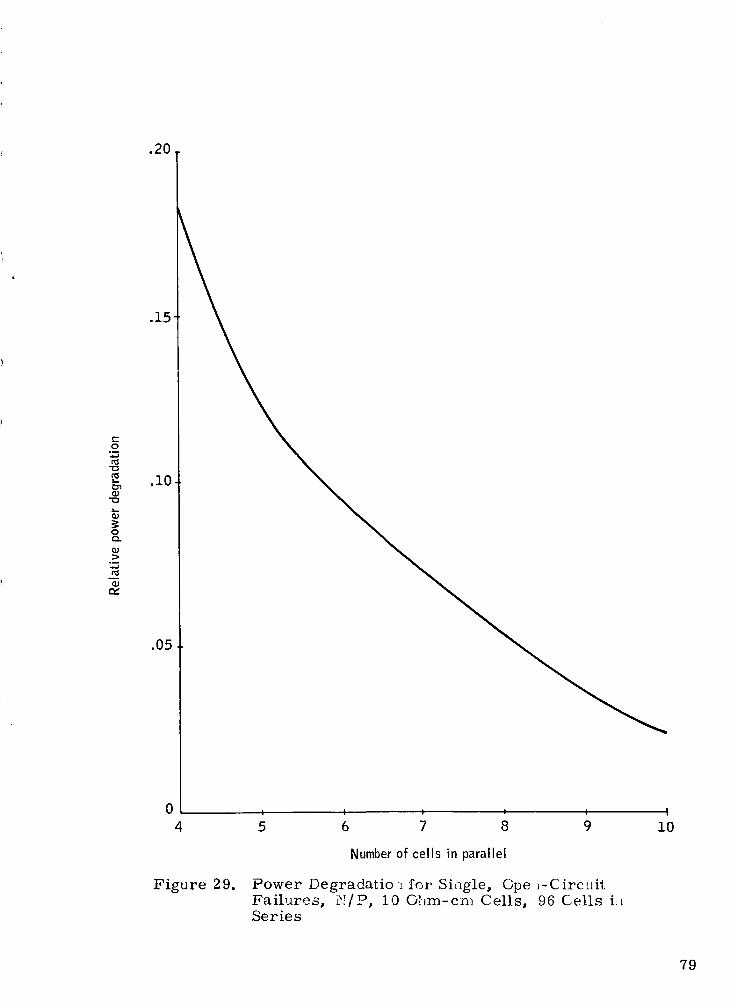
.20
c-o
t_
o
0 i I i _ i I
4 5 6 7 8 9 i0
Figure 29.
Number of cells in parallel
Power Degradatio._ for Si.__gle, Cpe _-Circt_itFailures, I_/P, 10 Ghm-cn_ Cells, 96 Cells i:,Series
79
36 minutes, and considering an 89.4 percent overall efficiency in regulationduring battery operation, the gross battery demand/orbit is 47 watt-hours.
In order to consider a number of alternatives for the required power, fourcells of standard size and capacity in five configurations were investigated.The largest configuration considered will yield over 30.8V at end of orbit dis-charge throughout the mission. This voltage level is above the satelliteregulated bus voltage (28V) by a margin adequate to provide efficient regu-lation. The smallest configuration would provide a voltage level below whichvoltage conversion and regulation becomes exceedingly inefficient. Fromthese extremes and the three intermediate configurations, any configurationbetween the extremes can be predicted. The four standard-size nickel -cadmium hermetically sealed cells considered are the 3, 6, 9, and 12ampere-hour cells.
Table 9 provides a comparison of capacities, configurations, weight, anddepth of discharge for the constant watt-hour demand of the satellite loadin eclipse.
Figure 30 depicts two variables of Table 9, i.e., the number of cells inseries to the percent depth of discharge. A decision band is established ondepth of discharge covering the 25-percent to 40-percent range. This bandis one of demonstrated reliability for the intended mission life. From thesecurves, a number of alternative configurations and capacities are considered
acceptable. These are a 12 A-h battery of 12 or 13 cells, a 9 A-h batteryof 12 to 17 ceils, or a6A-hbatteryof 15 to 28 ceils.
Figure 31, battery weight versus number of ceils for the various capacities,shows that it is advantageous to consider only the 9 A-h battery from 12 to15 ceils and the 6 A-h battery for 16 cells or more.
Considering the effect of battery voltage on the charge regulator, loadregulator, and solar array, the overall efficiency is optimized, withoutintroducing other problems of higher voltages, by using the 28-cell battery.This system will provide efficient regulation of voltage from the array to thebattery or load and from the battery to the load. Since the battery weightdifferential between a 16-cell and 28-cell system is only about 9 pounds, it isconceivable that using less than 28 cells would impose inefficiencies causingmore weight gain in the solar array and regulators than is saved in thereduced battery weight. Therefore, the conceptual battery is a 28-ce11,6-ampere-hour configuration.
Figure 32 depicts the extreme operational voltages for cell series from12 to 28 ceils. A battery temperature range is assumed for operation from0¢C to 40°C. The highest allowable voltage for charging is at 0°C and is1.55 volts/cell. Minimum voltage within the depth of discharge range isexpected to be 1. 10 volt/cell at 40°C. The discharge plateau is relativelyconstant and conservatively represented at 1.20 volt/cell.
8O
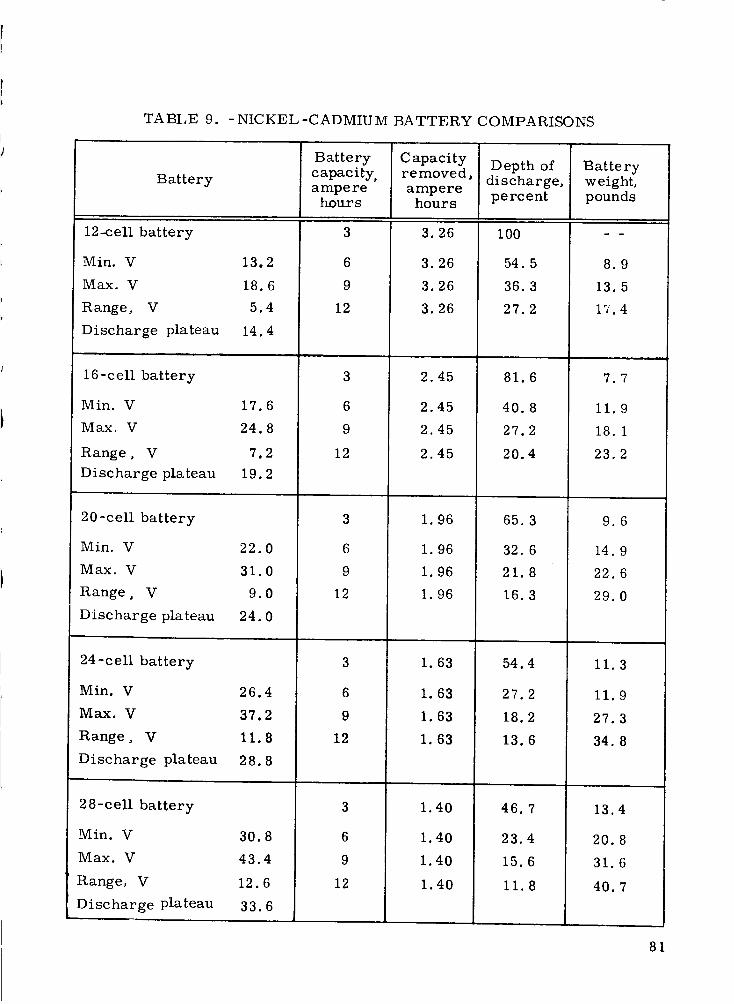
TABLE 9. -NICKEL-CADMIUM BATTERY COMPARISONS
Battery
12-.cell battery
Min. V 13.2Max. V 18.6
Range, V 5.4Discharge plateau 14.4
16-ceU battery
Min. V 17.6Max. V 24.8
Range, V 7.2Discharge plateau 19.2
20-ceU battery
Min. V 22.0Max. V 31.0
Range, V 9.0Discharge plateau 24.0
24-cell battery
Min. V 26.4Max. V 37.2
Range, V 11.8Discharge plateau 28.8
28-cell battery
Min. V 30.8Max. V 43.4
Range, V 12.6
Discharge plateau 33.6
Batterycapacity,amperehours
3
69
12
3
69
12
3
69
12
3
69
12
3
6
912
Capacityremoved,ampere
hours
3.26
3.263.263.26
2.45
2.452.45
2.45
Depth ofdischarge,percent
100
54.536.327.2
81.6
40.8
27.220.4
Batteryweight,pounds
8.913.517.4
7.7
11.918. 1
23.2
1.96
1.961.961.96
1.63
1.631.631.63
1.40
1.40
1.40
1.40
65.3
32. 6
21.8
16.3
54.4
27.2
18.2
13.6
46.7
23.4
15.6
11.8
9.6
14.9
22.6
29.0
11.3
11.9
27.3
34. 8
13.4
20.8
31.6
40.7
81
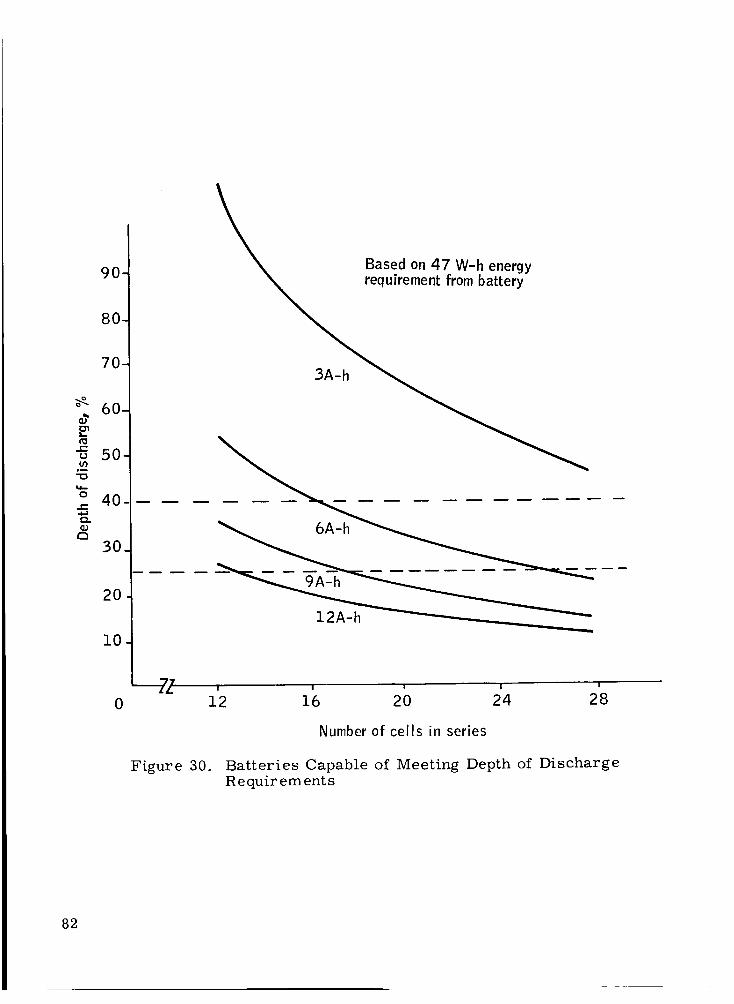
i_
(/),m"0
0
r_
90
80
70-
60-
50-
40-
30.
20
10
0
Based on 47 W-h energy
quirement from battery
3A-h
"_'_Z ! I I I I
12 16 20 24 28
Number of cells in series
Figure 30. Batteries Capable of Meeting Depth of DischargeR e quir em ent s
82
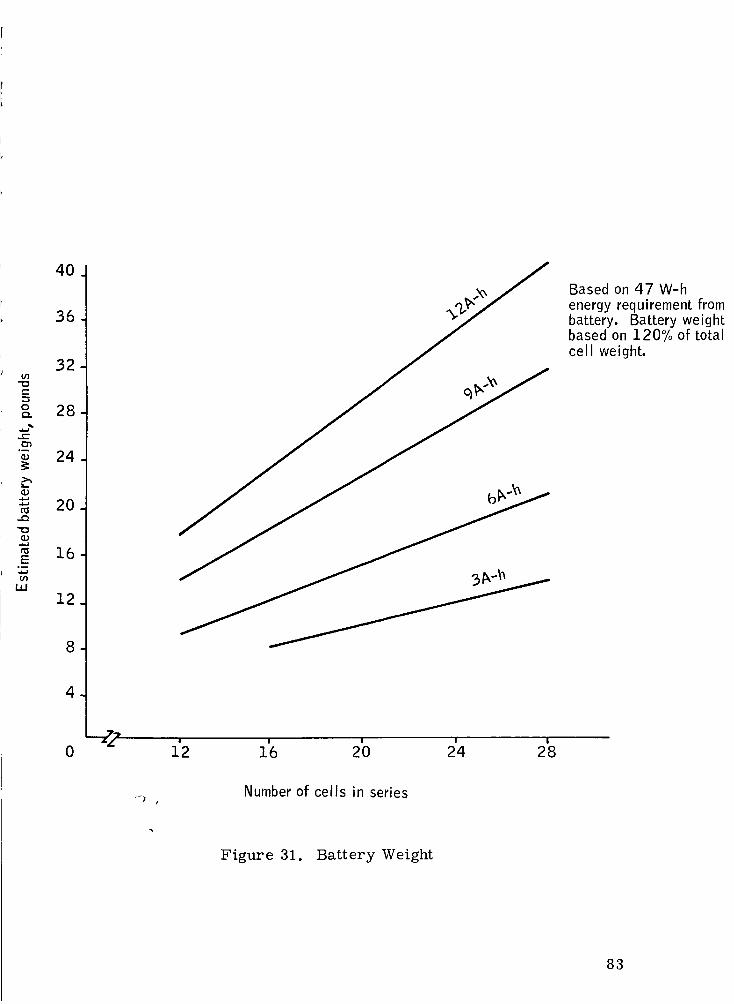
"0
.._0_..
°_
c_-Q
"0
E°_
_J
40
36
32
28
24
20
16
12
8
4
0--FZ
A_ / Based on 47 W-henergy requirement frombattery. Battery weightbased on 120% of totalcell weight.
1'2 f6 2b 2'4 2'8
Number of cells in series
Figure 31. Battery Weight
83
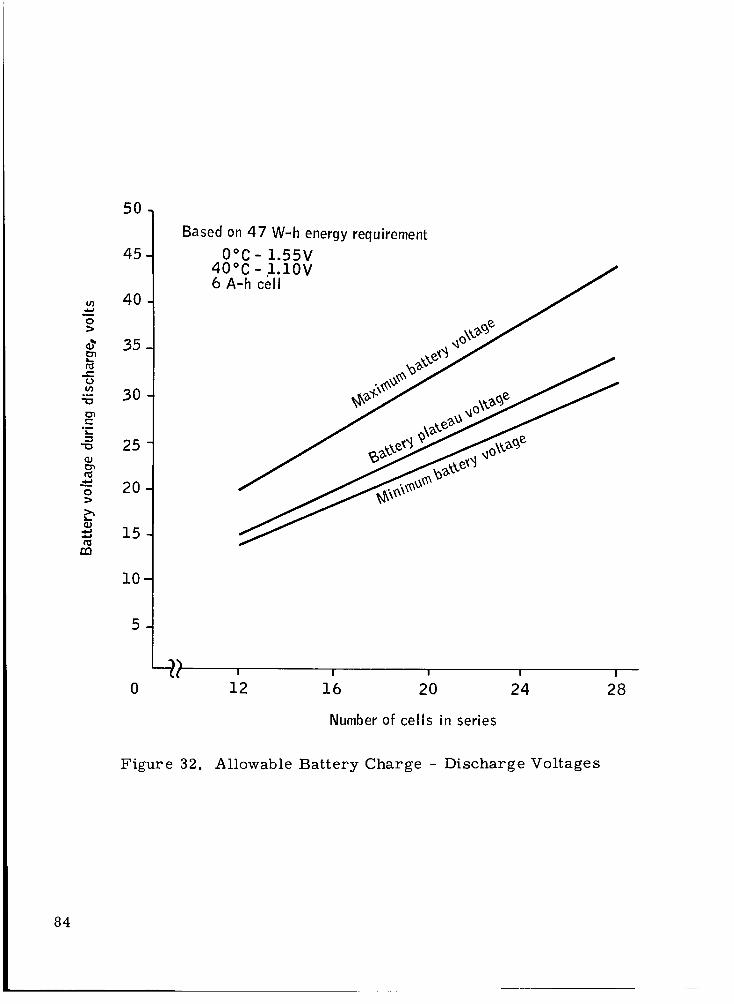
in
o>
t_t-o(n,m
cn
'F_
cnt_
o>
L_
nn
50
45
40
35
3O
25
2O
15
I0
5
Based on 47 W-h energy requirement
O°C- 1.55V40°C- l.lOV .i6 A-h cell
, ,_o\X'%_ ''_
"--'_ I I I I I
0 12 16 20 24 28
Number of cells in series
Figure 32. Allowable Battery Charge - Discharge Voltages
84
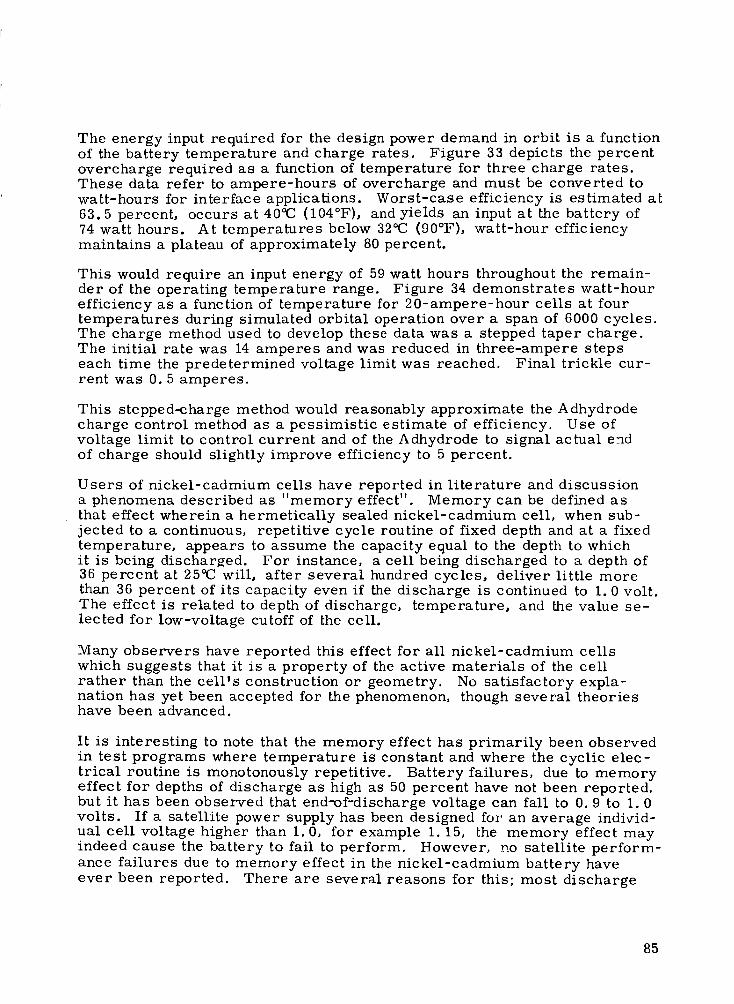
The energy input required for the design power demand in orbit is a functionof the battery temperature and charge rates. Figure 33 depicts the percentovercharge required as a function of temperature for three charge rates.These data refer to ampere-hours of overcharge and must be converted towatt-hours for interface applications. Worst-case efficiency is estimated at63.5 percent, occurs at 40'_ (104°F), and yields an input at the battery of74 watt hours. At temperatures below 32°C (90°F), watt-hour efficiencymaintains a plateau of approximately 80 percent.
This would require an input energy of 59 watt hours throughout the remain-der of the operating temperature range. Figure 34 demonstrates watt-hourefficiency as a function of temperature for 20-ampere-hour cells at fourtemperatures during simulated orbital operation over a span of 6000 cycles.The charge method used to develop these data was a stepped taper charge.The initial rate was 14 amperes and was reduced in three-ampere stepseach time the predetermined voltage limit was reached. Final trickle cur-rent was 0.5 amperes.
This stepped-charge method would reasonably approximate the Adhydrodecharge control method as a pessimistic estimate of efficiency. Use ofvoltage limit to control current and of the Adhydrode to signal actual endof charge should slightly improve efficiency to 5 percent.
Users of nickel-cadmium ceils have reported in literature and discussiona phenomena described as "memory effect". Memory can be defined asthat effect wherein a hermetically sealed nickel-cadmium cell, when sub-jected to a continuous, repetitive cycle routine of fixed depth and at a fixedtemperature, appears to assume the capacity equal to the depth to whichit is being discharged. For instance, a cell being discharged to a depth of36 percent at 25°C will, after several hundred cycles, deliver little morethan 36 percent of its capacity even if the discharge is continued to 1.0 volt.The effect is related to depth of discharge, temperature, and the value se-lected for low-voltage cutoff of the cell.
Many observers have reported this effect for all nickel-cadmium cellswhich suggests that it is a property of the active materials of the cellrather than the cell's construction or geometry. No satisfactory expla-nation has yet been accepted for the phenomenon, though several theorieshave been advanced.
It is interesting to note that the memory effect has primarily been observedin test programs where temperature is constant and where the cyclic elec-trical routine is monotonously repetitive. Battery failures, due to memoryeffect for depths of discharge as high as 50 percent have not been reported,but it has been observed that end-of-discharge voltage can fall to 0.9 to 1.0volts. If a satellite power supply has been designed for an average individ-ual cell voltage higher than 1.0, for example 1.15, the memory effect mayindeed cause the battery to fail to perform. However, _.o satellite perform-ance failures due to memory effect in the nickel-cadmium battery haveever been reported. There are several reasons for this; most discharge
85
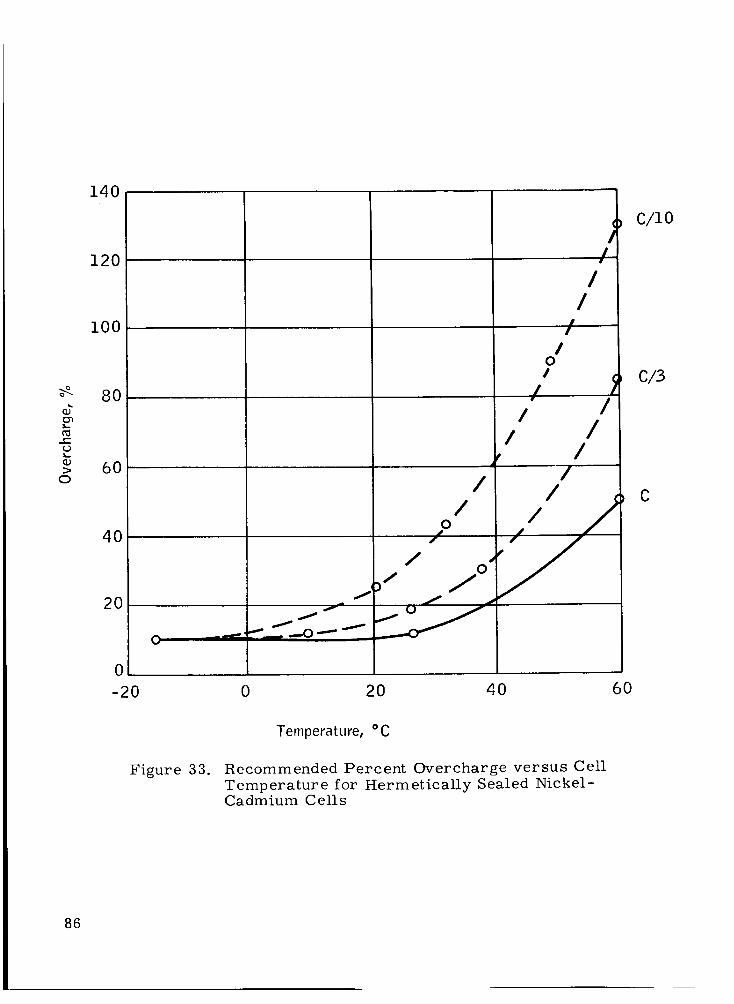
_7
v-O
>
O
140
120
I00
8O
60
4O
2O
0
-20
o
i f
_" _0 _. I
/
2 /
/ o _
iIJ
II
Il
o/
/ I/ I
, I/
0 20 40 60
C/lO
C13
C
Figure 33.
Temperature, °C
Recommended Percent Overcharge versus Cell
Temperature for Hermetically Sealed Nickel-Cadmium Cells
86
0CO
_0 _
cn
oE
_-o_o r.-I ..._
0 °-- "--c.- 09 "_
O0 o_-
o,o_-
0 0
% ',_0ua!0!jja sn0q 11eM
0
0
0
o
0
0i-I
I
00
(D
E_J
I--
0
°_1
0
0
0
0
q-I
0
0
0
0
°_..t
87
routines have been 10percent or less, most satellites do not have contin-uously repetitive cycle routines, and in most instances the battery tempera-ture in orbit is not constant.
No known methodical program has ever been undertaken to study the memoryeffect, to develop and substantiate a sound explanation, or to observe whatconditions would prevent it.
During the course of the battery development program for the OAO Satellite,ceils were cycled in many different routines. It was observed that memoryeffect was not evident in cells cycled at 9_C but appeared at temperatures of21, 32, and 43¢C. Additionally, the effect was more pronounced at eachhigher step of temperature. The temperature dependency can also be ob-served in NAD Crane data end-of-discharge voltages at 0, 25, and 40°C(ref. 3).
Some life test data which is currently being accumulated by the Royal Air-craft Establishment in England on VO3HS cells for the UK III Satellite(ref. 13) indicates that for discharge depths of 10 percent there is no pro-nounced memory effect after six months of 90-minute orbits even at tem-peratures of 40_C and at 50°C. But for 50-percent depths of discharge, a sig-nificant deterioration of capacity is evident after six months or about 2500cycles of operation at 40_C and at 50_C. However, after a complete dischargeand a dead shorting of the ceils followed by C / 10 charge and overcharge for24 hours, the total initial capacity is recovered.
It has been reported for Relay satellites that the memory effect was not ob-served because the operation of the satellite caused the batteries to sweepover a wide range of depths of discharge.
For Tiros, the memory effect was not observed because there were periodsof 100-percent sun time during which the batteries were continuously over-charged at C/8 to C/10. Elimination or erasure of memory effect wasattributed more to irregularity of the orbit than to continuous overcharge.In other words, it was concluded that the effect never developed rather than
that it was erased by overcharge.
Before launch on 0(30 testing was done on repetitive cycling, and the mem-ory effect showed up. This could be erased by completely discharging thecell, shorting it out, and then charging it, at which time nearly full nominalcapacity was observed. This is, however, a difficult operation to performin an orbiting satellite. It was also determined that,if a cell was exhibitingmemory, this effect could be temporarily allayed by raising the end-of-charge voltage from 1.45 to 1.48.
Reported data indicates that memory effect introduced by regular cycling atconstant temperature can be almost completely erased by cycling the temper-ature of the batteries, e.g., from -18_C to 60°(:.
It has been demonstrated that memory effect is more pronounced at hightemperatures and deep depths of discharge. Cycling at 36 percent at 9°Cdoes not allow the memory effect to develop.
88
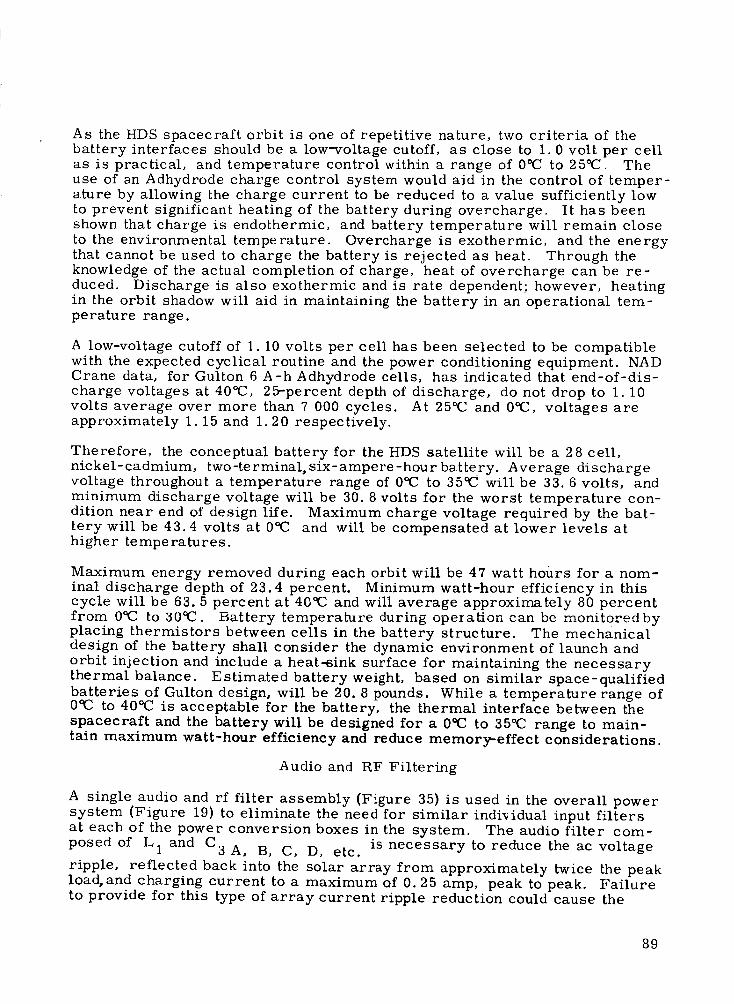
As the HDS spacecraft orbit is one of repetitive nature, two criteria of thebattery interfaces should be a low-voltage cutoff, as close to 1.0 volt per cellas is practical, and temperature control within a range of 0°C to 25°C. Theuse of an Adhydrode charge control system would aid in the control of temper-ature by allowing the charge current to be reduced to a value sufficiently lowto prevent significant heating of the battery during overcharge. It has beenshown that charge is endothermie, and battery temperature will remain closeto the environmental temperature. Overcharge is exothermic, and the energythat cannot be used to charge the battery is rejected as heat. Through theknowledge of the actual completion of charge, heat of overcharge can be re-duced. Discharge is also exothermic and is rate dependent; however, heatingin the orbit shadow will aid in maintaining the battery in an operational tem-perature range.
A low-voltage cutoff of 1. 10volts per cell has been selected to be compatiblewith the expected cyclical routine and the power conditioning equipment. NADCrane data, for Gulton 6 A-h Adhydrode cells, has indicated that end-of-dis-charge voltages at 40°C, 25-percent depth of discharge, do not drop to 1. 10volts average over more than 7 000 cycles. At 25°C and 0¢C, voltages areapproximately 1.15 and 1.20 respectively.
Therefore, the conceptual battery for the HDS satellite will be a 28 cell,nickel-cadmium, two-terminal, six-ampere -hour battery. Average dischargevoltage throughout a temperature range of 0¢_Zto 35_Cwill be 33. 6 volts, andminimum discharge voltage will be 30. 8 volts for the worst temperature con-dition near end of design life. Maximum charge voltage required by the bat-tery will be 43.4 volts at 0°C and will be compensated at lower levels athigher temperatures.
Maximum energy removed during each orbit will be 47 watt hours for a nom-inal discharge depth of 23.4 percent. Minimum watt-hour efficiency in thiscycle will be 63.5 percent at 4O°Cand will average approximately 80 percentfrom 0°C to 309C. Battery temperature during opeza_on can be monitored byplacing thermistors between cells in the battery structure. The mechanicaldesign of the battery shall consider the dynamic environment of launch andorbit injection and include a heat-sink surface for maintaining the necessarythermal balance. Estimated battery weight, based on similar space-qualifiedbatteries of Gulton design, will be 20.8 pounds. While a temperature range of0'_3 to 40°C is acceptable for the battery, the thermal interface between thespacecraft and the battery will be designed for a 0°C to 35%_range to main-tain maximum watt-hour efficiency and reduce memory-effect considerations.
Audio and RF Filtering
A single audio and rf filter assembly (Figure 35) is used in the overall powersystem (Figure 19) to eliminate the need for similar indi-vidual input filtersat each of the power conversion boxes in the system. The audio filter com-posed of L 1 and C3 A, B, C, D, etc. is necessary to reduce the ac voltageripple, reflected back into the solar array from approximately twice the peakload, and charging current to a maximum of 0.25 amp, peak to peak. Failureto provide for this type of array current ripple reduction could cause the
89
0
Arrayinput
C2
o
L 1
F 1_r- )" !
_F2B I
--;C3A: :C3B _
v
F2 C
" C3c
F2 N
C3 N
o -I-
m
1.5 capacitors total
Est. weight 1.1 Ib
Est. volume 22 in. 3
Figure 35. Audio - RF Filter
9O
array to be pulled into a poor operating point and latch up. The tantalum foilcapacitors are extremely reliable and experience has shown that this typerarely,if ever, exhibits a short failure mode; however, it was deemed prudent
to fuse IF2 A, B, C, D, etc.I each capacitor with a short length of fine copperI
wire. This fine copper wire would clear any faulty capacitor by burning openwith 20 amperes of current from either of the batteries.
The radio frequency filter portion of the assembly is made up of two one-_Fceramic capacitors placed physically as close to the input connector as poss-
ible. Fuse F 1 is all that is necessary since the negative side is at dc groundpotential.
Battery Charge Control
Many approaches have been utilized in the satellite industry for optimumcharging of nickel-cadmium batteries. The successful programs have onething in common; they have treated the battery with special care by not con-sidering it just a black box with an input and output. All successes have beenachieved by developing the charge control around the specific battery in thesystem, i.e., ampere-hour rating, temperature environment, time for charge,depth of discharge, mechanical construction, etc.
In previous discussions (Control and Regulation), a fairly detailed comparisonof the many methods of charging was made. Selection of a pulse-width, seriescontrol method was based on the many advantages over the shunt and straightseries controllers.
The following discussion will consider the battery charge control a part ofthe complete power system and will describe in some detail the operation andspecification of the proposed system.
The battery charge control system is based on the use of two identical charge,_o,,_o_ regulators each charging a separate battery.
At various times and under various conditions,the charging current must beeither 0. 1 amp, 0.45 amp, 1.65 amp, or 2.0 amp. The charge mode isarranged in such a way that only one of the two batteries can be charged atany one time {excluding continuous trickle charge}.
The trickle charge control will consist of a series transistor biased for con-stant current or a resistor valued for 0. loampere trickle current. The 0. 1ampere is sufficient to keep the standby battery fully charged under theenvironmental conditions expected. The battery charge control, Figure 36,consists ofapulse-width regulator with output voltage sense, current sense,commutating diode voltage control, filter L and C, current switching regula-tion control, an overload bypass, and a three-volt bias supply.
Description of the operation of the basic pulse-width regulation technique canbe found earlier in this report. Basically the input voltage is switched on
and off so that average current after filtering, is equal to the desired batterycharge current. This is accomplished by sensing the output current, compar-ing it with a constant reference, and then controlling the series switchingtransistors appropriately.
91
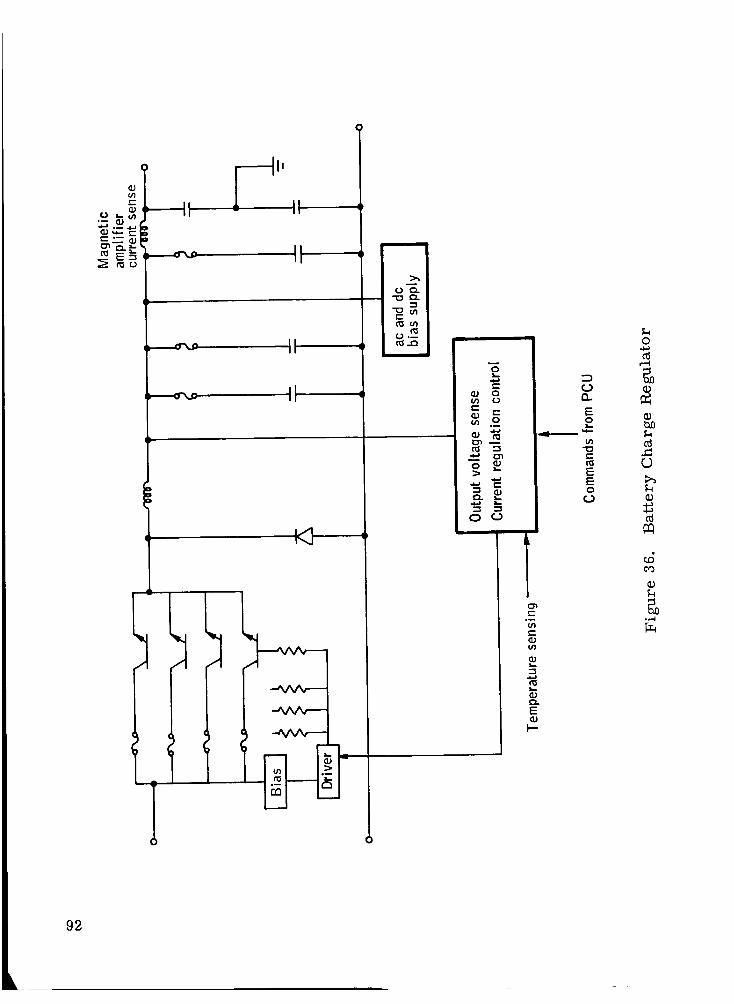
(/)
°D ..8_
---tl
DD
II
II
II,
II
C..) _.
('_ u'J
iiiii
i
_ 4--
c_c_
u_j
E
I.-
C.)0..
E0
(/)
e.-
EO
c..)
oc_
r-4
b.O
c_
c_
c_
C_
•,.-.I
92
An inverter/converter working from the charger output provides ac for amagnetic current sensor and dc voltage to forward bias the series switchingpower transistors, reducing the forward saturation voltage drop.
Each battery charge control regulator employs fuses to clear single com-ponent failures. An explanation of the fusing operation is as follows: theswitching regulator was designed with four transistors in parallel eachcarrying approximately 1]2 ampere of current, thus supplying two amperesof charging current at the beginning of the charge mode. Each transistorhas a semiconductor fuse in series with its collector lead. If a switchingtransistor shorts, all the current will pass through that transistor with aresultant increase in output voltage causing a large increase in battery cur-rent, thereby clearing the series fuse and shorted transistor.
Fault clearing of the filter and rf capacitors is accomplished with finecopper wire in a similar manner as shown in the input audio filter assembly,Figure 35.
Bus Voltage Regulation
Twenty-eight-volt bus. --The 28-volt bus regulator utilizes the filteredinput voltage of 31 to 82 volts from the solar array or battery voltage andregulates the output to 28 volts +2 percent at any instant of time, seeFigure 37. The regulator is actually two regulators in redundancy operatinginto common output capacitors.
Operation of this regulator is substantially the same as that in the batterycharge control regulator except that sensing holds the output voltage constant.Efficiency is maintained at the maximum by employing the regulators in aform of standby redundancy. The standby regulator is cut off since the work-ing regulator operates at a slightly higher voltage. Each regulator operatescompletely independently of all portions of the other, except for the com-mon output capacitors.
Since the load must be considered capable of faulty operation, a currentlimiting provision is utilized which provides approximately twice the maxi-mum rated current into a fault yet limits the current of each regulator tomaximum rated load current under all conditions, thus protecting the regu-lator from damage. Current limiting is obtained by sensing the input currentwith a small resistor. The voltage across this resistor is used to controlswitching of the series regulator transistors in such a way that the outputcurrent of that section cannot exceed 3.4 amperes. If neither section hasfailed, the current will be less than 6.8 amperes.
Internal fine wire fusing is used for fault clearance of the commutating diodeand all filter capacitors. The P-200 Microlectron semiconductor fuses arein series with the switching transistors in the regulator and in series with theoscillator transistors in the bias converter.
Five-volt bus. -- Conversion to five volts can be directly through aswitching regulator from the unregulated line, or through a dc/dc converterwhich can be used to derive the five-volt output directly from a 28-volt
93
It
c_
b.Oc_
o_.-I
O
_Q
0
r_
r--I0
!
L_C_
or-1
94

regulator. In either case the efficiency is about the same since the commutaring diode of the regulator approaches 100 percent conduction time. If aconverter is powered from the output of the 28-volt regulator, interactionbetween the supplies due to load peaks or fault clearing would be encountered.By separating the functions completely with a separate 28-volt regulator forthe five-volt converter, it is possible to isolate completely the supplies. 'I'hvredundant input regulators are paralleled and contain the same internal t'u_mgarrangements for fault protection as previously described (See Figure 38).
Regulation is performed at the higher voltage level where the ratio of voltagedrop in the series switching transistors to the operating voltage is compara-tively small. The resulting regulated 28 volts is then used in the dc to dcconverters to obtain the five-volt load requirement and the three-volt biassupply.
Fail-safe precautions are taken in each converter by fusing each oscillatortransistor so that a short circuit in any one would automatically cause itsseries fuse to open.
The output of the five-volt supply will be filtered to limit the peak-to-peakripple to less than the 100 mV necessary for integrated circuits where digitalinformation is stored.
External overload protection will be provided by current limiting of 10 am-peres when both sections are working in parallel, or to five amperes with onesection cleared off the line. External short-circuit protection will cause bothsections to cut back to almost zero current, thereby isolating an externalfive-volt load short from the input power.
If necessary or desirable, separate output windings on the converter can beprovided so that all subsystems can have isolated five-volt supplies.
Reliability and Weight
The reliability approach has been to assure that the basis for reliability cal-culations has been valid and based on test data of a common confidence level.
In this way the resultant reliability numbers for the various system componentsreveal which of the components are the primary contributors to the power sys-tem unreliability. With this information, the appropriate steps may be takento obtain the greatest feasible reliability. From the total mission reliabilitypoint of view, hhe power system is in the position of being a direct multiplierin determining total mission reliability. Because of this, the power systemdesign should be such that no single-point failure could cause serious degrad-ation in the power system. Accomplishment of this objective requires a pro-hibitive degree of redundancy. However, great improvement is possible ifredundancy is employed in those places where components are most highlystressed relative to their rating. Failure rate prediction for highly stressedcomponents is less accurate than for those at lower stress. A system weightcomparison is also presented in this section since weight and reliability arecorrelated.
95
96
o
Lr_
1
T1
"o _.
T
,.i,,Jc_
C_
T
c_
p,,,
c_°_
0
!
0
c_i--I
iml
0_>
!
c_co
c_
or-I
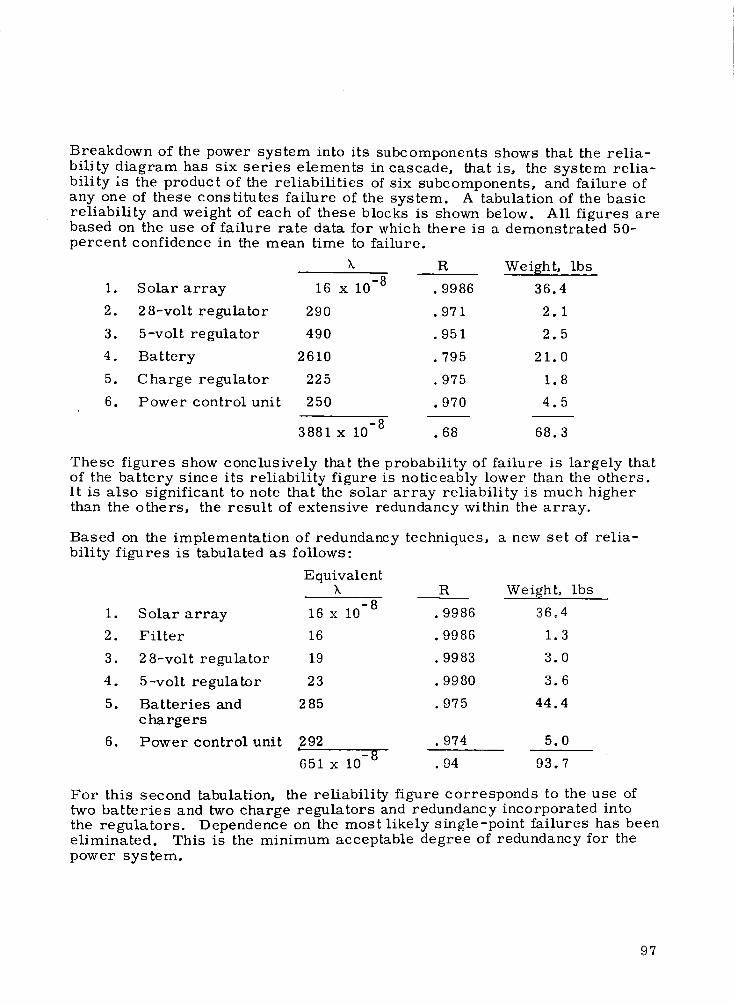
Breakdown of the power system into its subcomponents shows that the relia-bility diagram has six series elements in cascade, that is, the system relia-bility is the product of the reliabilities of six subcomponents, and failure ofany one of these constitutes failure of the system. A tabulation of the basicreliability and weight of each of these blocks is shown below. All figures arebased on the use of failure rate data for which there is a demonstrated 50-percent confidence in the mean time to failure.
k R Weight, lbs-8
1. Solar array 16 x 10 .9986 36.4
2. 2 8-volt regulator 290 .971 2.1
3. 5-volt regulator 490 .951 2.5
4. Battery 2610 .795 21.0
5. Charge regulator 225 .975 1.8
6. Power control unit 250 .970 4.5
-83881x 10 .68 68.3
These figures show conclusively that the probability of failure is largely thatof the battery Since its reliability figure is noticeably lower than the others.It is also significant to note that the solar array reliability is much higherthan the others, the result of extensive redundancy within the array.
Based on the implementation of redundancy techniques, a new set of relia-bility figures is tabulated as follows:
Equivalentk R Weight, lbs
-8!. Solar array 16 x !0 .9986 36.4
2. Filter 16 .9986 1.3
3. 2 8-volt regulator 19 .9983 3.0
4. 5-volt regulator 23 .9980 3.6
5. Batteries and 285 .975 44.4
chargers
6. Power control unit 292 .974 5.0-8
651 x 10 .94 93.7
For this second tabulation, the reliability figure corresponds to the use oftwo batteries and two charge regulators and redundancy incorporated intothe regulators. Dependence on the most likely single-point failures has beeneliminated. This is the minimum acceptable degree of redundancy for thepower system.
97
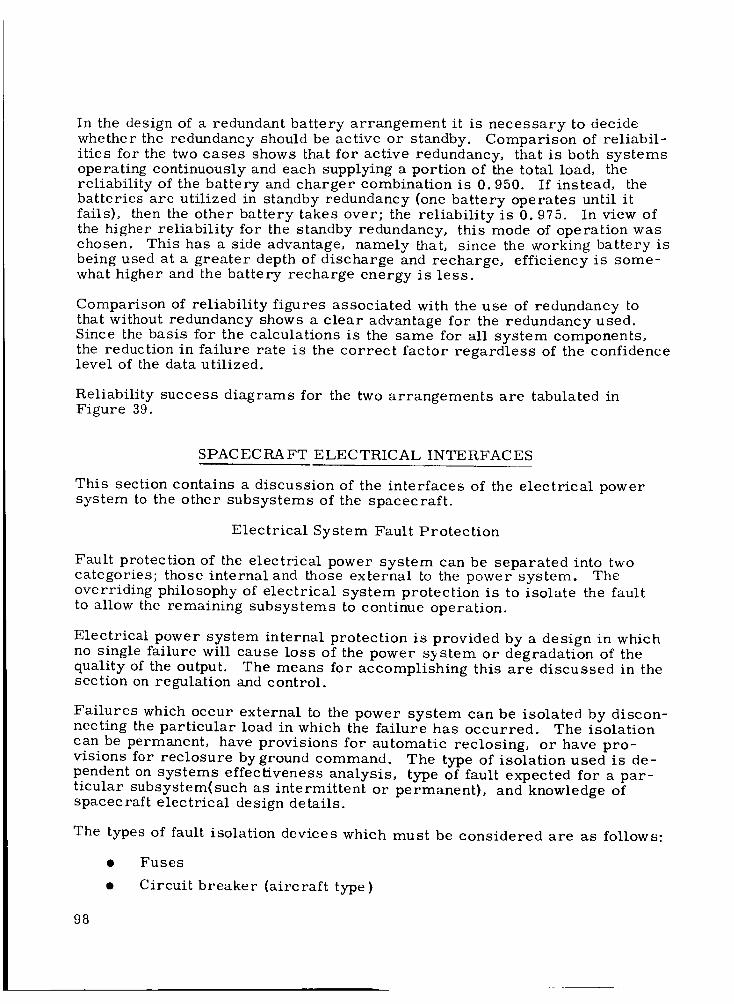
In the design of a redundant battery arrangement it is necessary to decidewhether the redundancy should be active or standby. Comparison of reliabil-ities for the two cases shows that for active redundancy, that is both systemsoperating continuously and each supplying a portion of the total load, thereliability of the battery and charger combination is 0. 950. If instead, thebatteries are utilized in standby redundancy (one battery operates until itfails), then the other battery takes over; the reliability is 0. 975. In view ofthe higher reliability for the standby redundancy, this mode of operation waschosen. This has a side advantage, namely that, since the working battery isbeing used at a greater depth of discharge and recharge, efficiency is some-what higher and the battery recharge energy is less.
Comparison of reliability figures associated with the use of redundancy tothat without redundancy shows a clear advantage for the redundancy used.Since the basis for the calculations is the same for all system components,the reduction in failure rate is the correct factor regardless of the confidencelevel of the data utilized.
Reliability success diagrams for the two arrangements are tabulated inFigure 39.
SPACECRAFT ELECTRICAL INTERFACES
This section contains a discussion of the interfaces of the electrical powersystem to the other subsystems of the spacecraft.
Electrical System Fault Protection
Fault protection of the electrical power system can be separated into twocategories; those internal and those external to the power system. Theoverriding philosophy of electrical system protection is to isolate the faultto allow the remaining subsystems to continue operation.
Electrical power system internal protection is provided by a design in whichno single failure will cause loss of the power s:y stem or degradation of thequality of the output. The means for accomplishing this are discussed in thesection on regulation and control.
Failures which occur external to the power system can be isolated by discon-necting the particular load in which the failure has occurred. The isolation
can be permanent, have provisions for automatic reclosing, or have pro-visions for reclosure by ground command. The type of isolation used is de-pendent on systems effectiveness analysis, type of fault expected for a par-ticular subsystem(such as intermittent or permanent}, and knowledge ofspacecraft electrical design details.
The types of fault isolation devices which must be considered are as follows:
Fuses
Circuit breaker (aircraft type)
98
I
0 I
_= no
o nO_.(]J z 0
n0 n.
I I
I _1,,_ N t_
0 |o
_ I
I _. I0 I
I
e-o°--
c0¢3
=
0Z=
L.
L.
u_
0_
II
I '
I
>3 _.
0
i
III
c-O
0O
=
(IJ
=
r__, m
o
_l _
I
I.
_ I o
0
c
0
E0O
0
0
e-
e-
o_
e--
r/l
000
.r.-Ir--I.PI
t_.,--I
0N
0
99
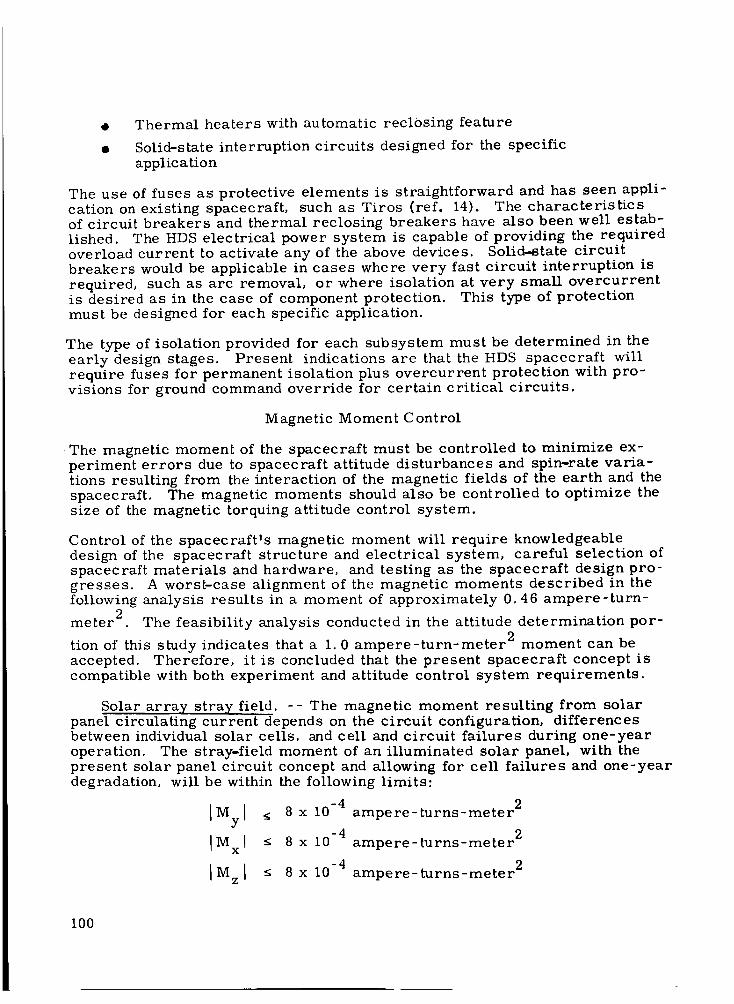
O Thermal heaters with automatic recl0sing feature
Solid-state interruption circuits designed for the specific
application
The use of fuses as protective elements is straightforward and has seen appli-cation on existing spacecraft, such as Tiros (ref. 14}. The characteristicsof circuit breakers and thermal reclosing breakers have also been well estab-lished. The HDS electrical power system is capable of providing the requiredoverload current to activate any of the above devices. Solid-state circuitbreakers would be applicable in cases where very fast circuit interruption isrequired, such as arc removal, or where isolation at very small overcurrentis desired as in the case of component protection. This type of protectionmust be designed for each specific application.
The type of isolation provided for each subsystem must be determined in theearly design stages. Present indications are that the HDS spacecraft willrequire fuses for permanent isolation plus overcurrent protection with pro-visions for ground command override for certain critical circuits.
Magnetic Moment Control
. The magnetic moment of the spacecraft must be controlled to minimize ex-periment errors due to spacecraft attitude disturbances and spin-rate varia-tions resulting from the interaction of the magnetic fields of the earth and thespacecraft. The magnetic moments should also be controlled to optimize thesize of the magnetic torquing attitude control system.
Control of the spacecraft's magnetic moment will require knowledgeabledesign of the spacecraft structure and electrical system, careful selection ofspacecraft materials and hardware, and testing as the spacecraft design pro-gresses. A worst-case alignment of the magnetic moments described in thefollowing analysis results in a moment of approximately 0.46 ampere-turn-
meter 2. The feasibility analysis conducted in the attitude determination por-
tion of this study indicates that a 1.0 ampere-turn-meter 2 moment can be
accepted. Therefore, it is concluded that the present spacecraft concept iscompatible with both experiment and attitude control system requirements.
Solar array stray field. -- The magnetic moment resulting from solarpanel circulating current depends on the circuit configuration, differencesbetween individual solar cells, and cell and circuit failures during one-yearoperation. The stray-field moment of an illuminated solar panel, with thepresent solar panel circuit concept and allowing for cell failures and one-yeardegradation, will be within the following limits:
IMyl < 8 x 10 -4 ampere-turns-meter 2
IM xl < 8 x l0 -4 ampere-turns-meter 2
I Mzl < 8 x 10 -4 ampere-turns-meter 2
I00
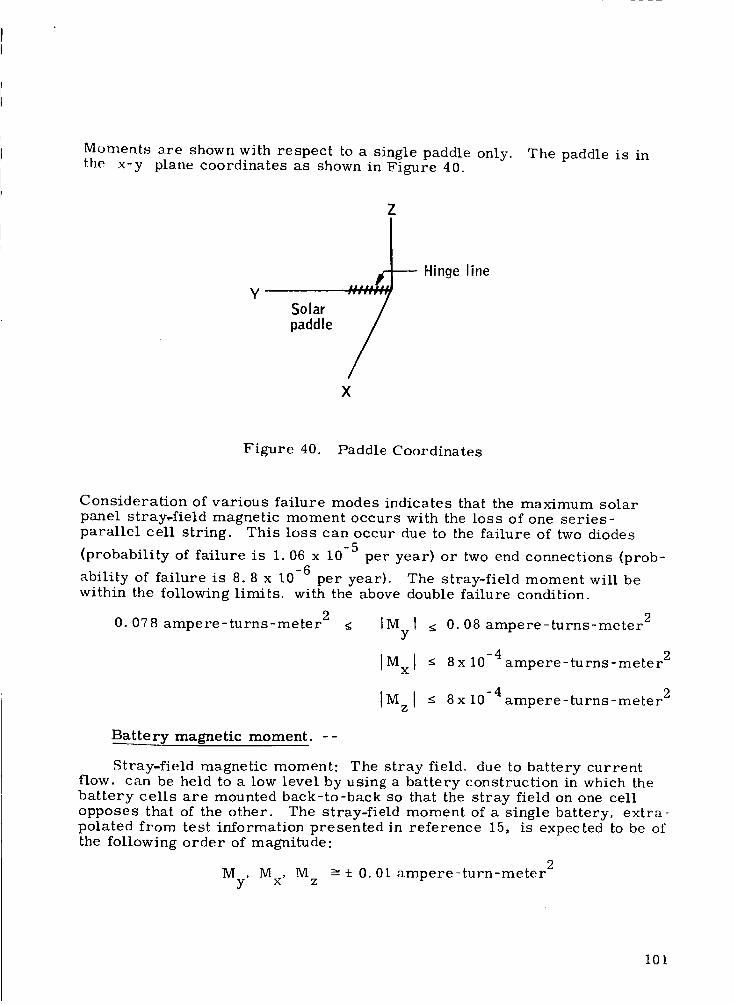
Moments are shown with respect to a single paddle only. The paddle is inthe x-y plane coordinates as shown in Figure 40.
Z
YSolarpaddle
mmmmmm_m
lqrll ww ,
/X
Hinge line
Figure 40. Paddle Coordinates
Consideration of various failure modes indicates that the maximum solarpanel stray-field magnetic moment occurs with the loss of one series-parallel cell string. This loss can occur due to the failure of two diodes
(probability of failure is 1.06 x 10 -5 per year) or two end connections (prob-
ability of failure is 8.8 x 10 -6 per year). The stray-field moment will bewithin the following limits, with the above double failure condition.
0. 078 ampere-turns-meter 2 <IMyl
IMxl
IMz I
< 0.08 ampere-turns-meter "_
< 8x 10 -4ampere-turns-meter 2
< 8x 10⁻⁴ampere-turns-meter 2
Battery magnetic moment. --
Stray-field magnetic moment: The stray field, due to battery currentflow, can be held to a low level by using a battery construction in which thebattery cells are mounted back-to-back so that the stray field on one cellopposes that of the other. The stray-field moment of a single battery, extra-polated from test information presented in reference 15, is expected to be Ofthe following order of magnitude:
2M , M , M -± 0.01 ampere-turn-meter
y x z
I01
A stray field moment of this magnitude should not present a problem; how-ever, this moment could be reduced to a level in the order of 0. 002 ampere-
turns-meter -2 with current compensating loops if necessary.
Permanent magnetization moment: The spacecraft batteries have per-manent magnet characteristics due to the presence of nickel material. Be-cause of the nickel, the magnetic moment of the battery will vary with the mag-nitude of field to which it is exposed during an orbital revolution. Accurate de-termination of the battery moment will require tests to determine the magnet-ization curve. However, .order of magnitude moments have been extrapolatedfrom data presented in reference 15. The order of magnitude moments for asingle HDS battery are as follows:
My, M x, M z m 5 x 10 -4 ampere-turn-meter 2 post deperm
, M x, M --- 0 4 x 10 -2 ampere-turn-meter 2 inducedMy z " (0.26 gauss applied field)
Spacecraft magnetic moment. --
Stray-field magnetic moment: Spacecraft area projected normal to any axi_
is approximately 1.5 meter 2. Maximum electrical current will not exceed four
amp_,_res. Evaluation of stray field data of existing spacecraft shows thatwire twisting, wire routing, etc. will result in stray.field reduction and can-celation so that the resultant field will not be more than one percent of thetotal field. Therefore, the order of magnitude of the total HDS spacecraft,stray field is:
M , M , M _- 4 x 1.5 x 0.01 = 0.06 ampere-turn-meter 2y x z
This does not include solar paddle stray field or eddy current field.
Spacecraft permanent magnetization moment: Reference 16 shows that thepost deperm or post compensation magnetic moment of a typical spacecraft
will be between 0.6 and 6.5 gauss - cm3/lb. Therefore, it should be feasible
to attain a design with a permanent magnetization moment of 0.03 to 0.4
ampere-turn-meter 2. Review of a considerable amount of test data contained
in reference 16 also indicates that the induced magnetic moment (0.38 gauss}will be of the same order of magnitude.
Elec tromagne tic C ompa tibility
Nearly all electronic equipment generates Wtinterferencell components which
are of potential significance to other electronic equipment. These V'inter-ference I components can exist at frequencies from zero to many megahertz.At de and audio frequencies, these currents and voltages are commonlyrecognized and remedied as '1common power supply I_ problems. At higherfrequencies the circuit elerm nts which suppress the lower frequencies maynot perform in the same way. Military Standards such as MIL-I-6181,
102
MIL-I-26600, and MIL-STD-826A establish limit values for interferencegeneration and interference susceptibility such that systems can be assureda high probability of noninterference among the using subsystems. For thisprogram, a similar interference control document will be generated, tailoredto the specific project objectives with realistic control levels.
Conformance of all subsystems to these requirements does not in itselfguarantee freedom from all problems. Ground loops, the subject of laterparagraphs of this report, can cause problems,even though there is conform-ance to the interference control requirements, and thus must be dealt withseparately.
System grounding affects power system control, fault isolation, and signaltransfer between subsystems. The following discussion concerns systemgrounding philosophy as it pertains to the HDS electrical system.
Common practice for modern systems dictates the use of a single-pointgrounding arrangement. This is based on the fact that since the structureis not designed to carry current it is not safe to design a system based onthe use of structure as a current conductor, and this is because of the factthat bonding between adjacent structural elements is based on the need forstructural integrity, not on the need for current-carrying capacity, and theseinterfaces can therefore be the source of large IR drop. Another factor isthat if the structure is utilized to carry current there is a large area ofpotential difficulty associated with the generation of magnetic fields associatedwith the flow of current. With the use of a single-point ground, it is usual tocarry three separate ground leads. These are 1) power ground, 2) signalground, and 3} case ground. The power ground performs the obvious functionof carrying power from the power system to theusing subsystem. The sche-matic diagram of the power grounding wires forms a tree with the branchesall leaving from the power system. The signal ground provides for a signaltransfer between subsystems and may or may not be isolated from the powerground. The case-ground connection serves as a means for guaranteeingelectrical connection between the case of each subsystem and the system
single-point ground and can be thought of as being electrically in parallelwith the structure.
For the simplest circuit design of a given subsystem, the power ground andthe signal ground are common within the box. In the case of interconnectionof the output of one such subsystem to the input of another, a ground loop isunavoidable. This will not adversely affect the power system, but it will be
of significance to the systems which are thus interconnected; this connectionwill add a certain amount of unwanted signal in series with the output of the
one subsystem which appears at the input of the other. This unwanted signalgenerally consists of dc and higher frequency components and is sufficientlycomplex that it approaches complete randomness. Existence of this signalat the input of the receiving subsystem represents a distortion of the datatransmitted from the other subsystem and is therefore an error component.
There are several approaches toward elimination of this error source. Theseapproaches are as follows:
103
Assume that there will be significant ground potentialdifferences between boxes, and design the system to beinsensitive to these voltages. One approach is to makeall signal outputs very large with respect to the straypotentials. This is considered impractical for the HDSsystem since accuracies of 0. 1 percent are required.The alternate approach to designing insensitively toground loops is to make signal output digital in character.Since signal receptors must only be able to differentiatebetween "0" and "1", ground potentials offer no significantproblems. Since this is to be a digital data handling sys-tem, no changes in concept are required. The only hard-ware constraint is that the A[D converters of the instru-ment be designed to be compatible with the instrumentgrounding techniques and be physically near the signalsources.
Require that the signal inputs to each box be differential,thereby eliminating the troublesome flow of signal current.This design approach is sometimes expensive, time con-suming, and often leads to coordination problems duringthe detail design phases of a project.
A common approach is the employment of transistor-magnetic oscillators to achieve separation of the powersystem grounds from the signal ground in each black box.This approach permits great freedom to interconnectboxes in any way but is penalized as the result of severalcharacteristics of these oscillators. They add weight,decrease reliability (since certain added parts are neces-sary), consume added power, and generate large amountsof electromagnetic noise. Suppression of this noise can bea difficult process since the oscillators generate noise in abroad spectrum of frequencies. The transformers in whichthe noise currents flow set inherent limits on the extent towhich spurious capacitive and inductive coupling can be re-duced.
A study of the characteristics and requirements of HDS shows that the firstapproach listed above is definitely the preferable system approach, and thatthe ultimate can be achieved through transmission of digital signals betweenboxes. Output of the data storage system will be of digital form and therebyimmune from ground problems. Output of the starmapper is digital and, iftransmitted at a high enough level, will be immune from the ground noisesource. TheA[D converter associated with the radiometer can be locatednear the radiometer and can receive power from the same lead as the radi-ometer; therefore, the radiometer-to-converter analog signal will not beexposed to the possibility of appreciable error from ground loops.
104
The system grounding tradeoff will be analyzed further as it applies to space-craft system status and temperature monitoring. Spacecraft bonding will alsobe included as it applies to surface potential, circulating currents, and suchfactors as solar panel reliability.
Eddy Currents
Eddy currents will be induced in the conducting surfaces of the spacecraftdue to interaction of the earth's magnetic field and the spinning spacecraft.The eddy current and the magnetic field interact to produce a torque whichreduces the spin rate of the spacecraft and also tends to precess the spinaxis.
Equations developed in reference 17 for symmetrically spinning thick- andthin-wall cylinders show that the induced torque is dependent on the space-craft configuration (length, diameter, fineness ratio}, the field intensityvector, and the shell conductance.
Spacecraft configuration is largely fixed by the experiment requirements.The field-intensity vector is fixed by the 500 kin, near-polar orbit. There-fore, shell conductance is the only factor which is readily available for eddycurrent control. Further study should be made to determine the feasibilityof reducing eddy currents by controlling conductivity of the spacecraft skin.The present study has been conducted with a worst-case model for the eddycurrent torques.
CONCLUSIONSAND RECOMMENDATIONS
The spacecraft electrical power study has resulted in the following conclu-sions :
A solar cell-battery power subsystem is preferrable to allother candidate power sources.
The recommended solar array configuration is one in whichthe solar ceils are to be mounted on six panels. The panelsare folded against the sides of the hexagonal spacecraft atlaunch and deployed into a common plane at spacecraft sepa-ration from the booster.
The power system concept is tailored to the orbit andinjection accuracies specified. However, any furtherdeparture of the worst-case nodal crossing of the sun-synchronous orbit toward noon/midnight will requiremodifications of the concept.
Reasonable design precautions will ensure that thespacecraft magnetic moment _s compatible with atti-tude determination subsystem requirements.
105
Because of reasons stated previously it is recom-mended that further attention be given to the third-electrode concept, but only as a secondary chargecontroller. If this concept is proven by flight andadditional laboratory experience, it should then beconsidered as a candidate for the primary controller.
106
A PPE NDIX A
SHUNT REGULATOR EFFICIENCY
107
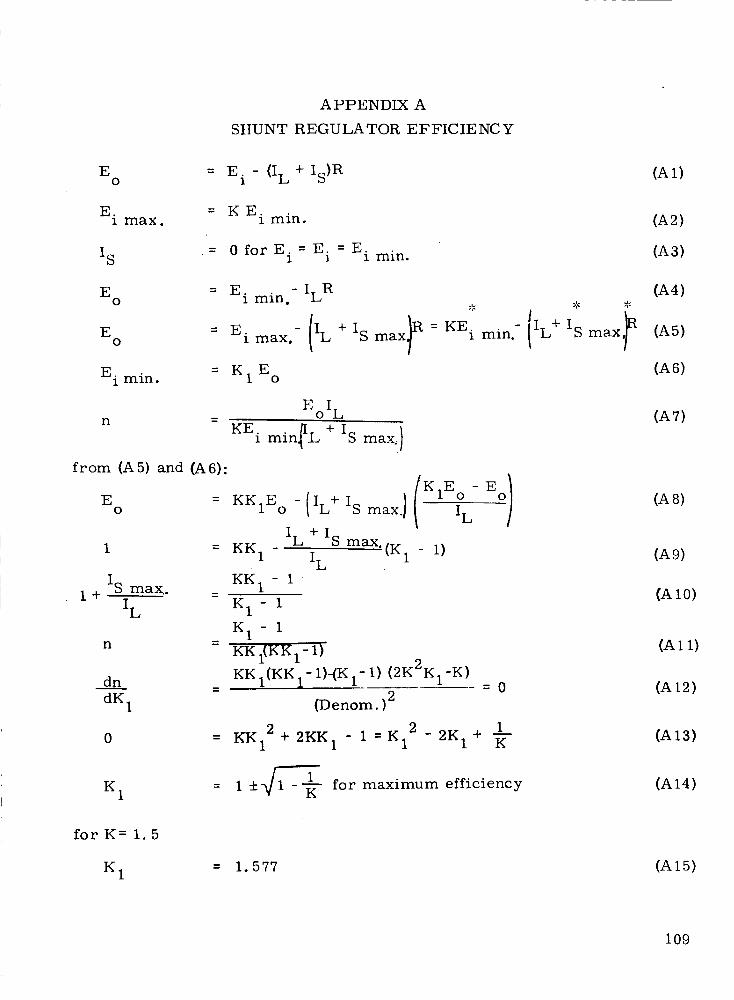
A PPENDIX A
SHUNT REGULA TOR EFFICIE NCY
EO
= E. - (I L + Is)R1
E°
i max.= KE.
1 min.
I S= 0forE. = E. =E.1 1 1 min.
= E. - ILREo 1 min.
= E -(I LEo i max.
E i min. = K I Eo
n
from (A 5} and (A 6):
E __
O
1+IS max.
IT
n
dn
dK 1
E ILO
j. _",¢ -'-
"_-Is maxtR--KE'I min0 IIL_- Is _max
KE. min_L + IS1 max, )
K 1
C }o qKK1Eo -(IL+ IS max.} K1E E
IL
IL + IS max'(K 1 - 1)KK1 I L
KK - 11
K ! - I
K 1 - 1
KKI{KK1- 1)
KK I(KK 1 - 1)-{K 1- 1) (2K2K1 -K)
(Denom.)2
KK12 + 2KK1 - 1 = K12 - 2K 1
=0
1+ --
K
i ± 15_-- _ for maximum efficiency
(A 1)
(A2)
(A3)
(A4)
(A5)
(A6)
(A7)
(A 8)
(A9)
(At0)
(A 11)
(AI2)
(AI3)
(A14)
forK = 1.5
K 1 = 1. 577 (A 15)
109
PRECEDING PAGE BLAbW-,. I_OT,,_
APPENDIX B
POWER OUTPUT OF PANELS ROTATED ABOUT THE HINGE LINE
111
PRECEDING PAGE BLANK NOT FILI_F.D,
APPENDIX B
POWER OUTPUT OF PANELS ROTATEDABOUT THE HINGE LINE
DISC USSION
A preliminary power analysis has been performed, and two options have beenconsidered: that of mounting the solar cells directly to the space vehicle onthe plane front end and the cylindrical surface, and that of mounting solarcells directly on the plane front end and on plane solar paddles. For thelatter case, the optimum orientation of the paddles had to be determined.It is shown that the most obvious orientation, the same plane as the frontplane end of the cylindrical vehicle, is the optimum.
The method of determining the optimum paddle orientation is as follows:The variation of power with angle of incidence is closely proportional to thecosine function of angle of incidence. Hence, one wishes to compute the timeaverage value of cosine of angle of incidence for various positions of the sunand for various paddle orientations as the space vehicle spins about its cylin-drical axis (Figure B-1).
Let a be the angle the paddle normally makes with the vehicle's cylindricalaxis (or the angle the paddle makes with the plane front of the cylinder). Theoptimum value of a is that which maximizes the time average value of cosineof angle of incidence and turns out to be a = 0 for the entire range of vehicleorientation (with respect to the sun) expected. Let ¢ be the angle the sun'sposition makes with the vehicle cylindrical axis. The angle ¢ is initially45 ° but may vary between 31 ° and 65 ° . One more angle is needed, O theangle of spin of the vehicle about its cylLndrica! axis. Using Eu!er's treat-ment of rigid-body motion, ¢ and 0 are the first two Euler angles used inspecifying the orientation of a body (space vehicle) fixed coordinate system(denoted by double primes) and a space (sun) fixed coordinate, system(denoted by no primes), one in which the sun is along the X axis.
The unit normal vector m for one such paddle is defined in terms of a andthe Cartesian unit vector'qn the body fixed (double primed) coordinate system.The cosine of angle of incidence on this paddle is, by definition of the dotproduct, the dot product of the unit normal vector and the unit vector along thespace fixed X axis, along which the sun is located. In the mathematicaltreatment which follows, this dot product is expressed in terms of ¢, {9, and
Ot.
dOSince the vehicle spins at a uniform rate about its cylindrical axis, d--i-
is constant, and the time average value of cosine of angle of incidence ismerely the 0 average value of cosine of angle of incidence (cos /i) for anygiven value of a and ¢. Since cosli is symmetric about O= 0, it is onlynecessary to compute the average value from O = 0 to O = _, or over one-half
113
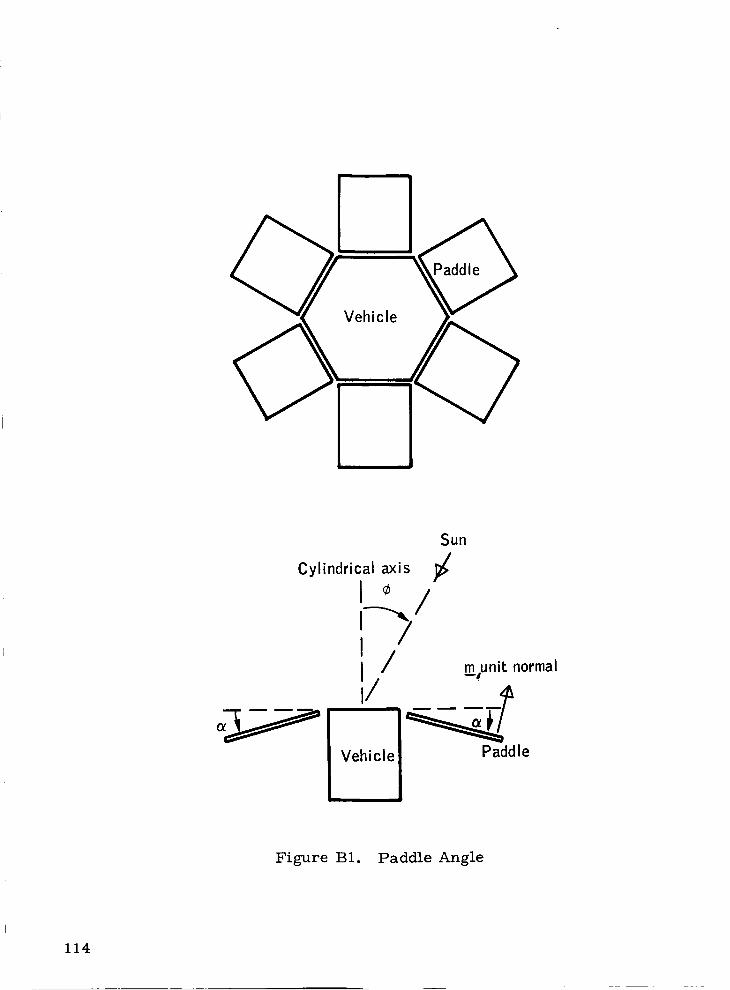
Paddle
Vehicle
Cylindrical axis
Sun
/!
I// rn unit normal
Vehicle Paddle
Figure B1. Paddle Angle
114
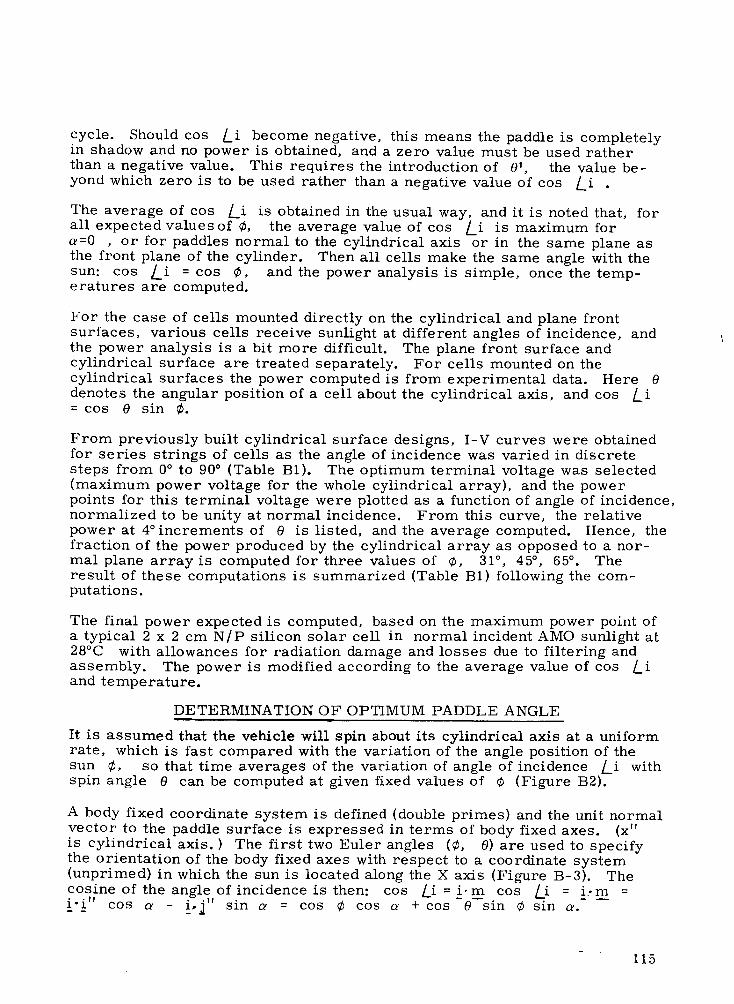
cycle. Should cos L i become negative, this means the paddle is completelyin shadow and no power is obtained, and a zero value must be used rather
than a negative value. This requires the introduction of 0', the value be-
yond which zero is to be used rather than a negative value of cos L i
The average of cos Li is obtained in the usual way, and itis noted that, for
all expected valuesof ¢, the average value of cos L i is maximum fora=O , or for paddles normal to the cylindrical axis or in the same plane asthe front plane of the cylinder. Then all cells make the same angle with the
sun: cos L i = cos ¢, and the power analysis is simple, once the temp-eratures are computed.
For the case of cells mounted directly on the cylindrical and plane frontsurfaces, various cells receive sunlight at different angles of incidence, andthe power analysis is a bit more difficult. The plane front surface andcylindrical surface are treated separately. For cells mounted on thecylindrical surfaces the power computed is from experimental data. Here Odenotes the angular position of a cell about the cylindrical axis, and cos L i= cos 0 sin ¢.
From previously built cylindrical surface designs, I-V curves were obtainedfor series strings of cells as the angle of incidence was varied in discretesteps from 0 ° to 90 ° (Table B1). The optimum terminal voltage was selected(maximum power voltage for the whole cylindrical array), and the powerpoints for this terminal voltage were plotted as a function of angle of incidence,normalized to be unity at normal incidence. From this curve, the relativepower at 4 °increments of O is listed, and the average computed. Hence, thefraction of the power produced by the cylindrical array as opposed to a nor-mal plane array is computed for three values of ¢, 31 ° , 45 °, 65 ° . Theresult of these computations is summarized (Table B1) following the com-putations.
The final power expected is computed, based on the maximum power point ofa typical 2 x 2 cm N/P silicon solar cell in normal incident AMO sunlight at28°C with allowances for radiation damage and losses due to filtering andassembly. The power is modified according to the average value of cos Liand temperature.
DETERMINATION OF OPTIMUM PADDLE ANGLE
It is assumed that the vehicle will spin about its cylindrical axis at a uniformrate, which is fast compared with the variation of the angle position of thesun ¢, so that time averages of the variation of angle of incidence Li withspin angle O can be computed at given fixed values of ¢ (Figure B2).
A body fixed coordinate system is defined (double primes) and the unit normalvector to the paddle surface is expressed in terms of body fixed axes. (x"is cylindrical axis. ) The first two Euler angles (¢, O) are used to specifythe orientation of the body fixed axes with respect to a coordinate system(unprimed) in which the sun is located along the X axis (Figure B-3). Thecosine of the angle of incidence is then: cos Li = i.m cos L i = i,m =i'i" cos _ - i,j" sin _ = cos ¢ cos _ + cos-e--sin ¢ sin _.- --
115
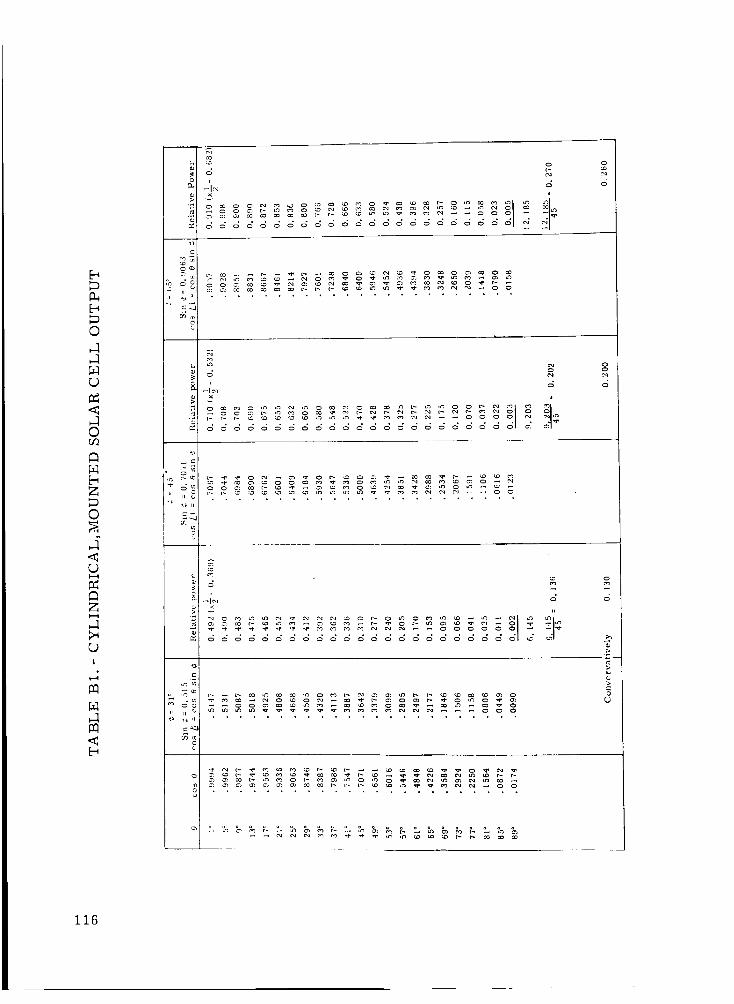
co
c_
6
E_
0
C)
0o']
E_
0
<C)I---I
C)I
,J
<
o
I_,
S.L_
_I_-_ (_x
>
116
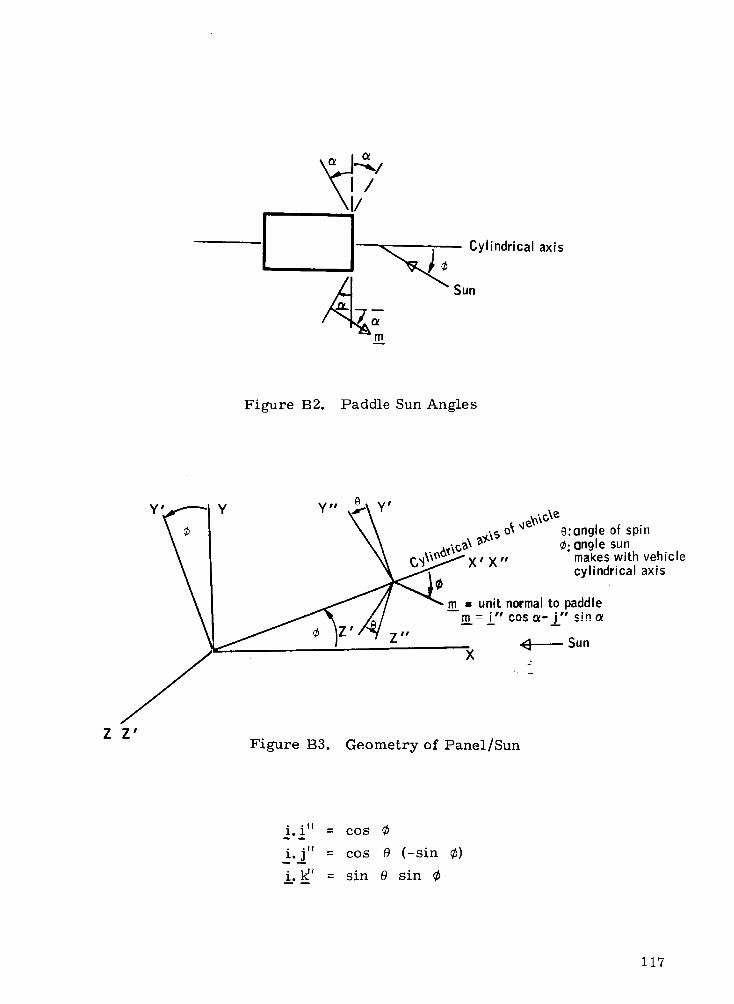
Cylindrical axis
Sun
Figure B2. Paddle Sun Angles
Z
Y'_'-'ly Y"_'\Y' _.,_,_\ ¢ I \ \ :=ok 'J e:angle of spin\ _" I _\ ,,-,G_\_'/"_ ¢.angle sun
\\_m" , ,, " makes with vehicle
_/ _X X cylindricalaxis
_| / // _m • unit normal to paddle\1 _ "_.,/_/ _--_''cos_-j,, si.,
w J=- " _1 Z'" X _Sun
Z'Figure B3. Geometry of Panel/Sun
i.iTT = COS ¢
• .lY
l'! = cos O (-sin ¢)
i.14' = sin 0 sin _b
117
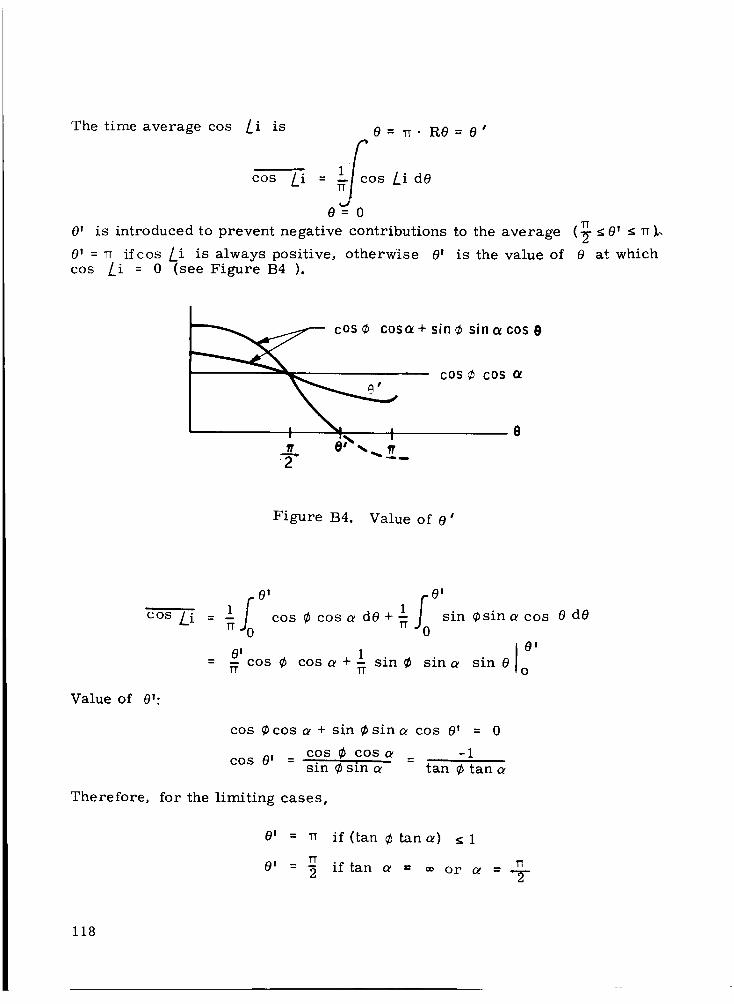
The time average cos L i is 0 = TT" R0 = 0t
f-
cos Li = 1/cosLid0
0=0
0' is introduced to prevent negative contributions to the average
0' = _ if cos L i is always positive, otherwise 0' is the value ofcos Li = 0 (see Figure B4 ).
(_ <O' _ TT_.i
0 at which
cOS ¢
cos(_ + sin ¢ sin o(cos @
e' -,.__T
cos _ cos rJ
6
Figure B4. Value of @'
cos Li
01 01
= _ cos @ cos _ dO + _ sin @sin _ cos 0 dO
I°'O' 1= -- cos ¢ cos oe +_ sin _ sin_ sin 0rr o
Value of 0':
cos @cos _ + sin ¢sinc_ cos O' = 0
cos @ cos _ -iCOS e t =
sin ¢ sin _ tan @ tan
Therefore, for the limiting cases,
(_! = TT
O' =2
if (tan ¢ tan _) < 1
if tan _ " 0o or ot
118
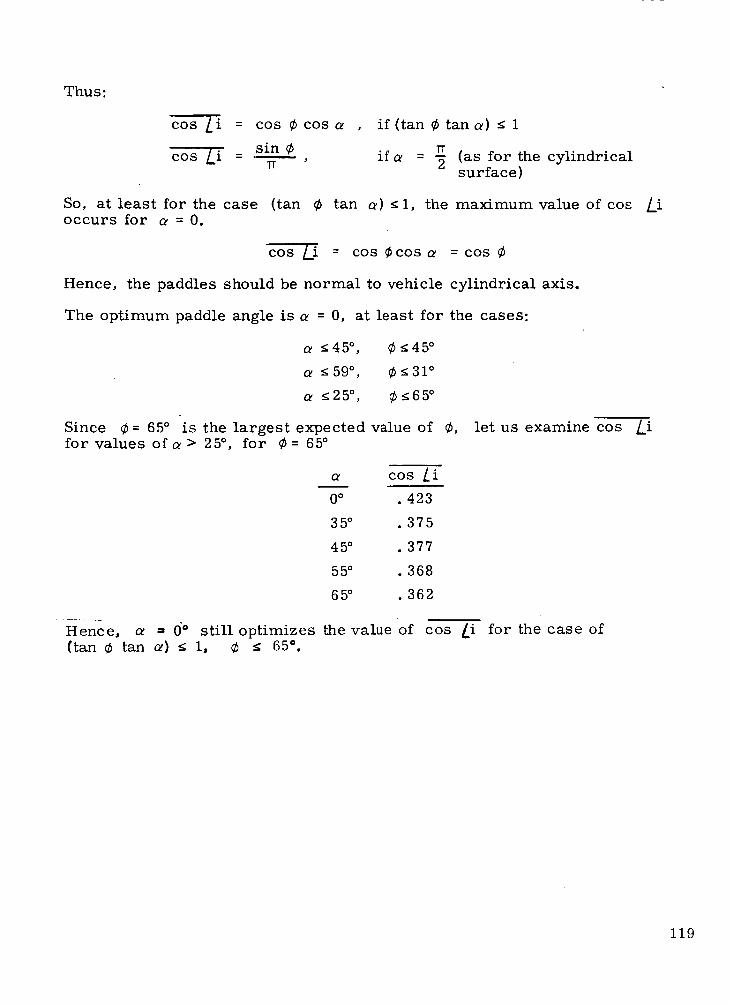
Thus:
cos _ = cos ¢ cos _ , if{tan ¢ tan_) < i
r[cos Li - sin ¢ ifc_ = -- {as for the cylindrical
' 2 surface)
So, at least for the case (tan ¢ tan _) g I, the maximum value of cosoccurs for a = O.
cosLi : cos¢cos =cos¢
Hence, the paddles should be normal to vehicle cylindrical axis.
The optimum paddle angle is _ = O, at least for the cases:
<45 ° , ¢<45 °
_ 59 °, ¢ < 31 °
_25 °, ¢<65 °
Since ¢= 65 ° is the largest expected value of ¢, let us examine cos ].ifor values of_> 25 °, for ¢= 65 °
COS Li
0 ° .423
35 ° . 375
45 ° .377
55 ° .368
65 ° .362
Hence, o_ -" d ° still optimizes the value of cos Li for the case of(Lan¢ tan _) < i, ¢ < 65 ° .
/i
119
] ]_ECED!I_G PAGE BLANK NOT FILMED.
APPENDIX C
POWER OUTPUT OF PANELS ROTATED ABOUTA LINE I_DIAL FROM SPIN AXIS
121
PRECEDING PAGE BLANK NOT F!!._ED.
APPENDIX C
POWER OUTPUT OF PANELS ROTATED ABOUTA LINE RADIAL FROM SPIN AXIS
For very large values of sun-line/spin-axis angle, power output from panelsnormal to the spin axis will be small. One means of correcting this situationwould be to rotate each panel about a line radial from the spin axis (FigureC1). Although such a rotation may cause the panel output to drop to zeroduring part of each spacecraft rotation, it allows the panel to view the sunmore directly during another part of each rotation.
In order to compute the average power output for an array which is rotatedabout a radial line, the coordinates as shown in Figure C2 are used. Thedirection of the sun is
^A A
S = COS O i + sin O j (C1)
and the direction of the normal-to-panel vector is:A A
n = cos k I+ sin k J (C2)
From the geometry
it may be seen that
J3=1^
J = cos ¢ _ - sin Ck (C3)A A
K = sin #j + cos ¢
n = cos k[+ sin k. cos Cj - sin k sin ¢k
The angle between n and s is then determined from
(C2a)
A
COS (n, s) = n . s = cos O cos k + sin 0 sin )_ cos ¢ (C4)
The simplifying assumption is made that panel power output is proportional toA% _ ° • . _
cos (n, s) for positive values and zero for negahve values. Th'e averagerelative power output of a panel over one spacecraft rotation is then
P = -_- (_. _)d_b = i1 (cos O cos k + sin Osin kcos ¢)d¢ (C5)2_
123
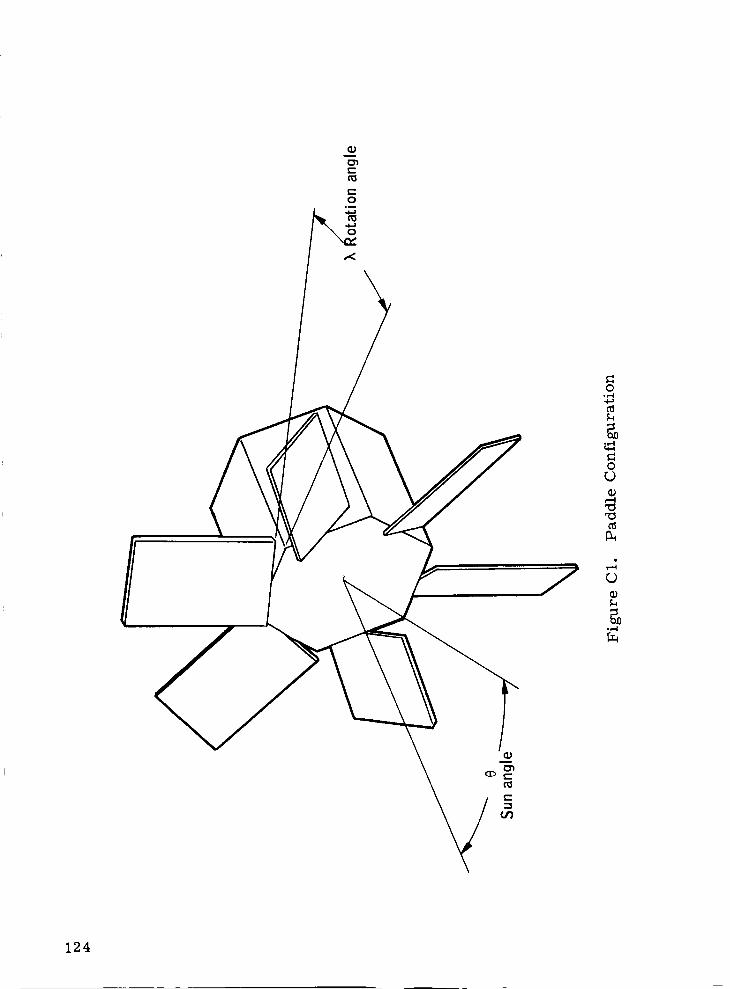
Oo,-4
O
Q)
CD
.,--_
124
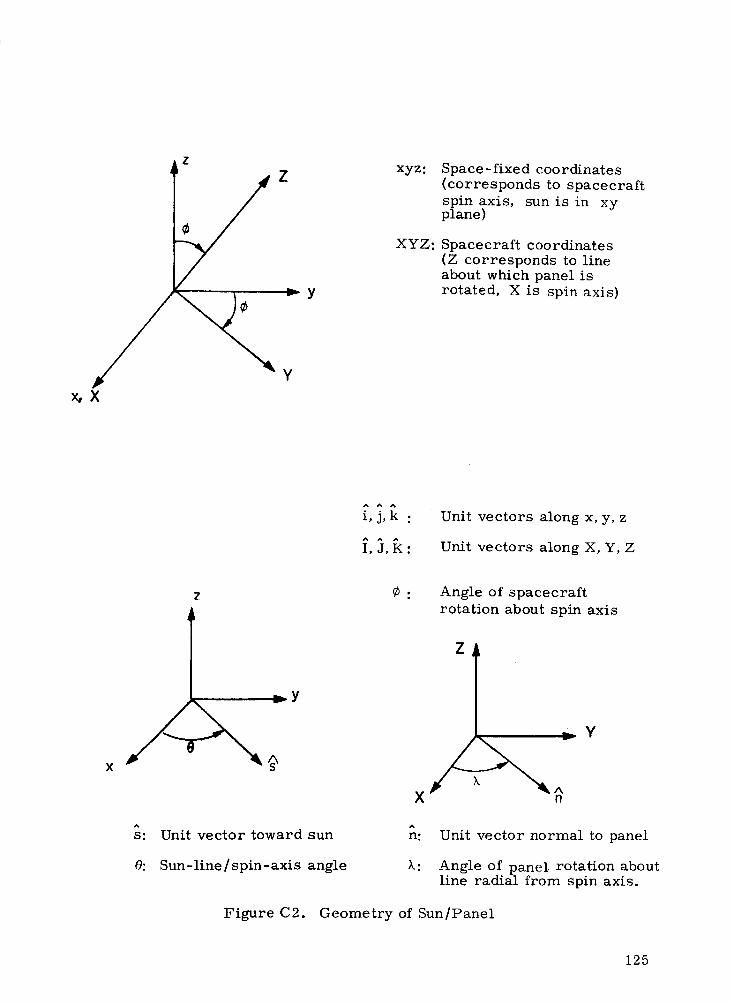
z
Z
¢
Y
x,X
y
xyz:
XYZ:
Space-fixed coordinates
(corresponds to spacecraft
spin axis, sun is in xyplane)
Spacecraft coordinates
(Z corresponds to line
about which panel is
rotated, X is spin axis)
A
^ ^ _I,J, :
Unit vectors along x, y, z
Unit vectors along X, Y, Z
z
_Y
x
Angle of spacecraft
rotation about spin axis
Z
-Y
X n
A
s: Unit vector toward sun n: Unit vector normal to panel
0: Sun-line/spin-axis angle k: Angle of panel rotation aboutline radial from spin axis.
Figure C2. Geometry of Sun/Panel
125
where
U
L =
-iCOS
-U
for k>tan -1 (cot 0)
or
U = 17
L = -17
Note that for k <tan-i (cot 0)
for k <tan -1 (cot O)
the average relative power becomes
-1 = cos 0 cos k (C6)k <tan (cot0)
which indicates that power is maximized, for this regime only, by keepingk at zero (no panel rotation). For greater k values, the average relativepower becomes:
i[ ]k>tan -1 (cotS) = 5 U cos 0 cos k+ sin O sin k sin U (C7)
where
U = cos -i I -cos O COS k 1sin 8 sin k I
The average relative power based on these equations is plotted in Figure C3
as a function of k for values of 0 from zero to 90 degrees. Note that forsun-line/spin-axis angles less than about 70 degrees no advantage is gained
by panel rotation; usually power is lost. If sun angles in excess of about 70degrees were expected, provision for a panel rotation to about 70 degrees
would then allow a nearly constant power output at about 30 percent of fullnormal illumination with little change as sun-line/spin-axis angle changes.
Since the mean sun-line/spin-axis angle for the HDS mission as presently
envisioned is 45 degrees, with a 3-sigma expected high value of 65 degreeswithin a year's mission (based on two-stage Delta launch vehicle), theredoes not appear to be any good reason to provide for panel rotation. Altera-tion of either the mean value, or of expected dispersions, could alter this
conclusion. It should be mentioned that the error in the assumption regard-ing power being proportioned to cos (_,, _) does not really change the con-clusion. Panel power will fall below the cosine law value in the vicinity of(n, _) = 90 degrees. All cases below the broken line left of 65 degrees
panel rotation and those immediately above it in Figure C3 will pass throughthis condition during each spacecraft revolution and will therefore generateless power than shown.
126
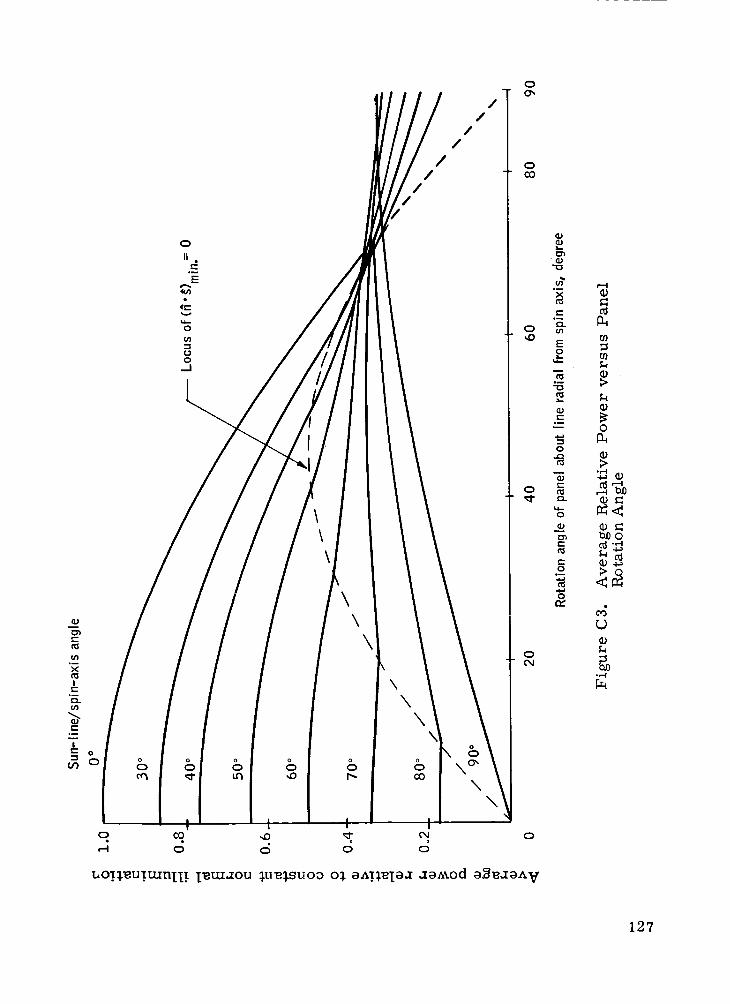
!t,,-
o_
c
!
0
//
/
//
/
o0
\
uoT_uTu_nIi! I_uI-TOU _u_TSUOO o_ eAT_Ie.T .TetAod ei_.leA V
e-4
O
.,-4
¢_t:_0o
r_
°r,,4
127
PRECEDING PAGE BLANK NOT FIL/gtED.
APPENDIX D
SOLAR ARRAY RADIATION DEGRADATION
129
PRECEI_ING PAGE BLANK NOT FILMED.
APPENDIX D
SOLAR ARRAY RADIATION DEGRADATION
The damage to solar cells by high energy electrons and protons is caused bydefects produced in the silicon crystal lattice. These effects cause currentand voltage degradation which has been investigated during the past fewyears. Different particles and varying energy levels produce differenteffects in the cells. When dealing with heterogenous particles with complexspectra, it is necessary to reduce the flux components to a common base sothat they can be integrated. Thus, the flux equivalents may be combined,whereas the damage effects cannot be simply added. The laboratory ex-periments have usually been made with 1 MeV electrons, so that the bestdata are based on equivalent 1 MeV electron radiation damage rates. Inutilizing the results typical radiation environments must, therefore, firstbe converted to the equivalent 1 MeV electron fluxes. Upon conversion, theindividual sources can be simply added together to obtain the total of 1 MeVequivalent electron flux which determines the solar cell damage values.
For this radiation analysis three high-energy sources of particle radiationwere considered, including trapped electrons with energies from 0. 5 MeVto 7 MeV; trapped protons with energies from about 4 MeV to greater than300 MeV; and solar protons whose effect on the trapped particles is includedin the first groups and which otherwise can be neglected for this orbit due toshielding by the earth' s magnetic field. Each of these radiation sourcesmust be converted to an equivalent of 1 MeV electron flux before the totalsolar cell damage value can be determined.
The conversion can be made by determining the damage caused by the par-ticular radiation spectrum and correlating such losses with the quantity of1 MeV electrons needed to produce the same result. Because of the practi-cal problems involved in simulating such spectra, a more convenient methodhas been developed which makes it possible to make these conversions bysemi-theoretical - semi-experimental methods.
The technique for converting electron and proton fluxes into an equivalent1 MeV electron flux which in turn determines the solar cell degradation issummarized in the five-step procedure given below.
Step 1. Determine the coverglass shield value (g/cm] for thetype and thickness coverglass to be used. This factorcan be taken from Figure D1.
Step 2. Determine the equivalent 1 MeV electron flux CEE
corresponding to the omnidirectional electron flux CF
for the particular electron energy F considered.
131
Flux _bF is obtained at 90 ° inclination from the
orbital radiation environment data from Table DI.
The equivalent 1 MeV electron flux due to trapped
electrons ¢EE is determined using the equation
F __
_EE = _ RF CF
F=0
Step 3.
where R F is the conversion ratio (equivalent
1 MeV normal incident electrons per unit omin-directional electron flux for the electron energy
F considered from Figure D2). This calculationis summarized in Table D2.
Determine the equivalent 1 MeV electron flux
CEP corresponding to the omnidirectional portion
flux CK for the proton energy K considered.
The value of CK is obtained from the orbital
radiation data from Tables D3 through D6. The
equivalent 1 MeV flux due to trapped protons CEPis determined using the equation
eKe %¢KK=0
Step 4.
where N K is the conversion ratio (equivlent
1 MeV electrons per unit omnidirectional protonflux for the proton energy K considered from
Figure D3). This calculation is shown in TableD7.
Determine the total equivalent 1 MeV electron
flux by adding the 1 MeV equivalent flux
values due to electrons and protons.
CTotal = CEE + CEp
132
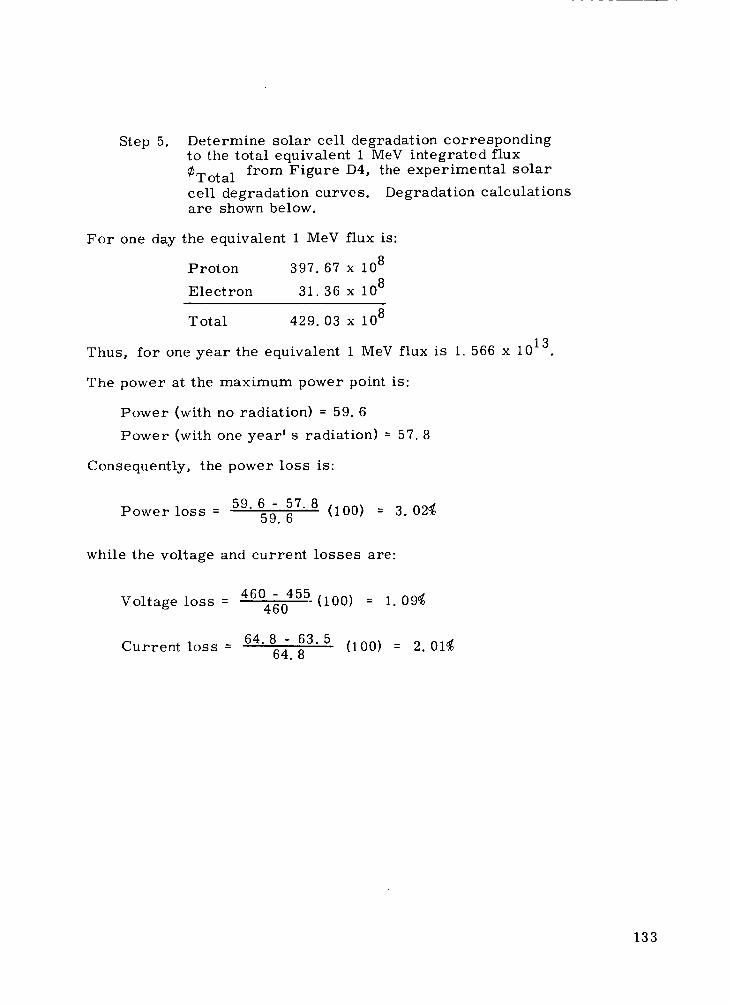
Step 5. Determine solar cell degradation correspondingto the total equivalent 1 MeV integrated flux
CTotal from Figure D4, the experimental solar
cell degradation curves. Degradation calculationsare shown below.
For one day the equivalent 1 MeV flux is:
Proton 397.67 x 10⁸
Electron 31. 36 x 108
Total 429. 03 x 108
Thus, for one year the equivalent 1 MeV flux is 1. 566 x 1013 .
The power at the maximum power point is:
Power (with no radiation) = 59. 6
Power (with one year' s radiation) = 57.8
Consequently, the power loss is:
Power loss = 59.6 - 57.8 (100) -- 3. 02459.6
while the voltage and current losses are:
Voltage loss = 460 - 455 (i00) = 1 094460
Current loss = 64.8 - 63.5 (i00) = 2. 01464.8
133
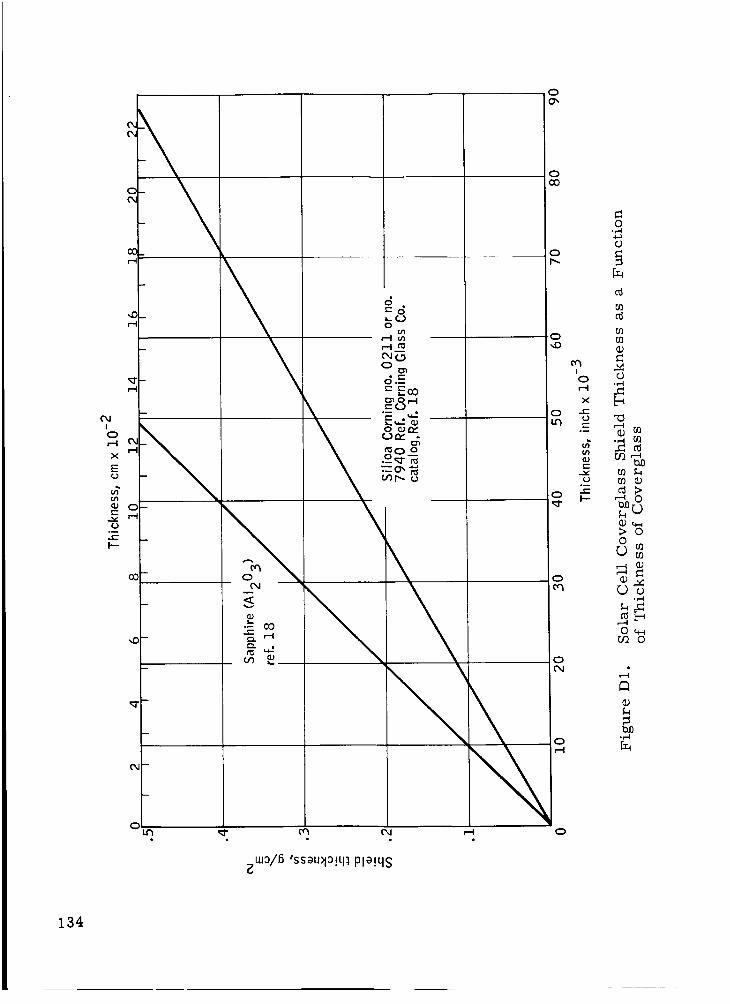
O
wi--I
i--I
'or-i
x
(D
I--
(3",
O
03
,,C
m
O,I-
O
d=dO
(I)
Cu(DO
d. ==.=e00701--I
.=__CJ •/ 0 (_ a::::
_0 o
°_
..E PIQ.
cO
o
o_D
Lu0/6 'ssau)_0!41 pla!4S
OcM
Or-I
O
I
Or-4
x(--(D4--
°_
E.-Y
"r-
0or-I
@
r/l
r/1r/l
ol-'1
,--4
_ 0
_ o0
°_--I
0_.._r_ 0
t_or.4
134
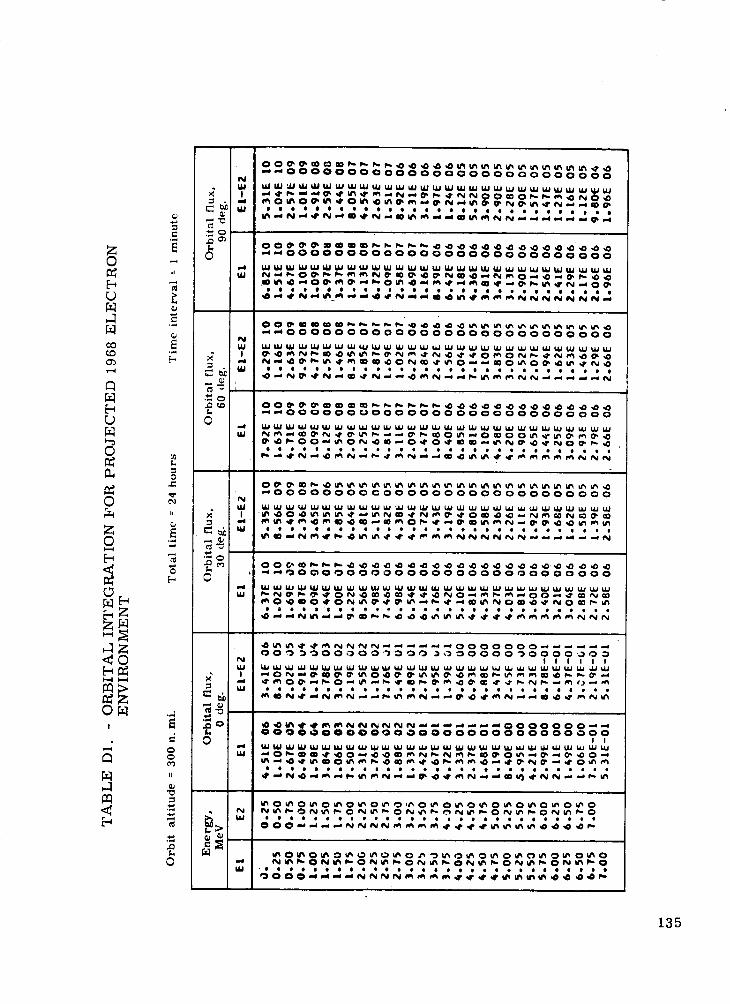
Z0
_J
,-]
O0¢D
1-,i
L)
0
Z0
_Z
_Z
OalI
b_
c0
e.,
tl
¢0
0e-
ll
c.,
b_
0
ii
e_
0
0
L0
x"
0
"_o0
_000000000000000000000000000
®o_0_0_0_ ___N_N_
mlUJ
_0000000000000000
.m_o_m_O_ __m
0
Ncu
I ¢_
I_,
0
0
NU,J I,_I "_/'_
0
00000000000
c'JN_d k_
0
U.I
ud
_00000000000 0000000000000000
_000000_0000 0000000000000000
O0000000CO00
___W_O
0000000000000000
_ _ _ _ _ _ _ _ _ _ _._ _ _ _ _00000000_0000000
_ 3_0000_0000_0_|11111
_mmNNNNNN __0000000_0000000000000000
II
135
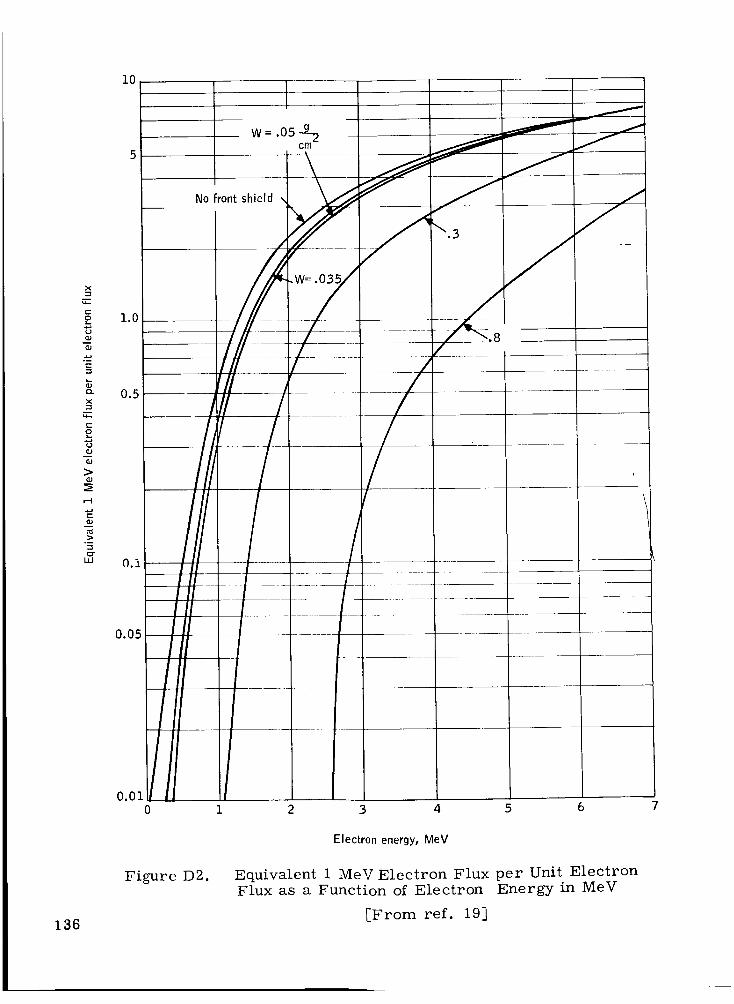
I0
X
e-
.o
Eom
=
X
mv,_
v-
o
_D
>
CDB
o_
UJ
1.0
0.5
N0
IIIIII0.05'
//I//
0.0 /,
0
W = .05
front shield x
/
///
///
/f
1 2 3 4 5 6 7
Electron energy, MeV
Figure D2. Equivalent 1 MeV Electron Flux per Unit ElectronFlux as a Function of Electron Energy in MeV
136 [From ref. 19]
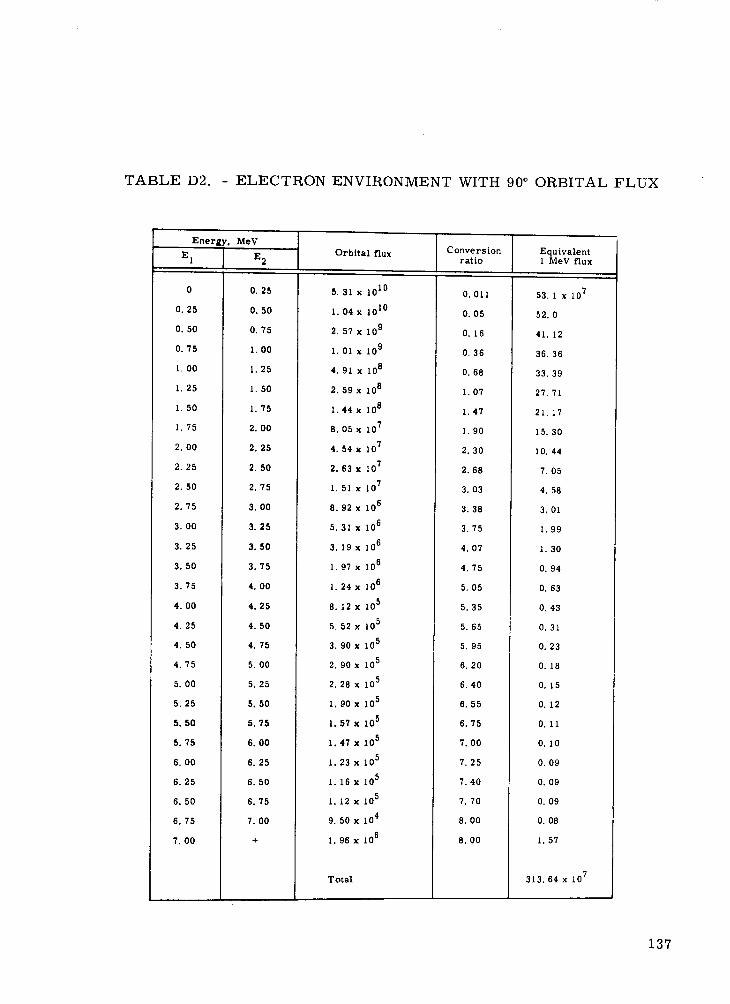
TABLE D2. - ELECTRON ENVIRONMENT WITH 90 ° ORBITAL FLUX
Energy, MeV
E 1
0
0.25
0. 50
0.75
I. 00
1.25
1. 50
1.75
2.00
2.25
2.50
2.75
3.00
3.25
3. 50
3.75
4. O0
4. 25
4. 50
4.75
5. O0
5.25
5. 50
5.75
6. O0
6.25
6. 50
6.75
7.00
E 2
Orbit al flux
x 1010
x 1010
x 109
1. O1 x 109
4. 91 x 108
2. 59 x 106
1. 44 x 106
8. 05 x 107
4. 54 x 107
2.63 x 10⁷
1. 51 x 107
8. 92 x 106
5. 31 x 106
3. 19 x 106
1. 97 x 106
1. 24 x 106
8. 12 x 105
5. 52 x 105
3. 90 x 105
2.90 x 10⁵
2, 28 x 105
1.90 x 10⁵
1.57 x 10⁵
i. 47 x 105
I. 23 x 105
I. 16 x 105
I. 12 x 105
9. 50 x 104
I. 96 x 106
Total
0.25 5. 31
0,50 1,04
0.75 2. 57
1. O0
1.25
1. 50
1. 75
2. O0
2.25
2. 50
2.75
3. O0
3.25
3.50
3.75
4.00
4.25
4. 50
4.75
5. O0
5.25
5. 50
5.75
6. O0
6.25
6. 50
6.75
7. O0
+
,
Conversion
ratio
O. 011
0.05
0.16
0.36
O. 68
1.07
1,47
1. 90
2. 30
2.68
3.03
3.38
3.75
4. 07
4.75
5. 05
5.35
5.65
5.95
6,20
6.40
6.55
6.75
7.00
7.25
7.40
7.70
8. O0
8. O0
Equivalent1 MeV flux
53. 1 x 10⁷
52.0
41. 12
36. 36
33. 39
27. 71
21. 17
15. 30
10. 44
7.05
4. 58
3. O1
1. 99
1. 30
O. 94
O. 63
O. 43
0.31
0.23
0.18
0.15
0.12
0.11
0.10
O. 09
O. 09
O. 09
0.06
1.57
313.64 x 10⁷
137
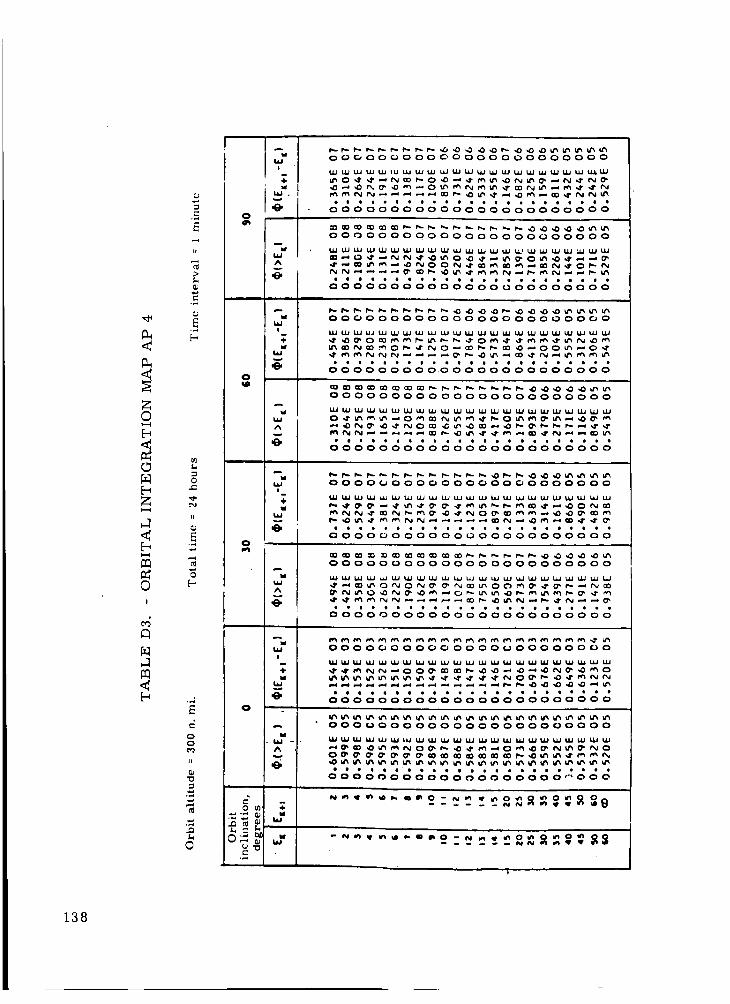
r,
:>
<
Z©
E_
;,..-.4I{
N _O _-
I
_4
N
_ .._E
QO
ii
0
4.
O
Jw
A
!
÷M
O
w
W
A
÷
O
.%
w
w
÷
o •
A
0 _' 4.
"_,
O0000000000000000000000
__0____
ggdddgggdddddgg&gggdggg
00000000000000000000000
gdgdggdgg&_dggddggdgggg
00000000000000000000000
dggdd&gggggdgdgddgdgg&g
00000000000000000000000
ggdgdgddddgdggggggdgggg
00000000000000000000000
O0 00000000 _000 0 0
____0__
dggdddgggggdgdgggggd&gg
000_0000000000000000000
0______
dg_gdddddddggdddgdg,-:gdg
138
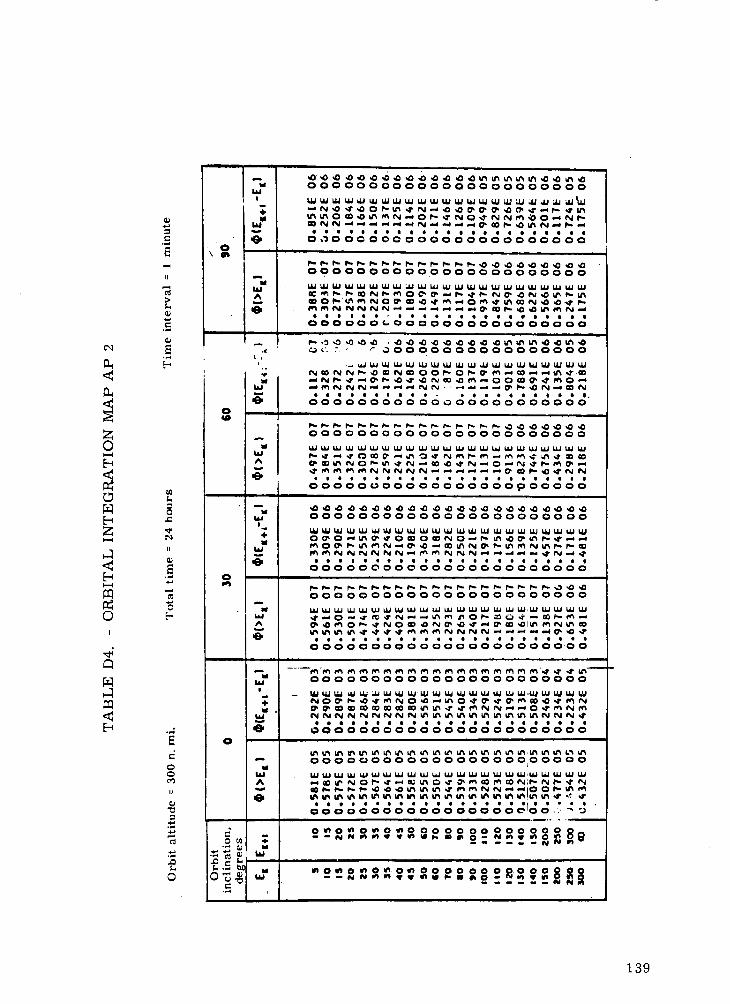
<
Z0
Z
c_O
I
,<
E
II
L
0r'
II
• °
d
II
0
o
°.
Iml
bsJ
A
NI
4,t_
t,Jw
,8.
o
u_L,J
,8.
bs,I|
4"
Oo
%A
,8,
m0 _ 4,
o_i
O_'- : ' r 000 00000000000000
ggddgdg_gga_&gddddggdg
000000000000000000000_0
dgggdgdgdggdgdgdd_dddgg
000000000000000000:00000
gdggd_dggddgdgddggdggdd
00000000000000000000000
_____,__
gdgdgdgdddgddddgddddd.dd
00000000000000000000000
_c;dd_gggc_gdggc;g_gdc_g_;g
dgggdgdgddddgdddd_-_dg.:''-.;
o___o_o_o _o oo o.o o_oooo oooo 80N N
139
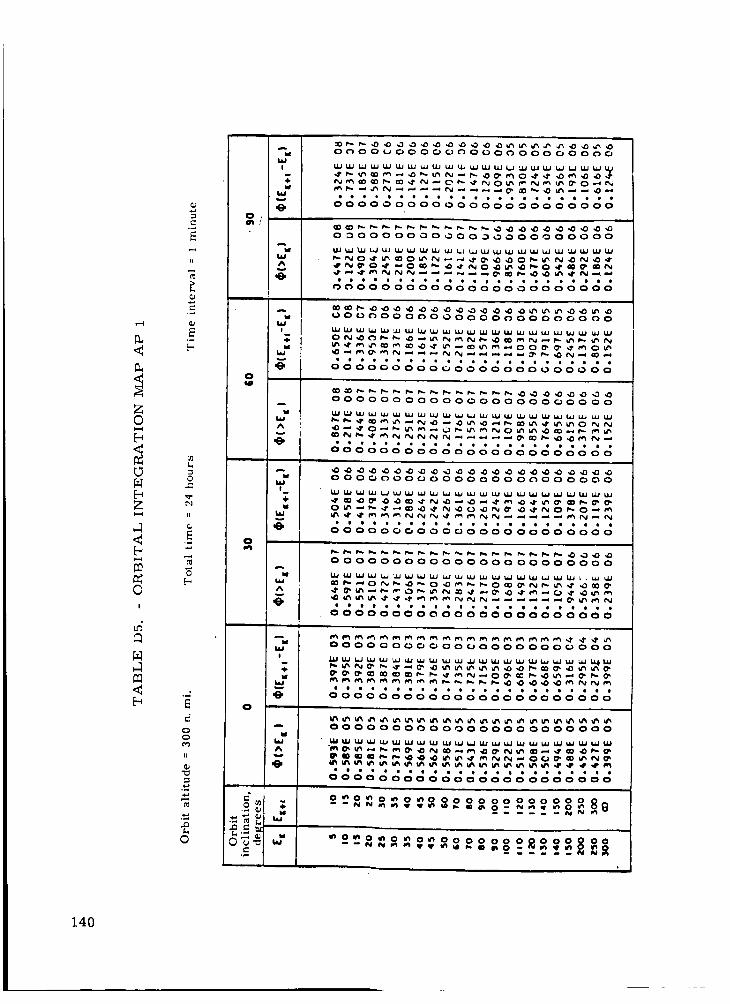
0
Z
0I
B
ii
B
0
r.
_3
{I
B
b.,
00
II
e_
0
0
o
t
{ o
{
W1
4.w
Ww
wWA
|
w
W :A
W
I
Ww
{
Av
M
I
÷M
Wv
W
AV
MW
J
O_O0_O000_OO0_O00000_O
ggggggggggggggg&ggdg&g&
0._0000000_00_0000000000
___N___._
dggddddddgggdgdgdggdd&g
_0_00_000000_000_00_0
dgggggggdgggggdggggdgdg
00000000000000000000000
gggdgdgggggggdgggggggdd
0000000_00000000_000000
gddggdggggg&&ggggggdggg
00000000000000000000000
llOlleeoeelellllllellll
000000_000_000000_000
dggggggdggddgggggggg&gg
00000000000000000000000
"m______
eeoeoooeeleoeeeoeeoooee
o_.+mmo+o_ooooooooooooo_:____ +._e
140
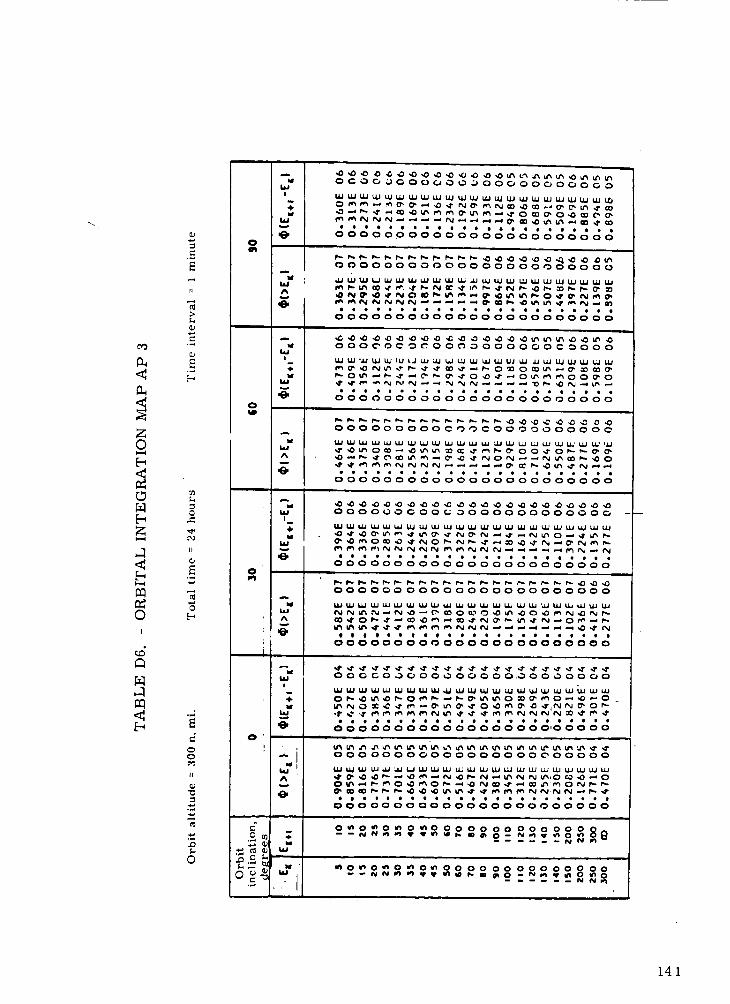
C_
Z0
b
0I
,-1
E
c.
0
E
:n
:3
e,
i1
o
E
..4
0
0
ii
,.0
o
W!
+
,8,o
A
.e.
i
w
1
7,
.e,0
ww
A
,e.
w
I
,4.w
L_
,8.
o
wW
w
I
o
÷
w
"8,
0 '
I -iA
.8.
o_ Y.
OCO0_CQ_OO_QOOOOOOOOQ_
ddddgjdd&ddgddjdddjjdgd
0000000_00000000000000_
gdddgddggddgdddddddddgd
O00_O_OCO0_O00000_O000
ggdgdgggdgdggggdddg&gdd
O00000000CO0_O00000000O
gdgddgdddgdddd&dd&gddgg
O00000OOOCOO00000000000
JdJ_gddgggddJdddJgdgjdd
ggJJggggdgdggddgddggggg
00 C. C., 0 .,_ 000 ,_ 00000,_D 00 _,._ 0000
gdgggJggggggJggJdJ,dgdgJ
gddgdddddddgddddddddddd
141
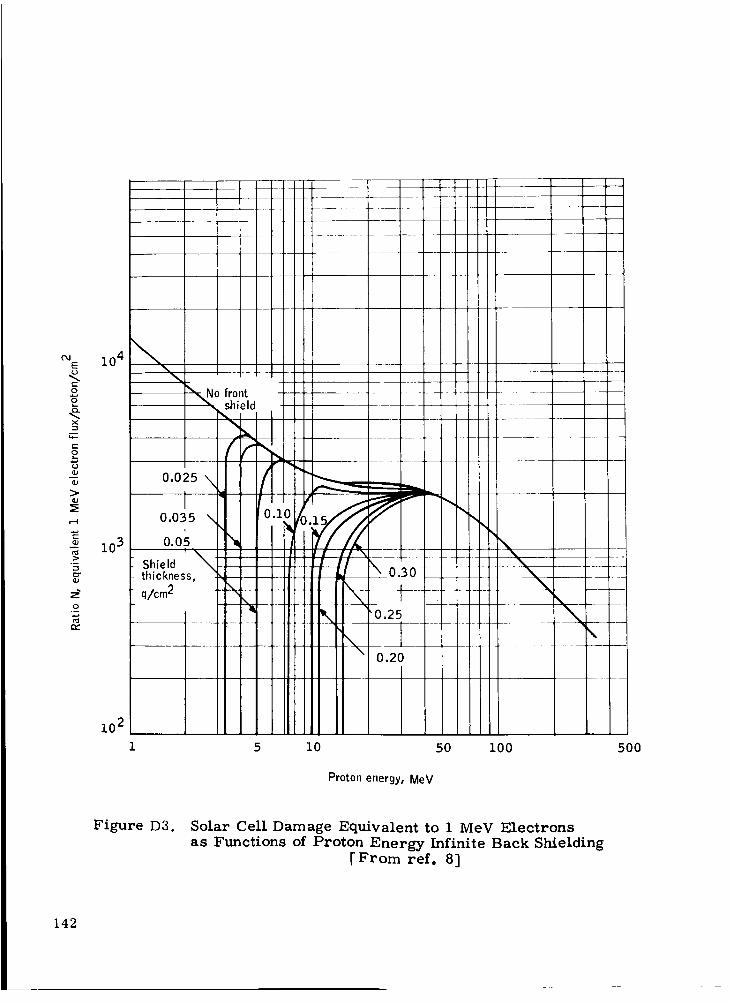
10 4E
e-o
gX
U
>
r...t
-_ i0 3
o
102
5 10 5O 100
Proton energy, MeV
500
Figure D3. Solar Cell Damage Equivalent to 1 MeV Electrons
as Functions of Proton Energy Infinite Back Shielding[From ref. 8]
142
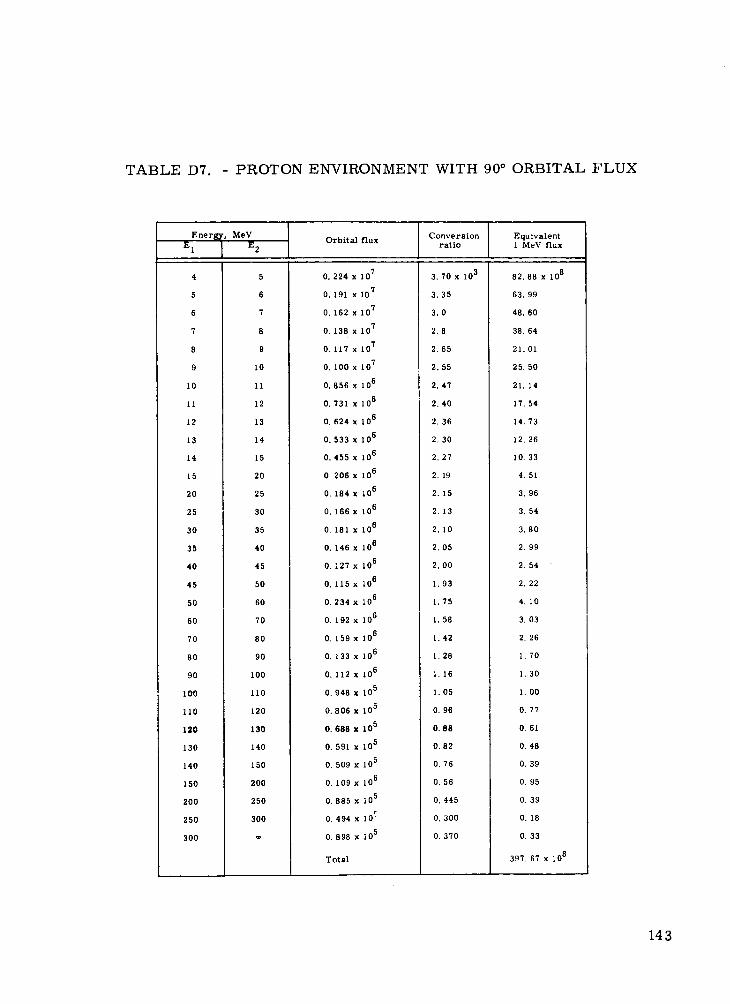
TABLE D7. - PROTON ENVIRONMENT WITH 90° ORBITAL FLUX
Ener_a
E 1
4
5
6
7
8
9
10
11
12
13
14
15
2O
25
30
35
4O
45
50
60
70
80
90
100
110
120
130
140
150
2OO
250
3OO
Orbital fluxMeV
E 2
5
6 0.191
7 0.162
8 0.138
9 0.117
10 0.100
11 0.856
12 0.731
13 0.624
14 0.533
15 0.455
20 0.206
25 0.184
30 0,166
35 0.181
40 0.146
45 0.127
50 0.116
60 0.234
70 0.192
80 0.159
90 0.133
100 0.112
110 0.948
120 0.806
130 0.688
140 0.591
O. 224 x 107
x 107
x 107
x 107
x 107
x 107
x 106
x 106
x 106
x 106
x 106
x 106
x 106
x 106
x 106
x 106
x 106
x 106
x 106
x 106
x 106
x 106
x 106
x 105
x 105
x 105
x 105
0.509 x 10⁵
0.109 x 10⁶
0.885 x 10⁵
O. 494 x 10 _
0.898 x 10⁵
Conversionratio
Equivalenti MeV flux
150
200
250
300
=
Total
3. 70 x 103
3.35
3.0
2.8
2.65
2.55
2.47
2.40
2.36
2.30
2.27
2. 19
2.15
2.13
2,10
2.05
2, O0
1.93
1.75
1.58
1.42
1.28
1.16
1. O5
O. 96
0.88
0.82
0.76
0.56
O, 445
O. 300
0. 370
82.88 x 10⁸
63. 99
48.60
38.64
21. O1
25. 50
21. 14
17. 54
14.73
12. 26
10. 33
4.51
3. 96
3. 54
3.60
2.99
2. 54
2. 22
4.10
3. 03
2. 26
1. 70
1. 30
1. 00
0.77
0. 61
O. 48
0.39
0. 95
0.39
0.18
O. 33
397. 67 x 108
143
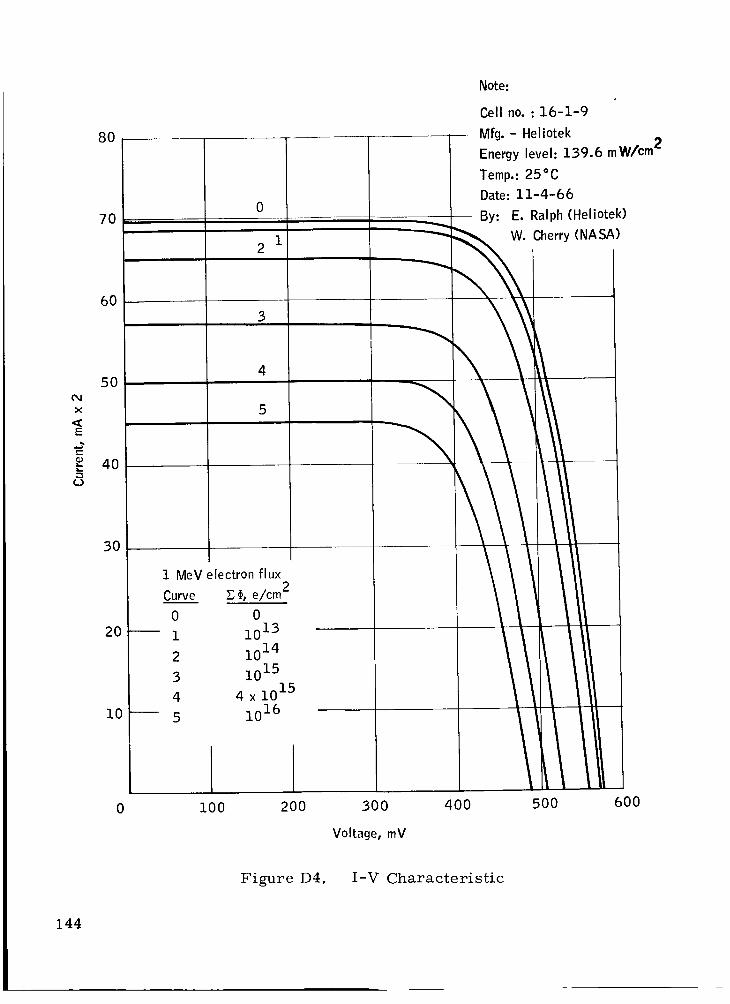
Od
X
,¢E
(D
80
70
60
50
40
30
20
10
Note:
0
3
4
12
5
Cellno.:16-1-9
Mfg.- Heliotek
Energylevel:139.6 mW/cm 2
Temp.:25°C
Date:11-4-66
By: E. Ralph(Heliote
__Cherry (NASA
1 MeV electron flux
Curve _ _, e/cm 2
0 01 1013
2 1014
3 1015
4 4 x 10¹⁵
5 1016
0 I00 200 300 400 500 600
Voltage, mV
Figure D4. I-V Characteristic
144
APPENDIX E
SOLAR ARRAY RELIABILITY ANALYSIS
145
APPENDIX E
SOLAR ARRAY RELIABILITY ANALYSIS
INTRODUCTION
Reported herein are the results of the reliability analysis performed on theproposed design of a solar cell power supply for the HDS satellite.
Included is a failure effect analysis and reliability model with appropriatecalculations of system reliability and maximum anticipated power degradation.
ARRAY CONFIGURATION
The array consists of six identical solar panels which fold outward from thesides of the hexagonal shaped satellite. In this position all solar cells will
lie in the same plane. Each panel will consist of two circuits comprising108 series bu eight parallel connected solar cells. Each solar cell circuitis connected in series with an array of two parallel blocking diodes. Allwiring and connections are redundant. The array will consist of a total of10 368 solar cells.
SOLAR CELL FAILURE ANALYSIS
Failures Resulting in Complete Loss of Solar Cell Power
Short-circuit failures.-- A short circuit of a solar cell results when aconducting path exists between the upper and lower surfaces of the cell.
The most probable cause for this type of failure is a contact between thelower surface of the cell and the lead from the submodule bus bar which isconnected to the top surface of the same cell. This will result in a shortcircuit of the affected cell and will also short circuit the other cells in that
submodule. There will be a slight variation in the operating voltage and cur-rent for the other cells in that string resulting in a correspondingly smallpower degradation. This power degradation will be of the order of one per-cent for the affected string when operating at no-failure maximum power vol-tage. A total power degradation of the order of 1/10 percent per failure willresult for the entire array. Quality control inspection of the intercell con-nections substantially reduces the possibility of such a failure under normaloperating conditions. The probability that such a failure will occur is,therefore, assumed to be zero.
Open-circuit failures. -- Each solar cell is soldered at three points onits lower surface to a sul_module bus bar. The series connection to the next
submodule bus bar is completed by four solder joints on the top surface ofeach cell. For soldering performed with a high degree of workmanship, the
147
solder joint failure rate is i. 0 x 10 -8 failures per hour and the probability
of tailure of a solder joint is 8.8 x 10 -5 per year. Since the four solder
connections on the upper surface represent threefold solder joint redun-
dancy, the probability that the cell will open circuit as a result of failure-16
of all solder joints at the upper surface will be of the order of I0 per
year. The probability that a cell will open circuit as a result of a solder-12
joint failure on the lower surface will be of the order of 10 per year.
An open-circuit cell failure may result from the fracture of a cell. The
probability is extremely remote that such failure would not be detected during
preliminary inspections or that it would occur under normal operating condi-
tions. An open-circuit failure caused by the separation of the electrode grid
from the upper surface of a cell may result from thermal cycling of the cell
and/or vibration of the cell. Engineering studies and conclusions to date in-dicate that, in this case, the solar cell failure rate would have an upper limit
of 1.75 x 10 -4 per year. If all possibilities of open-circuit failure for
normal operation are considered, the probability of an open-circuit failure
of an individual solar cell is no greater than 1.76 x 10 -4 per year.
Cell Failure Probabilities
If P = 1.76 x 10 -4 per year is the probability of failure of an individual solar
cell during one year, for eight solar cells connected in a parallel submodule
array, the probability of n failures within the submodule will be
nP8 = _(8-n)8,: n , pn (l_p)8-n per year (El)
The values of 1P 8 and 2P 8 are:
1P 8 = 1.40 x 10 -3 per year
2P 8 = 8.61x 10 -7 per year
It is seen that the probability of two failures occurring within one submoduleis remote as compared to the occurrence of a single failure. Therefore, this
analysis is restricted to single solar cell failures within a submodule.
If 1 P8 is the probability of having a single submodule failure, the probability
of having n ceIlfailures within an eight-parallel by 108-series solar ceil cir-cuit will be
np 108, (i In( ) 108-n108 = {108-n) : n .F P8 I-IP8 (E2)
148
The values ofnP108 for n = 1 and for n = 2 are
1P108 = 0.13
2P108 = 0.0098
Once again it can be seen that the probability of two such failures is less byat least an order of magnitude than that for a single failure. It is thereforeassumed that there will be no more than one cell failure within any string,by no means an unreasonable assumption.
If the power degradation computed for a single cell failure within a string iscompared with the power degradation resulting from two cell failures occur-ring in different submodules, no appreciable difference will be found. Thisis the result of the current-limiting actions imposed by the first failure.Thus, the first cell failure within any string is the critical failure with res-pect to power degradation of the solar cell array.
Total Solar Cell Reliability
The total solar cell reliability XR is the probability that there will be no more
than x failures out of a total of N solar cells for the array.
For a binomial distribution, the probability that x failures will occur is
N ' pXXp = (N-x)': x .¢ (1-p)N-x (E3)
where P is the probability of failure of a single solar cell.
The gaussian distribution is approximately equal to the binomial distributionwhen N is large and P is small. For the gaussian distribution
1 _(x_m)2/?z 2Xp =--e (E4)
where
m
a
N. P
_]N. P (l-P)
149
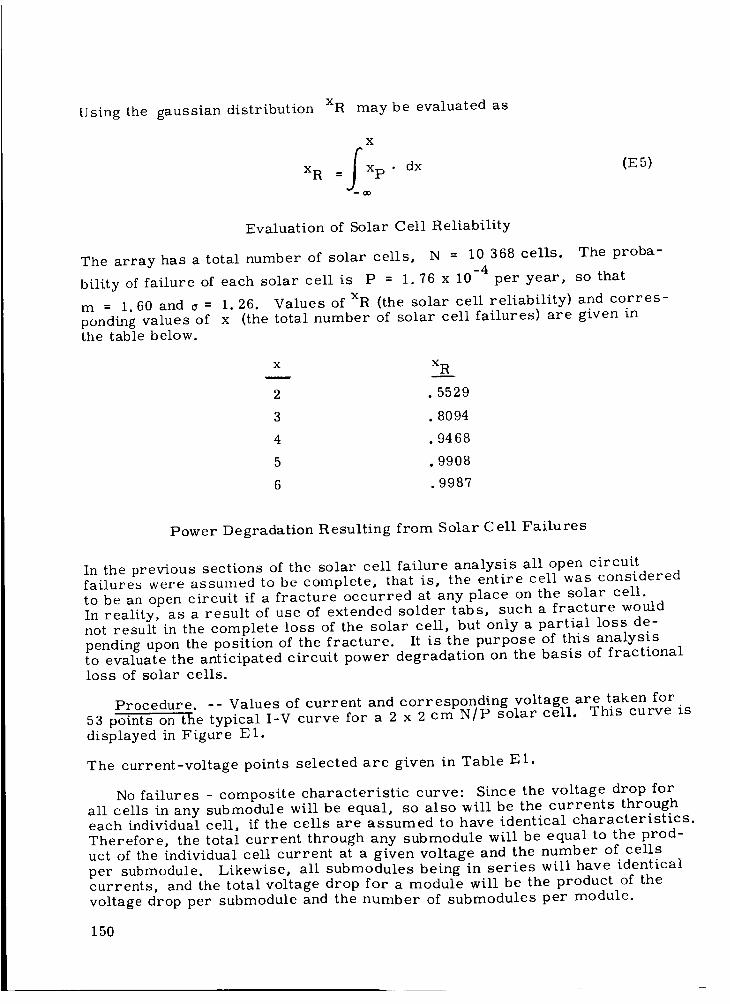
Using the gaussian distribution
xR
XR may be evaluated as
x
_x • dx= p
--CO
(E5)
Evaluation of Solar Cell Reliability
The array has a total number of solar cells, N = 10 368 cells. The proba-
bility of failure of each solar cell is P = 1.76 x 10 -4 per year, so that
m = 1.60 and a = 1.26. Values of XR (the solar cell reliability) and corres-
ponding values of x (the total number of solar cell failures) are given inthe table below.
x xR
2 .5529
3 .8094
4 .9468
5 .9908
6 .9987
Power Degradation Resulting from Solar Cell Failures
In the previous sections of the solar cell failure analysis all open circuitfailures were assumed to be complete, that is, the entire cell was consideredto be an open circuit if a fracture occurred at any place on the solar cell.In reality, as a result of use of extended solder tabs, such a fracture wouldnot result in the complete loss of the solar cell, but only a partial loss de-pending upon the position of the fracture. It is the purpose of this analysisto evaluate the anticipated circuit power degradation on the basis of fractionalloss of solar cells.
Procedure. -- Values of current and corresponding voltage are taken for53 points on the typical I-V curve for a 2 x 2 cm N/P solar cell. This curve isdisplayed in Figure El.
The current-voltage points selected are given in Table El.
No failures - composite characteristic curve: Since the voltage drop forall cells in any submodule will be equal, so also will be the currents througheach individual cell, if the cells are assumed to have identical characteristics.
Therefore, the total current through any submodule will be equal to the prod-uct of the individual cell current at a given voltage and the number of cellsper submodule. Likewise, all submodules being in series will have identicalcurrents, and the total voltage drop for a module will be the product of thevoltage drop per submodule and the number of submodules per module.
150
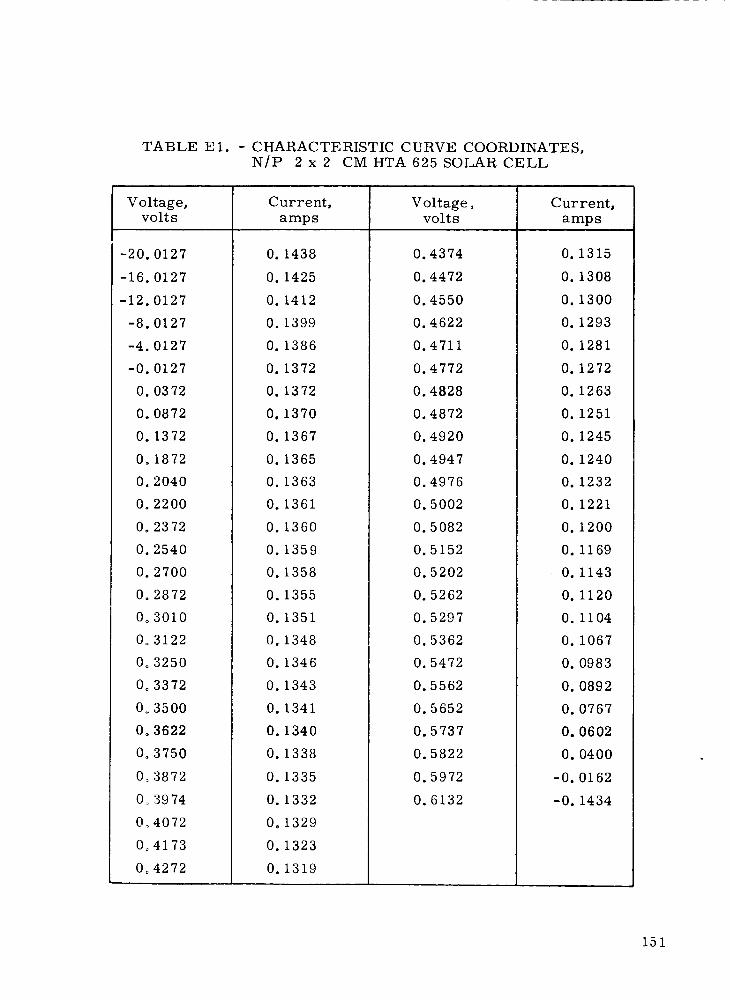
TABLE El. - CHARACTERISTIC CURVE COORDINATES,N/P 2 x 2 CMHTA 625 SOLAR CELL
Voltage,volts
-20. 0127-16. 0127-12. 0127-8. 0127-4. 0127
-0. 0127O.0372
Oo0872O.1372O.1872O.2040O.2200
O.2372O.2540O.2700O.28720o3010Oo3122Oo3250Oo3372Oo3500Oo3622O°3750
Oo3872O_39740°4072Oo4173
Oo4272
Current,amps
O.1438
O.1425O.1412O.1399O.1386
O.1372O.1372
O.1370O.1367O.1365O.1363O.1361O.1360O.1359O.1358O.1355O.1351O.1348O.1346O.1343O.1341O.1340O.1338
O.1335O.1332Oo1329O.1323
0.1319
Voltage,volts
O.4374
0.44720.45500.46220.47110.47720.4828
O.48720.4920O.49470.4976O.5002O.5082O.5152O.5202O.5262O.5297O.5362O.5472O.5562O.5652O°5737O.5822
O.5972O.6132
Current,amps
O.1315O.1308
O.1300O.1293O.1281O.1272O.1263
O.1251O.1245O.1240O.1232O.1221O.1200O.1169O.1143O.1120O.1104O.1067O.0983O.0892
O.0767O.0602O.0400
-0. 0162
-0. 1434
151
<E
C)
0
*3
.._0
<
140
120
I00
8O
60
4O
20
2 x 2 cm, 1 ohm cm, Dart contact standard
simulator test conditions, 140 mW/cm 2,
26°C, not balloon std., 3.94 cm 2 active area.
0 I00 200 300 400 500 600
Output voltage, mV
Figure El. Average Electrical Out-p,ut, HTA 625 Cell
152
Therefore, to form composite characteristic curves for a module with no
failures, it is necessary only to multiply the values of the current given inTable D1 by the number of cells per submodule and the voltages by thenumber of submodules. Using these data, an I-V curve can be plotted forthe module. For this module, the power at any voltage can be computed asthe product of the voltage and current.
Open-circuit failure - composite characteristic curve: For a worst-case analysis, it was assumed that the fraction of the solar cell lost as aresult of a fracture would be random. Thus, for example, the chance of
loss of between 118 and 1/4 of a solar cell would be the same as the loss offrom 7]8 to a full solar cell. This is an assumption which is severe in thelight of the fact that observed failures in general result in a small fractionalloss of the solar cell. Since sufficient statistical information is not availableconcerning the problem of solar cell fractures, the severest condition, thatof random loss, is used in this analysis.
For the case of a circuit which has a fracture in the fractional region suchthat, for example, between 112 and 5/8 of the solar cell remains for circuitcontinuity, the fractured-cells characteristic curve must be formed by re-
ducing the current to an average current factor 1/2 + 5/8 _ 9/16 of the2
no failure current, while the voltage remains the same.
Then composite characteristic curves for the complete circuit with failureare formed in the following manner: Composite characteristic curves areconstructed for a "short string" of 8-parallel by 107-series cells. Also, acharacteristic curve for a single submodule of 7 cells plus one failed cellis constructed.
For this submodule, the current will be 7-9/16 of that for a single solarcell. The composite characteristic curve for circuit failure is then formedby adding together the values of voltage for equal values of current.
Analysis of data. -- The following configurations were examined:
Between, 0 and 1]8 cell remaining with average current-1 / 16 of that of a normal cell,
1]8 and 114 cell remaining with average current -3] 16 of that of a normal cell
114 and 3]8 cell remaining with average current-5/16 of that of a normal cell,
3 ] 8 and 1 ] 2 cell remaining with average current -7/15 of that of a normal cell,
1/2 and 5/8 cell remaining with average current-9/16 of that of a normal cell,
153
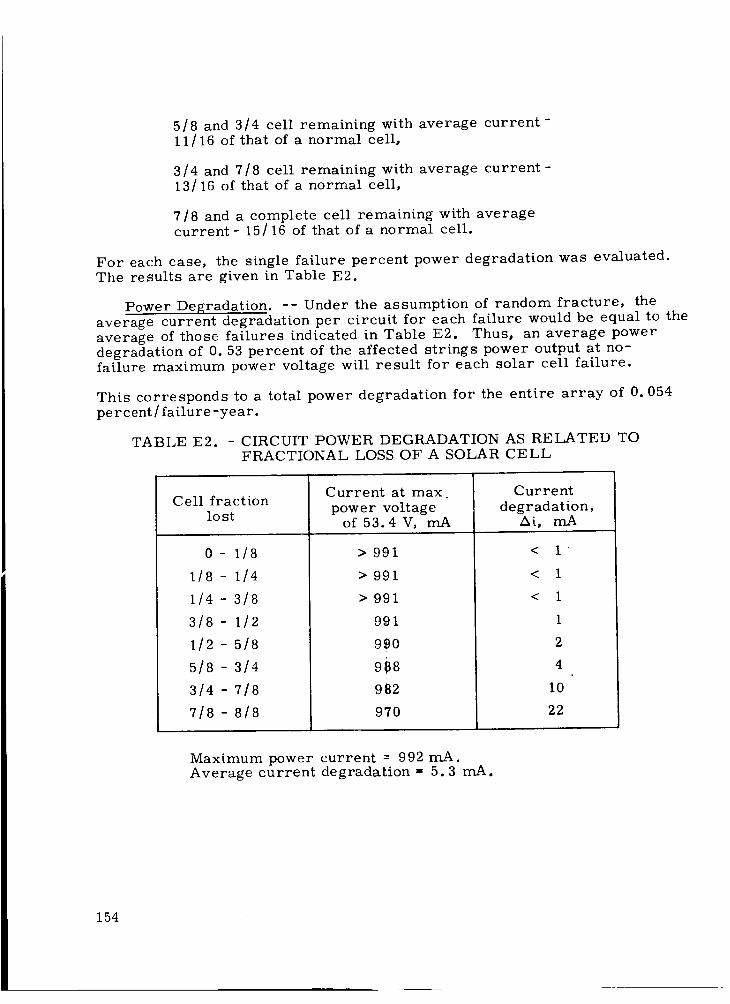
5/8 and 3]4 cell remaining with average current-11/16 of that of a normal cell,
3/4 and 7/8 cell remaining with average current-13/16 of that of a normal cell,
7/8 and a complete cell remaining with averagecurrent - 15/16 of that of a normal cell.
For each case, the single failure percent power degradation was evaluated.The results are given in Table E2.
Power Degradation. -- Under the assumption of random fracture, theaverage current degradation per circuit for each failure would be equal to theaverage of those failures indicated in Table E2. Thus, an average powerdegradation of 0. 53 percent of the affected strings power output at no-failure maximum power voltage will result for each solar cell failure.
This corresponds to a total power degradation for the entire array of 0. 054percent/failure -year.
TABLE E2. - CIRCUIT POWER DEGRADATION AS RELATED TOFRACTIONAL LOSS OF A SOLAR CELL
Cell fractionlost
0- 1/s
1/8- 1/4
1/4 - 3/8
Current at max.power voltage
3/8 - 112
1/2 - 5/8
5/8 - 3/4
3/4 - 7/8
7/8 - 8/8
of 53.4 V, mA
> 991
> 991
> 991
Current
degradation,_i, mA
991
990
9_8
982
9"/0
<
<
<
l .
1
1
1
2
4
i0
22
Maximum power current = 992 mA.Average current degradation - 5.3 mA.
154
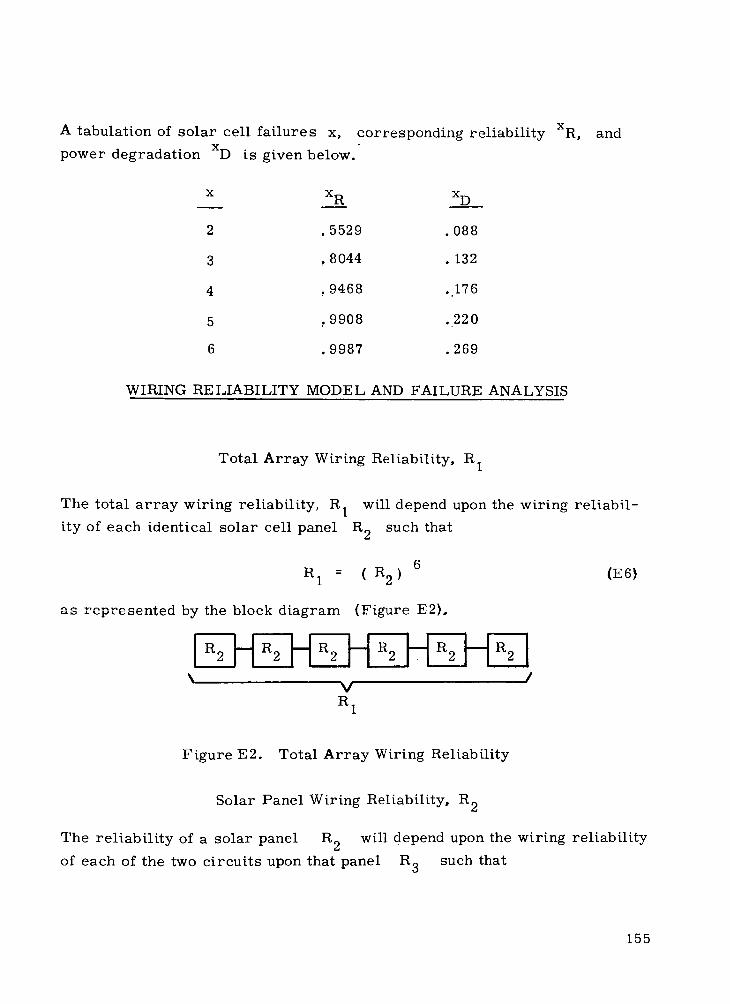
A tabulation of solar cell failures x, corresponding reliability XR, and
power degradation XD is given below.
x x R x D
2 .5529 .088
3 ,8044 . 132
4 ,9468 ..176
5 : 9908 . 220
6 ° 9987 .269
WIRING RELIABILITY MODEL AND FAILURE ANALYSIS
Total Array Wiring Reliability, R 1
The total array wiring reliability, R 1 will depend upon the wiring reliabil-
ity of each identical solar cell panel R 2 such that
6R 1 = ( R 2 ) (E6)
-_ ._u_k diagram I_; ..... E2)orepresented by the _^_
\ !V
R 1
Figure E2. Total Array Wiring Reliability
Solar Panel Wiring Reliability, R 2
The reliability of a solar panel R 2 will depend upon the wiring reliability
of each of the two circuits upon that panel R 3 such that
155
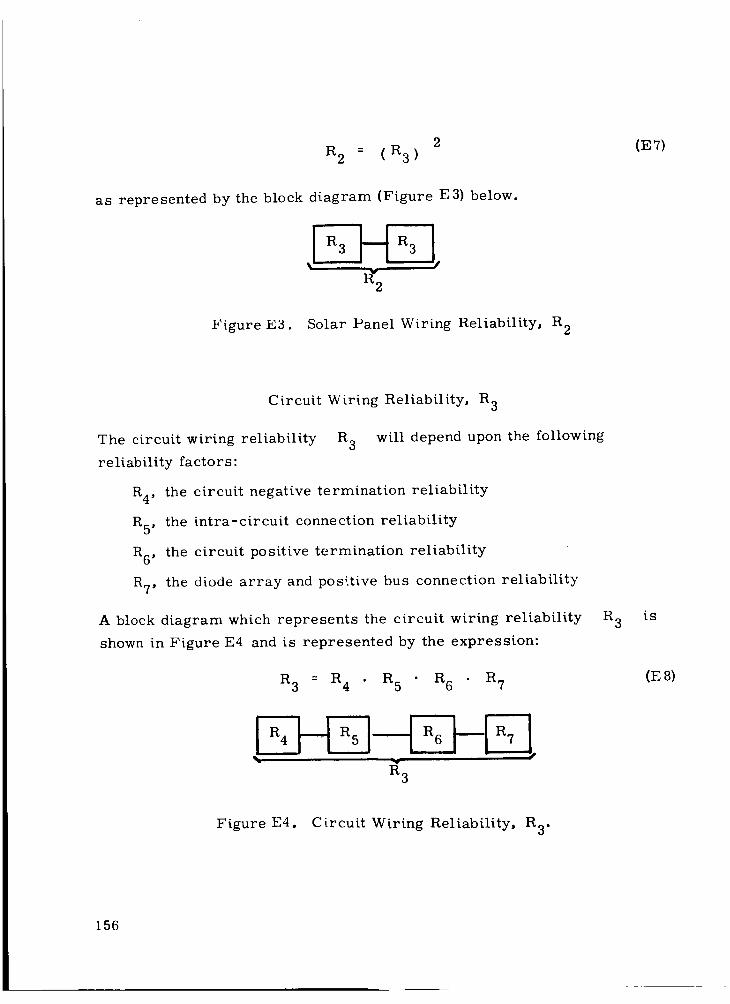
2R 2 = (R3)
as represented by the block diagram (Figure E3) below.
Figure E3. SoIar Panel Wiring Reliability, R 2
(E7)
Circuit Wiring Reliability, R 3
The circuit wiring reliability R 3 will depend upon the following
reliability factors:
R 4, the circuit negative termination reliability
R 5, the intra-circuit connection reliability
R 6, the circuit positive termination reliability
R 7, the diode array and positive bus connection reliability
A block diagram which represents the circuit wiring reliability
shown in Figure E4 and is represented by the expression:
R 3 = R 4 R 5 R 6 R 7
'_ i_3
R 3
Figure E4. Circuit Wiring Reliability, R 3.
is
(E 8)
156
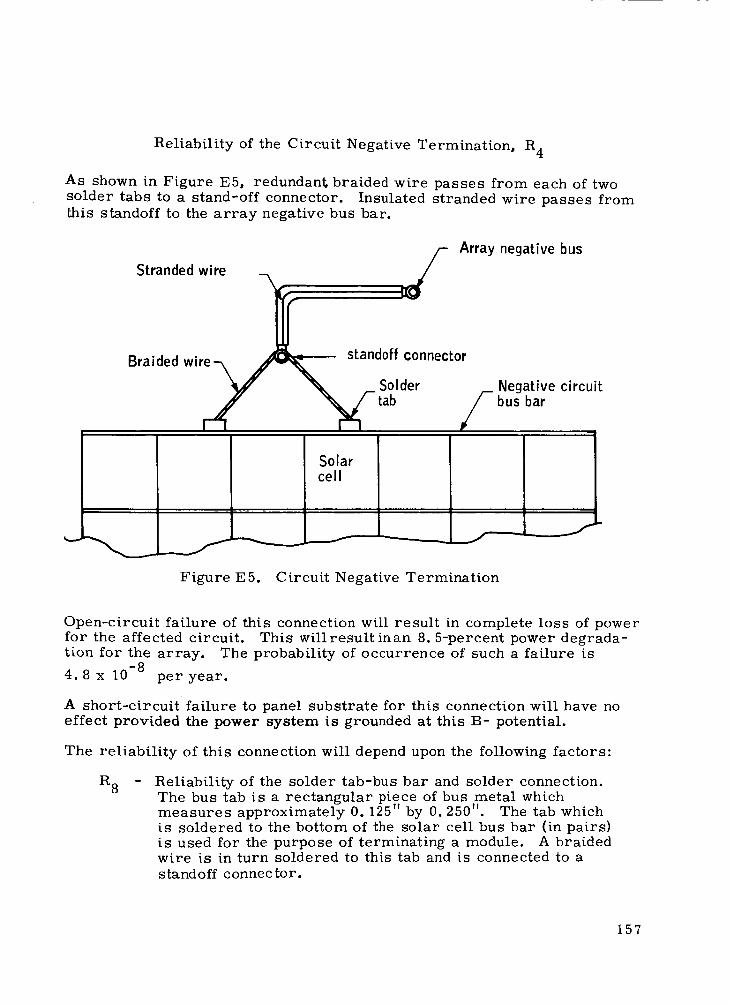
Reliability of the Circuit Negative Termination, R 4
As shown in Figure E5, redundant braided wire passes from each of twosolder tabs to a stand-off connector. Insulated stranded wire passes fromthis standoff to the array negative bus bar.
/-- Array negative busStranded wire _ /
Braided wire __xW standoff connector
V--'_ Solder Negative circuit
r_ x_ tab S bus bar
Solarcell
J
Figure E5. Circuit Negative Termination
J
Open-circuit failure of this connection will result in complete loss of powerfor the affected circuit. This will result in an 8.5-percent power degrada-tion for the array. The probability of occurrence of such a failure is
-84.8 x 10 per year.
A short-circuit failure to panel substrate for this connection will have noeffect provided the power system is grounded at this B- potential.
The reliability of this connection will depend upon the following factors:
R 8 Reliability of the solder tab-bus bar and solder connection.The bus tab is a rectangular piece of bus metal whichmeasures approximately 0. 125" by 0. 250". The tab whichis soldered to the bottom of the solar cell bus bar (in pairs)is used for the purpose of terminating a module. A braidedwire is in turn soldered to this tab and is connected to astandoff connec tot.
157
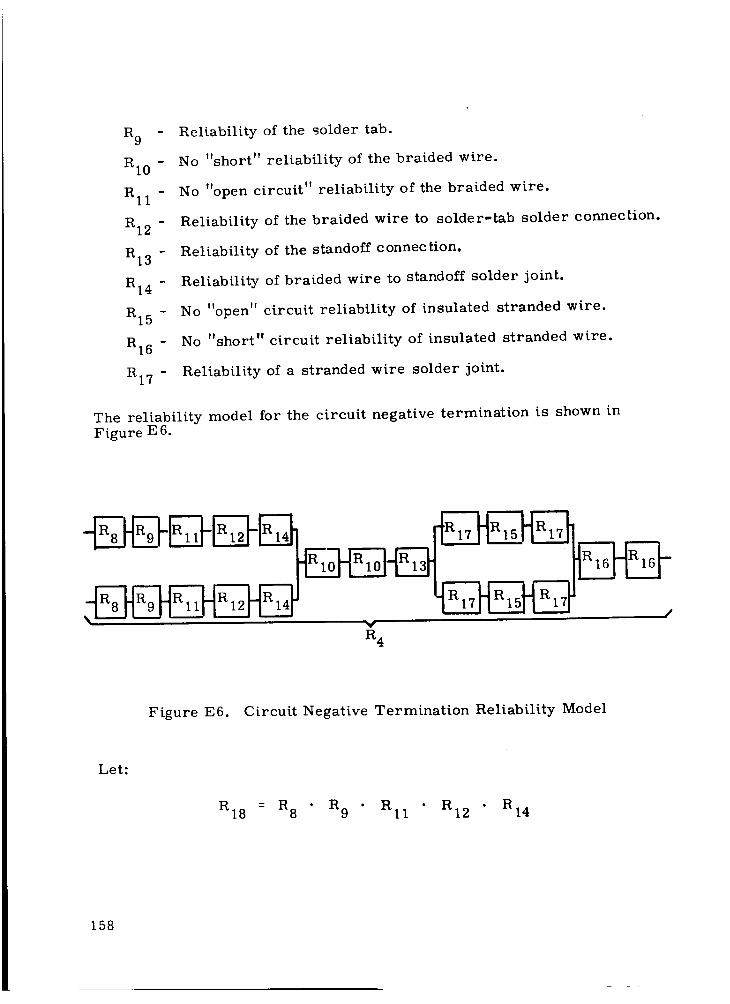
R9 -
RI0 -
RII -
RI2 -
RI3
RI4 -
RI5 -
R16 -
Rl7 -
Reliability of the _older tab.
No "short" reliability of the braided wire.
No "open circuit" reliability of the braided wire.
Reliability of the braided wire to solder-tab solder connection.
Reliability of the standoff connection.
Reliability of braided wire to standoff solder joint.
No "open" circuit reliability of insulated stranded wire.
No "short" circuit reliability of insulated stranded wire.
Reliability of a stranded wire solder joint.
The reliability model for the circuit negative termination is shown inFigure E 6.
y /
R 4
Figure E6. Circuit Negative Termination Reliability Model
Let:
R18 = R 8 R 9 • Rll • R12 • R14
158
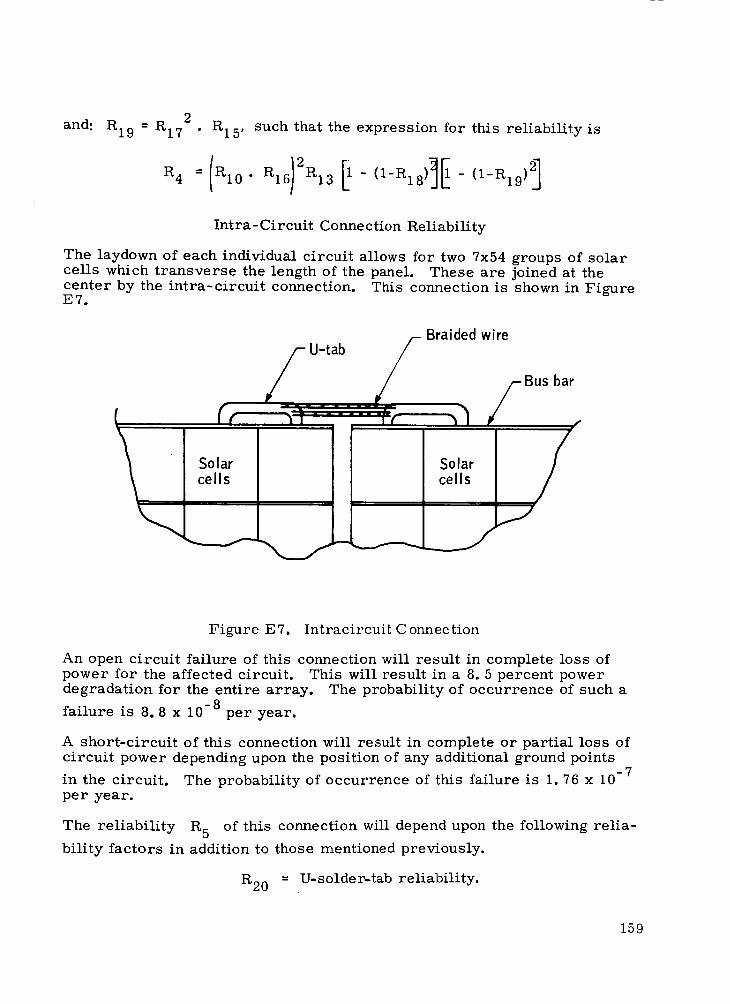
and: R19 = R172 . R15, such that the expression for this reliability is
Intra-Circuit Connection Reliability
The laydown of each individual circuit allows for two 7x54 groups of solarcells which transverse the length of the panel. These are joined at thecenter by the intra-circuit connection. This connection is shown in FigureE7,
Braided wireU-tab
bar
Solarcells
Solarcells
Figure E7. Intracircuit Connection
An open circuit failure of this connection will result in complete loss ofpower for the affected circuit. This will result in a 8. 5 percent powerdegradation for the entire array. The probability of occurrence of such a
failure is 8.8 x 10 -8 per year.
A short-circuit of this connection will result in complete or partial loss ofcircuit power depending upon the position of any additional ground points
-7in the circuit. The probability of occurrence of this failure is 1.76 x 10per year.
The reliability R 5 of this connection will depend upon the following relia-
bility factors in addition to those mentioned previously.
R20 = U-solder-tab reliability.
159
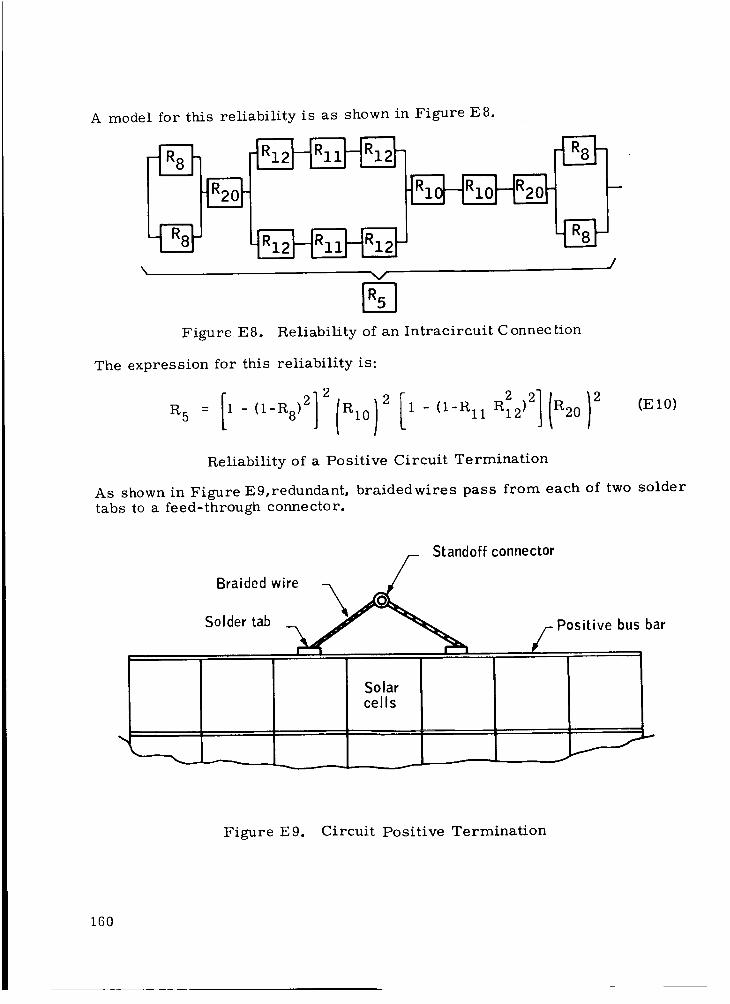
A model for this reliability is ms shown in Figure E 8.
\Y
V
Figure E8. Reliability of an Intracireuit Connection
The expression for this reliability is:
(E 10)
Reliability of a Positive Circuit Termination
As shown in Figure E9,redundant, braidedwires pass from each of two solder
tabs to a feed-through connector.
Standoff connector
wire
Braided _Solder tab
Solarcells
Positive bus bar
Figure E9. Circuit Positive Termination
160
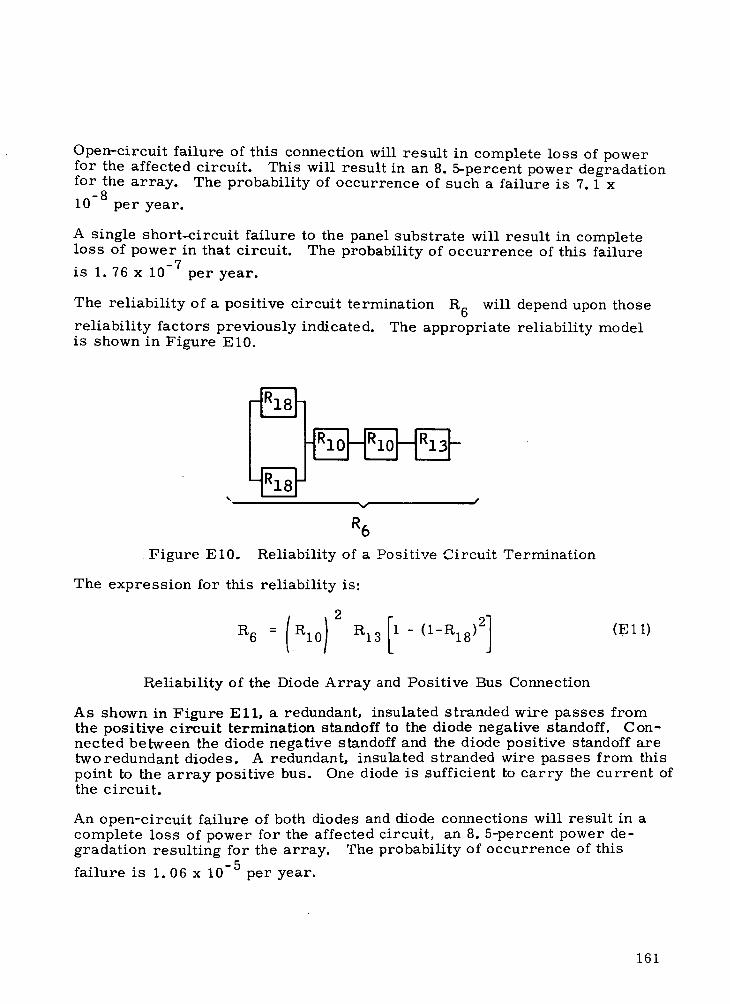
Open-circuit failure of this connection will result in complete loss of powerfor the affected circuit. This will result in an 8. 5-percent power degradationfor the array. The probability of occurrence of such a failure is 7.1 x
10 -8 per year.
A single short-circuit failure to the panel substrate will result in completeloss of power in that circuit. The probability of occurrence of this failure
is 1.76 x 10 -7 per year.
The reliability of a positive circuit termination R 6 will depend upon those
reliability factors previously indicated. The appropriate reliability modelis shown in Figure El0.
Figure E 10.
/
R6
Reliability of a Positive Circuit Termination
The expression for this reliability is:
R 6 = /R10/ 2 R1311 - (l-R18)2](E11)
Reliability of the Diode Array and Positive Bus Connection
As shown in Figure Ell, a redundant, insulated stranded wire passes fromthe positive circuit termination standoff to the diode negative standoff. Con-nected between the diode negative standoff and the diode positive standoff aretwo redundant diodes. A redundant, insulated stranded wire passes from thispoint to the array positive bus. One diode is sufficient to carry the current ofthe circuit.
An open-circuit failure of both diodes and diode connections will result in acomplete loss of power for the affected circuit, an 8.5-percent power de-gradation resulting for the array. The probability of occurrence of this
failure is i. 06 x 10 -5 per year.
161
I
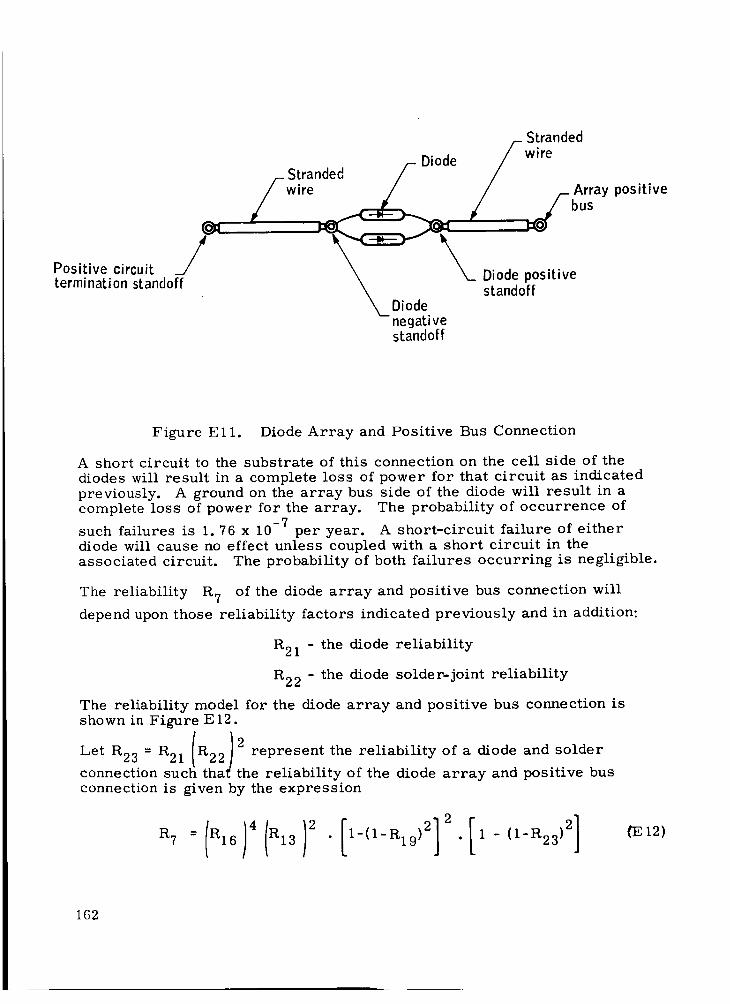
Positive circuit /
termination standoff
._ Stranded/
,- Diode / wire
Stranded / //wire _ / t- Array positive
__ _ Diode positive
Diode standoffnegativestandoff
Figure Ell. Diode Array and Positive Bus Connection
A short circuit to the substrate of this connection on the cell side of thediodes will result in a complete loss of power for that circuit as indicatedpreviously. A ground on the array bus side of the diode will result in acomplete loss of power for the array. The probability of occurrence of
such failures is 1.76 x 10 -7 per year. A short-circuit failure of either
diode will cause no effect unless coupled with a short circuit in theassociated circuit. The probability of both failures occurring is negligible.
The reliability R 7 of the diode array and positive bus connection will
depend upon those reliability factors indicated previously and in addition:
R21 - the diode reliability
R22 - the diode solder-joint reliability
The reliability model for the diode array and positive bus connection isshown in Figure E12.
Let R23 = R21 R22 represent the reliability of a diode and solder
connection such thaf the reliability of the diode array and positive busconnection is given by the expression
R7 = /R16)4 (R13) 2 • [1-(1-R19)212. [1 - (1-R23)2]{El2)
162
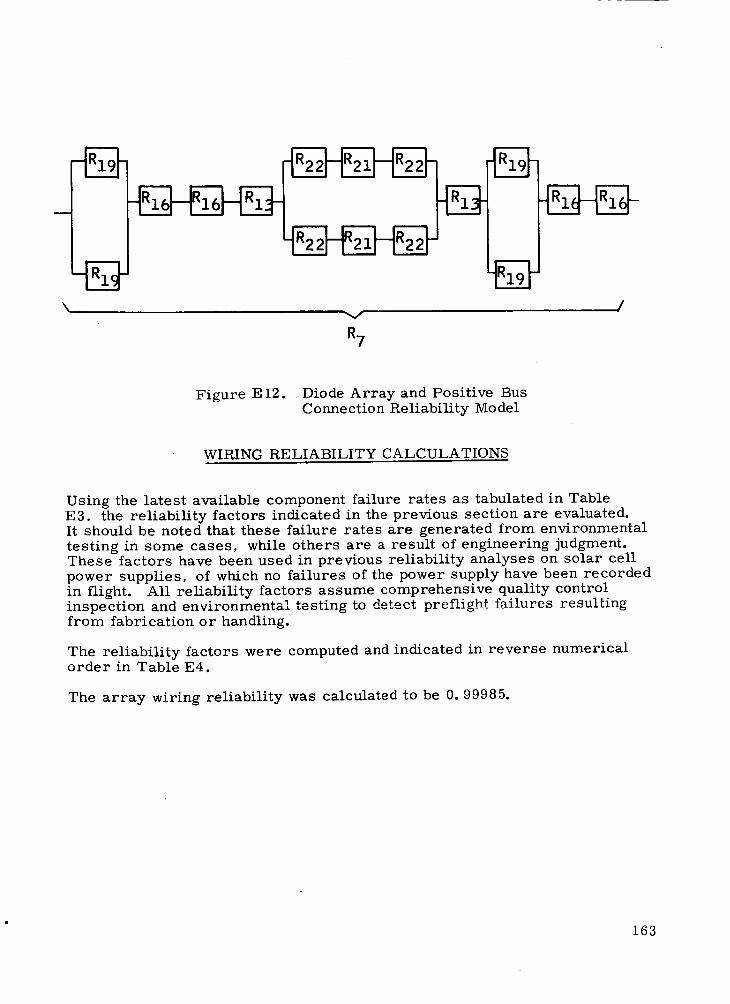
-IR19r
"_Rlg F
\ v /
R7
Figure El2. Diode Array and Positive BusConnection Reliability Model
WIRING RELIABILITY CALCULATIONS
Using the latest available component failure rates as tabulated in TableE3. the reliability factors indicated in the previous section are evaluated.It should be noted that these failure rates are generated from environmentaltesting in some cases, while others are a result of engineering judgment.These factors have been used in previous reliability analyses on solar cellpower supplies, of which no failures of the power supply have been recordedin flight. All reliability factors assume comprehensive quality controlinspection and environmental testing to detect preD_ight failures resultingfrom fabrication or handling.
The reliability factors were computed and indicated in reverse numericalorder in Table E4.
The array wiring reliability was calculated to be 0. 99985.
163
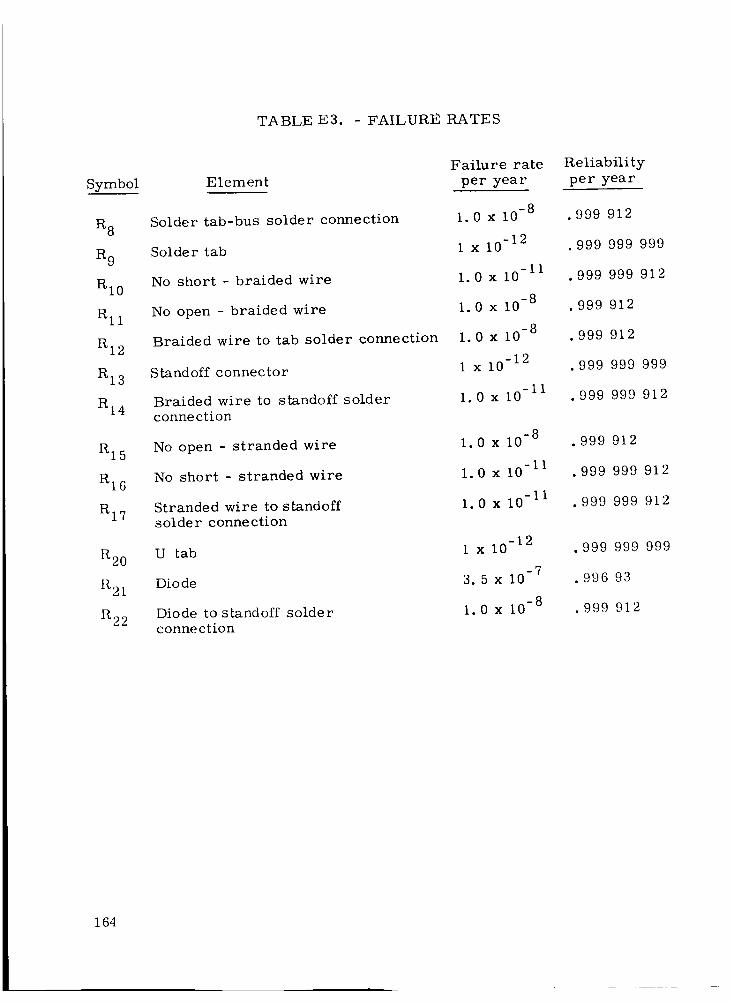
TABLE E3. - FAILURE RATES
Symbol
R 8
R 9
R10
Rll
R12
R13
R14
RI 5
RI 6
RI7
R20
R21
R22
Element
Solder tab-bus solder connection
Solder tab
No short - braided wire
No open - braided wire
Braided wire to tab solder connection
Stand off c onnec tor
Braided wire to standoff solderconnection
No open - stranded wire
No short - stranded wire
Stranded wire to standoff
solder connection
U tab
Diode
Diode to standoff solderconnection
Failure rate
per year
-81.0xl0
1 x 10 -12
-111.0x 10
-81.0x 10
-81.0xl0
1 x 10 -12
-111.0x10
-8l. OxlO
-iil. OxlO
-iil. OxlO
1 x 10 -12
-73.5x10
-81.0xl0
Reliability
per year
.999 912
.999 999 999
.999 999 912
.999 912
.999 912
.999 999 999
.999 999 912
.999 912
.999 999 912
.999 999 912
.999 999 999
.996 93
.999 912
164
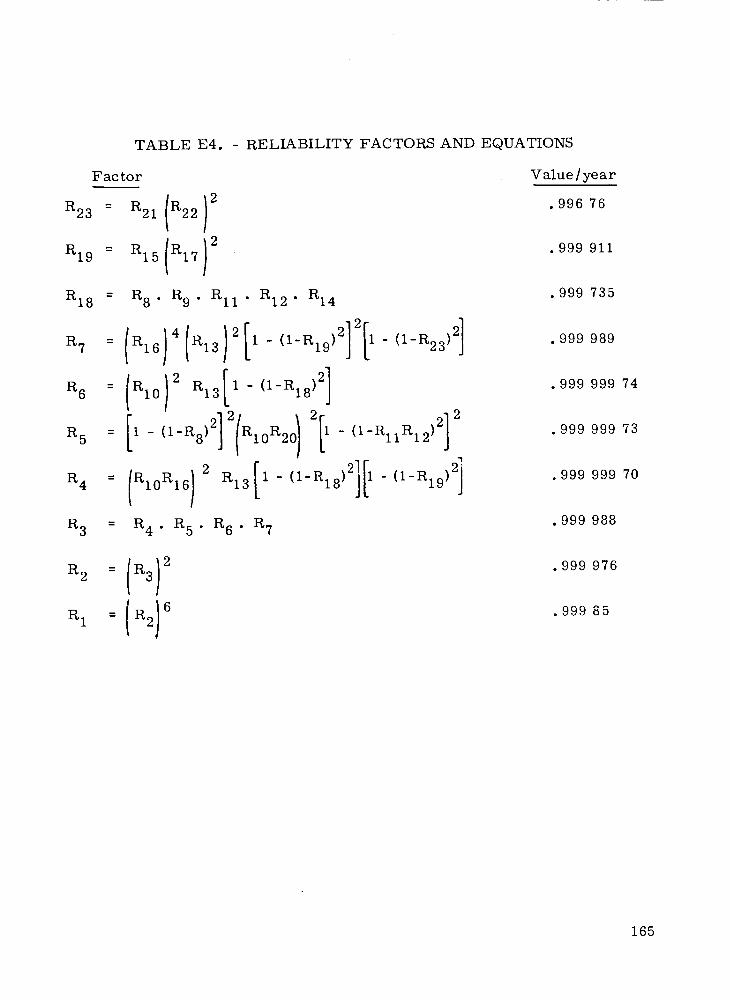
TABLE E4. - RELIABILITY FACTORS AND EQUATIONS
F actor
R23 = R21 (R2212
R19 ; R15 R17
R18 = R 8 . R 9 • Rll. R12" R14
R7 = (R16141R1312[ 1 -(1-R19)212[ l - (1-R23 ,2]
R 6 = IR101 2 R13[1 - (1-R18 ,2]
R 5 [1 (1-R8)21 2(R10R2 0) 2 [1 ] 2= _ L - (1-RllR12)2j
R 3 = R 4 . R 5 • R 6 • R 7
Value/year
.996 76
.999 911
.999 735
.999 989
.999 999 74
.999 999 73
.999 999 70
.999 988
.999 976
.999 85
165
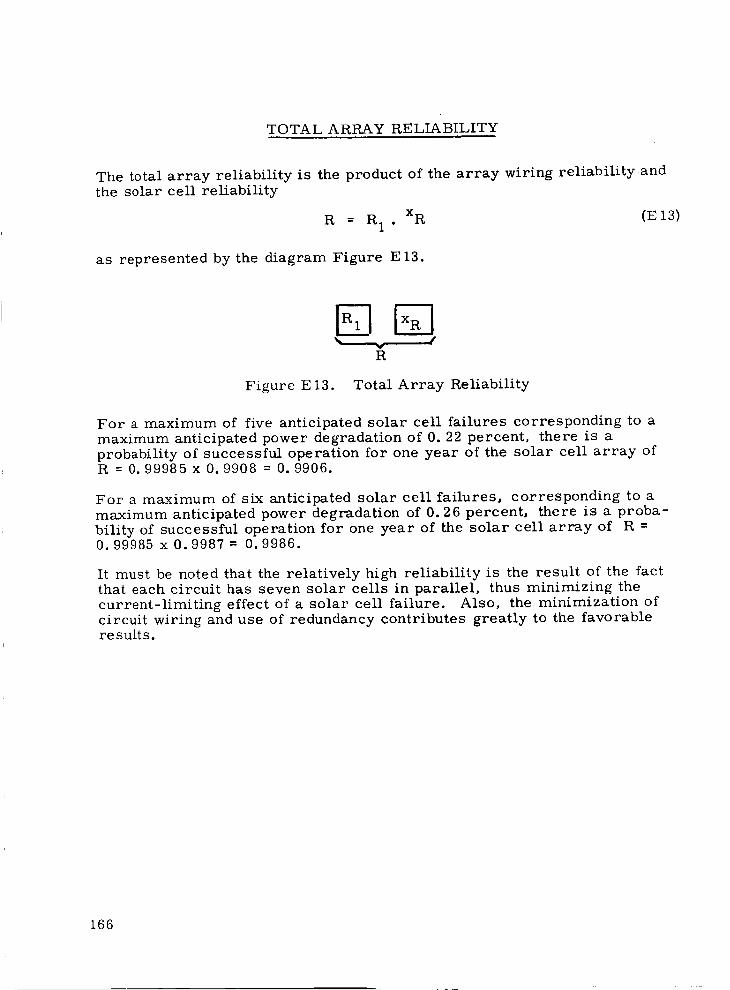
TOTAL ARRAY RELIABILITY
The total array reliability is the product of the array wiring reliability andthe solar cell reliability
R = R 1 . XR (E13)
as represented by the diagram Figure E 13.
DGt
R
Figure E 13. Total Array Reliability
For a maximum of five anticipated solar cell failures corresponding to amaximum anticipated power degradation of 0.22 percent, there is aprobability of successful operation for one year of the solar cell array ofR = 0. 99985 x 0. 9908 = 0. 9906.
For a maximum of six anticipated solar cell failures, corresponding to amaximum anticipated power degradation of 0.26 percent, there is a proba-
bility of successful operation for one year of the solar cell array of R =0. 99985 x 0. 9987 = 0. 9986.
It must be noted that the relatively high reliability is the result of the factthat each circuit has seven solar cells in parallel, thus minimizing thecurrent-limiting effect of a solar cell failure. Also, the minimization ofcircuit wiring and use of redundancy contributes greatly to the favorablere sults.
166
.
o
.
.
,
e
.
REFERENCES
Bauer, P. ; and Sparks, R.H. : Nickel-Cadmium for the OrbitingGeophysical Laboratory. Vol. 2. NASA Goddard Contract No.NASS - 899 TRW, 12 February 1964.
Bruess, E.C. : The Evaluation Program for Secondary SpacecraftCells. Second Annual Report, Quality Evaluation Laboratory,U.S. Naval Ammunition Depot, Crane, Indiana. NASA GoddardContract No. W-ll, 252B, 13 May 1966.
Anon.: Life Cycle Tests. Monthly Progress Report, U.S. NavalAmmunition Depot, Crane, Indiana, November 1966.
Hennigan, Thomas J. ; and Sizemore, Kenneth O. : Charge ControlDevices, Charge Control Ag Cd Cells, and Ag. Zn Cells. Proceduresof the 20th Annual Power Sources Conference, 24, 25, and 26 May1966.
Vette, James: Models of the Trapped Radiation Environment.
Aerospace Corporation, NASA SP-3024.
Modisette, Jerry; et al.: Model Solar Proton Environments forManned Spacecraft Design. NASA TN D-2746, April 1965.
Fichtel, C.F. ; Guss, H.E. ; and Malitson, H.H. : Solar ProtonManual. NASA TR R-169, December 1963.
8. Rosenzweig: Radiation Damage Studies. Photovoltaic SpecialistsConference (Washington, D.C.), 10-11 April 1963.
9. Campbell, F.J. : Effects of Shielding on Electron Damage to SolarCells. Proceedings of the 4th Photovoltaic Specialists Conference(Cleveland, Ohio}, 2 June 1964.
10. Haynes, G.A. ; and Patterson, J.L. : Effects of High-Energy ElectronRadiation on Solar C ell Shields. Transcript of the Photovoltaic
Specialists Conference, Vol. II, Report on Systems Experience,Applications and Design, 11 April 1963, pp. D-l-I, D-l-2.
11. Hagnos, Joseph G. : Investigation of Resinous Materials for Use asSolar Cell Cover Glass Adhesive. NASA Goddard Space Flight
Center, September 1965.
12. Air Force Systems Command: Space Planners Guide. USGPO, 1965,0-774-405, 1 July 1965.
167
13.
14.
15.
16.
17.
18.
19.
Garrett, P.G.; and Pomroy, S.E.A.: Continuous Charge-DischargeCycling Studies on Hermetically Sealed Nickel-Cadmium Ceils Opera-ting at Ten Percent Depth of Discharge. Technical Report No. 66045,Royal Aircraft Establishment, Farnborough-Hants, England,February 1966.
RCA Astro-Electronics Division: Tiros X Meteorological SatelliteSystem Final Engineering Report. Vol. 1, AED-R-2801, 14 January1966, p. II-28.
Harris, C.A. : Spacecraft Component Magnetic Field Restraints.U.S. Government Memorandum - Report No. 655-015, 12 August1965.
Parsons, C. Leland: Magnetic Testing of Spacecraft. U.S. Govern-ment Memorandum - Report No. 655-016, 13 June 1966.
Smith, G. Louis: A Theoretical Study of the Torques Induced by aMagnetic Field on Rotating Cylinders and Spinning Thin-Wall Cones,Frustums and General Body of Revolution. NASA TR R-129, 1962.
Haynes, Gilbert A. ; and Miller, William E. : Effects of 1.2 and0.30 MEV Electrons on the Optical Transmission Properties ofSeveral Transparent Materials. NASA TN D-2620. March 1965.
Rosenzweig, W. : Space Radiation Effects in Silicon Devices.IEEE Transactions on Nuclear Science, Vol. NS 12, October 1965,pp. 18 - 29.
168
May 1967 NASA CR-66378
CONCEPTUAL MECHANIZATION STUDIESFOR A HORIZON DEFINITION
SPACECRAFT ELECTRICAL POWER SUBSYSTEM
By Otto L. Jourdan, Honeywell Inc.Jay A. Cox, Gulton Industries, Inc.John D. Gum, SpectrolabKarl Preusse, Gulton Industries, Inc.James J. Baltes, Honeywell Inc.David J. Hartman, Honeywell Inc.Fred E. Betz, Gulton Industries, Inc.Burton J° McComb, Gulton Industries, Inc.
ABSTRACT
A solar cell-battery electrical power subsystem was developed whichis compatible with the Horizon Definition Study spacecraft. This
subsystem is capable of delivering 70 watts ot continuous electricalpower for one year in a sun-synchronous, 3 o'clock nodal crossing,500 km orbit.