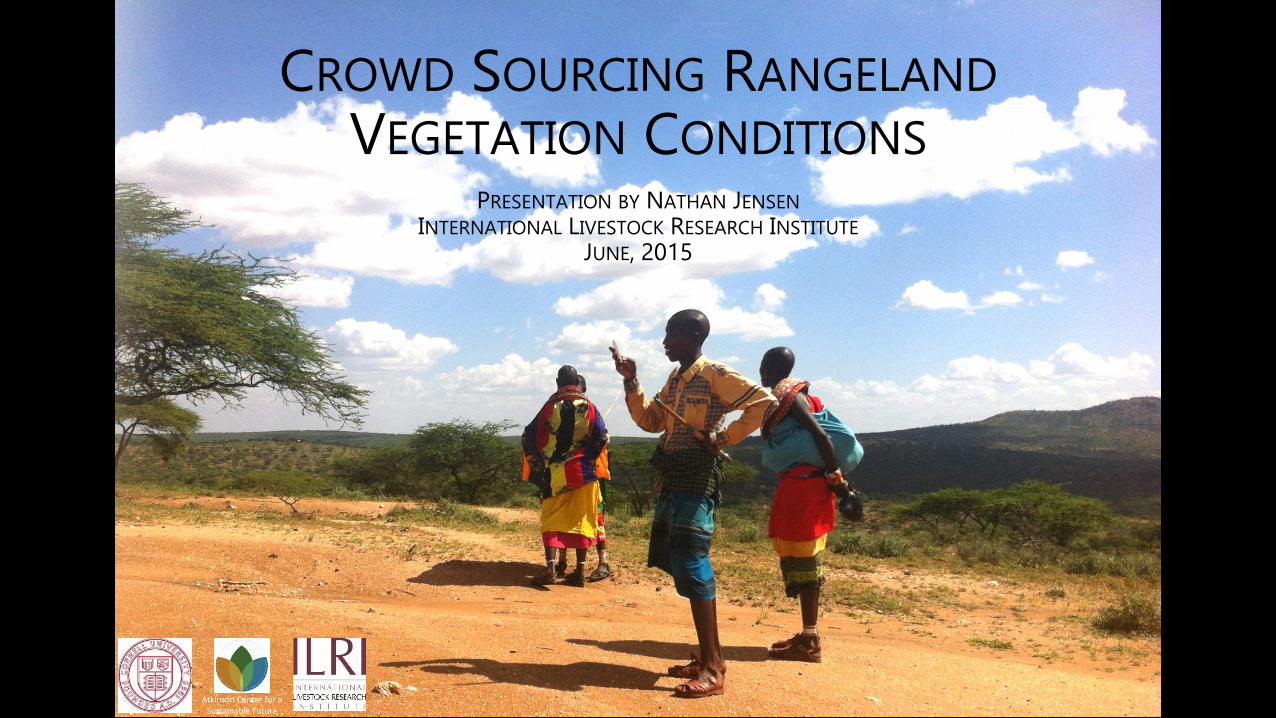
CROWD SOURCING RANGELAND
VEGETATION CONDITIONSPRESENTATION BY NATHAN JENSEN
INTERNATIONAL LIVESTOCK RESEARCH INSTITUTE
JUNE, 2015
Atkinson Center for a Sustainable Future
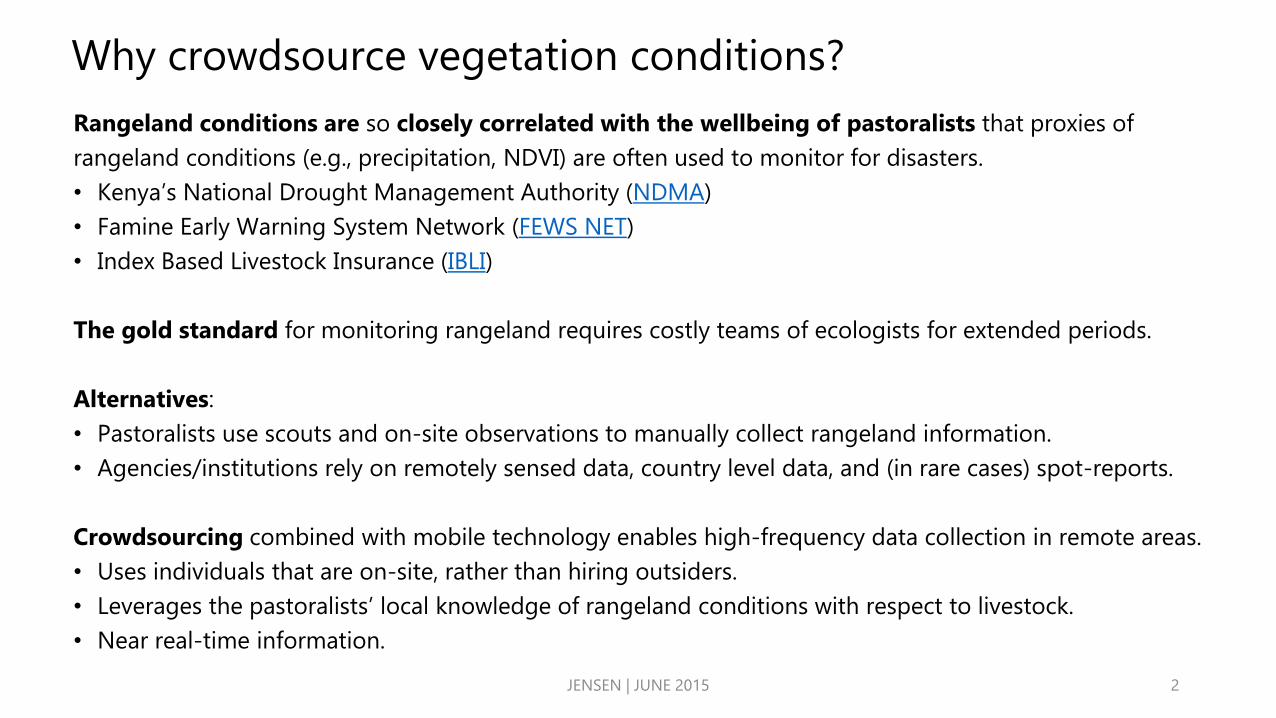
Why crowdsource vegetation conditions?
JENSEN | JUNE 2015
Rangeland conditions are so closely correlated with the wellbeing of pastoralists that proxies of
rangeland conditions (e.g., precipitation, NDVI) are often used to monitor for disasters.
• Kenya’s National Drought Management Authority (NDMA)
• Famine Early Warning System Network (FEWS NET)
• Index Based Livestock Insurance (IBLI)
The gold standard for monitoring rangeland requires costly teams of ecologists for extended periods.
Alternatives:
• Pastoralists use scouts and on-site observations to manually collect rangeland information.
• Agencies/institutions rely on remotely sensed data, country level data, and (in rare cases) spot-reports.
Crowdsourcing combined with mobile technology enables high-frequency data collection in remote areas.
• Uses individuals that are on-site, rather than hiring outsiders.
• Leverages the pastoralists’ local knowledge of rangeland conditions with respect to livestock.
• Near real-time information.
2
Drawbacks of crowdsourcing
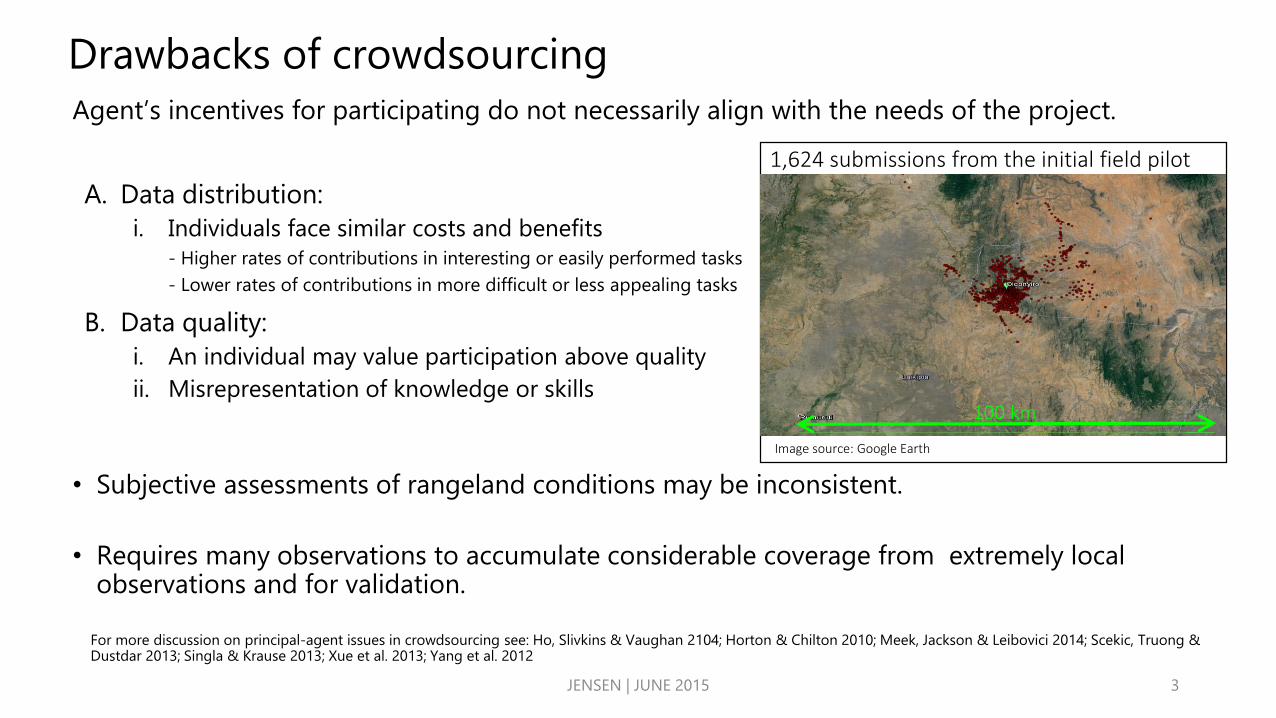
Agent’s incentives for participating do not necessarily align with the needs of the project.
A. Data distribution:
i. Individuals face similar costs and benefits
- Higher rates of contributions in interesting or easily performed tasks
- Lower rates of contributions in more difficult or less appealing tasks
B. Data quality:
i. An individual may value participation above quality
ii. Misrepresentation of knowledge or skills
• Subjective assessments of rangeland conditions may be inconsistent.
• Requires many observations to accumulate considerable coverage from extremely local observations and for validation.
For more discussion on principal-agent issues in crowdsourcing see: Ho, Slivkins & Vaughan 2104; Horton & Chilton 2010; Meek, Jackson & Leibovici 2014; Scekic, Truong & Dustdar 2013; Singla & Krause 2013; Xue et al. 2013; Yang et al. 2012
JENSEN | JUNE 2015
May 27, 2015: 7,252 submissions
1,624 submissions from the initial field pilot
100 km
Image source: Google Earth
3
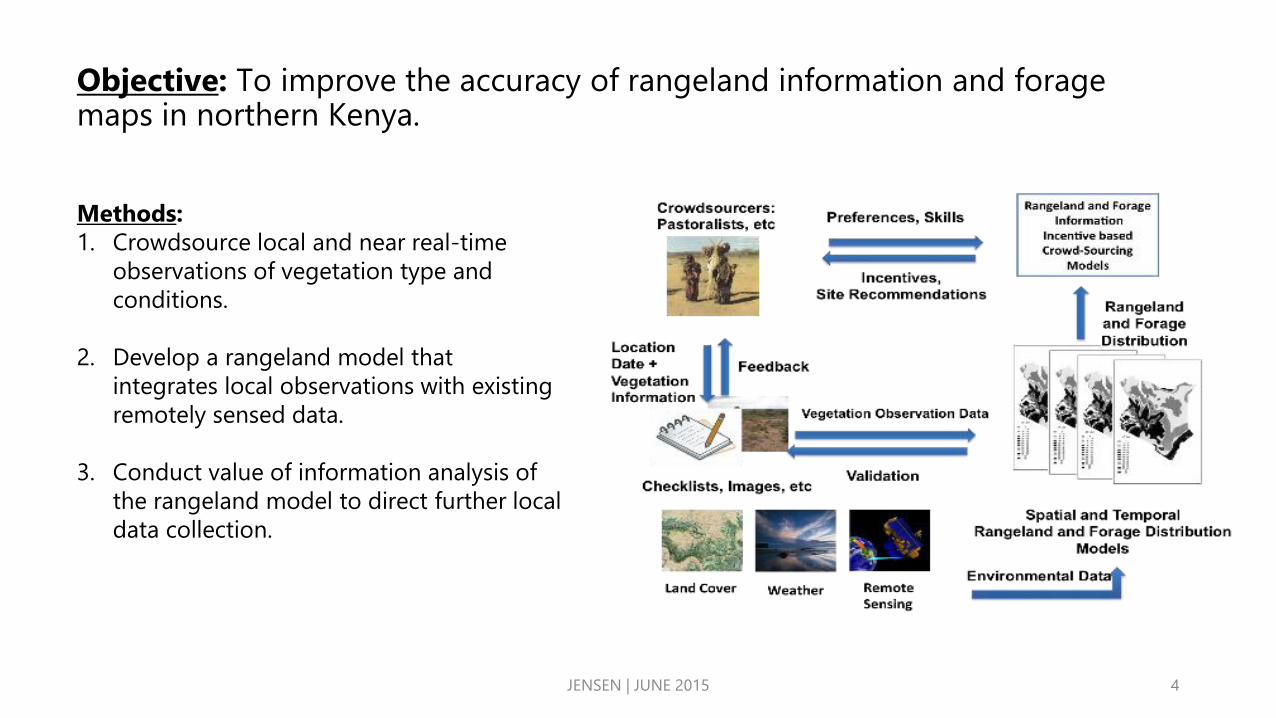
Objective: To improve the accuracy of rangeland information and forage maps in northern Kenya.
Methods:
1. Crowdsource local and near real-time
observations of vegetation type and
conditions.
2. Develop a rangeland model that
integrates local observations with existing
remotely sensed data.
3. Conduct value of information analysis of
the rangeland model to direct further local
data collection.
JENSEN | JUNE 2015 4
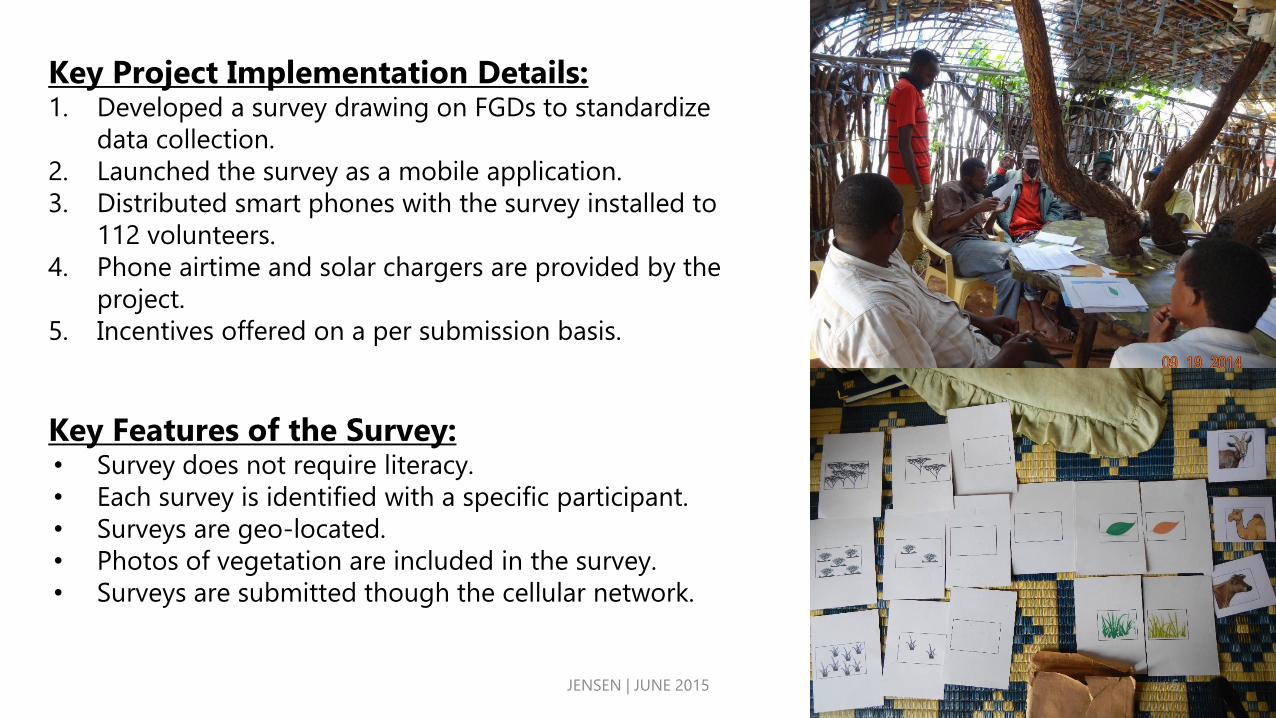
Key Project Implementation Details:1. Developed a survey drawing on FGDs to standardize
data collection.
2. Launched the survey as a mobile application.
3. Distributed smart phones with the survey installed to
112 volunteers.
4. Phone airtime and solar chargers are provided by the
project.
5. Incentives offered on a per submission basis.
Key Features of the Survey:• Survey does not require literacy.
• Each survey is identified with a specific participant.
• Surveys are geo-located.
• Photos of vegetation are included in the survey.
• Surveys are submitted though the cellular network.
JENSEN | JUNE 2015 5
Screen a Screen b Screen c
Screen 0
Screens 1
Screen 2
Screen 3
Screen 4
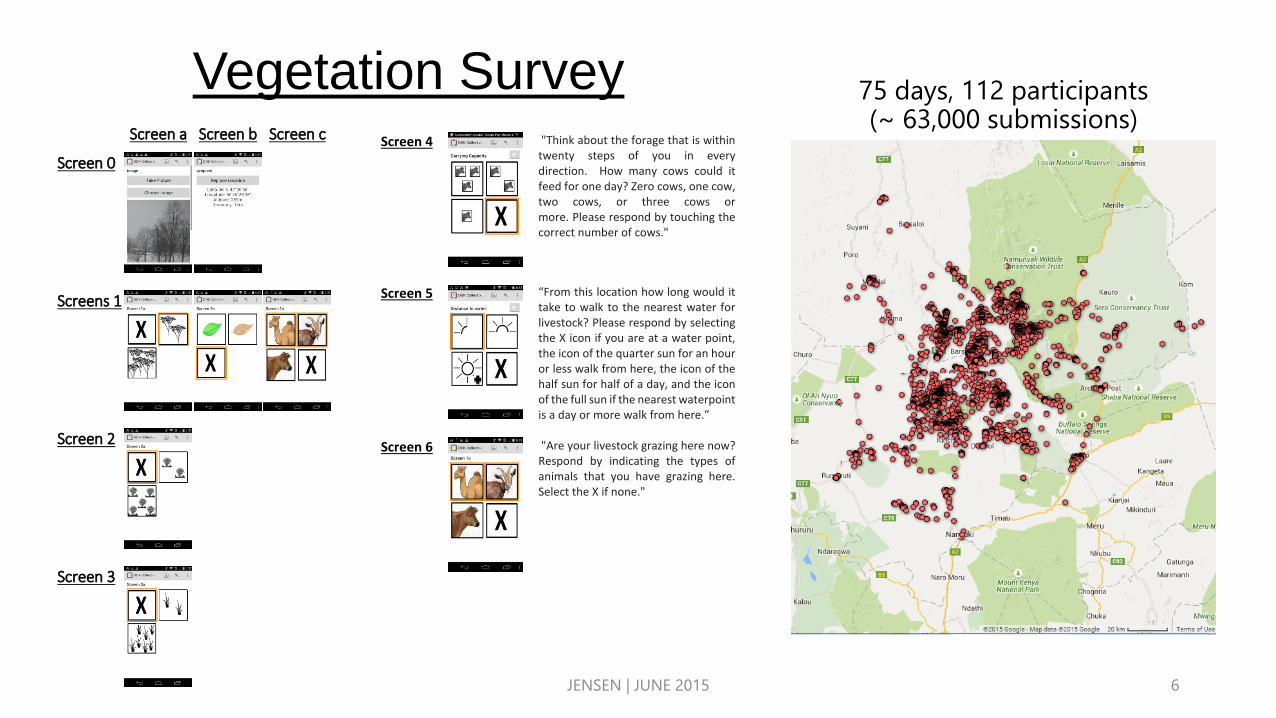
"Think about the forage that is within twenty steps of you in every direction. How many cows could it feed for one day? Zero cows, one cow, two cows, or three cows or more. Please respond by touching the correct number of cows."
Screen 5
“From this location how long would it take to walk to the nearest water for livestock? Please respond by selecting the X icon if you are at a water point, the icon of the quarter sun for an hour or less walk from here, the icon of the half sun for half of a day, and the icon of the full sun if the nearest waterpoint is a day or more walk from here.”
Screen 6
"Are your livestock grazing here now? Respond by indicating the types of animals that you have grazing here. Select the X if none."
Vegetation Survey 75 days, 112 participants(~ 63,000 submissions)
JENSEN | JUNE 2015 6
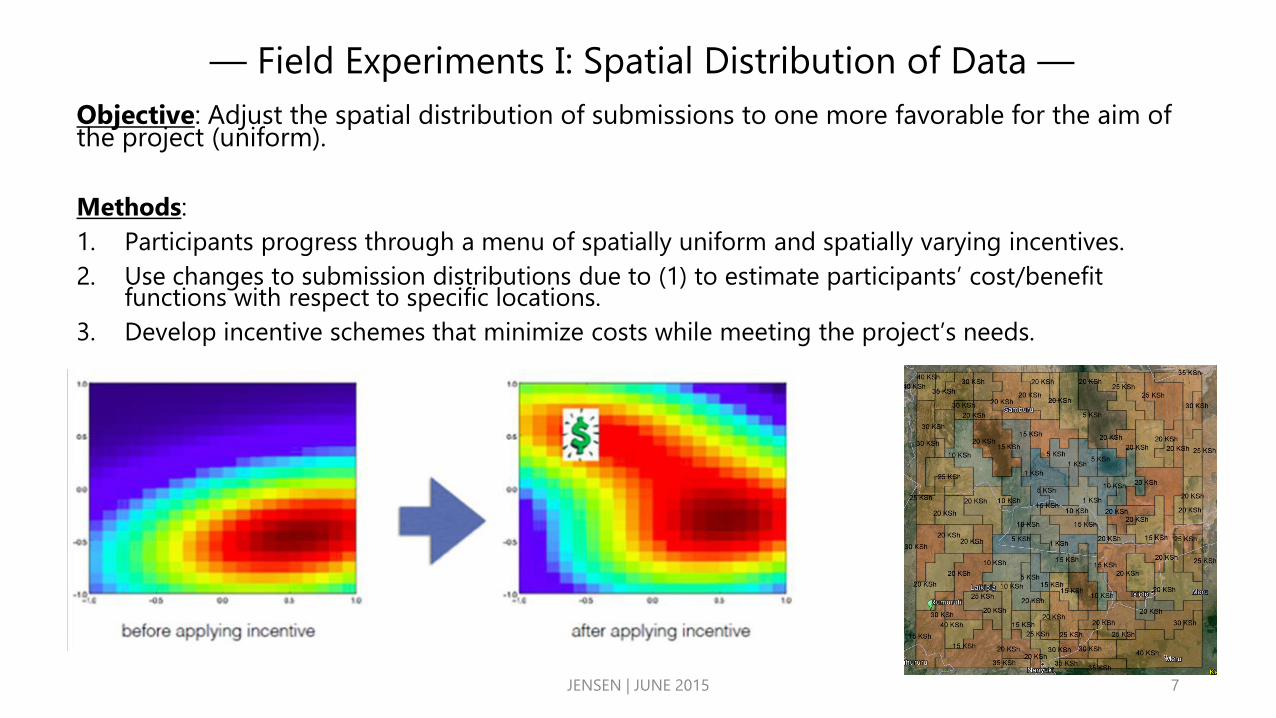
— Field Experiments I: Spatial Distribution of Data —
Objective: Adjust the spatial distribution of submissions to one more favorable for the aim of the project (uniform).
Methods:
1. Participants progress through a menu of spatially uniform and spatially varying incentives.
2. Use changes to submission distributions due to (1) to estimate participants’ cost/benefit functions with respect to specific locations.
3. Develop incentive schemes that minimize costs while meeting the project’s needs.
JENSEN | JUNE 2015 7
JENSEN | JUNE 2015
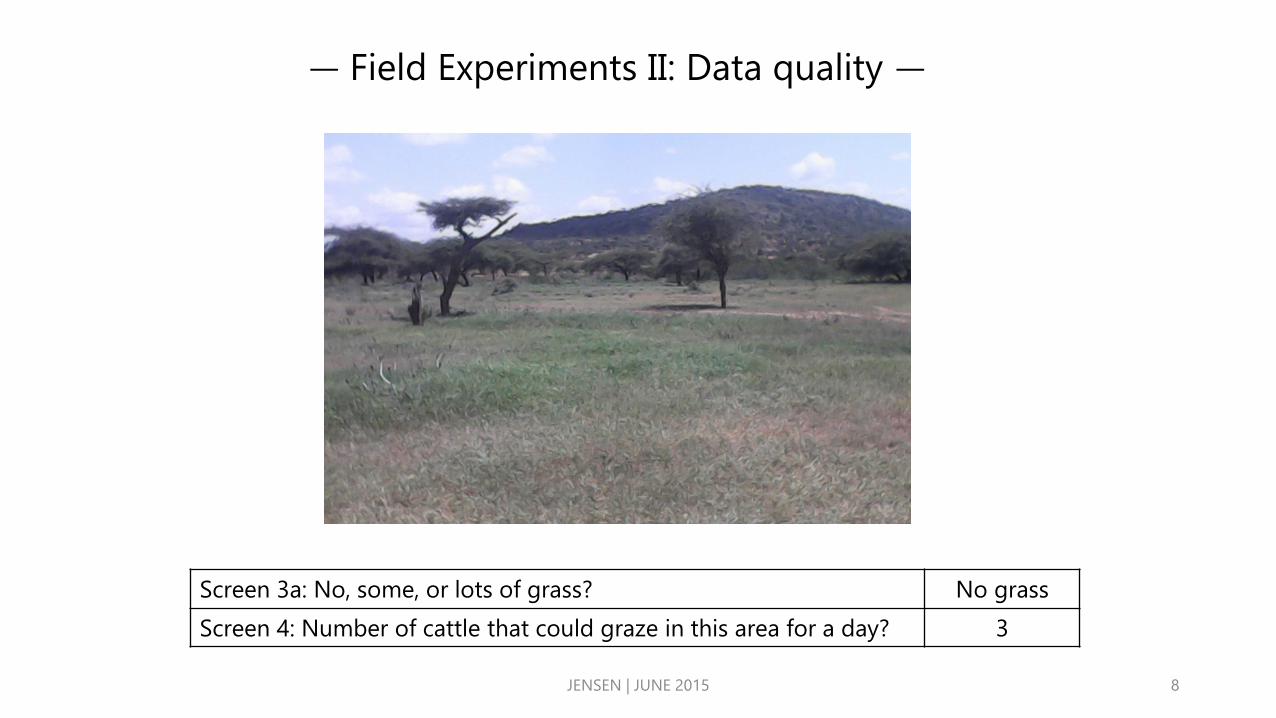
— Field Experiments II: Data quality —
Screen 3a: No, some, or lots of grass? No grass
Screen 4: Number of cattle that could graze in this area for a day? 3
8
JENSEN | JUNE 2015
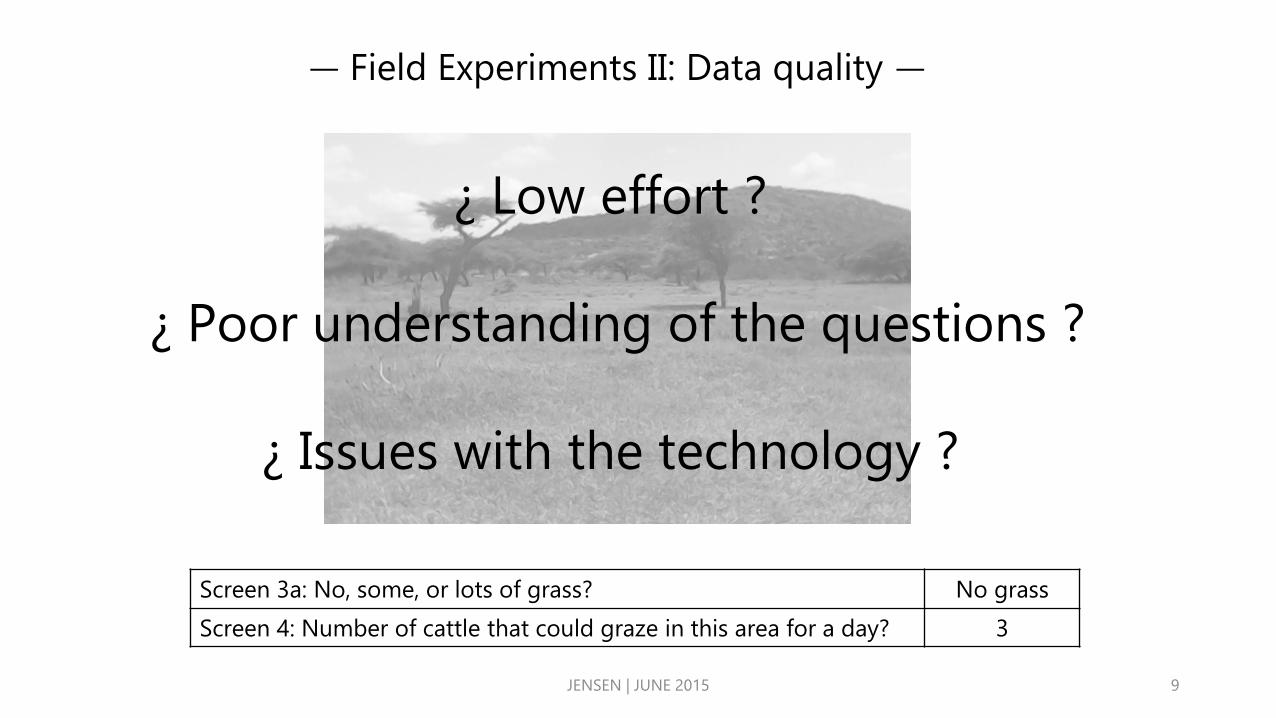
— Field Experiments II: Data quality —
Screen 3a: No, some, or lots of grass? No grass
Screen 4: Number of cattle that could graze in this area for a day? 3
¿ Low effort ?
¿ Poor understanding of the questions ?
¿ Issues with the technology ?
9
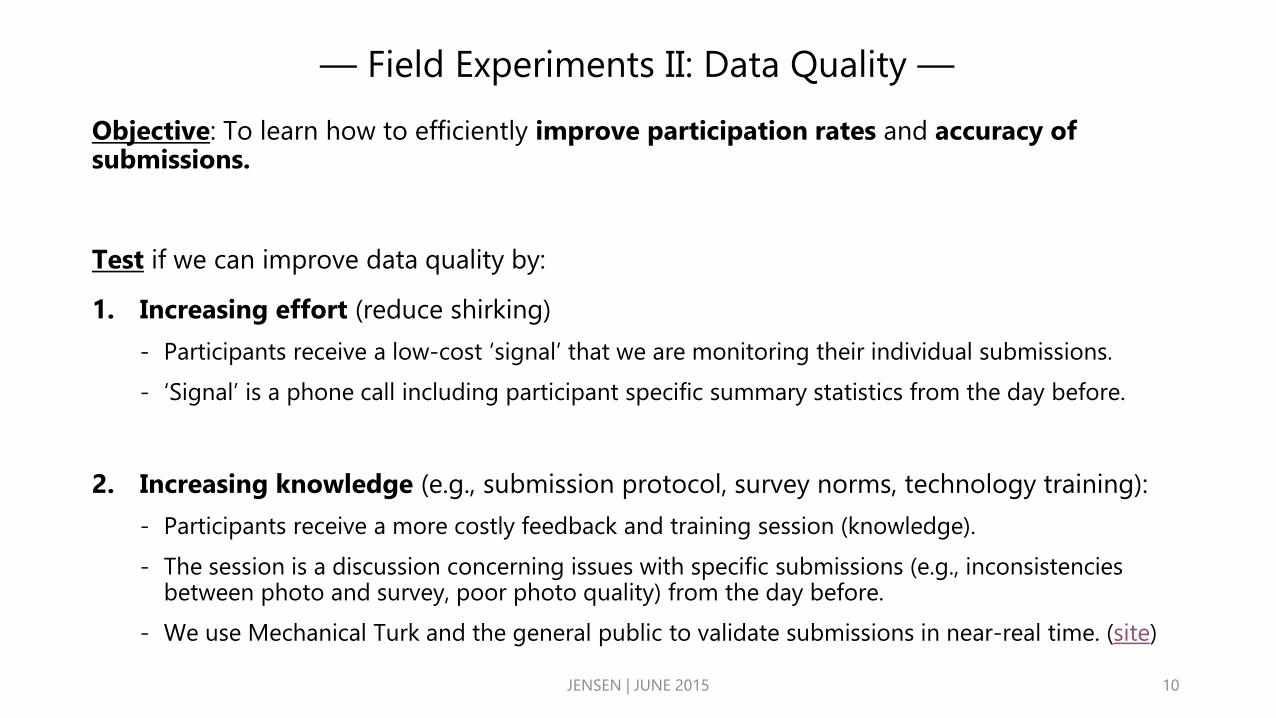
— Field Experiments II: Data Quality —
Objective: To learn how to efficiently improve participation rates and accuracy of submissions.
Test if we can improve data quality by:
1. Increasing effort (reduce shirking)
- Participants receive a low-cost ‘signal’ that we are monitoring their individual submissions.
- ‘Signal’ is a phone call including participant specific summary statistics from the day before.
2. Increasing knowledge (e.g., submission protocol, survey norms, technology training):
- Participants receive a more costly feedback and training session (knowledge).
- The session is a discussion concerning issues with specific submissions (e.g., inconsistencies between photo and survey, poor photo quality) from the day before.
- We use Mechanical Turk and the general public to validate submissions in near-real time. (site)
JENSEN | JUNE 2015 10
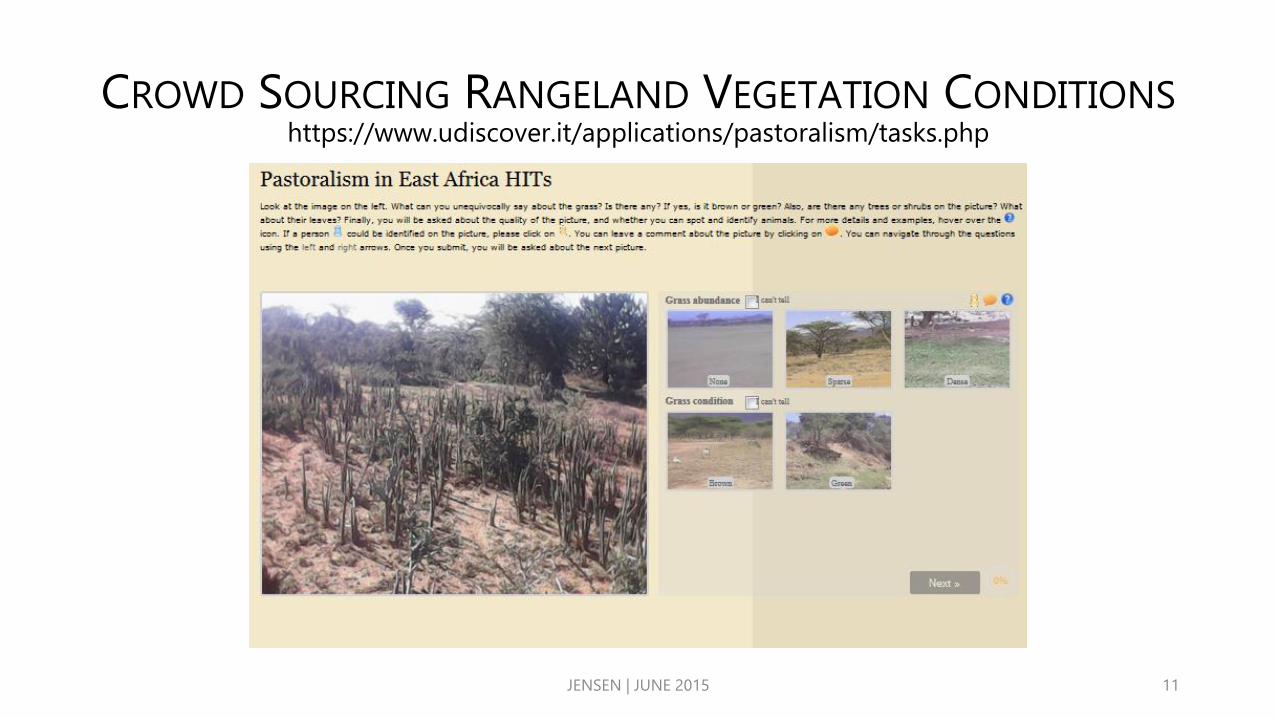
CROWD SOURCING RANGELAND VEGETATION CONDITIONShttps://www.udiscover.it/applications/pastoralism/tasks.php
JENSEN | JUNE 2015 11
Preliminary Findings
• Mobile technology can be used to crowdsource data collection in remote locations from participants unfamiliar with the technology.
• The costs are quite low
• Monitoring and feedback treatments can have large effects on participation rates.
• 1.6 more surveys per day (25% increase)
• 12% more active (in terms of number of days they complete at least one survey)
• Participants respond to variation in incentives, but the extent that we can effect the spatial distribution of submission is still unclear.
JENSEN | JUNE 2015 12
Moving forward
Vegetation model
• Integrate local observations with remotely sensed data to develop near-real time, partially ground-truthed vegetation maps
• Value of data analysis & dynamic incentives to improve model accuracy
Other (more simple) data collection applications for crowdsourcing
• Waterpoint identification and condition
• Violence, cattle rustlers, predator and disease outbreak reporting
Other (more-complex) longer-term applications for crowdsourcing
• Return processed data to users
• Disease identification
• Early warning models
• Monitoring for provision of services (e.g., food aid tracking)
JENSEN | JUNE 2015 13
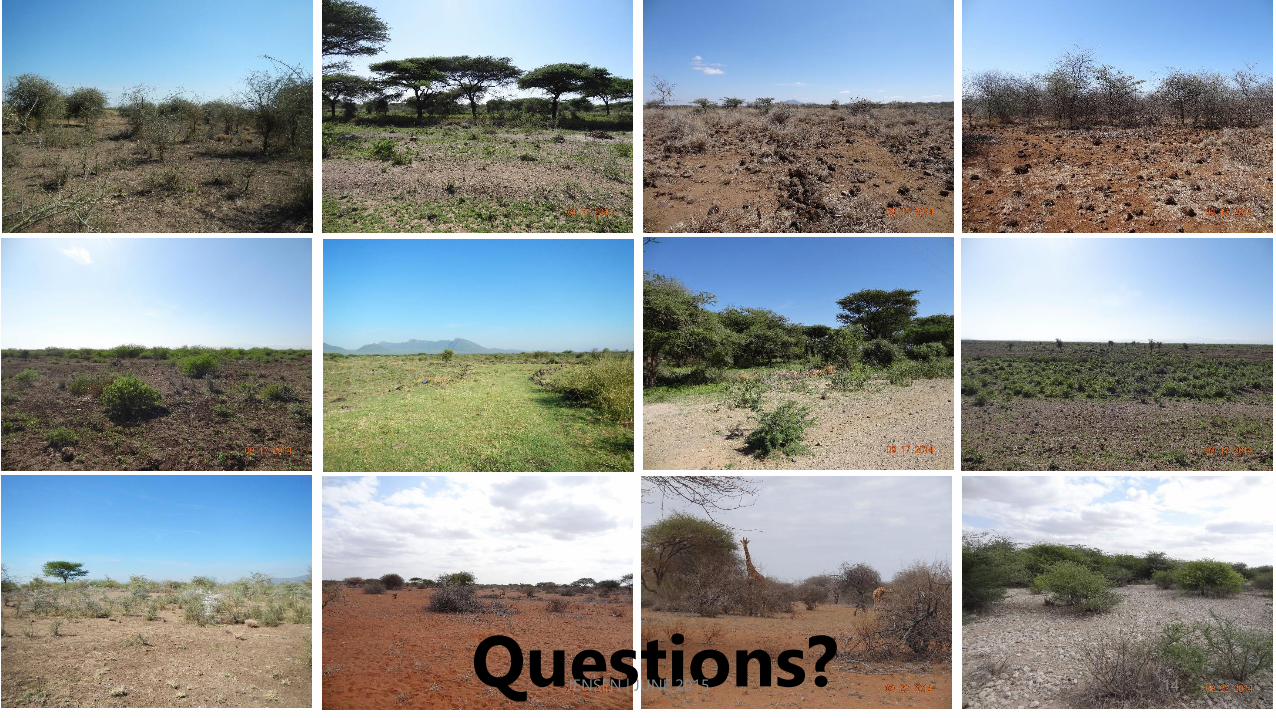
Questions?JENSEN | JUNE 2015 14
Recommended