Electronic copy available at: http://ssrn.com/abstract=2230394
Credit Default Swaps, Strategic Default, and
the Cost of Corporate Debt
Gi H. Kim∗
ABSTRACT
In this paper, I provide the evidence of credit default swaps (CDS, hereafter)
playing new economic roles as a commitment device for the borrower (i.e.
the firm) to repay its debt to the lender (i.e. the creditors). When the firm
writes incomplete debt contracts, its limited ability to commit not to default
strategically in the future incurs the cost of contracting that will be ulti-
mately paid by the firm. CDS can reduce this cost ex ante by strengthening
creditors’ bargaining power in distressed debt renegotiation. I identify, both
theoretically and empirically, the benefit of CDS reducing the contracting
cost arising from the possibility of strategic default. More specifically, I
show that firms a priori most likely to face the limited commitment prob-
lem (i.e. firms with high strategic default incentives) experience a relatively
larger reduction in their corporate bond spreads following the introduction
of CDS.
∗Kim is with the Warwick Business School, University of Warwick

Electronic copy available at: http://ssrn.com/abstract=2230394
Credit default swap (CDS) is an essentially insurance-type contract that the
protection seller will compensate the protection buyer in a credit event of a
reference entity. The use of CDS has been increasingly popular over time
so that gross notional amounts outstanding grew from below USD 2 trillion
to nearly USD 60 trillion between 2002 and 2007 (see BIS, 2010). The
recent financial crises, however, have revealed several shortcomings of CDS,
which triggered a heated debate regarding the utility of this market among
policymakers, academics, and financial market participants. In particular,
the definition of a credit event triggering CDS payment is the center of the
controversy.
In a CDS contract, typical credit events, defined by the International
Swaps and Derivatives Association (ISDA), include the bankrupty of the
debtor or the failure to pay principal/interests on the debt. (Out-of-court)
debt renegotiation, instead, does not constitute a credit event so that CDS
contracts do not pay out after successful renegotiation.1 This feature of
a CDS contract is criticized by some legal scholars (e.g., Hu and Black
(2008a,b)) as giving rise to the ‘empty creditors’, i.e., the CDS-insured cred-
itors of a financially distressed firms. They argue that empty creditors have
financial incentives to push firms into inefficient bankruptcy even though
debt restructuring is optimal. The media attributes the recent Chapter 11
bankruptcy filings of General Motors, Chrysler, and Six Flags to the hold-
out of empty creditors in debt restructuring.
CDS and the empty creditors, it gives rise to, have attracted much at-
tention and been under extensive scrutiny due to their significant impact
on our economy. It is crucial for an informed policy-making to examine
every possible effect of the empty creditors, yet existing academic literature
has focused on their negative roles. Unlike other papers examining their
ex-post (i.e. after default) effects on the outcome of debt renegotiation, my
paper focuses on their ex-ante (i.e. before default) impacts on corporate
debt contracting. In this paper, I explore the benefits of CDS (and empty
creditors) as a device to make up for the incompletness of debt contracts.
More specifically, I provide one of the first theoretial and empirical evidence
that by serving as a commitment device for firms not to default strategically,
2
CDS can help reduce the cost of corporate debt contracting arising from the
possibility of firms’ strategic default on their debt.
Since the pioneering work by Hart and Moore (1994, 1998) and Bolton
and Scharfstein (1990, 1996), the possibility of strategic default has been
widely recognized as a problem of the incompleteness of corporate debt
contracts. When firms cannot credibly commit to reapy their debt, since
their cash flows are ‘observable-but-not-verifiable’ and thus their payment
is not enforceable in court, firms may choose to default to divert cash flows
to themselves even though the cash flows are sufficient to serve contractual
payments. The possibility of strategic default reduces firms’ capacity to raise
debt capital by imposing the extra cost on their debt financing. It is well
documented both theoretically and empirically that the threat of strategic
default increases the cost of debt (e.g., see Fan and Sundaresan (2000) and
Davydenko and Strebulaev (2007)).
CDS can reduce the strategic-default-related cost of contracting by im-
proving the contracting technology and thus mitigating the limited com-
mitment problem that firms face when making (incomplete) debt contracts.
As proposed in the recent paper by Bolton and Oehmke (2011), CDS can
make up for firms’ limited ability to commit not to default strategically by
strengthening creditors’ bargaining position in case of debt renegotiation
upon strategic default. That is, when creditors are insured through CDS,
creditors stand to lose less in default (followed by the failure of debt rene-
gotiation) and therefore are less forgiving in debt renegotiation. The better
bargaining position enables creditors to extract more in debt renegotiation,
and firms have less incentives to strategically renegotiate down their debt
payments to their own advantage.
The goal of this paper is to empirically identify the commitment benefits
of CDS by analyzing the relationship between the reductions in the cost of
debt financing followed by the introduction of CDS and firm-level charac-
teristics that are documented to influence firms’ strategic default incentives.
The economic intuition is that the commitment benefits shoud be larger for
firms that face the severe problem of limited commitment in the absence of
CDS, i.e., firms that are expected (by creditors) to be more likely to default
3

strategically. If CDS plays a role as a commitment device in reducing the
strategic-default-realted cost of contracting, we should observe a larger re-
duction in the cost of debt for firms suffering from the higher cost of strategic
default.
To convey the intuition more clearly, I develop a simple model by extend-
ing a stylized model of strategic debt service in Fan and Sundaresan (2000).
The model allows me to derive the relationship between the magnitude of
reductions in the likelihood of strategic default and three firm characteris-
tics - referred to as strategic variables: (i) shareholder bargaining power,
(ii) liquidation costs, and (iii) renegotitation frictions. In the model, CDS
provides creditors with better outside options (i.e., the payment from CDS
sellers that is presumably higher than the bond’s post-default value) in their
renegotiation with the firm’s shareholders. The creditors’ strengthened bar-
gaining position due to the outside options results in the lower payoffs of
shareholders through debt renegotiation, and decreases their option value
of strategic default ex-ante. The option value of strategic default falls the
most for firms whose shareholders originally have high incentives of strategic
default, such as firms with high shareholder bargaining power, high liqui-
dation costs, and less renegotiation frictions. Therefore, the model predicts
a positive relationship between the commitment benefits and shareholder
bargaining power or liquidation costs whereas they are negativeley related
to renegotiation frictions.
I test empirical predictions of the model using a panel data set of 134
corporate bonds issued to a cross-section of investment grade firms for which
CDS trading was initiated between 2001 and 2008. My empirical strategy,
which is conducted in a firm-fixed OLS regression with an interaction term,
is essentially to regress the changes in a firm’s bond spreads followed by the
onset of CDS trading on its strategic variable measured at the time of the
onset of CDS trading. I proxy for strategic variables with commonly used
firm-specific variables, namely, the concentration of CEO equity owership for
shareholder bargaining power, asset intangibility for liquidation costs, and
the dispersion of bondholders for the probability of renegotiation break-
down.
4
My empirical tests yield two main findings. First, I show that firms that
are more vulnerable to the threat of strategic default in the absence of CDS
benefit more from the onset of CDS trading. Consistent with existing lit-
erature documenting the differential impact of CDS trading on the cost of
debt across firms’ riskiness (Ashcraft and Santos (2009)), I find a reduction
(an increase) in spreads for relatively safe (risky) firms. More important, re-
gardless of firms’ riskiness, there exist significant cross-sectional patterns in
the changes in bond spreads. That is, I find a larger reduction (a smaller in-
crease) for safe (riskier) firms with (1) higher shareholder bargaining power,
(2) higher liquidation costs, and (3) lower renegotiation frictions. These
results provide empirical evidence of the commitment effects of CDS though
they are not of the first-order.
Second, I show that these observed patterns between spread reductions
and strategic variables are more pronounced for riskier firms. Specifically,
when the sample of firms is divided into two sub-groups based on credit
rating at the time of CDS introduction, AAA/AA/A and BBB, the differ-
ential effects of CDS continue to hold only for relatively low grade firms.
For higher-grade firms, the magnitude of the effects is small and statistical
significance disappears. This result provides further evidence of the commit-
ment benefits of CDS. Concern about strategic default does not influence
bond spreads greatly for healthy firms because default (including strategic
default) is relatively less likely to occur for such firms. Therefore, the com-
mitment effects of CDS are smaller (even negligible) for firms with high
credit quality.
Robustness tests address two potential concerns. First is the possibil-
ity of other channels through which CDS trading differentially affects bond
spreads across firms. Firms could be affected differentially by the introduc-
tion of CDS for a number of reasons. Among others, I am mostly concerned
with the information channel of CDS, a situation where CDS trading reveals
more information on firms’ credit risk and thus reduces the information pre-
mium required by investors. This channel may also affect a bond spread
differentially across firms in that the benefits from the information channel
of CDS are more likely to accrue to informationally opaque than to trans-
5

parent firms. To rule out the possibility that the differential effects of CDS
trading across my strategic variables arise from differences in firms’ infor-
mation transparency, I control for firms’ transparency proxied by analyst
coverages measured at the time of onset of CDS trading. My earlier find-
ings do not change significantly in terms of both magnitude and statistical
significance.
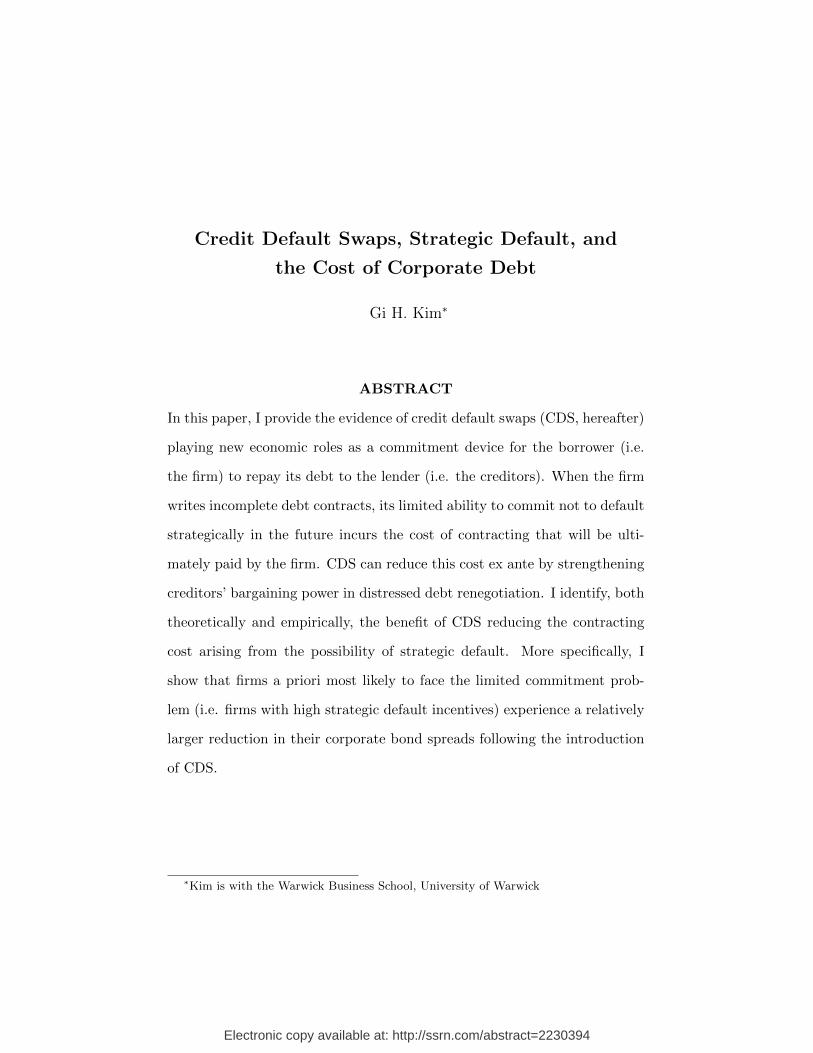
Another potential concern is that the introduction of CDS may be en-
dogenous. For example, people may initiate the CDS trading in anticipation
of the deterioration in firms’ creditworthiness, which cannot be fully ac-
counted for by my control variables in a regression. However, the explosive
growth of CDS markets over my sample period (2001∼2008) seems likely
to be an exogenous technology or financial innovation shock to the onset of
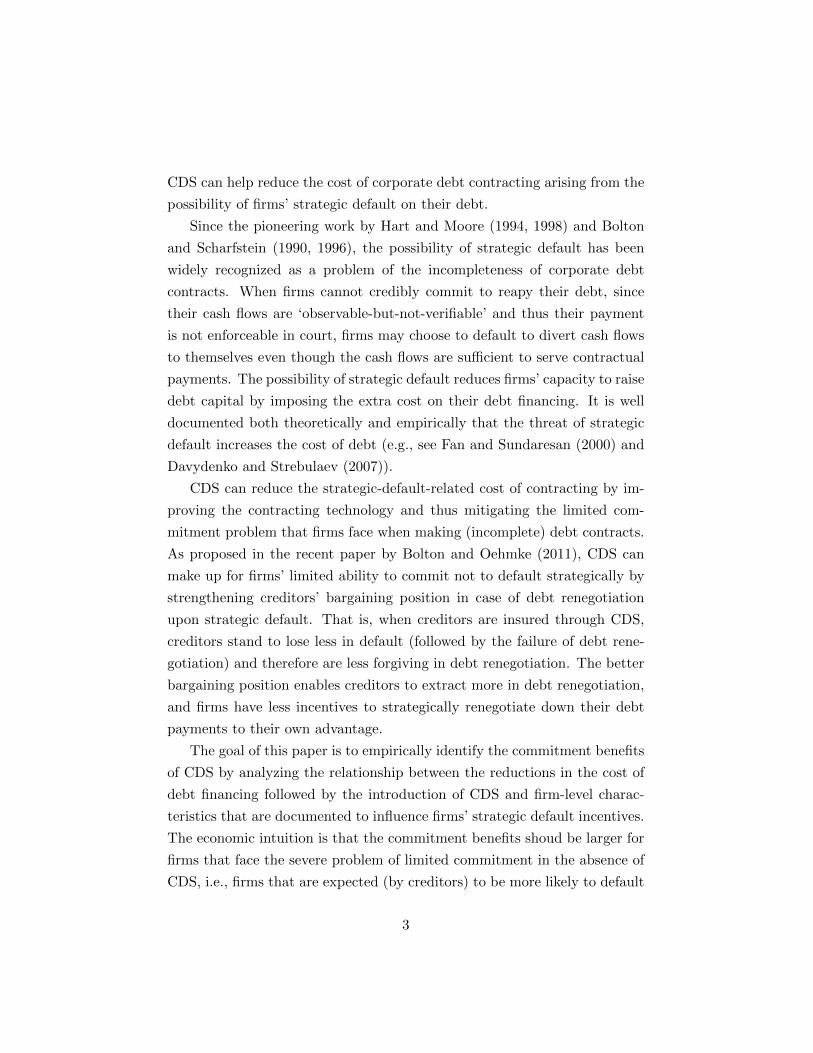
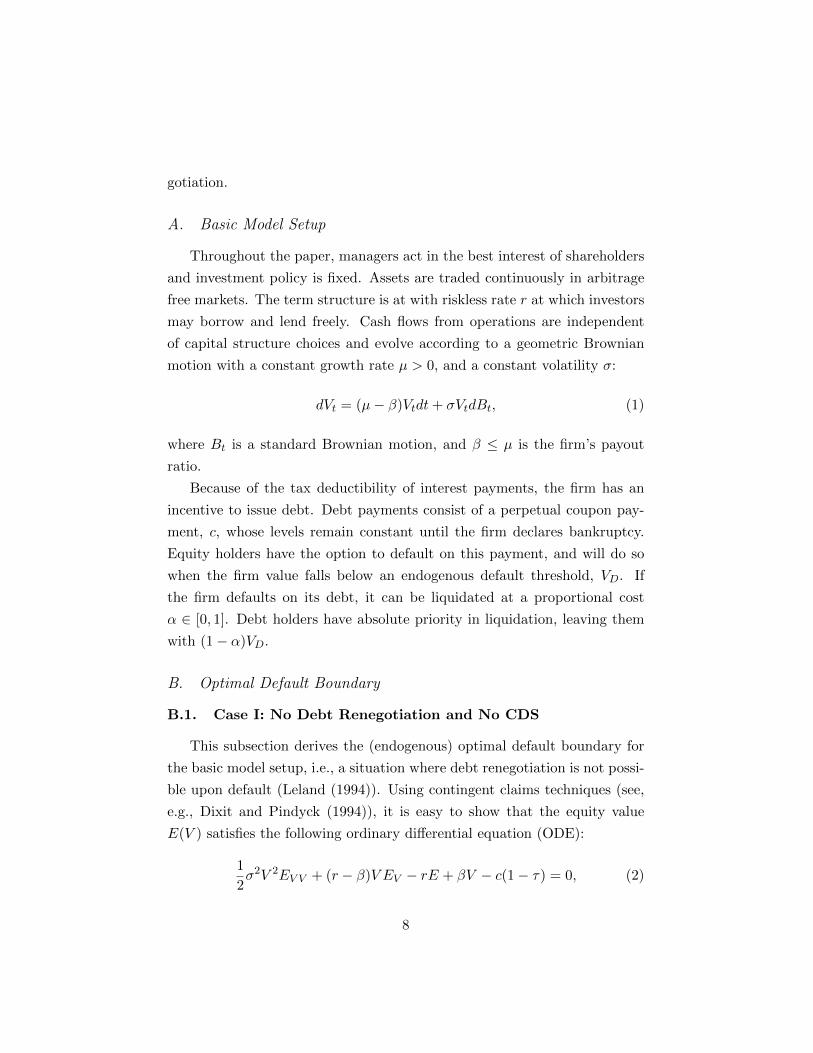
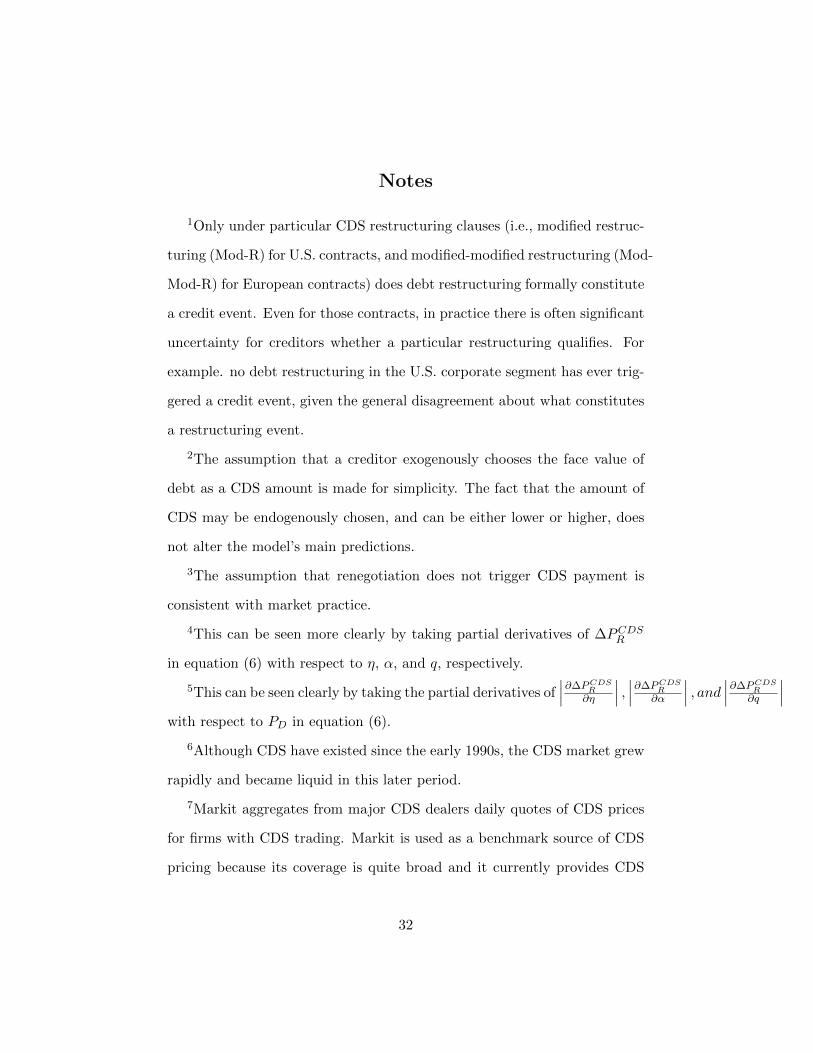
CDS trading. Figure 1 shows that the notional value of outstanding CDS
increased from 1 trillion at the beginning of 2001 to 62 trillion by the end of
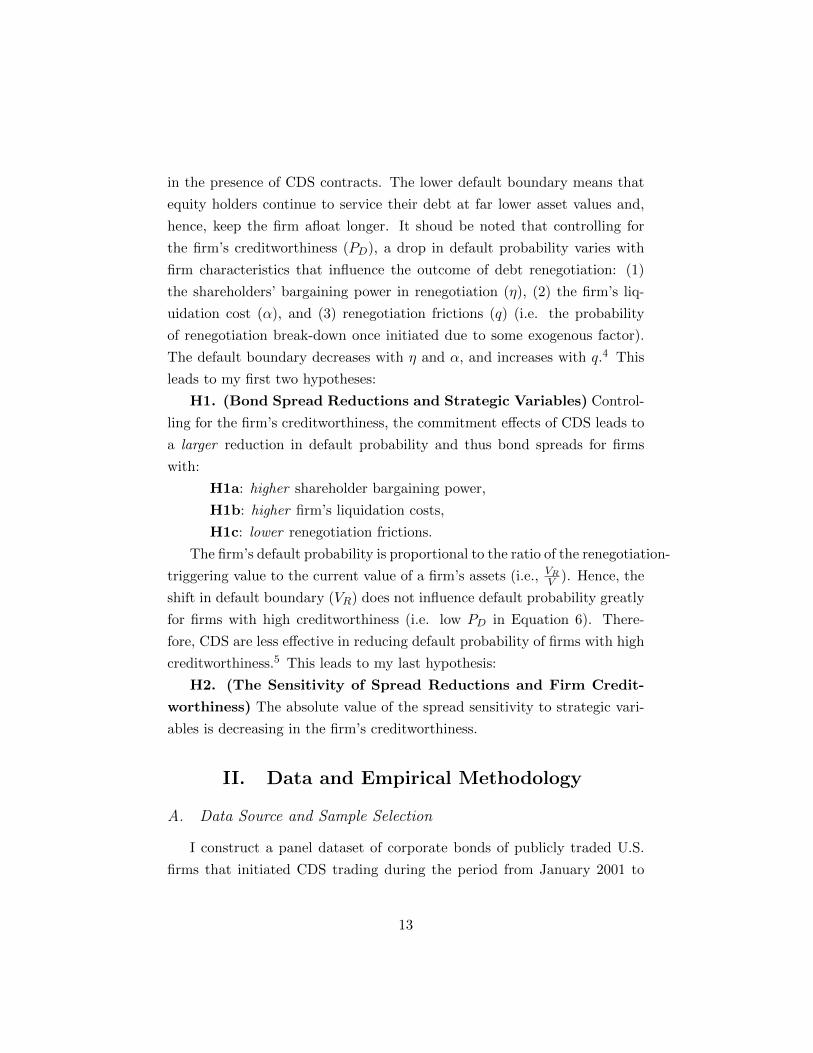
2007. Figure 2 shows that the number of firms with CDS trading increases
monotonically every year. As the markets expand and become more liquid,
the timing of the onset of CDS trading is more likely to be exogenously af-
fected by the ease with which traders locate prices and counterparties owing
to the accumulated experience and knowledge of CDS trading. To further
address endogeneity concerns, I perform a propensity score matched sample
analysis (Rosenbaum and Rubin (1983)). Matched firms, identified as firms
that have never traded CDS but have similar characteristics to firms with
CDS, are used as a control group. My earlier results hold in tests that use
this matching technique.
This paper contributes to a growing literature of the implications of
credit derivatives on corporations, particularly corporate debt financing. As
far as I am aware, my paper is one of the first study to theoretically and
empirically document that CDS can help lower the cost of corporate debt by
acting as a commitment device for the firm to pay out cash flows. Ashcraft
and Santos (2009) find that average firms have not benefited from CDS
trading, and risky and informationally opaque firms have been particularly
adversely affected in terms of the cost of bond issuance. They ascribe this
result to the reduced incentives of banks to monitor borrowers. Their ex-
6
planation is in line with my findings that an average firm’s bond spreads
increase following the onset of CDS trading. Saretto and Tookes (2011) find
that firms with traded CDS contracts on their debt are able to maintain
higher leverage ratios and lower debt maturities. Hirtle (2008) shows that
greater use of derivatives is associated with banks’ improved credit supply in
terms of longer loan maturity and lower spreads, especially for large firms.
My study also sheds light on the current debate over empty creditor
problems, the phenomenon that empty creditors - holders of debt and CDS
- may have low incentives to participate in debt renegotiation, and thus
might force distressed firms into bankruptcies even when continuation is
optimal. On this ground, some legal scholars (e.g., Hu and Black (2008a,b))
propose the removal of those creditors’ voting rights in a debt restructuring
process. In contrast, financial economists are concerned about the proposal
since it would also erode ex ante commitment benefits of CDS (e.g., Bolton
and Oehmke (2011), Campello and Matta (2011)). This study is one of the
first paper to verify the beneficial role of empty creditors in reducing the
cost of strategic default.
The rest of the paper is organized as follows. Section I presents a theo-
retical framework of how CDS affect the probability of strategic default and,
hence, bond yields. The data and empirical methodology are discussed in
Section II. Section III reports empirical findings. Section IV presents the
results of the robustness tests. Section V concludes.
I. Theoretical Framework and Hypotheses
In this section I present the theoretical framework for the ex-ante effects
of CDS on firms’ strategic default incentives. This section is intended to
derive testable implications on the relationship between the magnitude of
the commitment effects and firm-level characteristics that influence strate-
gic decisions concerning default and debt renegotiation. Building on the
Leland (1994) model of risky debt where equity holders are assumed to de-
cide whether and when to default, I examine how their default decision is
affected ex-ante by the presence of CDS-insured debt holders in debt rene-
7
gotiation.
A. Basic Model Setup
Throughout the paper, managers act in the best interest of shareholders
and investment policy is fixed. Assets are traded continuously in arbitrage
free markets. The term structure is at with riskless rate r at which investors
may borrow and lend freely. Cash flows from operations are independent
of capital structure choices and evolve according to a geometric Brownian
motion with a constant growth rate µ > 0, and a constant volatility σ:
dVt = (µ− β)Vtdt+ σVtdBt, (1)
where Bt is a standard Brownian motion, and β ≤ µ is the firm’s payout
ratio.
Because of the tax deductibility of interest payments, the firm has an
incentive to issue debt. Debt payments consist of a perpetual coupon pay-
ment, c, whose levels remain constant until the firm declares bankruptcy.
Equity holders have the option to default on this payment, and will do so
when the firm value falls below an endogenous default threshold, VD. If
the firm defaults on its debt, it can be liquidated at a proportional cost
α ∈ [0, 1]. Debt holders have absolute priority in liquidation, leaving them
with (1− α)VD.
B. Optimal Default Boundary
B.1. Case I: No Debt Renegotiation and No CDS
This subsection derives the (endogenous) optimal default boundary for
the basic model setup, i.e., a situation where debt renegotiation is not possi-
ble upon default (Leland (1994)). Using contingent claims techniques (see,
e.g., Dixit and Pindyck (1994)), it is easy to show that the equity value
E(V ) satisfies the following ordinary differential equation (ODE):
1
2σ2V 2EV V + (r − β)V EV − rE + βV − c(1− τ) = 0, (2)
8

where τ ∈ [0, 1] is a (constant) tax rate, EV and EV V are the first and
second derivatives of the equity value with respect to the firm value V . As
the value of the asset V approaches infinity, debt becomes riskless and hence
the equity value must satisfy:
limV ↑∞
E(V ) = V − c(1− τ)
r. (3)
Since the equity value is zero at default, the lower boundary conditions are
as follows:
limV ↓VR
E(V ) = 0, (4a)
limV ↓VR
EV (V ) = 0. (4b)
The solution to the ODE is given by:
VD =−λ
1− λc(1− τ)
r(5)
where λ is a negative constant:
λ =
(1
2− r − β
σ2
)−
√(1
2− r − β
σ2
)2
+2r
σ2< 0. (6)
In equation (5), the default threshold is a function of the firm’s fundamental
such as leverage, c and asset volatility, σ.
B.2. Case II: Debt Renegotiation and No CDS
In this subsection I present how the possibility of debt renegotiation in-
duces strategic default and thus raises the optimal default threshold derived
in equation (5). Similar to the renegotiation model of Fan and Sundaresan
(2000) (FS hereafter), I assume that costly liquidation can be avoided by
debt renegotiation and a rupture of renegotiations drives the firm liquidated.
To account for renegotiations frictions, I follow Davydenko and Strebulaev
(2007), and allow the debt renegotiation to fail with probability q. When q
9

is close to zero, there are few frictions in the debt renegotiation, and there is
scope for shareholders to extract firm value from debt holders. In the limit
where q equals one, the debt cannot be renegotiated and claims are settled
based on absolute priority rules.
Once debt renegotiation is initiated, the two parties bargain over the
value of the firm at renegotiation, VR, which is devided according to the
equilibrium outcome of a Nash bargaining game between equity holders and
debt holders:
E(V ) = θ∗V, (7a)
D(V ) = (1− θ∗)V, (7b)
where E and V are the values of equity and debt, respectively, and θ∗ is the
optimal sharing rule which is determined to maximize the aggregate surplus
to equity and debt holders in the following Nash bargaining game:
θ∗ = argmax [θVR − 0]η [(1− θ)VR − (1− α)VR]1−η (8a)
= ηα. (8b)
In the above game, η represents the bargaining power of shareholders and
1−η the bargaining power of bondholders. The shareholders’ surplues from
bargaining is θ∗V − 0, because the alternative to bargaining is liquidation,
in which case shareholders receive nothing. The bondholders’ surplus from
bargaining is (1−θ∗)V − (1−α)V , since the alternative entails a dissipative
liquidation cost, α.
Now the lower boundary conditions in equation (4b) can be rewritten
by:
limV ↓VR
E(V ) = (1− q)E(V ) = (1− q)ηαVR, (9a)
limV ↓VR
EV (V ) = (1− q)ηα. (9b)
Shareholders choose XR to maximize the value of equity, taking into account
the anticipated outcome of the future debt renegotiation. The optimal de-
10

fault boundary is given by:
VR =
(1
1− (1− q)ηα
)(−λ
1− λ
)c
r(10a)
=
(1
1− (1− q)ηα
)︸ ︷︷ ︸
> 1
VD. (10b)
In equation (10b), the default threshold increases with the shareholders’
bargaining power, η, and liquidation costs, α, but decreases with the proba-
bility of renegotiation failure, q. Intuitively, the strategic default incentives
of shareholders increase with their bargaining power or with the liquidations
costs because both increase the share of the total assets that debt holders
will concede in order to avoid a costly liquidation. Conversely, the strategic
default incentives decrease with more renegotiation frictions because, in that
case, shareholders are less likely to extract any renegotiation rents.
B.3. Case III: Debt Renegotiation and CDS
In the last but most important subsection I present how the presence
of CDS-insured debt holders can reduce shareholders’ incentives of strate-
gic default and thus lower the default boundary ex-ante. Following Bolton
and Oehmke (2011), I assume that the payment from the CDS seller is
higher than bond’s post-default value.2 Because the CDS payment is not
triggered by debt renegotiation, a protected creditor has increased outside
options and, hence, a strenghened bargaining position in renegotiation.3
This CDS-induced shift in bargaining power affects the optimal sharing rule
in equation (8b) as follows:
θ∗ = argmax [θVR − 0]η [(1− θ)VR − (1− α+ π)VR]1−η (11a)
= η (α− π) , 0 < π ≤ α. (11b)
While equity holders’ surplus from bargaining remains unchanged, the
bondholder’s payoff from bargaining decreases due to the better outside
option, (1− θ)VR − (1− α+ π)VR. Now that she is protected by CDS, she
11

receives the higher amount (i.e., by πVR) than the bond’s recovery value
(i.e., the firm’s liquidation value, (1−α)VR) in case of renegotiation failure.
Equation (11b) presents a reduction in the equity holders’ share due to
CDS by ηπ. Now the lower boundary conditions can be rewriten by:
limV ↓VR
E(V ) = (1− q)η(α− π)VR, (12a)
limV ↓VR
EV (V ) = (1− q)η(α− π). (12b)
The optimal boundary is given by:
V CDSR =
(1
1− (1− q)η(α− π)
)(−λ
1− λ
)c
r(13a)
=
(1− (1− q)ηα
1− (1− q)η(α− π)
)︸ ︷︷ ︸
< 1
VR (13b)
is the renegotiation triggering point, VR is the default boundary in the orig-
inal FS model. The reduction in the risk-neutral probability of default is
given by:
∆PCDSR =
∣∣∣∣∣(
V
V CDSR
)λ−(V
VR
)λ∣∣∣∣∣ (14a)
=
∣∣∣∣∣(V
VD
)λ ([1− (1− q)η(α− π)]λ − [1− (1− q)ηα]λ
)∣∣∣∣∣ (14b)
= PD ·(
[1− (1− q)ηα]λ − [1− (1− q)η(α− π)]λ)
︸ ︷︷ ︸a reduction in the firm’s strategic default incentives
> 0 (14c)
where PD is the risk-neutral probability of default when debt renegotiation
is impossible:
PD =
(V
VD
)λ. (15)
Equation (13b) clearly shows how the default boundary shifts downwards
12
in the presence of CDS contracts. The lower default boundary means that
equity holders continue to service their debt at far lower asset values and,
hence, keep the firm afloat longer. It shoud be noted that controlling for
the firm’s creditworthiness (PD), a drop in default probability varies with
firm characteristics that influence the outcome of debt renegotiation: (1)
the shareholders’ bargaining power in renegotiation (η), (2) the firm’s liq-
uidation cost (α), and (3) renegotiation frictions (q) (i.e. the probability
of renegotiation break-down once initiated due to some exogenous factor).
The default boundary decreases with η and α, and increases with q.4 This
leads to my first two hypotheses:
H1. (Bond Spread Reductions and Strategic Variables) Control-
ling for the firm’s creditworthiness, the commitment effects of CDS leads to
a larger reduction in default probability and thus bond spreads for firms
with:
H1a: higher shareholder bargaining power,
H1b: higher firm’s liquidation costs,
H1c: lower renegotiation frictions.
The firm’s default probability is proportional to the ratio of the renegotiation-
triggering value to the current value of a firm’s assets (i.e., VRV ). Hence, the
shift in default boundary (VR) does not influence default probability greatly
for firms with high creditworthiness (i.e. low PD in Equation 6). There-
fore, CDS are less effective in reducing default probability of firms with high
creditworthiness.5 This leads to my last hypothesis:
H2. (The Sensitivity of Spread Reductions and Firm Credit-
worthiness) The absolute value of the spread sensitivity to strategic vari-
ables is decreasing in the firm’s creditworthiness.
II. Data and Empirical Methodology
A. Data Source and Sample Selection
I construct a panel dataset of corporate bonds of publicly traded U.S.
firms that initiated CDS trading during the period from January 2001 to
13

December 2008.6 I begin by building the sample of CDS firms (i.e., firms
that have traded CDS) using the Markit CDS Pricing database as follows.7
I start with CRSP-Compustat firms that have traded CDS by selecting only
those that have ever had quote information in the Markit database. For each
CDS firm, I then identify the first date (i.e., quarter) in which a U.S.-dollar-
dominated CDS contract was traded at a five-year maturity. This quarter
is used in the analysis to indicate the onset of CDS trading. Following
Ashcraft and Santos (2009), I remove all firms that initiated trading in the
first month of 2001, when the Markit data begin, because of uncertainty
about the starting dates of these firms’ CDS trading. I obtain 869 CDS
firms with CRSP-Compustat identifiers.
From these, I select only CDS firms for which bond information (e.g.
prices and characteristics) is available. Bond pricing information is ob-
tained from TRACE and NAIC, two bond transaction databases widely
used in the recent literature.89 I augment TRACE’s limited coverage in
earlier years with NAIC, and delete firms that have never had bond pricing
information in either database. I further merge bond pricing data with the
Mergent Fixed Investment Securities Database (FISD) to eliminate all but
senior, unsecured, corporate debenture or medium-term notes. Bonds with
no rating and with options-like features (callable, puttable, or convertible
bonds or bonds with sinking funds) as well as bonds with less than one year
or more than thirty years to maturity are removed. This process reduced
the number of firms in the sample to 276.
Lastly, my sample is limited to firms that have at least one outstanding
bond that has price information available both before and after the onset
of CDS trading (169 firms).10 I further restrict my analysis to firms that
had investment-grade credit ratings (no worse than BBB) at the time they
initiated CDS trading. Table I presents descriptive statistics on the final
sample, which totals 136 firms and 1,506 firm-quarter observations from
2001:2 to 2008:3. Panels A and B break down the CDS firms by industry
and rating, respectively, at the time of CDS introduction. As expected,
firms in the manufacturing and financial industries (67 and 32, respectively)
comprise the larger portion, and firms with relatively lower ratings (i.e., A
14

and BBB) constitute nearly 90%, of the sample. Panel C breaks down firms
by the timing (i.e., year) of CDS introduction. CDS trading begins in 2001
for 34% of firms, 2002 for 29%, 2003 for 16%, and by the third quarter of
2008 for the remainder.11
B. Variable Description
B.1. Shareholder Bargaining Power
As a measure of shareholders’ bargaining power, I use CEO shareholding
defined as the proportion of shares held by a CEO (CEOSHARE ).12 CEOs
with a high stake in a company are likely to aggressively represent equity
holders in renegotiation, thus generating collective bargaining force more
effectively. This is evidenced by existing studies documenting that equity
deviations from the absolute priority rule (APR) in the bankruptcy process
are more likely for firms with higher CEO ownership. Betker (1995), for
example, documents that a 10% increase in CEO shareholding increases
equity deviations from the APR in Chapter 11 by as much as 1.2% of firm
value.
B.2. Liquidation Costs
I use asset intangibility (INTANGIBLE ) as a measure of liquidation
costs. Debt holders shoud be more willing to forgive debt in renegotiation
if their alternative is to face high costs in liquidation. Asset intangibility is
computed as one minus the asset tangibility measure, which is the average
of the expected exit values per dollar of the different tangible assets in
liquidation weighted by their proportion of total book assets. Specifically,
following Berger, Ofek, and Swary (1996) and Almeida and Campello (2007),
I compute asset tangibility as (0.715 × Receivables + 0.547 × Inventory +
0.535 × Capital + 1 × Cash Holdings), scaled by the total book value of
assets. Subtracting this measure of asset tangibility from one yields the
liquidation cost.13
15
B.3. Renegotiation Frictions
I use the dispersion of bond holders as a proxy for renegotiation frictions.
Firms with a large number of of bond holders have more difficulty restruc-
turing their debt privately, thus resulting in formal bankruptcies due both
to the hold-out problem and to conflicts of interest (Gertner and Scharfstein
(1991), Bolton and Scharfstein (1996), and Bris, Welch, and Zhu (2006)). I
use the number of bond issues (ISSUENUM ) to capture the dispersion of
bond holders. This measure is computed as the logarithm of the number of
outstanding public bond issues divided by the logarithm of the book value
of a firm’s total debt. (Gilson, John, and Lang (1990)).14
B.4. Credit Worthiness and Information Transparency
Credit rating (RATING) used to reflect a firm’s credit worthiness. Infor-
mation transparency is captured by analyst coverage, defined as the number
of equity analysts that forecast a firm’s earnings (ANALYSNUM ). Firms
with more analyst coverage are considered to be less informationally opaque
either because analysts increase the information available about firms or
because they extend coverage to more transparent firms.15
To obtain the data necessary to compute these variables, my sample
of CDS firms is further merged with Compustat Quarterly for accounting
and rating information, ExecuComp for managerial shareholding data, and
I/B/E/S for data on equity analysts’ earning forecasts. Table II presents
the summary statistics for those five variables. As shown in Panel A, the
mean (median) is 0.58 (0.11), 0.59 (0.57), and 0.23 (0.24), and the stan-
dard deviation 1.76, 0.13, and 0.11 for CEOSHARE, INTANGIBLE, and
ISSUENUM, respectively. The median rating (RATING) of CDS firms is
7 (i.e., A-) and average number of analysts nine (ANALYSNUM ). Panel B
presents the correlation matrix for these five variables. That the variables
are not significantly related to one another suggests that each of variables
captures a distinct aspect of the firm.
16

B.5. Bond Yield Spread and Control Variable
The dependent variable is a bond’s yield spread computed as the differ-
ence between its yield-to-maturity and the maturity-matched Treasury bond
yield. I construct a complete yield curve of Treasury by linear interpolation
from 1, 2, 3, 5, 7, 10, and 30-year Treasury rates using bond yields obtained
from the Federal Reserve Bank of St. Louis. I also construct a set of con-
trol variables known to be important determinants of credit spreads. These
include bond-level, firm-level, and market-level factors. Bond-level factors
include maturity, duration, and convexity, firm-specific factors leverage, size,
volatility, credit rating, and profitability, and for market-level factors I use
the volatility index (VIX). How these control variables are constructed is
explained briefly below.
1. MATURITY. Remaining time (in years) to maturity date.
2. DURATION. (Macaulay) duration, defined as a present-value-weighted
average of the timing of all promised cash flows, is a linear measure of
how the price of a bond changes in response to interest rate changes.
It is constructed as:
Duration =n∑i=1
ti ×(
CFiP (1 + y)ti
)(16)
where CFi is the bond’s ith cash flows, i indexes the cash flows, ti is
the time in years until the ith payment will be received, and P is the
bond price, y the yield to maturity, and n the total number of cash
flows.
3. CONVEXITY. Convexity is a measure of the curvature of how the
bond price changes as the interest rate changes. It is constructed as:
Convexity =1
(1 + y)2
n∑t=1
ti(ti + 1)×(
CFiP (1 + y)ti
)(17)
4. LEVERAGE. A market value-based definition of firm leverage is com-
puted as the market value of long-term debt divided by the book value
17

of total assets.
5. SIZE. Market value-based firm size is defined as the logarithm of the
book value of long-term debt plus the market value of common equity.
6. STOCK VOLATILITY. The historical volatility of equity is measured
in terms of the standard deviation of daily stock prices over the past
three months.
7. RATING. An ordinal number is assigned to a firm’s S&P rating as fol-
lows: AAA=1, AA+=2, AA=3, AA-=4, A+=5, A=6, A-=7, BBB+=8,
BBB=9, BBB-=10, BB+=11, BB=12, BB-=13, B+=14, B=15, and
B-=16.
8. PROFITABILITY. Profitability is defined as earnings before tax and
depreciation divided by book value of total assets.
9. VIX. VIX is the average implied volatility of eight near-the-money
options on the S&P index.
Table III reports summary statistics on bond yield spreads and control
variables described above. Panels A and B show that a bond’s yield spreads
monotonically increase with a firm’s credit rating and a bond’s maturity.
Panel C compares firms before and after their CDS start to trade. It shows
that there is a reduction in stock volatility, a deterioration in the credit
quality, an increase in leverage and firm size, and a slight decrease in yield
spreads. The results of lower yield spreads and higher leverage after the
onset of CDS trading are different from Ashcraft and Santos (2009) who
find the opposite results. But, when controlling for other credit factors in
a regression, I also observe an increase in spreads. My result on leverage is
consistent with Saretto and Tookes (2011) who document that firms with
traded CDS maintain higher leverage ratios. Table IV provides an index of
all variables used in the analyis together with brief descriptions and data
sources.
C. Empirical Specification
I estimate the model below in equation (18) using ordinary least square
(OLS) regression with firm-fixed effects to make use of within-firm varia-
18
tion.16 The models are estimated both with and without time-fixed effects,
and all standard errors are clustered at the firm level.
CSi,t = αi + β TRADINGi,t + γ TRADINGi,t × STRATV ARi+ θ TRADINGi,t ×RATINGi +
∑j
δj CONTROL(j)i,t + εi,t,
(18)
where αi denotes the firm fixed effects, CSi,t is the credit spreads of firm i
in quarter t, and TRADINGi,t is equal to zero for firm-quarters before
the onset of CDS trading, and one otherwise. RATINGi is the firm’s
credit rating measured in the quarter before the onset of CDS trading.
CONTROLi,t is the bond-level, firm-level, and market-level determinants
of credit spreads. STRATV ARi is my strategic variables measured in the
quarter before the onset of CDS trading (CEOSHAREi, INTANGIBLEi,
or ISSUENUMi).1718 The coefficient γ, which captures the differential ef-
fects of CDS on credit spreads, is my main interest.
III. Empirical Findings
A. The Impact of CDS Trading Across Strategic Variables
Table V shows the estimated coefficients for the regression for CEO
shareholding (CEOSHARE). The coefficients on TRADING×CEOSHAREare observed to be negative and highly statistically significant in all specifi-
cations (at the 1% level for Columns (2), (3), (5), and (6), at the 5% level
for Column (4), and at the 10% level for Column (1)), and the magnitude
of the coefficients to be quite large. The coefficient in Column (6) (- 8.9),
for instance, suggests that a one-standard deviation increase in CEOSHARE
(1.76) is associated with a reduction of 16 basis points (bps) in average credit
spreads.
Table VI presents the results of the regression for asset intangibility
(INTANGIBLE ). Similar to the results in Table VI, the coefficients on the
interaction term are all negative regardless of specification, statistically sig-
19

nificant for all specifications except Columns (1) and (4), and comparable
in magnitude to the coefficients on CEOSHARE. A one-standard-deviation
increase in the ratio of intangible to total assets (0.13) is associated with a
reduction of 14 bps in average bond spreads. Also similar to CEOSHARE
are the effects of CDS across low and high INTANGIBLE.
The results of the regression with ISSUENUM, are presented in Ta-
ble VII. In contrast to the other two variables, the coefficients on the in-
teraction term are positive for all specifications and statistically significant
for five out of six specifications. This result indicates that the decrease (not
increase, as in the case of former variables) in the number of bond issues re-
sults in a larger reduction in credit spreads. The economic impact, though,
is similar to that of the other two variables, a one-standard-deviation de-
crease in the normalized number of bond issues (0.11) being associated with
a reduction of 12 bps in average bond spreads.
All these results are consistent with my hypotheses that firms with higher
strategic incentives benefit more from the introduction of CDS. Regard-
less of the empirical spefication adopted, interestingly, the interaction term
TRADING×RATING is positive. These results are in line with existing
evidence of Ashcraft and Santos (2009) who doucment that the safe firms
(i.e. firms with the smaller number for RATING) benefit whereas the risky
firms (i.e. firms with the larger number for RATING) are penalized from
CDS trading.
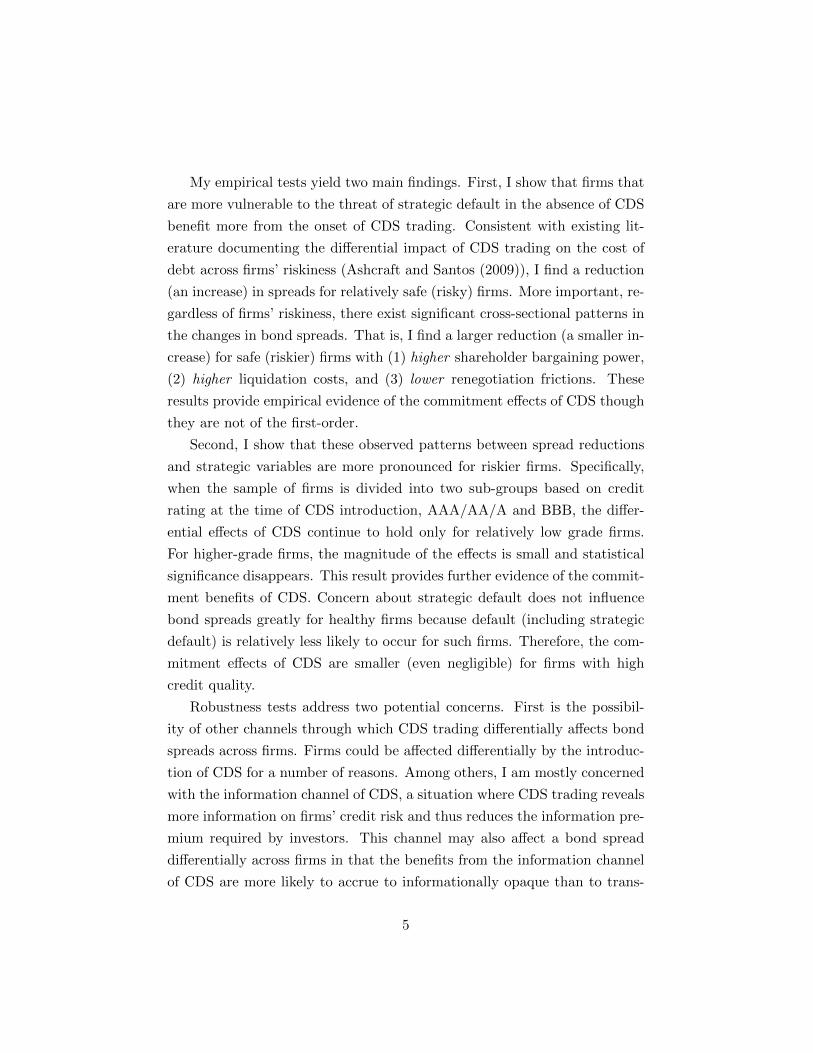
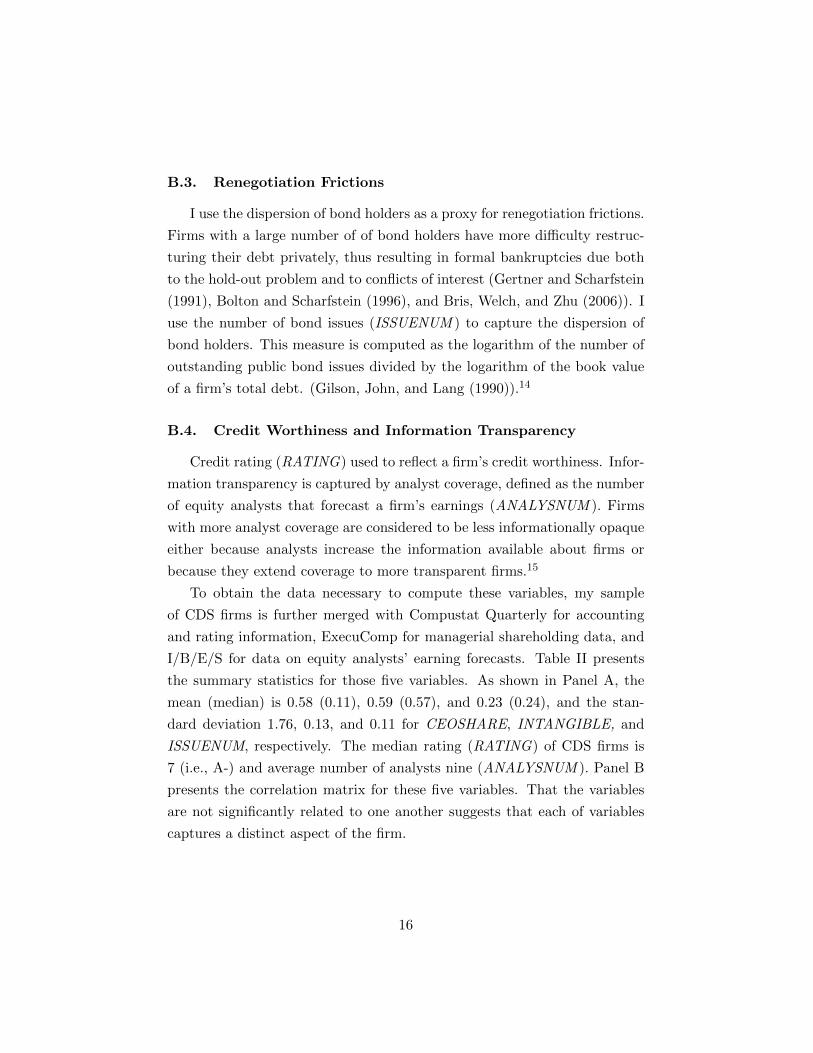
To interprete estimated coefficients more clearly, I plot the impact of
CDS trading on bond spreads across strategic variables spread reductions
following the onset of CDS trading across the strategic variable for safe
and riskier firms separately in Figure 3.19 There is one figure for each
variable (CEOSHARE in the top, INTANGIBLE in the middle, ISSUENUM
in the bottom panel). The curved line represents the cross-sectional CDF
(Cumulative Distribution Function) of each variable. The solid (dotted)
straight line plots spread reductions following the onset of CDS trading
for safe (riskier) firms. Figure 3 reveals two important patterns. First,
regardless of the value of strategic variables the spreads decline (increase)
after CDS trading for safe (riskier) firms. Second, firms with high strategic
20

incentives benefit whether safe or riskier in that their spreads experience a
larger reduction (a smaller increase) for safe (riskier firms).
B. The Effect of Firm Riskiness
In this section, I examine the effect of firm riskiness on the CDS im-
pact presented in the last section. In other words, I test how the relations
between spread reductions and strategic variables revealed by the earlier
analyses depend on the firm’s riskiness proxied by credit ratings. I investi-
gate this problem in two ways. First, I run the separate regression shown in
equation (18) for two sub-group of firms, namely, those rated A- and higher,
and those rated BBB+ or lower.20 Second, I include in the earlier regression
the HighGrade dummy, which equals one if the firm rating is A or above,
and zero otherwise. For each regression specification, I multiply this dummy
by proxies for the variables of my interest, i.e., TRADING×STRATV AR.
The results of the regression for the sub-group of firms are presented in
Table VIII. To conserve space, I report only the coefficients of the variables
of interest for the two most conservative specifications.21 Regardless of the
strategic proxies, the coefficients on TRADING × STRATV AR remain
highly significant for low-grade firms (Panel A) while the coefficients for
high-grade firms in Panel B lose their statistical significance. Moreover, the
magnitude of coefficients is much smaller for high-grade firms. In Panel
A, for instance, the coefficient on CEOSHARE in specification (6) (-9.2)
suggests that a one-standard deviation increase in CEOSHARE for this
group of low-grade firms (2.43) is associated with a reduction of 24 bps.
For high-grade firms in Panel B, the coefficient (-1.1) indicates that a one-
standard deviation increase (1.02) is associated with only a 1 bps reduction.
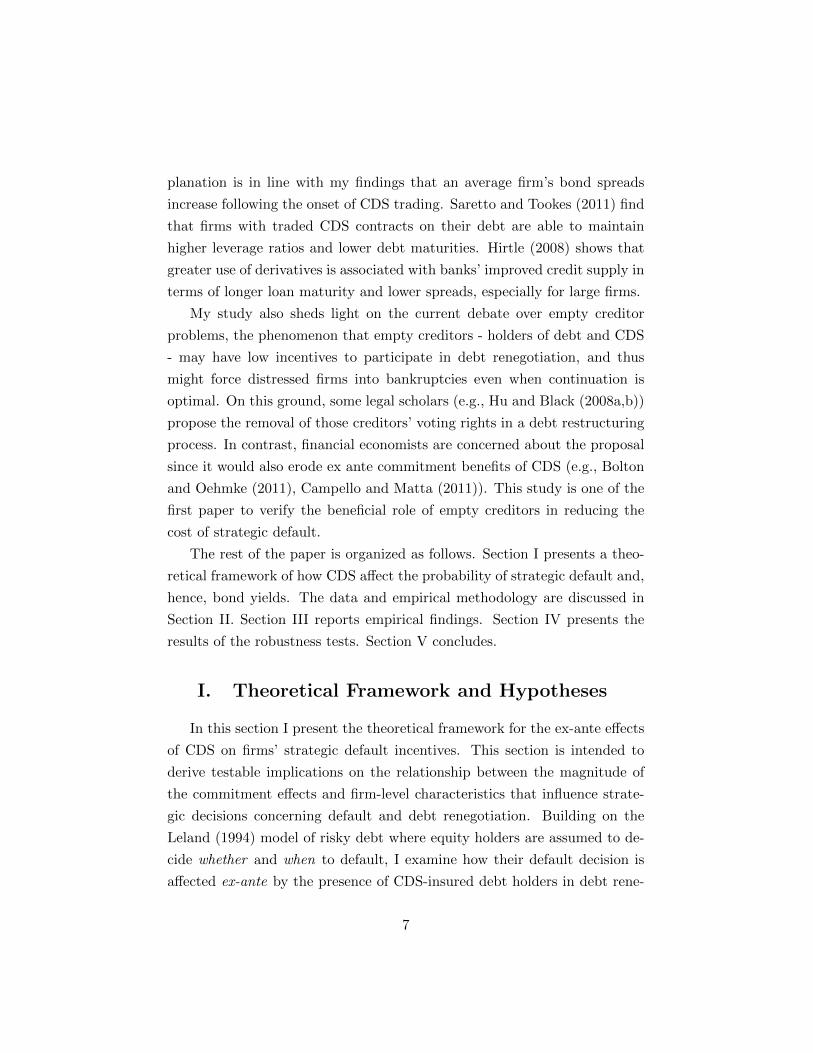
Table IX shows the results of the regression with dummy variables in-
dicating different rating category. Like in Table VIII, only variables of in-
terest are reported for the two most conservative specifications. For all
strategic proxies, the differential effect of CDS trading across the proxies is
pronounced for lower ratings. Moreover, the values of the coefficient sug-
gest that while the CDS impact may be considerble for low-grade firms, for
21

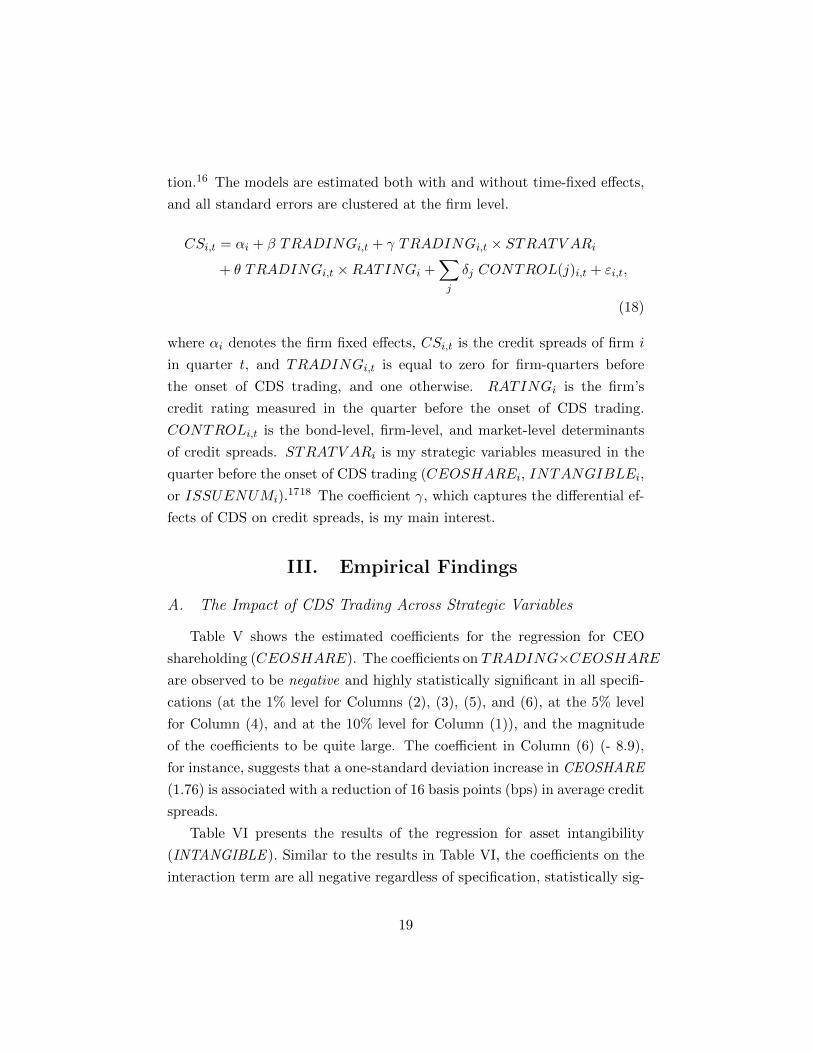
high-grade firms it is likely to be smaller in magnitude. For example, the
coefficient for TRADING × CEOSHARE in specification (6) is -10.8 for
the low-grade sub-sample, but only -0.9 for higher-grade firms. This pattern
id clearly shown in Figure 4 in which I use the coefficients from the specifi-
cation (6) in Table IX and plot the sensitivity of bond spread reduction to
strategic variables.
Overall, these results are consistent with my hypothesis (H2) that the
relations between a reduction in bond yield spreads and strategic variables
weaken (are pronounced) for safe (riskier) firms.
IV. Robustness
So far, my results establish that whether the firm faces the prospect of
debt renegotiation favorable to shareholders has important effects on the
bond spread changes after the onset of CDS trading. In this section, I
evaluate the robustness of my results to (1) the possiblity of other channels
of CDS trading, (2) the endogeneity of CDS trading, and (3) alternative
strategic proxies.
A. Alternative Channel of CDS Trading
One might argue that the results presented thus far could be driven by
other possible channels of CDS trading that may also affect a bond spread
differentially across firms. In this section, I investigate whether my earlier
findings are robust to accounting for such channels. I am mostly concerned
with three channels that have been explored in the past literature.
The first, termed the hedging or diversification channel, describes the
situation in which firms with CDS could give investors a new (inexpensive)
way to hedge their credit risk exposure, as investors would require a lower
risk premium than the bonds of firms without CDS.22 This channel could
also differentially affect firms’ credit spreads inasmuch as one would expect
riskier firms to be more likely than safer firms to benefit from the hedging
role of the CDS market. If the hedging channel exists (i.e., if the effects of
22

CDS on spreads vary with firms’ riskiness), and if the renegotiation proxies
to some extent capture firm risk, I need to account for this channel. How-
ever, hedging channel is unlikely to be behind my findings because Panel
C in Table II provides counterevidence that the strategic variable, overall,
exhibits little correlation with firm ratings. Moreover, I control for firm
riskiness (i.e. CEOSHARE ×RATING) in the model.
The second alternative channel, the information channel, reflects the po-
tential for CDS to reveal more information about firms credit risk by facil-
itating price discovery.23 This channel may benefit informationally opaque
firms more than transparent firms. If there were significant differences in
information opacity across firms with different shareholder advantages or
renegotiation frictions, it would be difficult to tease out the debt renegotia-
tion channel from the information channel.
To investigate the possibility that information channel might confound
my earlier results, I first examine whether my strategic variables are signif-
icantly related to the variable that can capture firms’ informational trans-
parency. In order for the information variable to drive my results, it shoud
be expected to be highly correlated with both. Panel C in Table II shows
that my strategic variables (except for CEOSHARE) are not significantly
correlated with ANALYSNUM. To further migigate the concern, I exam-
ine whether the differential effects of CDS on a bond’s yield spread across
the renegotiation proxy are subsumed by differential effects across the in-
formation variable. I do this by adding one additional interaction vari-
able, TRADING × ANALY SNUM , to my original regression in equa-
tion (18). This term enables me to differentiate between transparent and
opaque, firms, respectively. As can be seen in Table X, the coefficients on
TRADING × STRATV AR barely change in terms of sign or magnitude,
and continue to be highly statistically significant regardless which proxy is
adopted. This result suggests that information channel is unlikely to be
driving my earlier findings.
Another possibility is the monitoring channel for which CDS reduce
banks’ incentive to monitor the firm ex-post by giving them a new mech-
anism to lay off their credit exposure. As argued in Ashcraft and Santos
23

(2009), the device that lead banks use to commit to ex post monitoring –
holding a share of the loan at origination – loses some of its effectiveness
for fims with trading CDS since it becomes easier for banks to buy credit
protection for these firms. Anticipating this effect, syndicate participants
may demand higher compensation to extend loans to these fims. Further,
this effect is likely to go beyond the loan market since bondholders appear
to free-ride on bank monitoring. In order for this channle to confound my
results, there shoud exist monotonic relationship between firms’ strategic
incentives and the extent to which monitoring is vaulable for firms. As far
as I am aware of, however, there is no such a priori reason for the relation-
ship. Thus, the monitoring channel of CDS is less likely to explain away my
results.
B. Endogeneity of CDS Trading
Another potential concern with respect to my analysis thus far is the
possibility that the onset of CDS trading is endogenously determined. To
mitigate the potential impact of endogeneity, I perform a matched sample
analysis as follows.24 I first construct a sample of non-CDS firms closely
matched to my CDS firms based on several dimensions of firm characteristics
likely to predict CDS trading. I then use this sample in the analysis as a
control group. My basic assumption is that, conditional on the matching,
the timing of the onset of CDS trading is random for firms in the combined
sample. The detailed procedure is explained below.
Following Mayhew and Mihov (2004) and Ashcraft and Santos (2009),
I estimate the ex-ante probability of the onset of CDS trading for each
firm each quarter using a probit model in which the dependent variable is
a dummy variable that takes the value one if CDS begins to trade in the
current quarter and zero otherwise,25 and explanatory variables include firm
characteristics considered likely to predict CDS trading.26 I then choose for
each quarter non-CDS firms that match CDS firms as closely as possible in
terms of the estimated probability of CDS trading. Lastly, provided they
have bond information available, I assign to each matched firm a counter-
24

factual date (i.e., quarter) for the onset of CDS trading.
The probit regression results are reported in Panel A of Table XI, whcih
shows that CDS trading is more likely for firms with lower ratings, firms with
higher equity volatility, and firms with lower dispersion of analysts’ earning
forecasts.27 I use these estiamted coefficients to compute the propensity
scores and select firms that have not traded CDS but are closely matched
to traded firms in terms of the scores. I identify by means of this procedure
55 matched firms from the sample of non-CDS firms. Panel B presents the
descriptive statistics of both traded and matched sample.
For the combined sample of both traded and matched firms (i.e., a total
of 191 firms), I re-estimate the regression model in equation (18) and report
the results. As shown in Table XII, the coefficients on the three renegotiation
proxies remain statistically significant for most cases even after adding the
matched firms to my original sample.
C. Alternative Strategic Proxies
One can argue that my strategic variables are noisy proxies for the firms’
strategic default incentives and hence, my inferences mainly based on these
variables may be spurious. To mitigate this concern and corroborate the
earlier results, I employ additional variables for each category of strategic
proxies. Since it is difficult to find a perfect proxy for bargaining power
and the literature does not identify a definite proxy for it, I follow Davy-
denko and Strebulaev (2007) and use CEO’s tenure with the firm as an
additional proxy. When the CEO is entrenched and has high firm-specific
human capital, measured by her longer tenure, she may be in a better po-
sition to bargain on behalf of shareholders. I employ the ratio of nonfixed
assets and the proportion of short-term debt to proxy for liquidation costs
and renegotiation frictions, resepctively. In unreported tables, they show
the similar patterns to the original variables though less significant.28
25
V. Conclusion
In this paper, I provide the theoretical and empirical analysis of ex ante
commitment benefits of CDS. First, I develop a model by extending a styl-
ized model of strategic debt service, which allow me to relate the changes
in a bond’s yield spreads due to the presence of CDS to (1) shareholder
bargaining advantages in renegotiation and (2) renegotiation frictions. I use
two variables to caputre shareholder advantages, namely the conentration
of equity owership (proxied by CEO shareholding) and the firm’s liquida-
tion costs (proxied by asset intangibility). The dispersion of bond holders
(proxied by the number of public bond issues) is used to reflect renegotiation
frictions that the firm faces.
To test my predictions, I employ the secondary market prices of corpo-
rate bonds of U.S. investment-grade firms that initiated CDS trading betwen
2001 and 2008, and compare a bond’s yield spreads between pre- and post-
CDS trading. My analysis shows that while an average firm experiences a
slight increase in spreads following the onset of CDS trading, firms whose
creditors are highly vulnerable to shareholders’ strategic defaults in the ab-
sence of CDS enjoy a significant benefits from a reduction in spreads. In
particular, the greater benefit accurues to those firms with high shareholder
bargaining power and firms with less renegotiation frictions. Furthermore,
these relations weaken among safe firms that are not likely to undergo debt
renegotiation.
This paper provides the first empirical evidence on the beneficial role
of CDS and empty creditors. Much of the news media and existing law
literature has focused on the negative impact of them and hence, how to
regualte the CDS markets accordingly. For instance, legal scholars propose
to remove the voting rights of empty creditors in the debt restructuring
process. My results imply that it would also erode the commitment benefits
of them. More broadly, my findings support the novel view on the economic
role of CDS markets as a commitment devices: by giving more credibility
to borrowers’ commitment to repay debt, CDS contributes to a reduction in
the cost of corporate debt.
26
REFERENCES
Acharya, V., and T. Johnson, 2007, Insider trading in credit derivatives,
Journal of Financial Economics 84, 110–141.
Almeida, H., and M. Campello, 2007, Financial constraints, asset tangibility,
and corporate investment, Review of Financial Studies 20, 1429–1460.
Ashcraft, A. B., and J. A.C. Santos, 2009, Has the cds market lowered the
cost of corporate debt?, Journal of Monetary Economics 56, 514–523.
Berger, P., E. Ofek, and I. Swary, 1996, Investor valuation and the aban-
donment option, Journal of Financial Economics 42, 257–287.
Betker, B. L., 1995, Management’s incentives, equity’s bargaining power,
and deviations from absolute priority in chapter 11 bankruptcies, Journal
of Business 68, 161–183.
Bhushan, R., 1989, Firm characteristics and analyst following, Journal of
Accounting and Economics 11, 255–275.
BIS, 2010, BIS Credit Risk Transfer Statistics (Bank of International Set-
tlements).
Blanco, R., S. Brennan, and I. M. Marsh, 2005, An empirical analysis of
the dynamic relation between investment-grade bonds and credit default
swaps, Journal of Finance 60, 2255–2281.
Bolton, P., and M. Oehmke, 2011, Credit default swaps and the empty
creditor problem, Review of Financial Studies 12.
27

Bolton, P., and D. Scharfstein, 1990, A theory of predation based on agency
problems in financial contracting, American Economic Review 80, 93–106.
Bolton, P., and D. Scharfstein, 1996, Optimal debt structure and the number
of creditors, Journal of Political Economy 104, 1–25.
Bris, A., I. Welch, and N. Zhu, 2006, The costs of bankruptcy: Chapter 7
liquidations vs. chapter 11 reorganizations, Journal of Finance 61.
Campello, M., and R. Matta, 2011, Credit default swaps, firm financing and
the economy, Working Paper, UIUC.
Chang, X., S. Dasgupta, and G. Hilary, 2006, Analyst coverage and financing
decision, Journal of Finance 61, 3009–3048.
Davydenko, S. A., and I. A. Strebulaev, 2007, Strategic actions and credit
spreads: An empirical investigation, Journal of Finance LXII.
Dixit, A., and R. Pindyck, 1994, Investment under uncertainty, Princeton
University Press, Princeton, NJ .
Downing, C., S. Underwood, and Y. Xing, 2005, Is liquidity risk priced in
the corporate bond market?, Working Paper, Rice University.
Duffie, D., 2007, Innovations in credit risk transfe: Implications for financial
stability, Working Paper, Stanford University.
Fan, H., and S. M. Sundaresan, 2000, Debt valuation, renegotiation, and
optimal dividend policy, Review of Financial Studies 13, 1057–1099.
28
Favara, G., E. Schroth, and P. Valta, 2011, Strategic default and equity risk
across countries, Journal of Finance forthcoming.
Francis, J., and L. Soffer, 1997, The relative informativeness of analysts stock
recommendations and earnings forecasts revisions, Journal of Accounting
Research 35, 193–212.
Garlappi, L., T. Shu, and H. Yan, 2008, Default risk, shareholder advantage,
and stock returns, Review of Financial Studies 21, 2743–2778.
Gertner, R., and D. Scharfstein, 1991, A theory of workouts and the effects
of reorganization law, Journal of Finance 46, 1189–1222.
Gilson, S. C., K. John, and L. H. Lang, 1990, Troubled debt restructuring:
An empirical study of private reorganization of firms in default, Journal
of Financial Economics 27, 315–353.
Han, B., and Y. Zhou, 2011, Term structure of credit default swap spreads
and cross-section of stock returns, Working Paper, University of Texas at
Austin.
Hart, O. D., and J. Moore, 1994, A theory of debt based on inalienability
of human capital, Quarterly Journal of Economics 109, 841–879.
Hart, O. D., and J. Moore, 1998, Default and renegotiation: A dynamic
model of debt, Quarterly Journal of Economics 113, 1–41.
Hirtle, B., 2008, Credit derivatives and bank credit supply, Federal Reserve
Bank of New York Staff Report .
29
Hong, H., T. Lim, and J. Stein, 2000, Bad news travels slowly: size, an-
alyst coverage, and the profitability of momentum strategies, Journal of
Finance 55, 265–295.
Hu, H. T. C., and B. Black, 2008a, Debt, equity, and hybrid decoupling:
Governance and systemic risk implications, European Financial Manage-
ment 14, 663–709.
Hu, H. T. C., and B. Black, 2008b, Equity and debt decoupling and empty
voting ii: Importance and extensions, University of Pennsylvania Law
Review 156, 625–739.
Hull, J., M. Predescu, and A. White, 2004, Relationship between credit de-
fault swap spreads, bond yields, and credit rating announcements, Journal
of Banking and Finance 28, 2789–2811.
Leland, H., 1994, Corporate debt value, bond covenants, and optimal capital
structure, Journal of Finance, 49, 1213–1252.
Mayhew, S., and V. Mihov, 2004, How do exchanges select stocks for option
lisitng?, Journal of Finance 59, 447–471.
Nejadmalayeri, A., and M. Singh, 2011, Corporate taxes, strategic default,
and the cost of debt, Journal of Banking & Finance .
Ni, S., and J. Pan, 2011, Trading puts and cds on stocks with short sale
ban, Working Paper, MIT.
Norden, L., and W. Wagner, 2008, Credit derivatives and loan pricing, Jour-
nal of Banking and Finance 32, 2560–2569.
30

Norden, L., and M. Weber, 2004, The comovement of credit default swap,
bond and stock markets: An empirical analysis, CFS Working paper 55,
University of Mannheim.
Rosenbaum, P. R., and D. B. Rubin, 1983, The central role of the propensity
score in observational studies for causal effects, Biometrika 70, 41–55.
Saretto, A., and H. Tookes, 2011, Corporate leverage, debt maturity and
credit supply: the role of credit default swaps, Working Paper, Yale Uni-
versity.
Valta, P., 2008, Strategic behavior, financing, and stock returns, Working
Paper, HEC Paris.
Zhang, A. J., 2011, Distress risk premia in expected stock and bond returns,
Journal of Banking & Finance .
31
Notes
1Only under particular CDS restructuring clauses (i.e., modified restruc-
turing (Mod-R) for U.S. contracts, and modified-modified restructuring (Mod-
Mod-R) for European contracts) does debt restructuring formally constitute
a credit event. Even for those contracts, in practice there is often significant
uncertainty for creditors whether a particular restructuring qualifies. For
example. no debt restructuring in the U.S. corporate segment has ever trig-
gered a credit event, given the general disagreement about what constitutes
a restructuring event.
2The assumption that a creditor exogenously chooses the face value of
debt as a CDS amount is made for simplicity. The fact that the amount of
CDS may be endogenously chosen, and can be either lower or higher, does
not alter the model’s main predictions.
3The assumption that renegotiation does not trigger CDS payment is
consistent with market practice.
4This can be seen more clearly by taking partial derivatives of ∆PCDSR
in equation (6) with respect to η, α, and q, respectively.
5This can be seen clearly by taking the partial derivatives of∣∣∣∂∆PCDS
R∂η
∣∣∣ , ∣∣∣∂∆PCDSR∂α
∣∣∣ , and ∣∣∣∂∆PCDSR∂q
∣∣∣with respect to PD in equation (6).
6Although CDS have existed since the early 1990s, the CDS market grew
rapidly and became liquid in this later period.
7Markit aggregates from major CDS dealers daily quotes of CDS prices
for firms with CDS trading. Markit is used as a benchmark source of CDS
pricing because its coverage is quite broad and it currently provides CDS
32

spread information for most corporations with nontrivial CDS trading.
8TRACE was established in 2002 by the Financial Industry Regulatory
Authority (FINRA), formerly NASD, to disseminate secondary over-the-
counter (OTC) corporate bonds transactions on behalf of members. TRACE
first recorded bond transactions on July 1, 2002. Today, it includes all trades
in the secondary OTC markets for corporate bonds save some small retail
trades on NYSE. TRACE includes, among other information, transaction
dates and prices. A comprehensive description of the TRACE database is
given in Downing, Underwood, and Xing (2005).
9NAIC, an alternative to the no-longer available Lehman fixed income
database on corporate bonds used in previous studies, covers approximately
25%-40% of total over-the-counter secondary corporate bond transactions
by American life, health, property and casualty insurance companies since
1994.
10For firms with multiple candidates of bond issues, I use one representa-
tive bond per firm to mitigate potential bias (were all available bonds per
firm used in the analysis, the results might over represent larger companies
with large numbers of bond issues, which could introduce bias inasmuch as
my test focuses on credit spreads at the firm-, rather than trade- or bond-,
level).
11My breakdown of firms is similar to that of Ashcraft and Santos (2009),
who employ the same CDS database (Markit).
12Davydenko and Strebulaev (2007), Valta (2008) and Nejadmalayeri and
Singh (2011) also use CEO shareholding as a proxy for shareholder bargain-
ing power.
33

13This asset intangibility measure is also employed to measure liquidation
cost in Garlappi, Shu, and Yan (2008), Valta (2008), Favara, Schroth, and
Valta (2011), and Zhang (2011).
14The same measure of renegotiation friction is used in Davydenko and
Strebulaev (2007) and Nejadmalayeri and Singh (2011).
15Bhushan (1989), Francis and Soffer (1997),Hong, Lim, and Stein (2000),
Chang, Dasgupta, and Hilary (2006).
16I use only within-firm (rather than between-firm) information to control
for omitted variables that differ between CDS firms.
17Note that the role of the STRATV AR variable in the interactions with
TRADING is to differentiate firms according to their value at the onset of
CDS trading. In this specification, STRATV ARi is hence time-invariant,
whereas TRADINGi,t is time-varying. Specifically, the interaction term
TRADINGi,t×STRATV ARi takes zero for all the quarters of firm i before
CDS trading begins and 1×(the value of firm i’s STRATV AR at the time of
CDS introduction) for all quarters after CDS trading has begun. A similar
setup is also employed in Ashcraft and Santos (2009).
18The variable STRATV ARi, is not included in equation (18) because it
is time-invariant and, hence, subsumed in the time-fixed effect regressions.
19The graphs are drawn based on the estimated coefficients for specifica-
tion (6) in each Table
20I divide firms in this way in order to have a similar number of firms in
each group (A- is the median credit rating of the firms in my sample).
21The specifications in (3) and (6) in earlier tables include both firm and
bond controls.
34

22Duffie (2007) provides an extensive discussion of how CDS can lower
credit risk premia by offering investors a broader menu of assets and hedging.
Hirtle (2008) empirically shows that the use of credit derivatives enables
banks to offer firms credits with lower spreads.
23Acharya and Johnson (2007) provide empirical evidence that insider
trading exists in the CDS markets by documenting a significant and per-
manent information flow from CDS to equity markets; Norden and Wagner
(2008) find that CDS spreads predict subsequent monthly changes in ag-
gregate loan spreads; Hull, Predescu, and White (2004) show that the CDS
market anticipates credit rating events; and the superior informational ef-
ficiency in the CDS markets is documented in Norden and Weber (2004),
Blanco, Brennan, and Marsh (2005), Han and Zhou (2011), and Ni and Pan
(2011).
24The matching technique was first developed in the statistics literature
(e.g., Rosenbaum and Rubin (1983)) and has been widely applied in the
finance and economics literatures. Mayhew and Mihov (2004), for example,
in their study of the selection of stocks for option listing, match stocks that
are not selected for option listing to listed stocks, and Ashcraft and Santos
(2009) and Saretto and Tookes (2011) match non-CDS firms to CDS firms
based on various firm characteristics.
25I record only the first quarter of CDS trading, after which the firm-
quarters of a firm are dropped from the sample.
26I include as covariates equity volatility, profitability, firm size, credit
rating, leverage, industry, and dispersion of analysts’ earnings forecast, all
of which are lagged by one quarter to ensure that no outcome variable is
35

included as a regressor.
27It is worth noting that this estimation exercise is not intended for making
any causal inferences about CDS trading. My goal is to project relevant
firm characteristics on the probability of CDS trading and use them as the
matching dimension.
28Tables are available upon requests
36
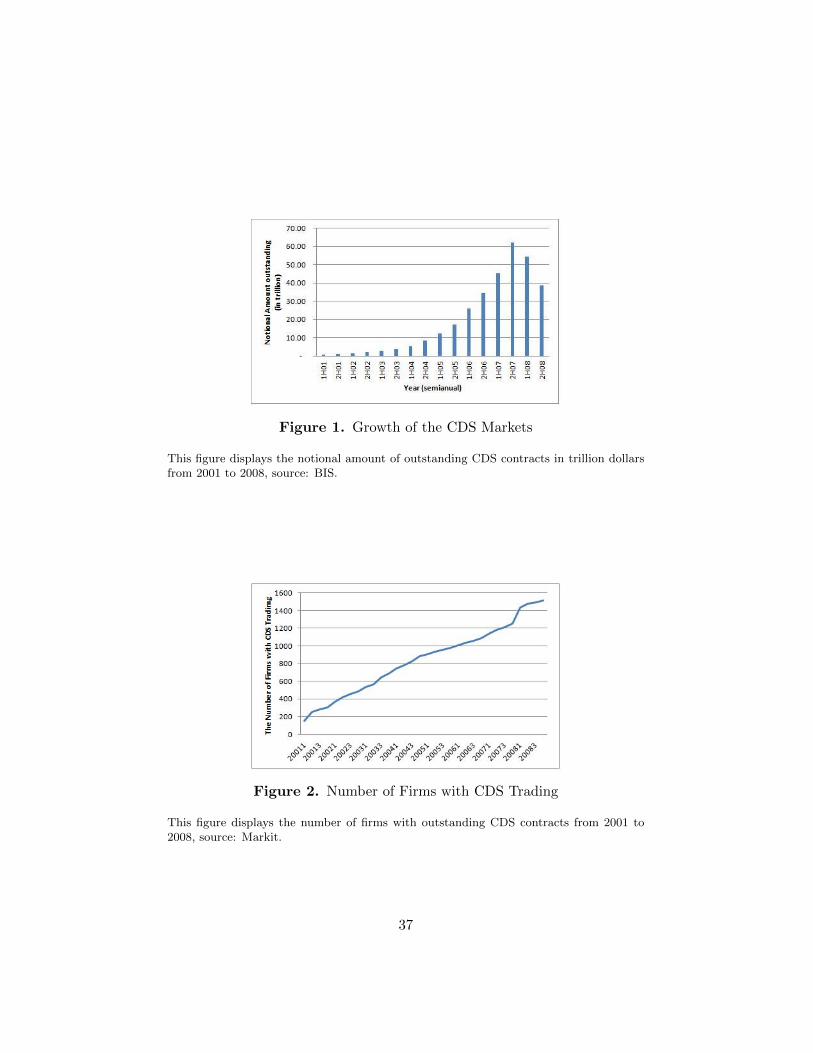
Figure 1. Growth of the CDS Markets
This figure displays the notional amount of outstanding CDS contracts in trillion dollarsfrom 2001 to 2008, source: BIS.
Figure 2. Number of Firms with CDS Trading
This figure displays the number of firms with outstanding CDS contracts from 2001 to2008, source: Markit.
37
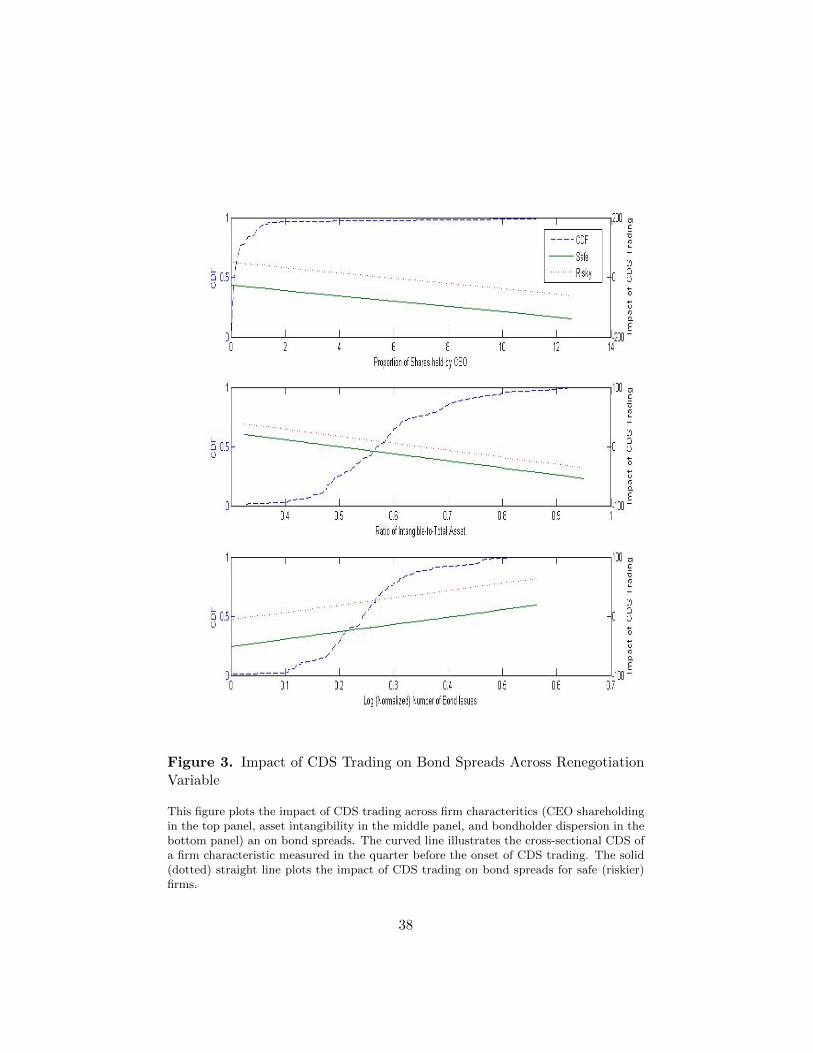
Figure 3. Impact of CDS Trading on Bond Spreads Across RenegotiationVariable
This figure plots the impact of CDS trading across firm characteritics (CEO shareholdingin the top panel, asset intangibility in the middle panel, and bondholder dispersion in thebottom panel) an on bond spreads. The curved line illustrates the cross-sectional CDS ofa firm characteristic measured in the quarter before the onset of CDS trading. The solid(dotted) straight line plots the impact of CDS trading on bond spreads for safe (riskier)firms.
38
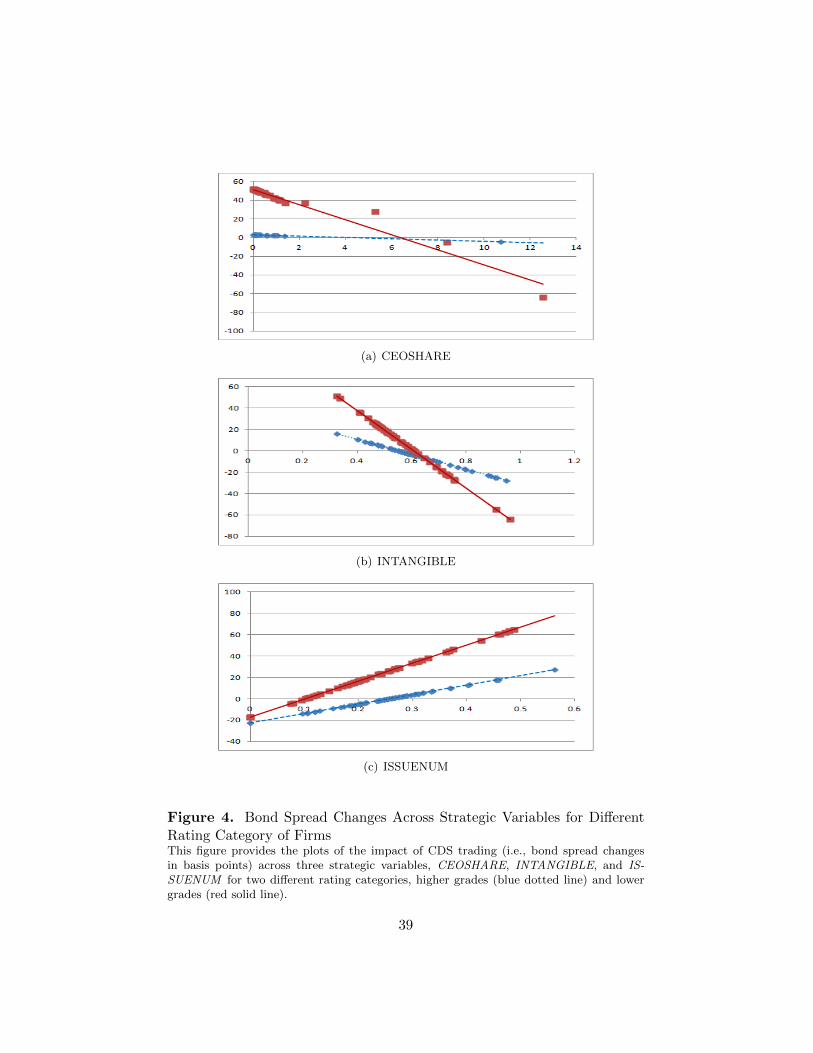
(a) CEOSHARE
(b) INTANGIBLE
(c) ISSUENUM
Figure 4. Bond Spread Changes Across Strategic Variables for DifferentRating Category of FirmsThis figure provides the plots of the impact of CDS trading (i.e., bond spread changesin basis points) across three strategic variables, CEOSHARE, INTANGIBLE, and IS-SUENUM for two different rating categories, higher grades (blue dotted line) and lowergrades (red solid line).
39

Table I: The Breakdown of the Number of Firms
This table reports descriptive statistics on the final sample of CDS firms used in my mainanalysis (i.e., firms that initiated CDS trading during the period 2001-2008). Panels A, B,and C present a breakdown of the number of firms by industry, rating, and year of onsetof CDS trading, respectively. For each panel, number and percentage of firms are reportedin the column of Freq. and Perc., respectively. The cumulative number and percentage offirms are reported in the columns of Cum. Freq. and Cum. Perc.. The industry to whicha firm belongs and its ratings are measured during the quarter its CDS trading begins.The onset of CDS trading is assumed to occur on the first date a U.S.-dollar-dominatedCDS contract is traded at a five-year maturity.
PANEL A: Number of Firms by Industry
Industry Freq. Perc. Cum. Freq. Cum. Perc.
Agriculture, Mining, and Construction 10 7.94 10 7.35Manufacturing 67 49.27 77 56.62Transportation, Communications, and Utilities 12 8.82 89 65.44Wholesale and Retail Trades 10 7.35 89 72.79Finance, Insurance, and Real Estate 32 23.53 131 96.32Services and Public Administration 5 1.47 136 100.00
PANEL B: Number of Firms by Rating
Rating Freq. Perc. Cum. Freq. Cum. Perc.
AAA 3 2.21 3 2.21AA 11 8.1 14 10.19A 60 44.11 74 54.41
BBB 62 45.59 136 100.00
PANEL C: Number of Firms by Year of Onset of CDS Trading
Year Freq. Perc. Cum. Freq. Cum. Perc.
2001 47 34.56 47 34.562002 40 29.41 87 63.972003 23 16.91 110 80.882004 11 8.09 121 88.972005 7 5.15 128 94.122006 2 1.47 130 95.592007 5 3.68 135 99.262008 1 0.74 136 100.00
40
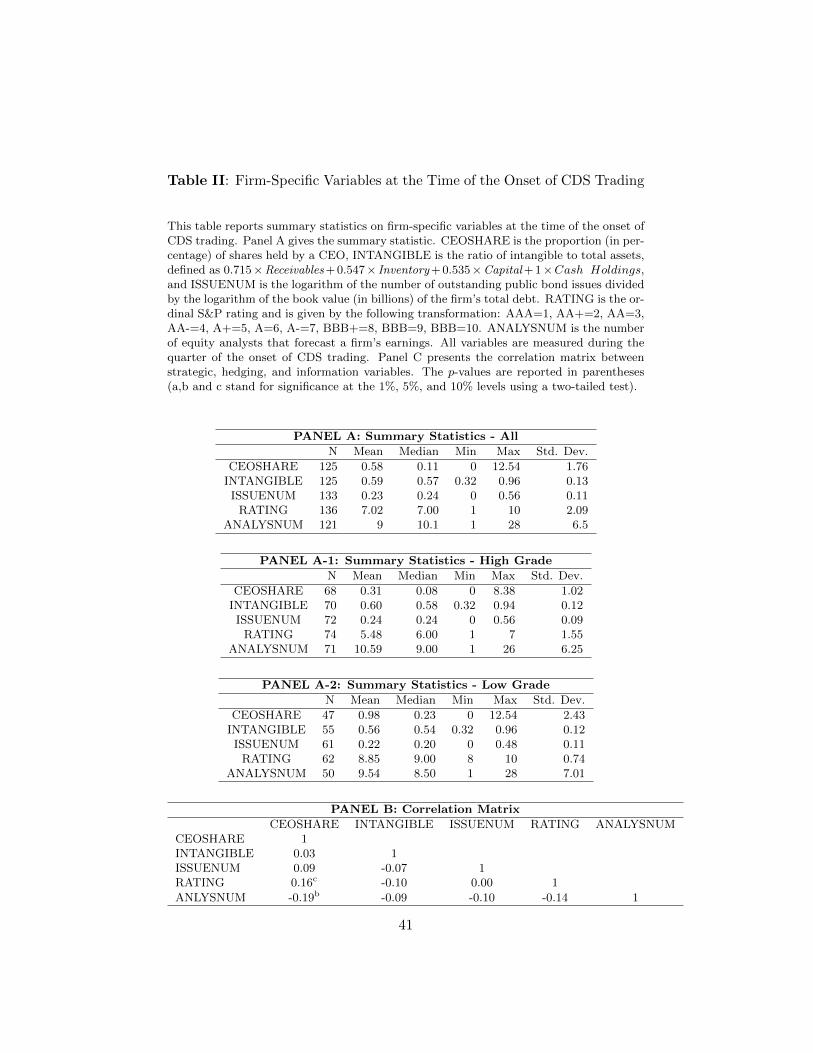
Table II: Firm-Specific Variables at the Time of the Onset of CDS Trading
This table reports summary statistics on firm-specific variables at the time of the onset ofCDS trading. Panel A gives the summary statistic. CEOSHARE is the proportion (in per-centage) of shares held by a CEO, INTANGIBLE is the ratio of intangible to total assets,defined as 0.715×Receivables + 0.547× Inventory + 0.535×Capital + 1×Cash Holdings,and ISSUENUM is the logarithm of the number of outstanding public bond issues dividedby the logarithm of the book value (in billions) of the firm’s total debt. RATING is the or-dinal S&P rating and is given by the following transformation: AAA=1, AA+=2, AA=3,AA-=4, A+=5, A=6, A-=7, BBB+=8, BBB=9, BBB=10. ANALYSNUM is the numberof equity analysts that forecast a firm’s earnings. All variables are measured during thequarter of the onset of CDS trading. Panel C presents the correlation matrix betweenstrategic, hedging, and information variables. The p-values are reported in parentheses(a,b and c stand for significance at the 1%, 5%, and 10% levels using a two-tailed test).
PANEL A: Summary Statistics - All
N Mean Median Min Max Std. Dev.
CEOSHARE 125 0.58 0.11 0 12.54 1.76INTANGIBLE 125 0.59 0.57 0.32 0.96 0.13ISSUENUM 133 0.23 0.24 0 0.56 0.11
RATING 136 7.02 7.00 1 10 2.09ANALYSNUM 121 9 10.1 1 28 6.5
PANEL A-1: Summary Statistics - High Grade
N Mean Median Min Max Std. Dev.
CEOSHARE 68 0.31 0.08 0 8.38 1.02INTANGIBLE 70 0.60 0.58 0.32 0.94 0.12ISSUENUM 72 0.24 0.24 0 0.56 0.09
RATING 74 5.48 6.00 1 7 1.55ANALYSNUM 71 10.59 9.00 1 26 6.25
PANEL A-2: Summary Statistics - Low Grade
N Mean Median Min Max Std. Dev.
CEOSHARE 47 0.98 0.23 0 12.54 2.43INTANGIBLE 55 0.56 0.54 0.32 0.96 0.12ISSUENUM 61 0.22 0.20 0 0.48 0.11
RATING 62 8.85 9.00 8 10 0.74ANALYSNUM 50 9.54 8.50 1 28 7.01
PANEL B: Correlation Matrix
CEOSHARE INTANGIBLE ISSUENUM RATING ANALYSNUMCEOSHARE 1INTANGIBLE 0.03 1ISSUENUM 0.09 -0.07 1RATING 0.16c -0.10 0.00 1
ANLYSNUM -0.19b -0.09 -0.10 -0.14 1
41
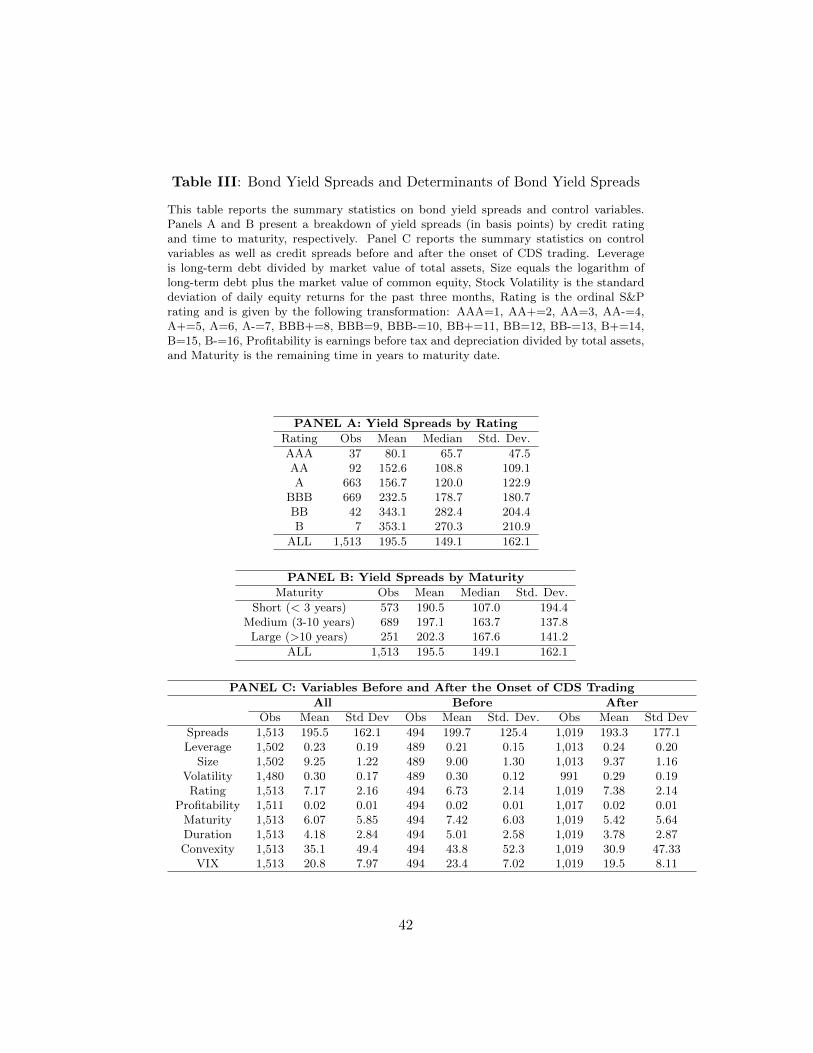
Table III: Bond Yield Spreads and Determinants of Bond Yield Spreads
This table reports the summary statistics on bond yield spreads and control variables.Panels A and B present a breakdown of yield spreads (in basis points) by credit ratingand time to maturity, respectively. Panel C reports the summary statistics on controlvariables as well as credit spreads before and after the onset of CDS trading. Leverageis long-term debt divided by market value of total assets, Size equals the logarithm oflong-term debt plus the market value of common equity, Stock Volatility is the standarddeviation of daily equity returns for the past three months, Rating is the ordinal S&Prating and is given by the following transformation: AAA=1, AA+=2, AA=3, AA-=4,A+=5, A=6, A-=7, BBB+=8, BBB=9, BBB-=10, BB+=11, BB=12, BB-=13, B+=14,B=15, B-=16, Profitability is earnings before tax and depreciation divided by total assets,and Maturity is the remaining time in years to maturity date.
PANEL A: Yield Spreads by Rating
Rating Obs Mean Median Std. Dev.
AAA 37 80.1 65.7 47.5AA 92 152.6 108.8 109.1A 663 156.7 120.0 122.9
BBB 669 232.5 178.7 180.7BB 42 343.1 282.4 204.4B 7 353.1 270.3 210.9
ALL 1,513 195.5 149.1 162.1
PANEL B: Yield Spreads by Maturity
Maturity Obs Mean Median Std. Dev.
Short (< 3 years) 573 190.5 107.0 194.4Medium (3-10 years) 689 197.1 163.7 137.8
Large (>10 years) 251 202.3 167.6 141.2
ALL 1,513 195.5 149.1 162.1
PANEL C: Variables Before and After the Onset of CDS Trading
All Before AfterObs Mean Std Dev Obs Mean Std. Dev. Obs Mean Std Dev
Spreads 1,513 195.5 162.1 494 199.7 125.4 1,019 193.3 177.1Leverage 1,502 0.23 0.19 489 0.21 0.15 1,013 0.24 0.20
Size 1,502 9.25 1.22 489 9.00 1.30 1,013 9.37 1.16Volatility 1,480 0.30 0.17 489 0.30 0.12 991 0.29 0.19Rating 1,513 7.17 2.16 494 6.73 2.14 1,019 7.38 2.14
Profitability 1,511 0.02 0.01 494 0.02 0.01 1,017 0.02 0.01Maturity 1,513 6.07 5.85 494 7.42 6.03 1,019 5.42 5.64Duration 1,513 4.18 2.84 494 5.01 2.58 1,019 3.78 2.87Convexity 1,513 35.1 49.4 494 43.8 52.3 1,019 30.9 47.33
VIX 1,513 20.8 7.97 494 23.4 7.02 1,019 19.5 8.11
42

Table
IV:
Var
iab
leD
escr
ipti
ons
This
table
des
crib
esall
the
vari
able
suse
din
the
empir
ical
analy
sis.
CR
SP
isth
eU
niv
ersi
tyof
Chic
ago’s
Cen
ter
of
Res
earc
hin
Sec
uri
tyP
rice
sdata
base
s.C
om
pust
at
isSta
ndard
&P
oor’
sC
om
pust
at
data
base
.E
xec
uco
mp
isSta
ndard
&P
oor’
sE
xec
uco
mp
Data
base
on
exec
uti
ve
com
pen
sati
on.
FIS
Dis
the
Fix
edIn
ves
tmen
tSec
uri
ties
Data
base
pro
vid
edby
Mer
gen
t.M
ark
itis
the
CD
SP
rici
ng
data
base
pro
vid
edby
Mark
it.
CB
OE
isth
eC
hic
ago
Board
Opti
ons
Exch
ange.
Abbre
viation
NameofVariable
Variable
Description
Data
Sourc
e
CS
Cre
dit
Spre
ads
The
yie
ld-t
o-m
atu
rity
of
the
bond
inbasi
sp
oin
tsle
ssth
eT
reasu
ryyie
ldof
the
sam
em
atu
rity
.T
RA
CE
/N
AIC
TR
AD
ING
CD
SD
um
my
Adum
my
vari
able
that
takes
the
valu
eone
for
bond
transa
ctio
ns
aft
erth
eonse
tof
CD
Str
adin
g.
Mark
it
CE
OS
HA
RE
CE
OShare
hold
ing
Per
centa
ge
of
tota
leq
uit
yow
ned
by
the
CE
Om
easu
red
duri
ng
the
quart
erth
efirm
’sC
DS
tradin
gb
egin
s.E
xec
uC
om
p
INT
AN
GIB
LE
Inta
ngib
leA
sset
The
rati
oof
inta
ngib
leass
ets
toto
tal
ass
ets
mea
sure
dduri
ng
the
quart
erth
efirm
’sC
DS
tradin
gb
egin
s.C
om
pust
at
ISS
UE
NU
MN
orm
.N
o.
Issu
esL
og(N
um
ber
of
Bond
Issu
es)
div
ided
by
log(t
ota
lD
ebt)
mea
sure
dduri
ng
the
quart
erth
efirm
’sC
DS
tradin
gb
egin
s.F
ISD
&C
om
pust
at
AN
AL
YS
NU
MN
um
ber
of
Equit
yA
naly
stN
um
ber
of
equit
yanaly
stes
tim
ate
sof
earn
ings
mea
sure
dduri
ng
the
quart
erth
efirm
’sC
DS
tradin
gb
egin
s.C
om
pust
at
LE
VE
RA
GE
Fir
mL
ever
age
Long-t
erm
deb
tdiv
ided
by
mark
etva
lue
of
tota
lass
ets.
Com
pust
at
SIZ
EF
irm
Siz
eL
og
(long
term
deb
tplu
sm
ark
etva
lue
of
com
mon
equit
y).
Com
pust
at
RA
TIN
GF
irm
Cre
dit
Rati
ng
The
ord
inal
S&
Pra
ting
isgiv
enby
the
follow
ing
transf
orm
ati
on:
AA
A=
1,
AA
+=
2,
AA
=3,
AA
-=4,
A+
=5,
A=
6,
A-=
7,
BB
B+
=8,
BB
B=
9,
BB
B-=
10,
BB
+=
11,
BB
=12,
BB
-=13,
B+
=14,
B=
15,
B-=
16.
Com
pust
at
ST
OC
KV
OL
AT
ILIT
YE
quit
yV
ola
tility
Std
.dev
.of
daily
equit
yre
turn
sfo
rth
epast
thre
em
onth
s.C
RSP
PR
OF
ITO
per
ati
ng
Pro
fita
bilit
yE
arn
ings
bef
ore
tax
and
dep
reci
ati
on
div
ided
by
tota
lass
ets.
MA
TU
RIT
YT
ime
toM
atu
rity
Rem
ain
ing
tim
ein
yea
rsto
matu
rity
date
.F
ISD
DU
RA
TIO
ND
ura
tion
Maca
ula
yb
ond
dura
tion
inyea
rs.
FIS
D,
TR
AC
E,
NA
ICC
ON
VE
XIT
YC
onvex
ity
Bond
convex
ity
inyea
rs.
FIS
D,
TR
AC
E,
NA
ICV
IXV
ola
tility
Index
Aver
age
implied
vola
tility
of
eight
nea
r-th
e-m
oney
opti
ons
on
the
S&
Pin
dex
.C
BO
E
43
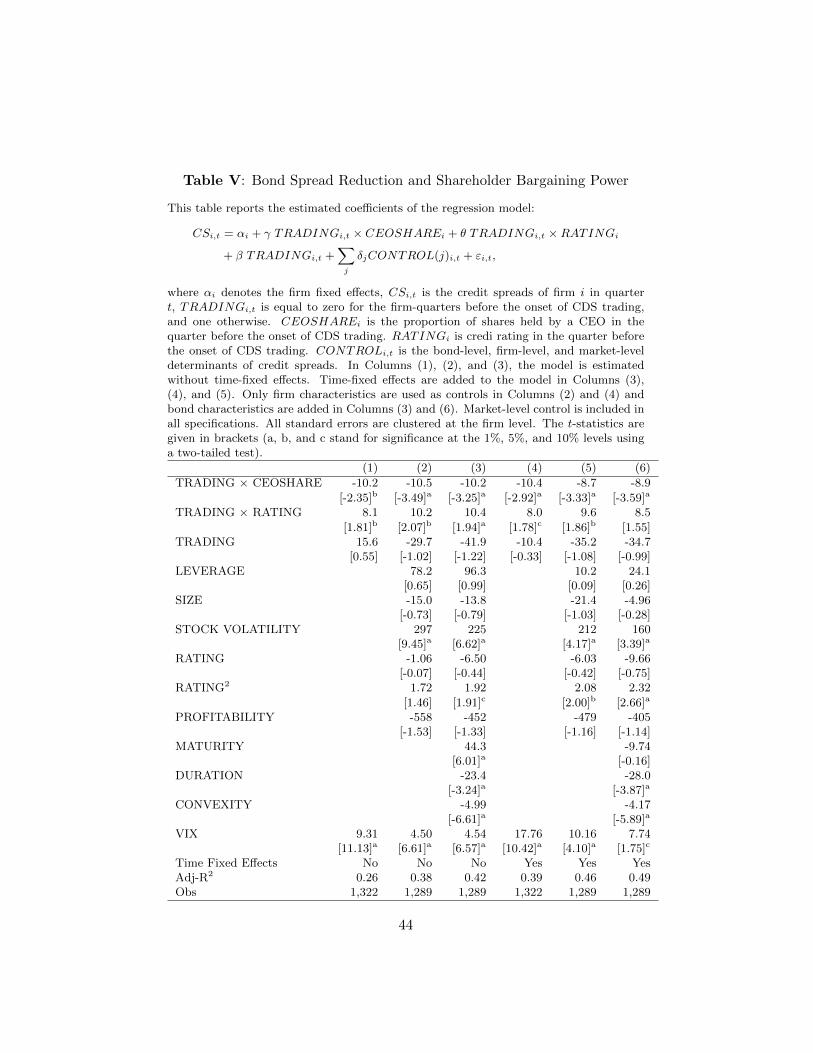
Table V: Bond Spread Reduction and Shareholder Bargaining Power
This table reports the estimated coefficients of the regression model:
CSi,t = αi + γ TRADINGi,t × CEOSHAREi + θ TRADINGi,t ×RATINGi
+ β TRADINGi,t +∑j
δjCONTROL(j)i,t + εi,t,
where αi denotes the firm fixed effects, CSi,t is the credit spreads of firm i in quartert, TRADINGi,t is equal to zero for the firm-quarters before the onset of CDS trading,and one otherwise. CEOSHAREi is the proportion of shares held by a CEO in thequarter before the onset of CDS trading. RATINGi is credi rating in the quarter beforethe onset of CDS trading. CONTROLi,t is the bond-level, firm-level, and market-leveldeterminants of credit spreads. In Columns (1), (2), and (3), the model is estimatedwithout time-fixed effects. Time-fixed effects are added to the model in Columns (3),(4), and (5). Only firm characteristics are used as controls in Columns (2) and (4) andbond characteristics are added in Columns (3) and (6). Market-level control is included inall specifications. All standard errors are clustered at the firm level. The t-statistics aregiven in brackets (a, b, and c stand for significance at the 1%, 5%, and 10% levels usinga two-tailed test).
(1) (2) (3) (4) (5) (6)
TRADING × CEOSHARE -10.2 -10.5 -10.2 -10.4 -8.7 -8.9
[-2.35]b [-3.49]a [-3.25]a [-2.92]a [-3.33]a [-3.59]a
TRADING × RATING 8.1 10.2 10.4 8.0 9.6 8.5
[1.81]b [2.07]b [1.94]a [1.78]c [1.86]b [1.55]TRADING 15.6 -29.7 -41.9 -10.4 -35.2 -34.7
[0.55] [-1.02] [-1.22] [-0.33] [-1.08] [-0.99]LEVERAGE 78.2 96.3 10.2 24.1
[0.65] [0.99] [0.09] [0.26]SIZE -15.0 -13.8 -21.4 -4.96
[-0.73] [-0.79] [-1.03] [-0.28]STOCK VOLATILITY 297 225 212 160
[9.45]a [6.62]a [4.17]a [3.39]a
RATING -1.06 -6.50 -6.03 -9.66[-0.07] [-0.44] [-0.42] [-0.75]
RATING2 1.72 1.92 2.08 2.32
[1.46] [1.91]c [2.00]b [2.66]a
PROFITABILITY -558 -452 -479 -405[-1.53] [-1.33] [-1.16] [-1.14]
MATURITY 44.3 -9.74[6.01]a [-0.16]
DURATION -23.4 -28.0[-3.24]a [-3.87]a
CONVEXITY -4.99 -4.17[-6.61]a [-5.89]a
VIX 9.31 4.50 4.54 17.76 10.16 7.74[11.13]a [6.61]a [6.57]a [10.42]a [4.10]a [1.75]c
Time Fixed Effects No No No Yes Yes YesAdj-R2 0.26 0.38 0.42 0.39 0.46 0.49Obs 1,322 1,289 1,289 1,322 1,289 1,289
44
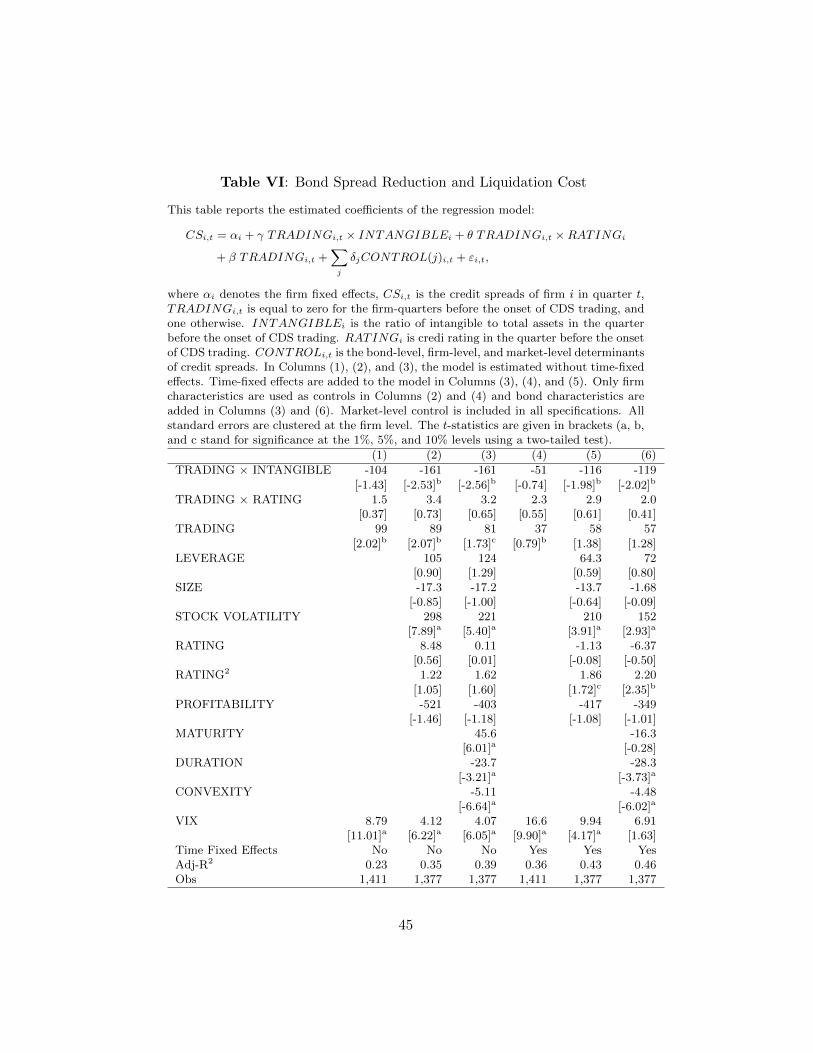
Table VI: Bond Spread Reduction and Liquidation Cost
This table reports the estimated coefficients of the regression model:
CSi,t = αi + γ TRADINGi,t × INTANGIBLEi + θ TRADINGi,t ×RATINGi
+ β TRADINGi,t +∑j
δjCONTROL(j)i,t + εi,t,
where αi denotes the firm fixed effects, CSi,t is the credit spreads of firm i in quarter t,TRADINGi,t is equal to zero for the firm-quarters before the onset of CDS trading, andone otherwise. INTANGIBLEi is the ratio of intangible to total assets in the quarterbefore the onset of CDS trading. RATINGi is credi rating in the quarter before the onsetof CDS trading. CONTROLi,t is the bond-level, firm-level, and market-level determinantsof credit spreads. In Columns (1), (2), and (3), the model is estimated without time-fixedeffects. Time-fixed effects are added to the model in Columns (3), (4), and (5). Only firmcharacteristics are used as controls in Columns (2) and (4) and bond characteristics areadded in Columns (3) and (6). Market-level control is included in all specifications. Allstandard errors are clustered at the firm level. The t-statistics are given in brackets (a, b,and c stand for significance at the 1%, 5%, and 10% levels using a two-tailed test).
(1) (2) (3) (4) (5) (6)
TRADING × INTANGIBLE -104 -161 -161 -51 -116 -119
[-1.43] [-2.53]b [-2.56]b [-0.74] [-1.98]b [-2.02]b
TRADING × RATING 1.5 3.4 3.2 2.3 2.9 2.0[0.37] [0.73] [0.65] [0.55] [0.61] [0.41]
TRADING 99 89 81 37 58 57
[2.02]b [2.07]b [1.73]c [0.79]b [1.38] [1.28]LEVERAGE 105 124 64.3 72
[0.90] [1.29] [0.59] [0.80]SIZE -17.3 -17.2 -13.7 -1.68
[-0.85] [-1.00] [-0.64] [-0.09]STOCK VOLATILITY 298 221 210 152
[7.89]a [5.40]a [3.91]a [2.93]a
RATING 8.48 0.11 -1.13 -6.37[0.56] [0.01] [-0.08] [-0.50]
RATING2 1.22 1.62 1.86 2.20
[1.05] [1.60] [1.72]c [2.35]b
PROFITABILITY -521 -403 -417 -349[-1.46] [-1.18] [-1.08] [-1.01]
MATURITY 45.6 -16.3[6.01]a [-0.28]
DURATION -23.7 -28.3[-3.21]a [-3.73]a
CONVEXITY -5.11 -4.48[-6.64]a [-6.02]a
VIX 8.79 4.12 4.07 16.6 9.94 6.91[11.01]a [6.22]a [6.05]a [9.90]a [4.17]a [1.63]
Time Fixed Effects No No No Yes Yes YesAdj-R2 0.23 0.35 0.39 0.36 0.43 0.46Obs 1,411 1,377 1,377 1,411 1,377 1,377
45
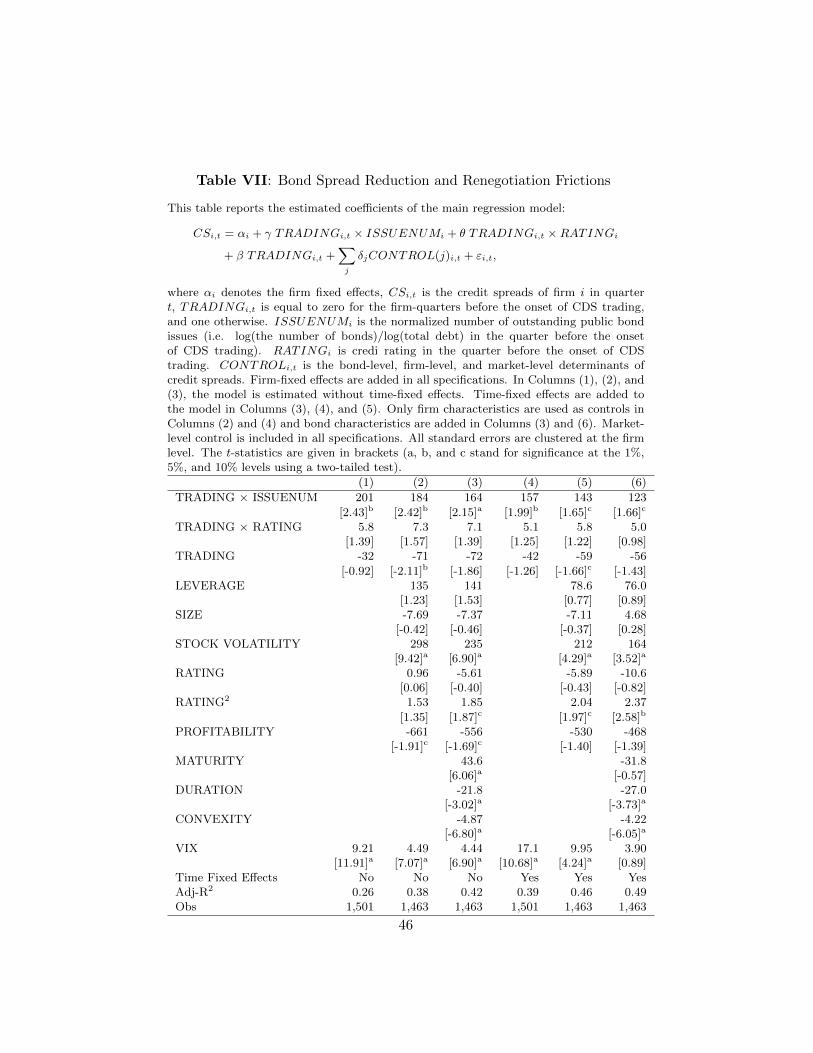
Table VII: Bond Spread Reduction and Renegotiation Frictions
This table reports the estimated coefficients of the main regression model:
CSi,t = αi + γ TRADINGi,t × ISSUENUMi + θ TRADINGi,t ×RATINGi
+ β TRADINGi,t +∑j
δjCONTROL(j)i,t + εi,t,
where αi denotes the firm fixed effects, CSi,t is the credit spreads of firm i in quartert, TRADINGi,t is equal to zero for the firm-quarters before the onset of CDS trading,and one otherwise. ISSUENUMi is the normalized number of outstanding public bondissues (i.e. log(the number of bonds)/log(total debt) in the quarter before the onsetof CDS trading). RATINGi is credi rating in the quarter before the onset of CDStrading. CONTROLi,t is the bond-level, firm-level, and market-level determinants ofcredit spreads. Firm-fixed effects are added in all specifications. In Columns (1), (2), and(3), the model is estimated without time-fixed effects. Time-fixed effects are added tothe model in Columns (3), (4), and (5). Only firm characteristics are used as controls inColumns (2) and (4) and bond characteristics are added in Columns (3) and (6). Market-level control is included in all specifications. All standard errors are clustered at the firmlevel. The t-statistics are given in brackets (a, b, and c stand for significance at the 1%,5%, and 10% levels using a two-tailed test).
(1) (2) (3) (4) (5) (6)
TRADING × ISSUENUM 201 184 164 157 143 123
[2.43]b [2.42]b [2.15]a [1.99]b [1.65]c [1.66]c
TRADING × RATING 5.8 7.3 7.1 5.1 5.8 5.0[1.39] [1.57] [1.39] [1.25] [1.22] [0.98]
TRADING -32 -71 -72 -42 -59 -56
[-0.92] [-2.11]b [-1.86] [-1.26] [-1.66]c [-1.43]LEVERAGE 135 141 78.6 76.0
[1.23] [1.53] [0.77] [0.89]SIZE -7.69 -7.37 -7.11 4.68
[-0.42] [-0.46] [-0.37] [0.28]STOCK VOLATILITY 298 235 212 164
[9.42]a [6.90]a [4.29]a [3.52]a
RATING 0.96 -5.61 -5.89 -10.6[0.06] [-0.40] [-0.43] [-0.82]
RATING2 1.53 1.85 2.04 2.37
[1.35] [1.87]c [1.97]c [2.58]b
PROFITABILITY -661 -556 -530 -468[-1.91]c [-1.69]c [-1.40] [-1.39]
MATURITY 43.6 -31.8[6.06]a [-0.57]
DURATION -21.8 -27.0[-3.02]a [-3.73]a
CONVEXITY -4.87 -4.22[-6.80]a [-6.05]a
VIX 9.21 4.49 4.44 17.1 9.95 3.90[11.91]a [7.07]a [6.90]a [10.68]a [4.24]a [0.89]
Time Fixed Effects No No No Yes Yes YesAdj-R2 0.26 0.38 0.42 0.39 0.46 0.49Obs 1,501 1,463 1,463 1,501 1,463 1,463
46
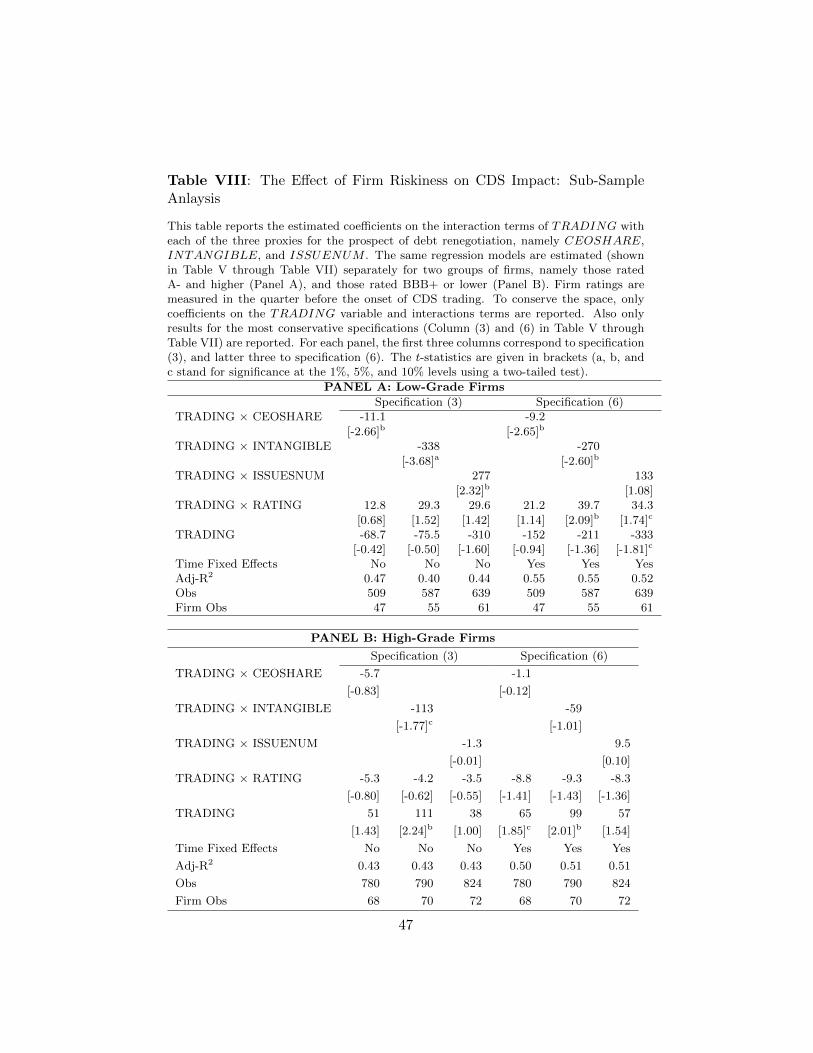
Table VIII: The Effect of Firm Riskiness on CDS Impact: Sub-SampleAnlaysis
This table reports the estimated coefficients on the interaction terms of TRADING witheach of the three proxies for the prospect of debt renegotiation, namely CEOSHARE,INTANGIBLE, and ISSUENUM . The same regression models are estimated (shownin Table V through Table VII) separately for two groups of firms, namely those ratedA- and higher (Panel A), and those rated BBB+ or lower (Panel B). Firm ratings aremeasured in the quarter before the onset of CDS trading. To conserve the space, onlycoefficients on the TRADING variable and interactions terms are reported. Also onlyresults for the most conservative specifications (Column (3) and (6) in Table V throughTable VII) are reported. For each panel, the first three columns correspond to specification(3), and latter three to specification (6). The t-statistics are given in brackets (a, b, andc stand for significance at the 1%, 5%, and 10% levels using a two-tailed test).
PANEL A: Low-Grade Firms
Specification (3) Specification (6)TRADING × CEOSHARE -11.1 -9.2
[-2.66]b [-2.65]b
TRADING × INTANGIBLE -338 -270
[-3.68]a [-2.60]b
TRADING × ISSUESNUM 277 133
[2.32]b [1.08]TRADING × RATING 12.8 29.3 29.6 21.2 39.7 34.3
[0.68] [1.52] [1.42] [1.14] [2.09]b [1.74]c
TRADING -68.7 -75.5 -310 -152 -211 -333[-0.42] [-0.50] [-1.60] [-0.94] [-1.36] [-1.81]c
Time Fixed Effects No No No Yes Yes YesAdj-R2 0.47 0.40 0.44 0.55 0.55 0.52Obs 509 587 639 509 587 639Firm Obs 47 55 61 47 55 61
PANEL B: High-Grade Firms
Specification (3) Specification (6)
TRADING × CEOSHARE -5.7 -1.1
[-0.83] [-0.12]
TRADING × INTANGIBLE -113 -59
[-1.77]c [-1.01]
TRADING × ISSUENUM -1.3 9.5
[-0.01] [0.10]
TRADING × RATING -5.3 -4.2 -3.5 -8.8 -9.3 -8.3
[-0.80] [-0.62] [-0.55] [-1.41] [-1.43] [-1.36]
TRADING 51 111 38 65 99 57
[1.43] [2.24]b [1.00] [1.85]c [2.01]b [1.54]
Time Fixed Effects No No No Yes Yes Yes
Adj-R2 0.43 0.43 0.43 0.50 0.51 0.51
Obs 780 790 824 780 790 824
Firm Obs 68 70 72 68 70 72
47
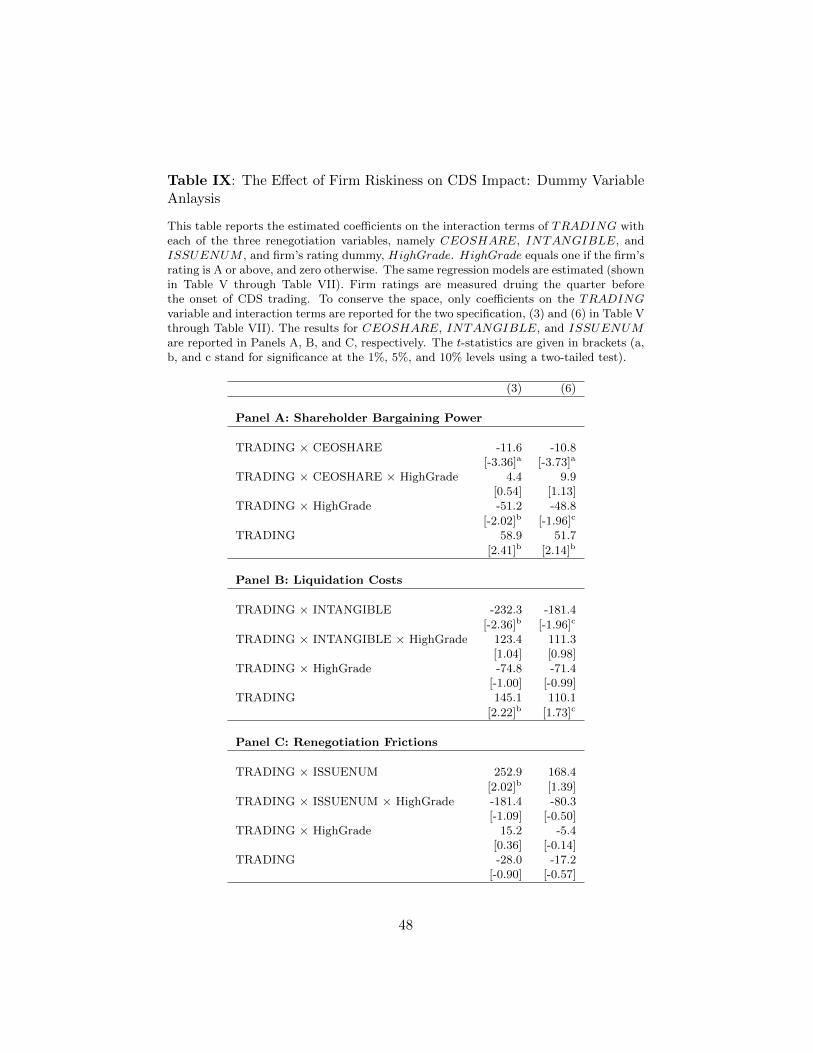
Table IX: The Effect of Firm Riskiness on CDS Impact: Dummy VariableAnlaysis
This table reports the estimated coefficients on the interaction terms of TRADING witheach of the three renegotiation variables, namely CEOSHARE, INTANGIBLE, andISSUENUM , and firm’s rating dummy, HighGrade. HighGrade equals one if the firm’srating is A or above, and zero otherwise. The same regression models are estimated (shownin Table V through Table VII). Firm ratings are measured druing the quarter beforethe onset of CDS trading. To conserve the space, only coefficients on the TRADINGvariable and interaction terms are reported for the two specification, (3) and (6) in Table Vthrough Table VII). The results for CEOSHARE, INTANGIBLE, and ISSUENUMare reported in Panels A, B, and C, respectively. The t-statistics are given in brackets (a,b, and c stand for significance at the 1%, 5%, and 10% levels using a two-tailed test).
(3) (6)
Panel A: Shareholder Bargaining Power
TRADING × CEOSHARE -11.6 -10.8[-3.36]a [-3.73]a
TRADING × CEOSHARE × HighGrade 4.4 9.9[0.54] [1.13]
TRADING × HighGrade -51.2 -48.8
[-2.02]b [-1.96]c
TRADING 58.9 51.7
[2.41]b [2.14]b
Panel B: Liquidation Costs
TRADING × INTANGIBLE -232.3 -181.4
[-2.36]b [-1.96]c
TRADING × INTANGIBLE × HighGrade 123.4 111.3[1.04] [0.98]
TRADING × HighGrade -74.8 -71.4[-1.00] [-0.99]
TRADING 145.1 110.1
[2.22]b [1.73]c
Panel C: Renegotiation Frictions
TRADING × ISSUENUM 252.9 168.4
[2.02]b [1.39]TRADING × ISSUENUM × HighGrade -181.4 -80.3
[-1.09] [-0.50]TRADING × HighGrade 15.2 -5.4
[0.36] [-0.14]TRADING -28.0 -17.2
[-0.90] [-0.57]
48
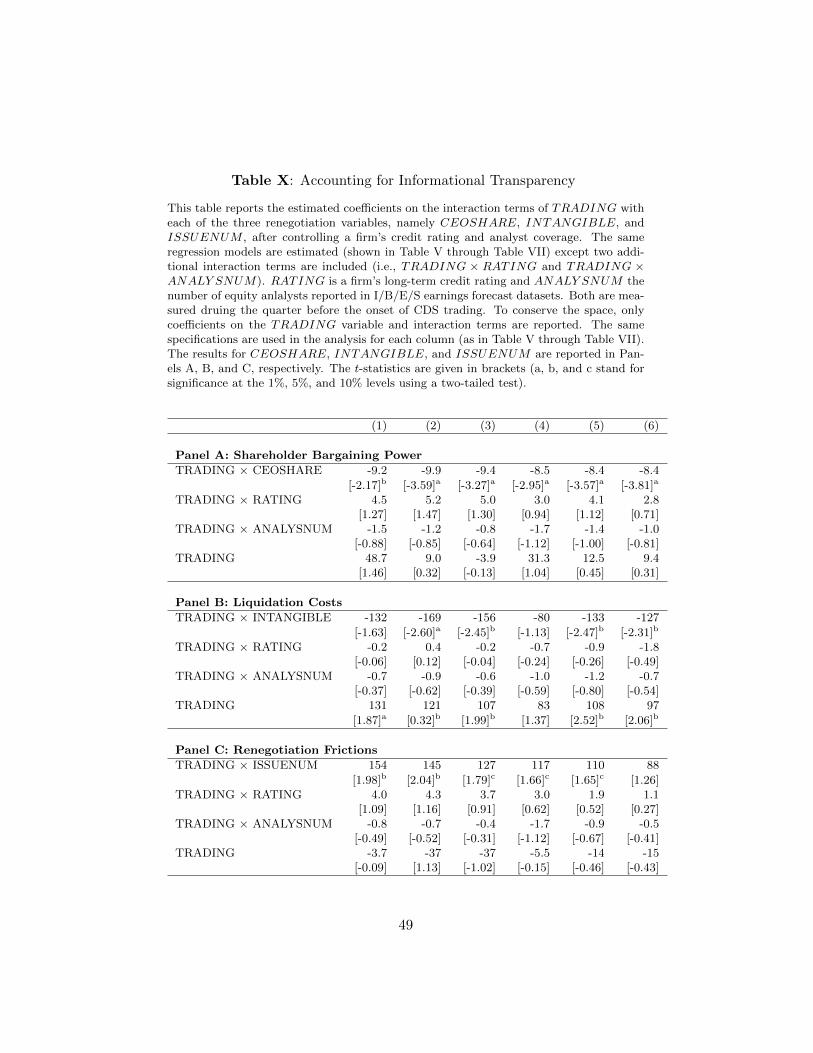
Table X: Accounting for Informational Transparency
This table reports the estimated coefficients on the interaction terms of TRADING witheach of the three renegotiation variables, namely CEOSHARE, INTANGIBLE, andISSUENUM , after controlling a firm’s credit rating and analyst coverage. The sameregression models are estimated (shown in Table V through Table VII) except two addi-tional interaction terms are included (i.e., TRADING × RATING and TRADING ×ANALY SNUM). RATING is a firm’s long-term credit rating and ANALY SNUM thenumber of equity anlalysts reported in I/B/E/S earnings forecast datasets. Both are mea-sured druing the quarter before the onset of CDS trading. To conserve the space, onlycoefficients on the TRADING variable and interaction terms are reported. The samespecifications are used in the analysis for each column (as in Table V through Table VII).The results for CEOSHARE, INTANGIBLE, and ISSUENUM are reported in Pan-els A, B, and C, respectively. The t-statistics are given in brackets (a, b, and c stand forsignificance at the 1%, 5%, and 10% levels using a two-tailed test).
(1) (2) (3) (4) (5) (6)
Panel A: Shareholder Bargaining Power
TRADING × CEOSHARE -9.2 -9.9 -9.4 -8.5 -8.4 -8.4
[-2.17]b [-3.59]a [-3.27]a [-2.95]a [-3.57]a [-3.81]a
TRADING × RATING 4.5 5.2 5.0 3.0 4.1 2.8[1.27] [1.47] [1.30] [0.94] [1.12] [0.71]
TRADING × ANALYSNUM -1.5 -1.2 -0.8 -1.7 -1.4 -1.0[-0.88] [-0.85] [-0.64] [-1.12] [-1.00] [-0.81]
TRADING 48.7 9.0 -3.9 31.3 12.5 9.4[1.46] [0.32] [-0.13] [1.04] [0.45] [0.31]
Panel B: Liquidation Costs
TRADING × INTANGIBLE -132 -169 -156 -80 -133 -127
[-1.63] [-2.60]a [-2.45]b [-1.13] [-2.47]b [-2.31]b
TRADING × RATING -0.2 0.4 -0.2 -0.7 -0.9 -1.8[-0.06] [0.12] [-0.04] [-0.24] [-0.26] [-0.49]
TRADING × ANALYSNUM -0.7 -0.9 -0.6 -1.0 -1.2 -0.7[-0.37] [-0.62] [-0.39] [-0.59] [-0.80] [-0.54]
TRADING 131 121 107 83 108 97
[1.87]a [0.32]b [1.99]b [1.37] [2.52]b [2.06]b
Panel C: Renegotiation Frictions
TRADING × ISSUENUM 154 145 127 117 110 88
[1.98]b [2.04]b [1.79]c [1.66]c [1.65]c [1.26]TRADING × RATING 4.0 4.3 3.7 3.0 1.9 1.1
[1.09] [1.16] [0.91] [0.62] [0.52] [0.27]TRADING × ANALYSNUM -0.8 -0.7 -0.4 -1.7 -0.9 -0.5
[-0.49] [-0.52] [-0.31] [-1.12] [-0.67] [-0.41]TRADING -3.7 -37 -37 -5.5 -14 -15
[-0.09] [1.13] [-1.02] [-0.15] [-0.46] [-0.43]
49
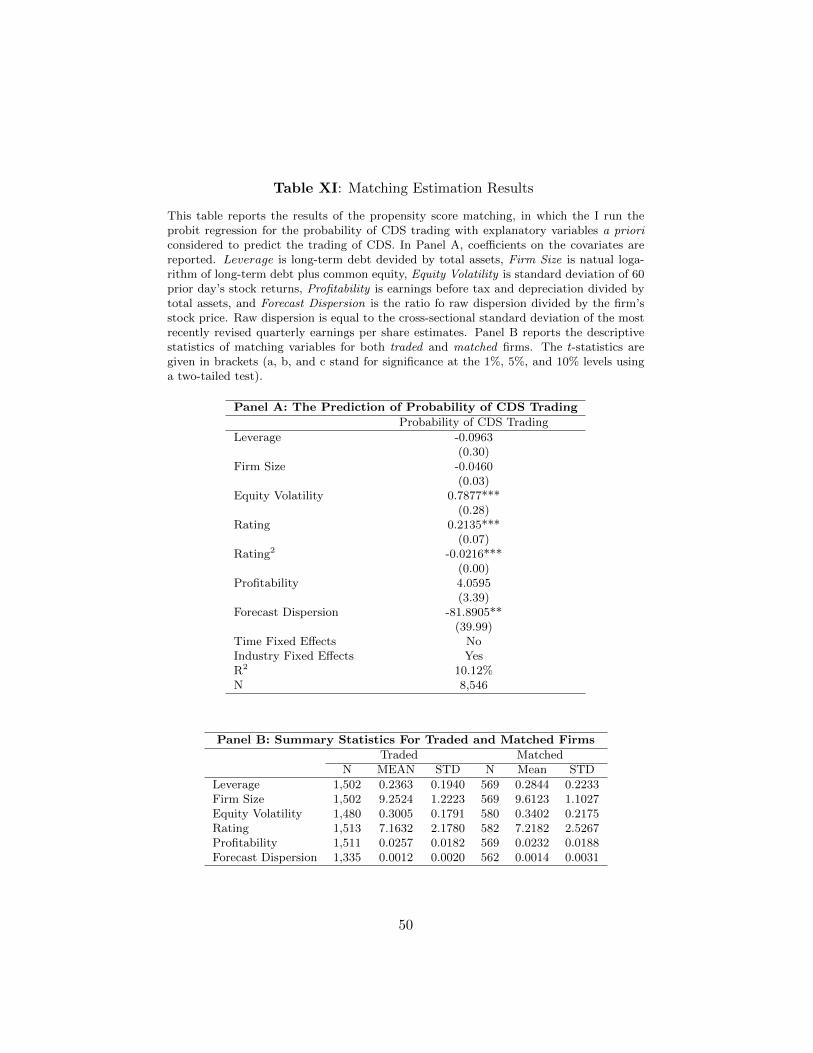
Table XI: Matching Estimation Results
This table reports the results of the propensity score matching, in which the I run theprobit regression for the probability of CDS trading with explanatory variables a prioriconsidered to predict the trading of CDS. In Panel A, coefficients on the covariates arereported. Leverage is long-term debt devided by total assets, Firm Size is natual loga-rithm of long-term debt plus common equity, Equity Volatility is standard deviation of 60prior day’s stock returns, Profitability is earnings before tax and depreciation divided bytotal assets, and Forecast Dispersion is the ratio fo raw dispersion divided by the firm’sstock price. Raw dispersion is equal to the cross-sectional standard deviation of the mostrecently revised quarterly earnings per share estimates. Panel B reports the descriptivestatistics of matching variables for both traded and matched firms. The t-statistics aregiven in brackets (a, b, and c stand for significance at the 1%, 5%, and 10% levels usinga two-tailed test).
Panel A: The Prediction of Probability of CDS Trading
Probability of CDS Trading
Leverage -0.0963(0.30)
Firm Size -0.0460(0.03)
Equity Volatility 0.7877***(0.28)
Rating 0.2135***(0.07)
Rating2 -0.0216***(0.00)
Profitability 4.0595(3.39)
Forecast Dispersion -81.8905**(39.99)
Time Fixed Effects NoIndustry Fixed Effects YesR2 10.12%N 8,546
Panel B: Summary Statistics For Traded and Matched Firms
Traded MatchedN MEAN STD N Mean STD
Leverage 1,502 0.2363 0.1940 569 0.2844 0.2233Firm Size 1,502 9.2524 1.2223 569 9.6123 1.1027Equity Volatility 1,480 0.3005 0.1791 580 0.3402 0.2175Rating 1,513 7.1632 2.1780 582 7.2182 2.5267Profitability 1,511 0.0257 0.0182 569 0.0232 0.0188Forecast Dispersion 1,335 0.0012 0.0020 562 0.0014 0.0031
50
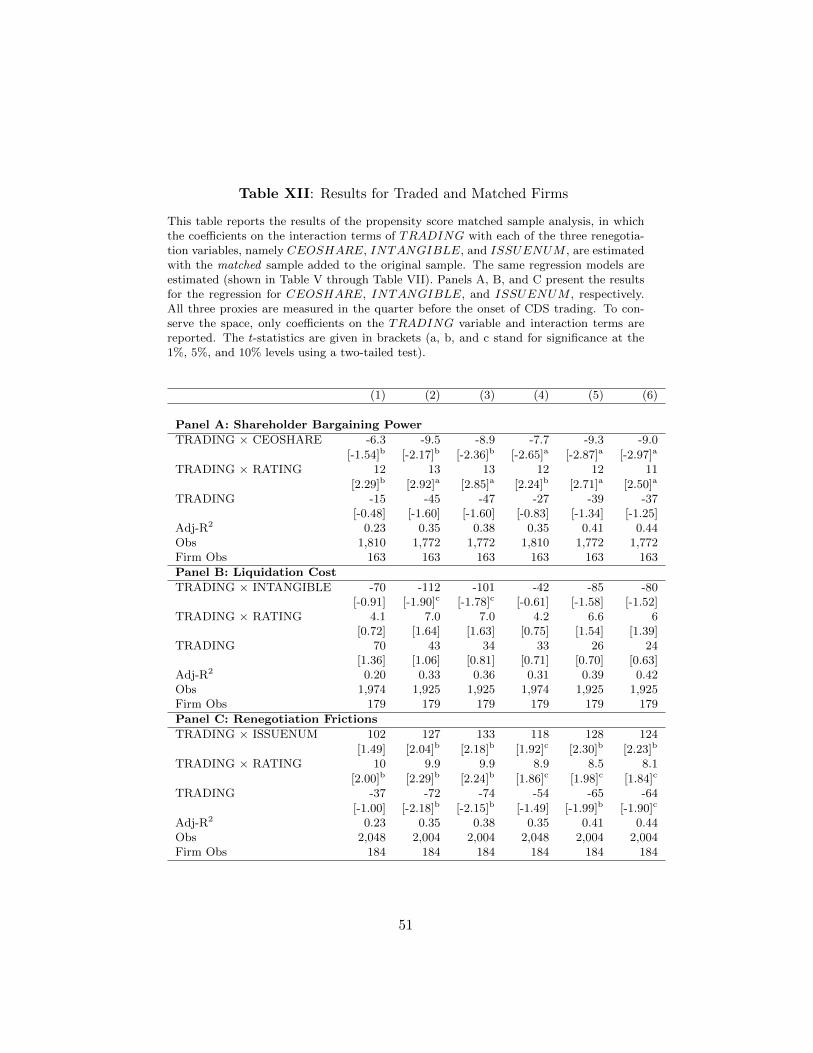
Table XII: Results for Traded and Matched Firms
This table reports the results of the propensity score matched sample analysis, in whichthe coefficients on the interaction terms of TRADING with each of the three renegotia-tion variables, namely CEOSHARE, INTANGIBLE, and ISSUENUM , are estimatedwith the matched sample added to the original sample. The same regression models areestimated (shown in Table V through Table VII). Panels A, B, and C present the resultsfor the regression for CEOSHARE, INTANGIBLE, and ISSUENUM , respectively.All three proxies are measured in the quarter before the onset of CDS trading. To con-serve the space, only coefficients on the TRADING variable and interaction terms arereported. The t-statistics are given in brackets (a, b, and c stand for significance at the1%, 5%, and 10% levels using a two-tailed test).
(1) (2) (3) (4) (5) (6)
Panel A: Shareholder Bargaining Power
TRADING × CEOSHARE -6.3 -9.5 -8.9 -7.7 -9.3 -9.0
[-1.54]b [-2.17]b [-2.36]b [-2.65]a [-2.87]a [-2.97]a
TRADING × RATING 12 13 13 12 12 11
[2.29]b [2.92]a [2.85]a [2.24]b [2.71]a [2.50]a
TRADING -15 -45 -47 -27 -39 -37[-0.48] [-1.60] [-1.60] [-0.83] [-1.34] [-1.25]
Adj-R2 0.23 0.35 0.38 0.35 0.41 0.44Obs 1,810 1,772 1,772 1,810 1,772 1,772Firm Obs 163 163 163 163 163 163
Panel B: Liquidation Cost
TRADING × INTANGIBLE -70 -112 -101 -42 -85 -80[-0.91] [-1.90]c [-1.78]c [-0.61] [-1.58] [-1.52]
TRADING × RATING 4.1 7.0 7.0 4.2 6.6 6[0.72] [1.64] [1.63] [0.75] [1.54] [1.39]
TRADING 70 43 34 33 26 24[1.36] [1.06] [0.81] [0.71] [0.70] [0.63]
Adj-R2 0.20 0.33 0.36 0.31 0.39 0.42Obs 1,974 1,925 1,925 1,974 1,925 1,925Firm Obs 179 179 179 179 179 179
Panel C: Renegotiation Frictions
TRADING × ISSUENUM 102 127 133 118 128 124
[1.49] [2.04]b [2.18]b [1.92]c [2.30]b [2.23]b
TRADING × RATING 10 9.9 9.9 8.9 8.5 8.1
[2.00]b [2.29]b [2.24]b [1.86]c [1.98]c [1.84]c
TRADING -37 -72 -74 -54 -65 -64
[-1.00] [-2.18]b [-2.15]b [-1.49] [-1.99]b [-1.90]c
Adj-R2 0.23 0.35 0.38 0.35 0.41 0.44Obs 2,048 2,004 2,004 2,048 2,004 2,004Firm Obs 184 184 184 184 184 184
51
Recommended


![Bloom Berg] Credit Default Swaps](https://img.pdfslide.us/doc/110x75/577d25391a28ab4e1e9e5000/bloom-berg-credit-default-swaps.jpg)