51
Counting or not counting recurring errors in translation quality evaluation Özlem Temizöz (PhD)
Abstract
Counting and not counting recurring errors are two different methods that
have been employed in translation quality evaluation without paying due
attention to how the difference between the results of each method, if any,
affects the quality score of the end product, thereby affecting the validity of the
quality evaluation method in question. This paper reports on a study which
shows that penalizing or not penalizing recurring errors in the target text
significantly affects the quality score. The results reveal a need for a more
critical approach in handling recurring errors in translation quality
evaluation.
Keywords
Translation quality evaluation, recurring errors, professional translation.
Introduction
Advances in technology affect not only the ways in which translators deal with texts but also
the content of the texts to be translated. In an era where localization activities constitute a
considerable share of the translation market, the content of the texts to be translated has
increasingly become more technical and repetitive (repetitive within the same document and
due to the frequent version updates). Therefore, the question of how to deal with recurring
errors in translation quality evaluation has also become an issue.
Although the evaluation of translation quality has received much attention by
translation scholars (Brunette 2000, Colina 2008, Hague et al. 2011, Hatim 1998, House 1997,
and Lauscher 2000), the question of how to approach recurring errors has not been touched
upon. Matters are not very different in the professional sphere where companies adopt
existing quality evaluation methods and models or develop their own methods and models. In
a study in which eleven translation quality evaluation models were benchmarked in order to
provide preliminary steps toward a dynamic quality evaluation model, O’Brien (2012: 10)
states that:
only three of the QE models give instructions on how to deal with recurring errors. In two cases,
the model specifically rules out the counting of repeated errors. In the third case, whether or not
an error is counted more than once depends on the nature of the error: if the error results from
translator negligence or lack of grammatical knowledge, the error is counted each time it occurs.
If, on the other hand, the error is not the fault of the translator (e.g. the term was not included in
the glossary), it is counted only once.
The present paper aims to shed light on how counting or not counting recurring errors
affects the quality score of the target text. The purpose here is neither to value one method
over another nor make a prescription for the translation industry on which method to use, but
Intercultural Studies Group, Universitat Rovira i Virgili, Tarragona, Spain;
School of Foreign Languages, Kocaeli University, Turkey.
52
rather to raise awareness of the effects of counting or not counting recurring errors in
translation quality evaluation.
Background
The experiment to be reported here was primarily designed to compare the quality scores of
professional translators and engineers when they postedited a technical text (Temizöz 2013).
However, during data analysis, we realized that some of the participants failed to correct or
erroneously postedited some technical terms which recurred throughout the text. Therefore,
we had to decide whether to count these errors in the target text only once and disregard the
recurrent versions or count them each time they occurred throughout the text. A survey of the
literature on translation and postediting quality evaluation for the relevant practices did not
identify any studies that focused on how to deal with recurring errors in translation and
postediting quality evaluation (except for O’Brien 2012: 10, see quotation above). The present
study is intended as a step in that direction.
Methodology
Method
A 482-word technical text was pre-translated with Google Translate from English into
Turkish; it was then postedited by ten engineers and ten professional translators in their usual
work places, using their own computers. Task instructions and a brief for postediting were
made available to the participants via electronic mail. They had access to the Internet and on-
line dictionaries during the postediting task; however, they were not allowed to use any
translation memories. They were asked to make any changes they wanted to introduce on the
MT output provided for them, rather than creating a separate target text. They were asked to
work at their usual pace and in one sitting without interruptions. At the end of the experiment,
post-assignment questionnaires were given to the participants to gather data on their profiles
and their perception of the process.
The quality of the target texts was analyzed using LISA QA Model 3.1. Before
conducting the main study, a pilot study was carried out with two subject-matter experts and
two professional translators in order to test the methodology and detect possible flaws in the
design.
Quality Analysis Procedure
In the quality analysis procedure, I compared the postedited target texts with a reference
translation of the test text from English into Turkish made in cooperation between a
professional translator (with a PhD in Translation and ten years of experience in the
profession) and a mechanical engineer (with a TOEIC score of 900 out of 990 and ten years of
experience in engineering at an international automotive company).
Because each posteditor or translator might translate the same text differently (even
the same translator may translate the same text in slightly different ways at different times),
when determining errors in the postedited texts, we did not look for exactly the same words or
expressions that were used in the reference translation; however, since the test text was a
technical text and not open to interpretations, the postediting did not yield translation choices
that were very different from those of the reference translation.
LISA QA Model 3.1 was used as a tool for measuring quality. The minimum
acceptable level of quality was set as 75 percent. The errors were determined and categorized
in line with the LISA error categories of severity, Minor, Major and Critical.
The quality percentage in the LISA interface was 100 by default. As the errors were
entered, the interface registered it, calculated the error point, and the quality percentage
53
diminished from 100 in line with this error point. When the quality percentage reached a point
below 75, which was the minimum level of acceptable quality, the interface labeled the
postediting/translation ‘Fail’, although the reviewer could go on reviewing the text. Any level
of quality between 100 and 75 percent was labeled “Pass.” After the review was completed,
the review data, which contained error distribution, error points and quality percentages of
each participant, could be exported using the ‘Project Review Report’ option.
Two different types of data were used to measure postediting quality. First, the
distribution of the translators’ and engineers’ errors was listed and compared in the Excel
files. Second, both groups’ error points and quality percentages obtained from LISA QA
Model 3.1 interface were compared.
Material
Test Text The text was on dismantling end-of-life vehicles. It was taken from the International
Dismantling Information System (IDIS) which contains technical instructions suitable for
translating with an MT system. Although we are aware that repetitiveness is among the
characteristics of technical texts, it was not a deliberate decision to choose a source text with
repeated terms. As explained in the “Background” section above, when it was conducted, it
was not among the primary aims of the study to establish what would happen to the target text
quality score under the recurring errors penalized and not penalized conditions.
Participants The engineers were graduates of various engineering departments, and they had
been working at various international automotive companies in Turkey for at least three years.
They had Turkish as their mother tongue, and they were proficient in English. However, they
had received no training in Translation. Owing to the international composition of their
companies, they had had to work in a multilingual atmosphere which had made translation an
indispensable and a natural component of their work.
The professional translators were freelancers with translation experience of at least
three years. As with the engineers, Turkish was the translators’ mother tongue, and English
was their primary foreign language. They did not have formal qualifications or experience in
engineering. They usually translated texts on social sciences and education and some of them
translated literary, academic and legal texts as well. One of them translated medical texts in
addition to literary texts. Although not very often, some of the translators did technical
translation. They worked full-time in the translation market and principally made a living
from translation.
Findings
In the pilot study, we had four participants: two engineers and two translators. When we
completed the quality analysis in the pilot study, we found that there was a gap between the
postediting quality of the participants within each group. Further analysis showed that this
difference resulted from the failure to correct the same terms recurring throughout the text -
terms that were incorrectly translated by the MT system. This raised the question whether to
count or disregard recurring errors in the quality analysis. Due to the recurrent nature of the
errors, the number of errors, and thus the quality of the posteditings as measured by LISA QA
Model 3.1, might have changed when we penalized or did not penalize recurring errors.
This led us to approach the quality analysis in two ways. First, we carried out the
quality analysis by taking into consideration the recurring errors. Second, we conducted the
quality analysis by disregarding them. For the former analysis, we counted each error each
time it occurred throughout the text. For the latter, we counted each error only once and
disregarded the recurrent versions of the same error.
54
Below, the results of both types of quality analysis are presented.
Quality in Postediting - Recurring Errors Not Penalized versus Penalized
We present engineers’ and translators’ data comparatively. However, the emphasis will be on
the comparison of each group with itself under both conditions (recurrent errors not penalized
or penalized) in order to establish how not penalizing or penalizing the recurrent errors affects
the results. [The comparison of the postediting quality of engineers and professional
translators, under the recurring errors penalized condition, was presented in Temizöz (2016)].
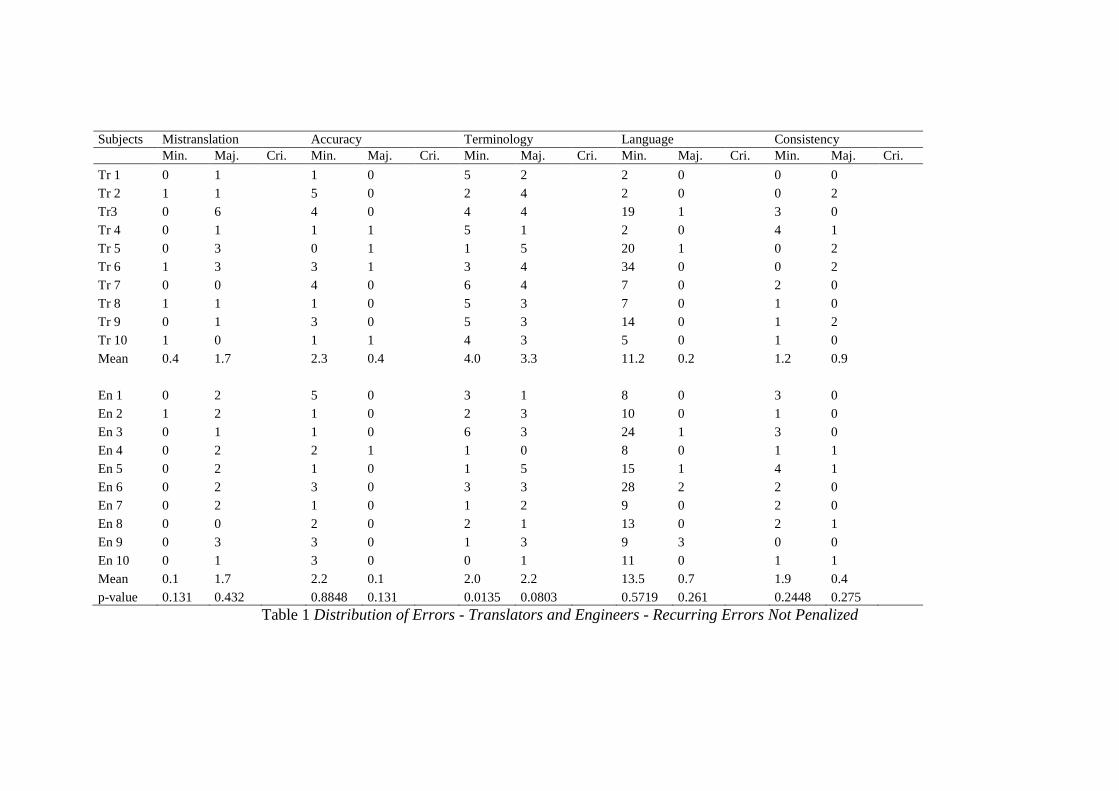
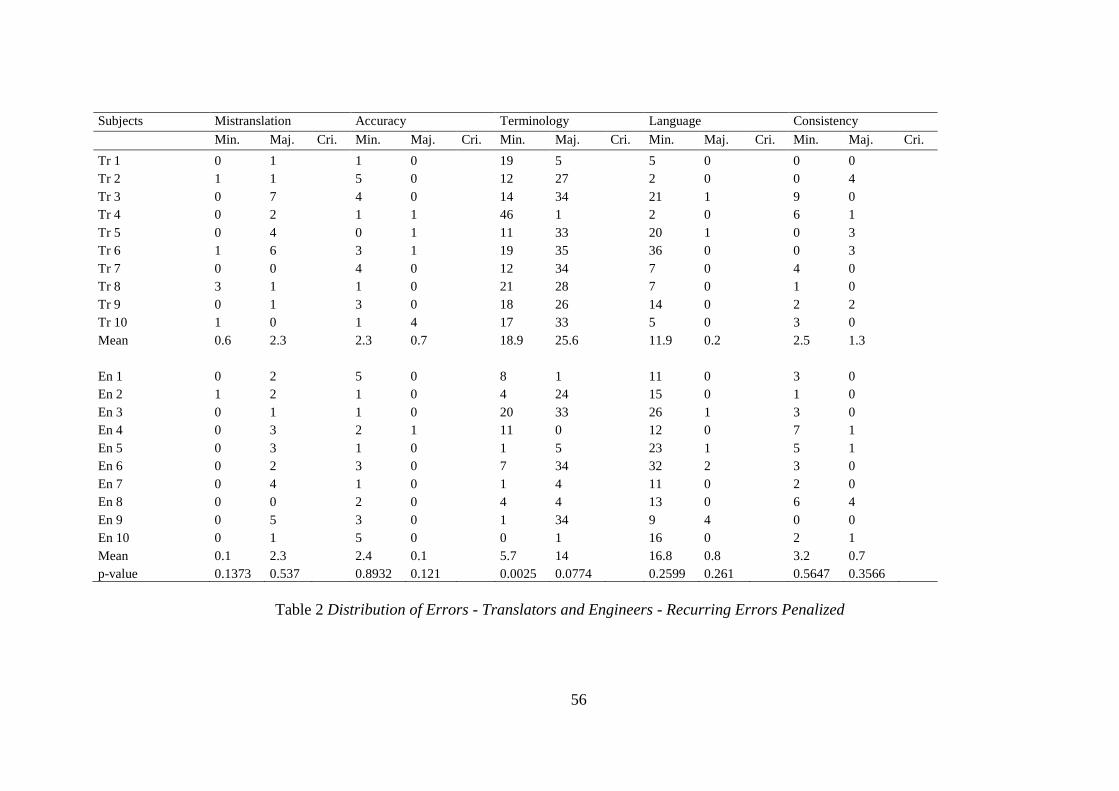
Error Distribution Data Table 1 presents the error distribution, over LISA QA Model
categories, of each translator and engineer when we do not penalize the recurrent errors. Table
2 presents the error distribution of each translator and engineer when we penalize the
recurrent errors.
Subjects Mistranslation Accuracy Terminology Language Consistency
Min. Maj. Cri. Min. Maj. Cri. Min. Maj. Cri. Min. Maj. Cri. Min. Maj. Cri.
Tr 1 0 1 1 0 5 2 2 0 0 0
Tr 2 1 1 5 0 2 4 2 0 0 2
Tr3 0 6 4 0 4 4 19 1 3 0
Tr 4 0 1 1 1 5 1 2 0 4 1
Tr 5 0 3 0 1 1 5 20 1 0 2
Tr 6 1 3 3 1 3 4 34 0 0 2
Tr 7 0 0 4 0 6 4 7 0 2 0
Tr 8 1 1 1 0 5 3 7 0 1 0
Tr 9 0 1 3 0 5 3 14 0 1 2
Tr 10 1 0 1 1 4 3 5 0 1 0
Mean 0.4 1.7 2.3 0.4 4.0 3.3 11.2 0.2 1.2 0.9
En 1 0 2 5 0 3 1 8 0 3 0
En 2 1 2 1 0 2 3 10 0 1 0
En 3 0 1 1 0 6 3 24 1 3 0
En 4 0 2 2 1 1 0 8 0 1 1
En 5 0 2 1 0 1 5 15 1 4 1
En 6 0 2 3 0 3 3 28 2 2 0
En 7 0 2 1 0 1 2 9 0 2 0
En 8 0 0 2 0 2 1 13 0 2 1
En 9 0 3 3 0 1 3 9 3 0 0
En 10 0 1 3 0 0 1 11 0 1 1
Mean 0.1 1.7 2.2 0.1 2.0 2.2 13.5 0.7 1.9 0.4
p-value 0.131 0.432 0.8848 0.131 0.0135 0.0803 0.5719 0.261 0.2448 0.275
Table 1 Distribution of Errors - Translators and Engineers - Recurring Errors Not Penalized
56
Subjects Mistranslation Accuracy Terminology Language Consistency
Min. Maj. Cri. Min. Maj. Cri. Min. Maj. Cri. Min. Maj. Cri. Min. Maj. Cri.
Tr 1 0 1 1 0 19 5 5 0 0 0
Tr 2 1 1 5 0 12 27 2 0 0 4
Tr 3 0 7 4 0 14 34 21 1 9 0
Tr 4 0 2 1 1 46 1 2 0 6 1
Tr 5 0 4 0 1 11 33 20 1 0 3
Tr 6 1 6 3 1 19 35 36 0 0 3
Tr 7 0 0 4 0 12 34 7 0 4 0
Tr 8 3 1 1 0 21 28 7 0 1 0
Tr 9 0 1 3 0 18 26 14 0 2 2
Tr 10 1 0 1 4 17 33 5 0 3 0
Mean 0.6 2.3 2.3 0.7 18.9 25.6 11.9 0.2 2.5 1.3
En 1 0 2 5 0 8 1 11 0 3 0
En 2 1 2 1 0 4 24 15 0 1 0
En 3 0 1 1 0 20 33 26 1 3 0
En 4 0 3 2 1 11 0 12 0 7 1
En 5 0 3 1 0 1 5 23 1 5 1
En 6 0 2 3 0 7 34 32 2 3 0
En 7 0 4 1 0 1 4 11 0 2 0
En 8 0 0 2 0 4 4 13 0 6 4
En 9 0 5 3 0 1 34 9 4 0 0
En 10 0 1 5 0 0 1 16 0 2 1
Mean 0.1 2.3 2.4 0.1 5.7 14 16.8 0.8 3.2 0.7
p-value 0.1373 0.537 0.8932 0.121 0.0025 0.0774 0.2599 0.261 0.5647 0.3566
Table 2 Distribution of Errors - Translators and Engineers - Recurring Errors Penalized
57
When we do not penalize the recurrent errors, the mistranslation data show that
translators made 0.4 minor and 1.7 major errors. The figures are 0.6 and 2.3 when we
penalize the recurrent errors. Engineers made 0.1 minor and 1.7 major errors in the
mistranslation category when the recurrent errors are not penalized. The figures are 0.1 and
2.3 when we penalize the recurrent errors. In both cases, the p-value does not indicate
significant differences between the translators’ and engineers’ with regard to the errors in the
mistranslation category (Table 1 and Table 2), and there is no noticeable difference within
one group under the recurring errors not penalized and penalized conditions.
As for accuracy, for the translators, the number of errors in the minor category is the
same in both not penalized and penalized conditions (2.3), while there is a slight difference in
the major error category (0.4 vs 0.7). For engineers, the number of minor accuracy errors is
2.2 when the recurrent errors are not counted, and 2.4 when the errors are counted. The
number of errors in the major category is the same (0.1 whether we do not penalize or
penalize the recurrent errors). The p-value does not indicate significant differences between
the translators and engineers with regard to accuracy errors (Table 1 and Table 2) when the
recurring errors are not penalized or penalized, and there is no noticeable difference within
the groups between the not penalized and the penalized conditions.
The biggest difference between the translators’ and engineers’ error distribution
results under both conditions (recurring errors not penalized or penalized) is seen in the
terminology category. When the recurrent errors are not penalized, the mean number of
minor terminology errors for translators is 4, while the figure is 18.9 when each recurrent
error is counted. The mean number of major terminology errors for translators is 3.3 when the
recurrent errors are not penalized and 25.6 when the recurrent errors are penalized. Thus,
according to the mean values in our data, for the minor terminology category, penalizing the
recurrent errors increases the number of errors by almost five times (4 vs 18.9), and for the
major terminology category, it increases the mean number of errors almost eight times (3.3 vs
25.6). When the recurrent errors are not penalized, the p-value for the difference between the
translators’ and the engineers’ minor terminology errors is 0.0135, which means that the
result is highly significant. For the major terminology category under the not penalized
condition, the p-value is 0.0803, which is not significant, although it is closer to the threshold
(0.05) than the p-value for other categories. When the recurrent errors are penalized,
similarly, engineers made significantly fewer minor terminology errors than translators (p =
0.0025), and the difference between engineers’ and translators’ major terminology errors is
close to the significance level (p = 0.0774). Both under the not penalized and the penalized
conditions, the difference between the translators’ and engineers’ minor terminology errors is
statistically significant, while the difference between their major terminology errors is not
significant. Although the t-test data are parallel with each other, it is obvious that the
difference between the numbers of terminology errors under both conditions will affect the
quality scores.
Unlike the terminology category, not penalizing or penalizing the recurrent errors
does not affect the quantity of the language errors. This is mainly caused by the nature of
errors. When a term recurring throughout the text is translated/postedited incorrectly, the
quality of the product will change to a great extent whether or not we decide to penalize the
erroneous translation/postediting of that recurring term. However, language errors are not
usually recurring errors. For example, sentences start with a capital letter. When the
posteditor fails to correct the letter “a” into capital “A” in the sentence “aracı örtün” (cover
up the vehicle), this is categorized as a minor language error. This type of error is unlikely to
58
recur throughout the text. Similar types of capitalization errors may occur. Yet, since they are
not the recurring versions of each other, they are regarded as distinct individual errors and
counted each time they occur.
When the recurrent errors are not penalized, translators make 11.2 minor and 0.2
major language errors. These figures are 13.5 and 0.7 for engineers (Table 1). Table 1 shows
that when the recurring errors are penalized, translators make 11.9 minor and 0.2 major
language errors, and engineers make 16.8 minor and 0.8 major language errors. Based on the
mean number of errors, the interesting difference occurs when we do not penalize or penalize
engineers’ minor language errors (13.5 vs 16.8). The t-test data of the not penalized and the
penalized conditions do not reveal significant difference between translators and engineers
with regard to their language errors, yet the p-values of both conditions are not close to each
other. The p-value of the difference between both groups’ minor language errors is lower
when the recurrent errors are penalized than when they are not penalized (0.2599 vs 0.5719)
(Table 2 and Table 1). As mentioned above, most of the language errors occur only once.
However, there are a few exceptions. For example, the translation of the word “ignition”
provided by the MT system is “atesleme”. Although this seems to be the correct translation,
there is a small mistake. The MT system used “s” instead of “ş”, which is a Turkish character
(s with cedilla). The correct translation should be “ateşleme”. This word occurs in the text
three times and most of the engineers did not correct this error, while the translators usually
corrected it. This is why the number of engineers’ minor language errors changes when the
recurrent errors are not penalized or penalized.
The number of consistency errors also changes when the recurrent errors are not
penalized or penalized. Translators make 1.2 minor and 0.9 major consistency errors when
we do not penalize the recurrent errors. The figures are 2.5 and 1.3, respectively, when we
penalize the recurrent errors (Table 1 and Table 2). Engineers make 1.9 minor and 0.4 major
consistency errors when we do not penalize the recurrent errors. These figures are 3.2 and
0.7, respectively, when we penalize the recurrent errors (Table 1 and Table 2). Although
these figures represent small numbers of error points, they indicate that penalizing the
recurring errors may lead to the calculation of almost twice the consistency errors. The t-test
data under both conditions do not reveal significant differences between translators and
engineers (Table 1 and Table 2).
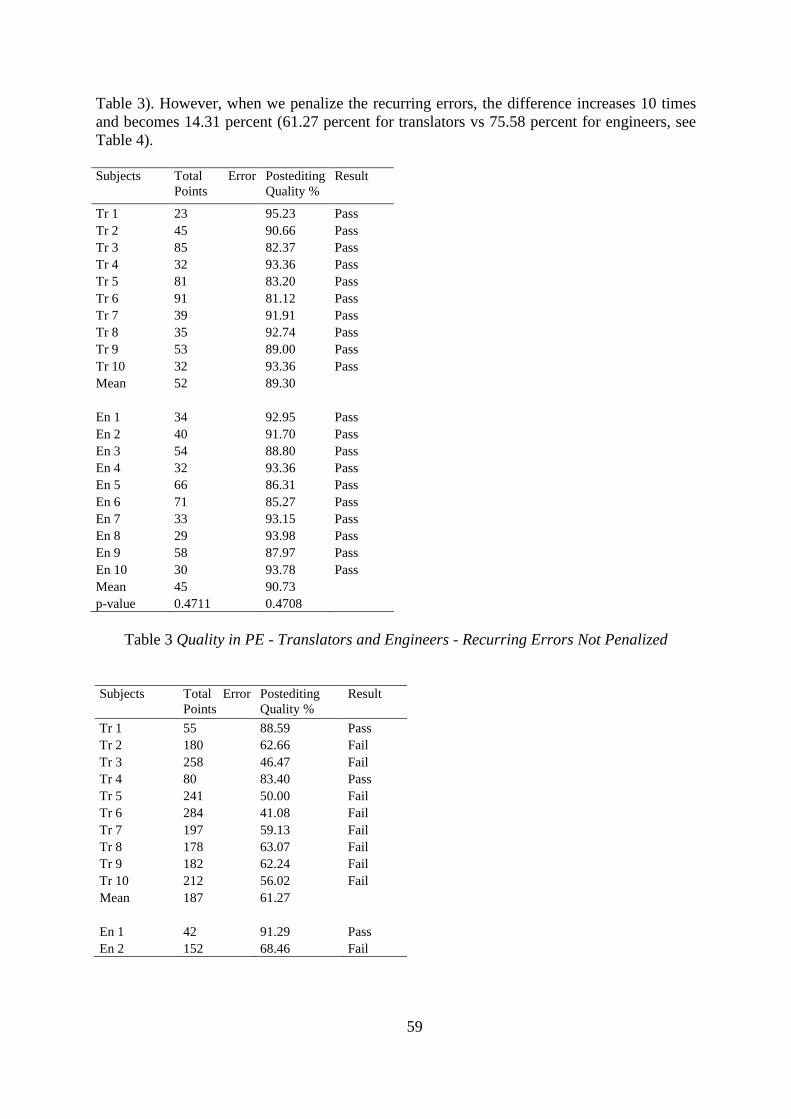
Total Error Point and Quality Percentage Data We also calculated the total error points and
obtained the quality percentages when the recurrent errors are not penalized (Table 3) and
penalized (Table 4). Based on mean values, the total error points (hence the quality
percentages) change to a great extent when we do not penalize or penalize the recurrent
errors. Unlike when all errors are penalized, all of the translators and engineers received
“Pass” from the LISA QA Model 3.1 when the recurrent errors are not penalized. When the
recurring errors are not penalized, the mean total error point for translators is 52, and the
quality percentage is 89.30 (Table 3). When the recurrent errors are penalized, on the other
hand, these figures are 187 and 61.27, respectively (Table 4). For engineers, when the
recurring errors are not penalized, the mean total error point is 45, and the quality percentage
is 90.73 (Table 3). In case when the recurrent errors are penalized, the figures are 118 and
75.58, respectively (Table 4).
Based on the mean values, the quality of the engineers’ postediting seems higher than
the translators’, no matter whether we do not penalize or penalize the recurrent errors. When
we do not penalize the recurring errors, the difference between both groups’ mean product
quality score is only 1.43 (89.30 percent for translators vs 90.73 percent for engineers, see
59
Table 3). However, when we penalize the recurring errors, the difference increases 10 times
and becomes 14.31 percent (61.27 percent for translators vs 75.58 percent for engineers, see
Table 4).
Subjects Total Error
Points
Postediting
Quality %
Result
Tr 1 23 95.23 Pass
Tr 2 45 90.66 Pass
Tr 3 85 82.37 Pass
Tr 4 32 93.36 Pass
Tr 5 81 83.20 Pass
Tr 6 91 81.12 Pass
Tr 7 39 91.91 Pass
Tr 8 35 92.74 Pass
Tr 9 53 89.00 Pass
Tr 10 32 93.36 Pass
Mean 52 89.30
En 1 34 92.95 Pass
En 2 40 91.70 Pass
En 3 54 88.80 Pass
En 4 32 93.36 Pass
En 5 66 86.31 Pass
En 6 71 85.27 Pass
En 7 33 93.15 Pass
En 8 29 93.98 Pass
En 9 58 87.97 Pass
En 10 30 93.78 Pass
Mean 45 90.73
p-value 0.4711 0.4708
Table 3 Quality in PE - Translators and Engineers - Recurring Errors Not Penalized
Subjects Total Error
Points
Postediting
Quality %
Result
Tr 1 55 88.59 Pass
Tr 2 180 62.66 Fail
Tr 3 258 46.47 Fail
Tr 4 80 83.40 Pass
Tr 5 241 50.00 Fail
Tr 6 284 41.08 Fail
Tr 7 197 59.13 Fail
Tr 8 178 63.07 Fail
Tr 9 182 62.24 Fail
Tr 10 212 56.02 Fail
Mean 187 61.27
En 1 42 91.29 Pass
En 2 152 68.46 Fail
60
En 3 225 53.32 Fail
En 4 57 88.17 Pass
En 5 80 83.40 Pass
En 6 235 51.24 Fail
En 7 55 88.59 Pass
En 8 65 86.51 Pass
En 9 228 52.70 Fail
En 10 38 92.12 Pass
Mean 118 75.58
p-value 0.0636 0.0636
Table 4 Quality in PE - Translators and Engineers - Recurring Errors Penalized
According to the t-tests, there is no significant difference between the quality of
engineers’ and translators’ postediting a technical text (the quality being measured by total
error points and quality percentages obtained from LISA QA Model 3.1), no matter whether
we penalize or do not penalize the recurrent errors. However, the degree of statistical
significance changes noticeably when the recurring errors are not penalized (p = 0.4708,
Table 3) and penalized (p = 0.0636, Table 4).
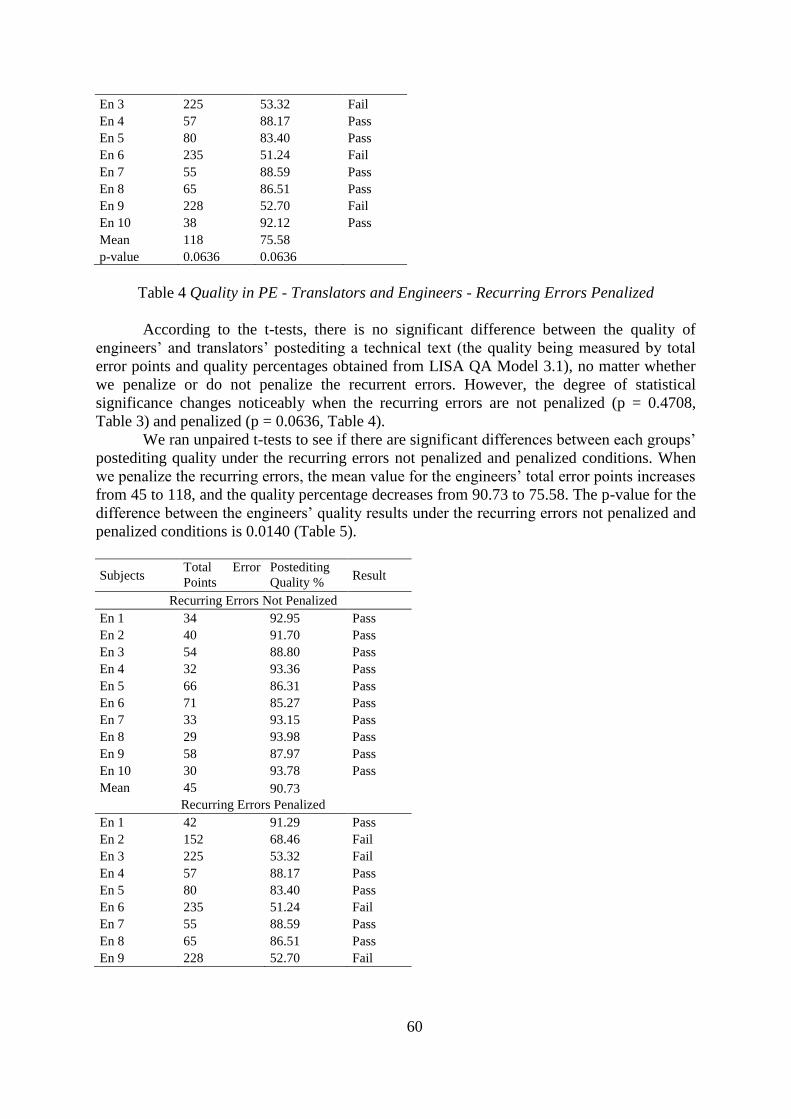
We ran unpaired t-tests to see if there are significant differences between each groups’
postediting quality under the recurring errors not penalized and penalized conditions. When
we penalize the recurring errors, the mean value for the engineers’ total error points increases
from 45 to 118, and the quality percentage decreases from 90.73 to 75.58. The p-value for the
difference between the engineers’ quality results under the recurring errors not penalized and
penalized conditions is 0.0140 (Table 5).
Subjects Total Error
Points
Postediting
Quality % Result
Recurring Errors Not Penalized
En 1 34 92.95 Pass
En 2 40 91.70 Pass
En 3 54 88.80 Pass
En 4 32 93.36 Pass
En 5 66 86.31 Pass
En 6 71 85.27 Pass
En 7 33 93.15 Pass
En 8 29 93.98 Pass
En 9 58 87.97 Pass
En 10 30 93.78 Pass
Mean 45 90.73
Recurring Errors Penalized
En 1 42 91.29 Pass
En 2 152 68.46 Fail
En 3 225 53.32 Fail
En 4 57 88.17 Pass
En 5 80 83.40 Pass
En 6 235 51.24 Fail
En 7 55 88.59 Pass
En 8 65 86.51 Pass
En 9 228 52.70 Fail
61
En 10 38 92.12 Pass
Mean 118 75.58
p-value 0.0140 0.0140
Table 5 Engineers’ Quality Results in PE - Recurring Errors Not Penalized and
Penalized
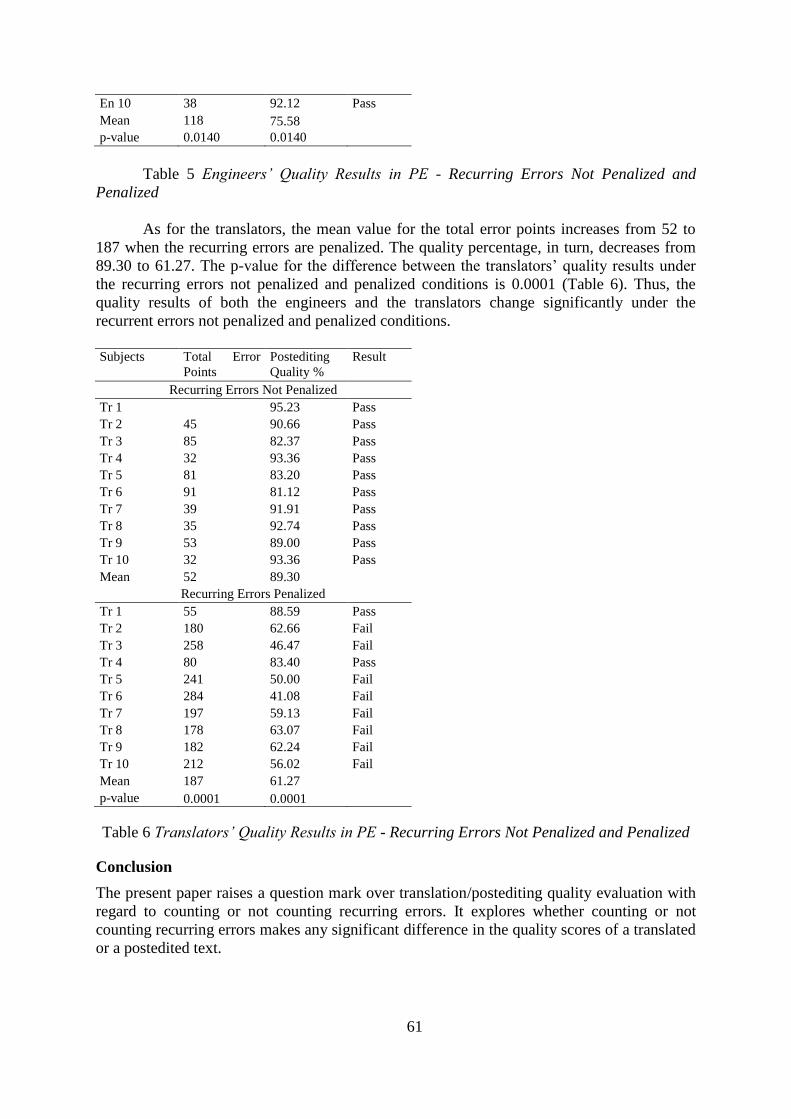
As for the translators, the mean value for the total error points increases from 52 to
187 when the recurring errors are penalized. The quality percentage, in turn, decreases from
89.30 to 61.27. The p-value for the difference between the translators’ quality results under
the recurring errors not penalized and penalized conditions is 0.0001 (Table 6). Thus, the
quality results of both the engineers and the translators change significantly under the
recurrent errors not penalized and penalized conditions.
Subjects Total Error
Points
Postediting
Quality %
Result
Recurring Errors Not Penalized
Tr 1 95.23 Pass
Tr 2 45 90.66 Pass
Tr 3 85 82.37 Pass
Tr 4 32 93.36 Pass
Tr 5 81 83.20 Pass
Tr 6 91 81.12 Pass
Tr 7 39 91.91 Pass
Tr 8 35 92.74 Pass
Tr 9 53 89.00 Pass
Tr 10 32 93.36 Pass
Mean 52 89.30
Recurring Errors Penalized
Tr 1 55 88.59 Pass
Tr 2 180 62.66 Fail
Tr 3 258 46.47 Fail
Tr 4 80 83.40 Pass
Tr 5 241 50.00 Fail
Tr 6 284 41.08 Fail
Tr 7 197 59.13 Fail
Tr 8 178 63.07 Fail
Tr 9 182 62.24 Fail
Tr 10 212 56.02 Fail
Mean 187 61.27
p-value 0.0001 0.0001
Table 6 Translators’ Quality Results in PE - Recurring Errors Not Penalized and Penalized
Conclusion
The present paper raises a question mark over translation/postediting quality evaluation with
regard to counting or not counting recurring errors. It explores whether counting or not
counting recurring errors makes any significant difference in the quality scores of a translated
or a postedited text.
62
A total of ten professional translators and ten engineers postedited a 482-word
technical text pre-translated from English into Turkish with the data-based MT system,
Google Translate. LISA QA Model 3.1. was used as a measure of quality. Comparison is
made within the same group (engineers under penalized and not penalized conditions and
translators under penalized and not penalized conditions) to see to what extent counting or
not counting the recurring errors would affect the relevant group’s quality results. In addition,
comparison between the two groups, in other words, engineers and translators, under the
penalized and not penalized conditions, was made to see how penalizing or not penalizing
recurring errors would change the comparison of one group’s performance to another.
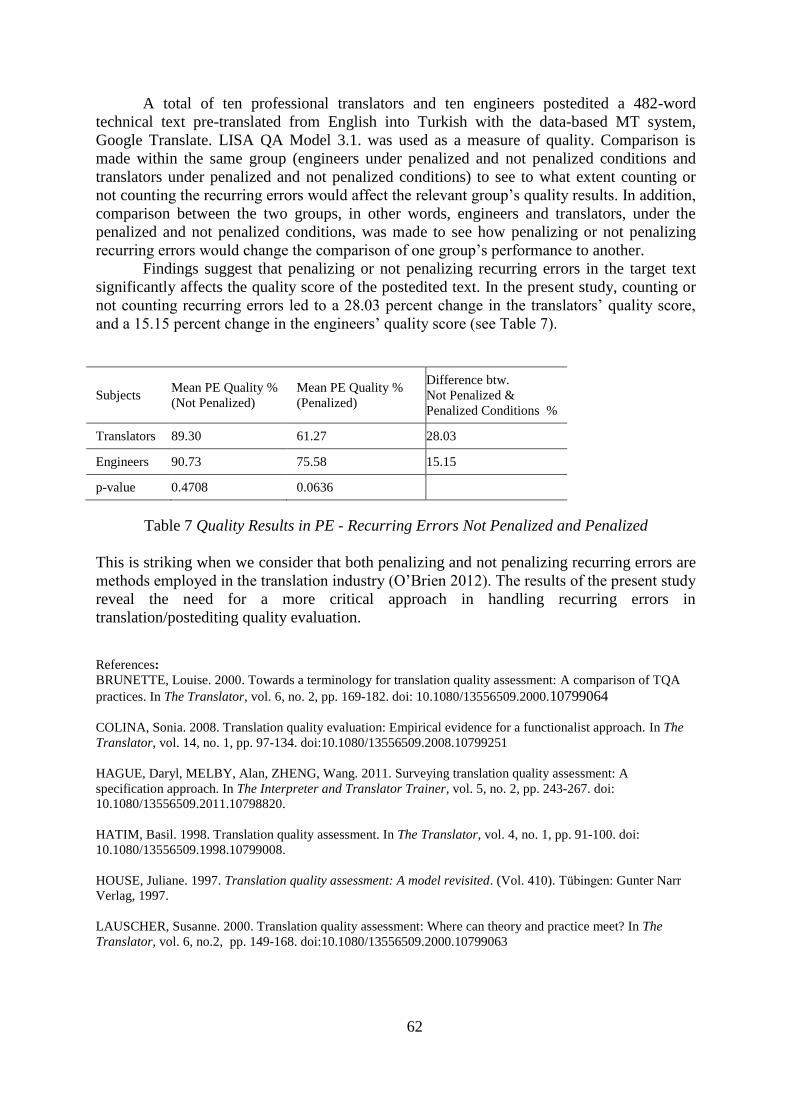
Findings suggest that penalizing or not penalizing recurring errors in the target text
significantly affects the quality score of the postedited text. In the present study, counting or
not counting recurring errors led to a 28.03 percent change in the translators’ quality score,
and a 15.15 percent change in the engineers’ quality score (see Table 7).
Table 7 Quality Results in PE - Recurring Errors Not Penalized and Penalized
This is striking when we consider that both penalizing and not penalizing recurring errors are
methods employed in the translation industry (O’Brien 2012). The results of the present study
reveal the need for a more critical approach in handling recurring errors in
translation/postediting quality evaluation.
References:
BRUNETTE, Louise. 2000. Towards a terminology for translation quality assessment: A comparison of TQA
practices. In The Translator, vol. 6, no. 2, pp. 169-182. doi: 10.1080/13556509.2000.10799064
COLINA, Sonia. 2008. Translation quality evaluation: Empirical evidence for a functionalist approach. In The
Translator, vol. 14, no. 1, pp. 97-134. doi:10.1080/13556509.2008.10799251
HAGUE, Daryl, MELBY, Alan, ZHENG, Wang. 2011. Surveying translation quality assessment: A
specification approach. In The Interpreter and Translator Trainer, vol. 5, no. 2, pp. 243-267. doi:
10.1080/13556509.2011.10798820.
HATIM, Basil. 1998. Translation quality assessment. In The Translator, vol. 4, no. 1, pp. 91-100. doi:
10.1080/13556509.1998.10799008.
HOUSE, Juliane. 1997. Translation quality assessment: A model revisited. (Vol. 410). Tübingen: Gunter Narr
Verlag, 1997.
LAUSCHER, Susanne. 2000. Translation quality assessment: Where can theory and practice meet? In The
Translator, vol. 6, no.2, pp. 149-168. doi:10.1080/13556509.2000.10799063
Subjects Mean PE Quality %
(Not Penalized)
Mean PE Quality %
(Penalized)
Difference btw.
Not Penalized &
Penalized Conditions %
Translators 89.30 61.27 28.03
Engineers 90.73 75.58 15.15
p-value 0.4708 0.0636
63
O’BRIEN, Sharon. 2012. Towards a dynamic quality evaluation model for translation. In Journal of Specialized
Translation, vol. 17, pp. 1-24.
TEMİZÖZ, Özlem. 2013. Postediting machine translation output and its revision: Subject matter experts versus
professional translators. Unpublished doctoral thesis. Tarragona: Universitat Rovira i Virgili.
TEMİZÖZ, Özlem. 2016. Postediting machine translation output: Subject matter experts versus professional
translators. To be published in Perspectives at http://dx.doi.org/10.1080/0907676X.2015.1119862
Dr. Özlem Temizöz
Kocaeli Üniversitesi, Umuttepe Yerleşkesi
Yabancı Diller Yüksekokulu 2. Kat, No: 222
Izmit-Kocaeli-TÜRKİYE
In SKASE Journal of Translation and Interpretation [online]. 2015, vol. 9, no. 1 [cit. 2016-18-04].
Available online <http://www.skase.sk/Volumes/JTI10/pdf_doc/04.pdf>. ISSN 1336-7811
Recommended