Copyright © 2015 Pearson Education, Inc. All Rights Reserved.
Strategy, Balanced Scorecard,and
Strategic Profitability Analysis

Copyright © 2015 Pearson Education, Inc. All Rights Reserved.
1. Recognize which of two generic strategies a company is using
2. Understand what comprises reengineering
3. Understand the four perspectives of the balanced scorecard
4. Analyze changes in operating income to evaluate strategy
5. Identify unused capacity and how to manage it
12-2
Copyright © 2015 Pearson Education, Inc. All Rights Reserved.
Strategy specifies how an organization matches its own capabilities with the opportunities in the marketplace to accomplish its objectives.
Strategy describes how an organization can create value for its customers while differentiating itself from its competitors.
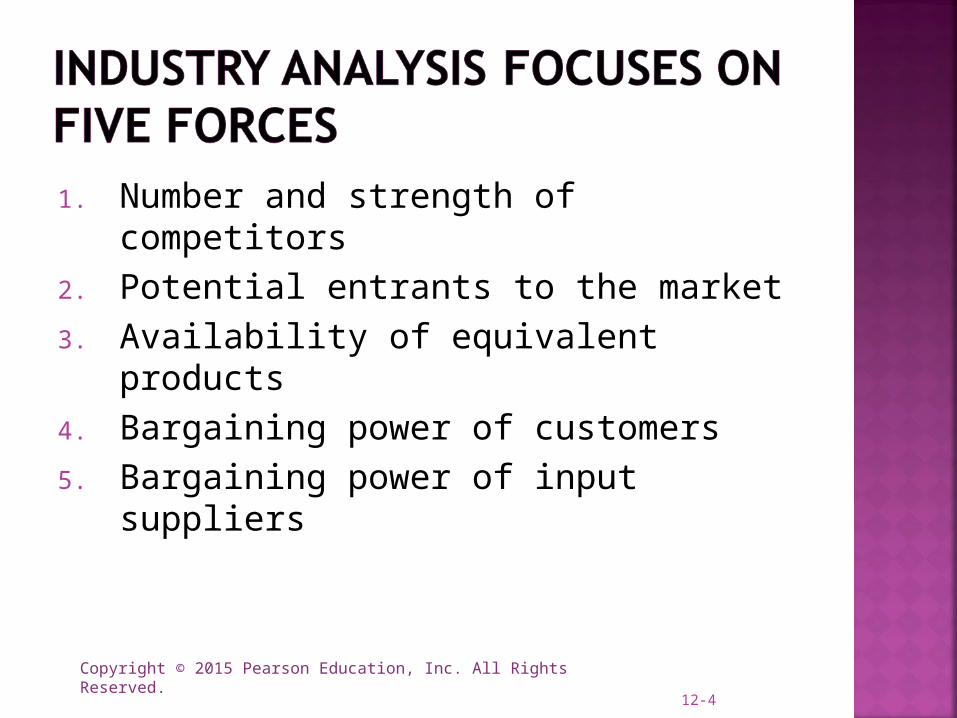
A thorough understanding of the industry is critical to implementing a successful strategy. Industry analysis focuses on 5 forces.
12-3
Copyright © 2015 Pearson Education, Inc. All Rights Reserved.
1. Number and strength of competitors2. Potential entrants to the market3. Availability of equivalent products4. Bargaining power of customers5. Bargaining power of input suppliers
12-4

Copyright © 2015 Pearson Education, Inc. All Rights Reserved.
1. Product differentiation—an organization’s ability to offer products or services perceived by its customers to be superior and unique relative to the products or services of its competitors.
Competitive advantage: brand loyalty and the willingness of customers to pay high prices.
2. Cost leadership—an organization’s ability to achieve lower costs relative to competitors through productivity and efficiency improvements, elimination of waste, and tight cost control.
Competitive advantage: lower selling prices.
12-5
Copyright © 2015 Pearson Education, Inc. All Rights Reserved.
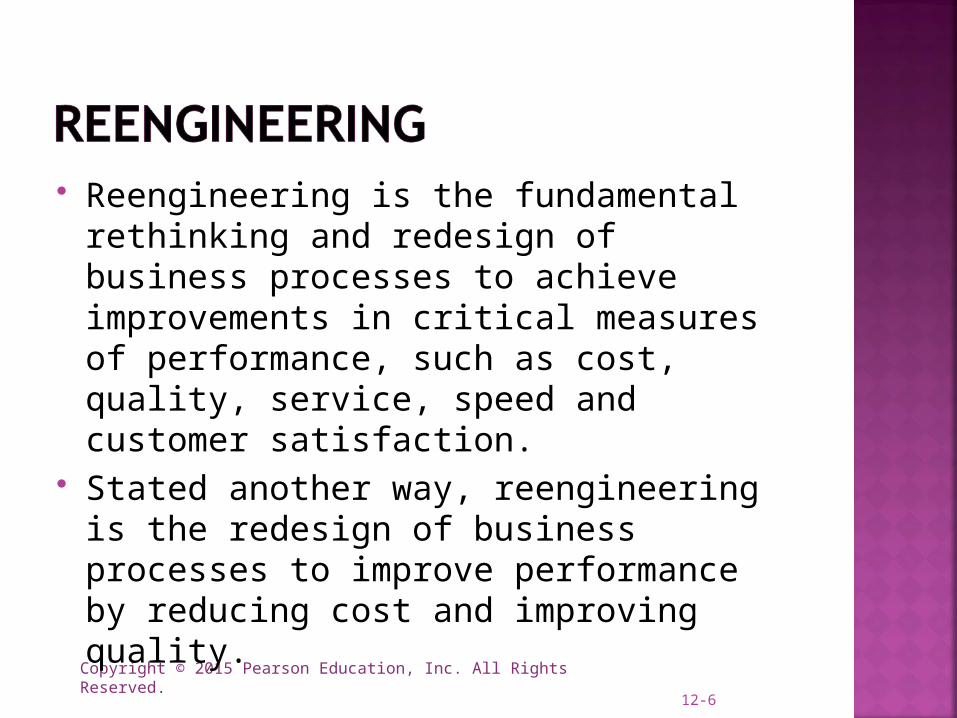
Reengineering is the fundamental rethinking and redesign of business processes to achieve improvements in critical measures of performance, such as cost, quality, service, speed and customer satisfaction.
Stated another way, reengineering is the redesign of business processes to improve performance by reducing cost and improving quality.
12-6
Copyright © 2015 Pearson Education, Inc. All Rights Reserved.
Many companies have introduced a balanced scorecard to track progress and manage the implementation of their strategies.
12-7

Copyright © 2015 Pearson Education, Inc. All Rights Reserved.
The balanced scorecard translates an organization’s mission and strategy into a set of performance measures that provides the framework for implementing its strategy.1
Not only does the balanced scorecard focus on achieving financial objectives, it also highlights the nonfinancial objectives that an organization must achieve to meet and sustain its financial objectives.
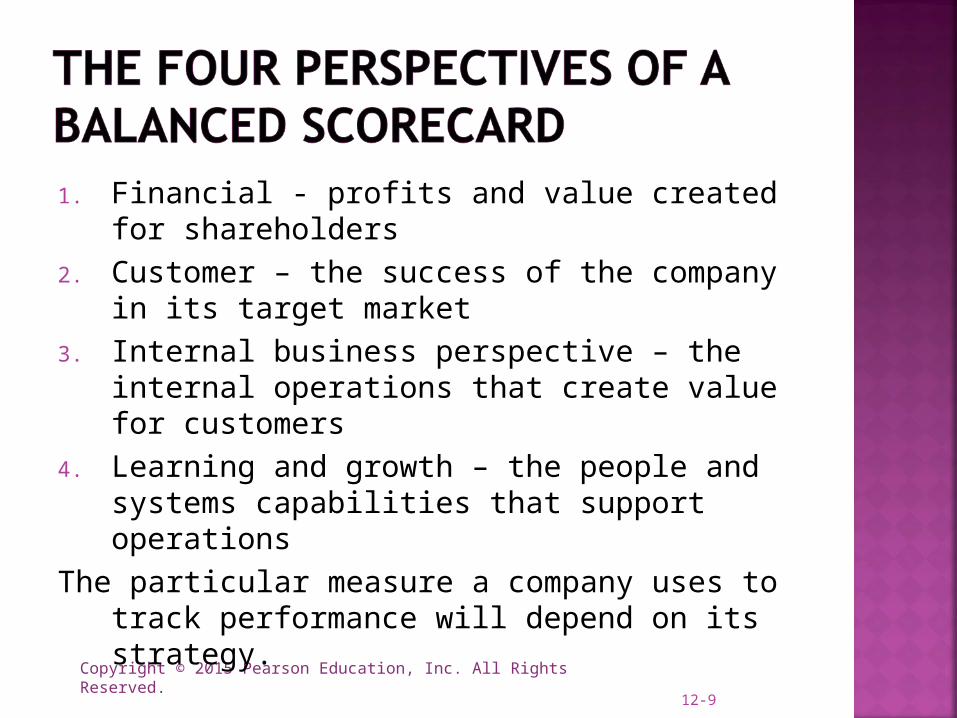
The scorecard measures an organization’s performance from four perspectives.
12-8
Copyright © 2015 Pearson Education, Inc. All Rights Reserved.
1. Financial - profits and value created for shareholders
2. Customer – the success of the company in its target market
3. Internal business perspective – the internal operations that create value for customers
4. Learning and growth – the people and systems capabilities that support operations
The particular measure a company uses to track performance will depend on its strategy.
12-9

Copyright © 2015 Pearson Education, Inc. All Rights Reserved.12-10

Copyright © 2015 Pearson Education, Inc. All Rights Reserved.
Evaluates the profitability of the strategy
Uses the most objective measures in the scorecard
The other three perspectives eventually feed back into this dimension
12-11
Copyright © 2015 Pearson Education, Inc. All Rights Reserved.
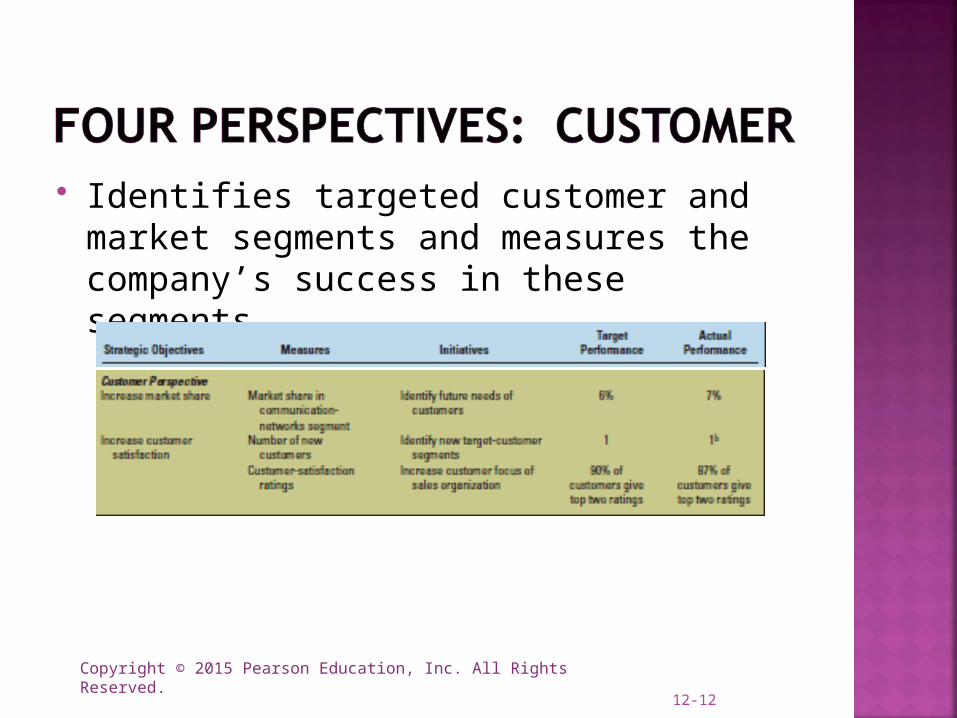
Identifies targeted customer and market segments and measures the company’s success in these segments
12-12
Copyright © 2015 Pearson Education, Inc. All Rights Reserved.
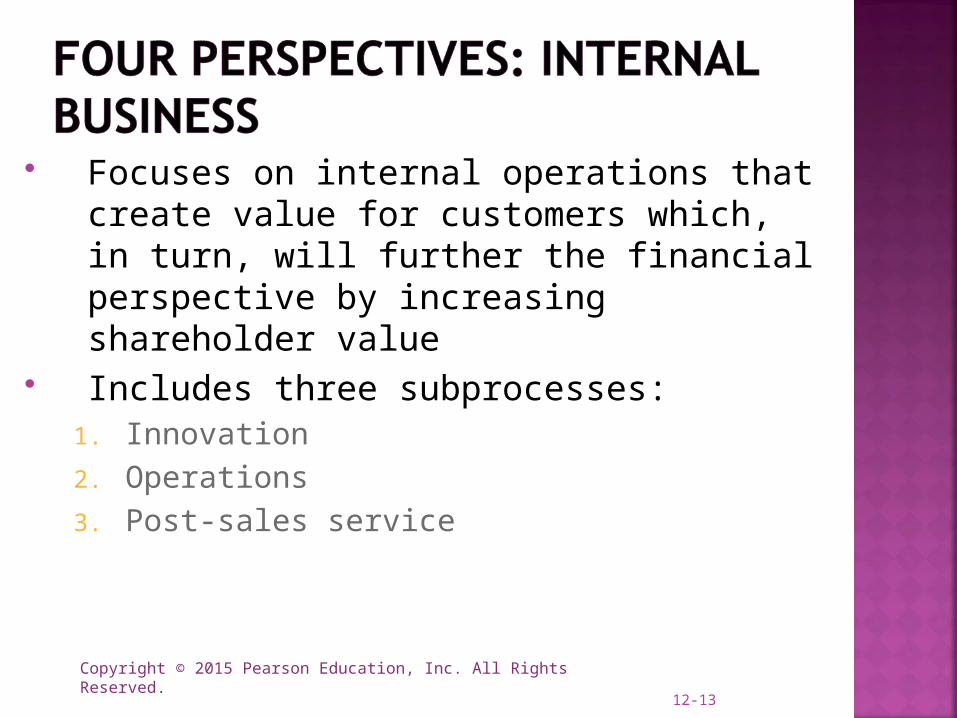
Focuses on internal operations that create value for customers which, in turn, will further the financial perspective by increasing shareholder value
Includes three subprocesses:1. Innovation2. Operations3. Post-sales service
12-13

Copyright © 2015 Pearson Education, Inc. All Rights Reserved.12-14

Copyright © 2015 Pearson Education, Inc. All Rights Reserved.
Identifies the people and information capabilities the organization must excel at to achieve superior internal processes that create value for customers and shareholders
12-15

Copyright © 2015 Pearson Education, Inc. All Rights Reserved.
Must have commitment and leadership from top management.
Must be communicated to all employees.
For the balanced scorecard to be effective, managers must view it as a fair way to assess and reward all important aspects of a manager’s performance and promotion prospects.
12-16

Copyright © 2015 Pearson Education, Inc. All Rights Reserved.12-17
Copyright © 2015 Pearson Education, Inc. All Rights Reserved.
Companies are increasingly recognizing that they must earn the right to operate in the communities and countries in which they do business.
Failure to perform adequately on environmental and social processes puts at risk a company’s ability to deliver future value to shareholders.
12-18

Copyright © 2015 Pearson Education, Inc. All Rights Reserved.
As was discussed in Chapter 1, many managers are promoting sustainability (the development and implementation of strategies) to achieve:Long-term financial performanceSocial performance (eliminating employee
injuries, improving product safety)Environmental performance (reducing
greenhouse gas emissions)
12-19

Copyright © 2015 Pearson Education, Inc. All Rights Reserved.
Managers interested in measuring environmental and social performance are incorporating these factors into their balanced scorecards to set priorities for initiatives, guide decisions and actions and fuel discussions around strategies and business models to improve performance.
Companies use a variety of measures including:Cost of preventing and remediating environmental damage (financial); brand image (customer); energy consumption (internal-business); and implementation of ISO 14000 environmental standards (learning and growth).
12-20
Copyright © 2015 Pearson Education, Inc. All Rights Reserved.
1. Tells the story of a firms strategy, articulating a sequence of cause-and-effect relationships—the links among the various perspectives that align implementation of the strategy.2. Helps to communicate the strategy to all members of the organization by translating the strategy into a coherent and linked set of understandable and measurable operational targets.
12-21

Copyright © 2015 Pearson Education, Inc. All Rights Reserved.
3. Must motivate managers to take actions that eventually result in improvements in financial performance.
Applies primarily to for-profit entities, but has some application to not-for-profit entities as well.
4. Limits the number of measures, identifying only the most critical ones.5. Highlights less-than-optimal trade-offs that managers may make when they fail to consider operational and financial measures together.
12-22
Copyright © 2015 Pearson Education, Inc. All Rights Reserved.
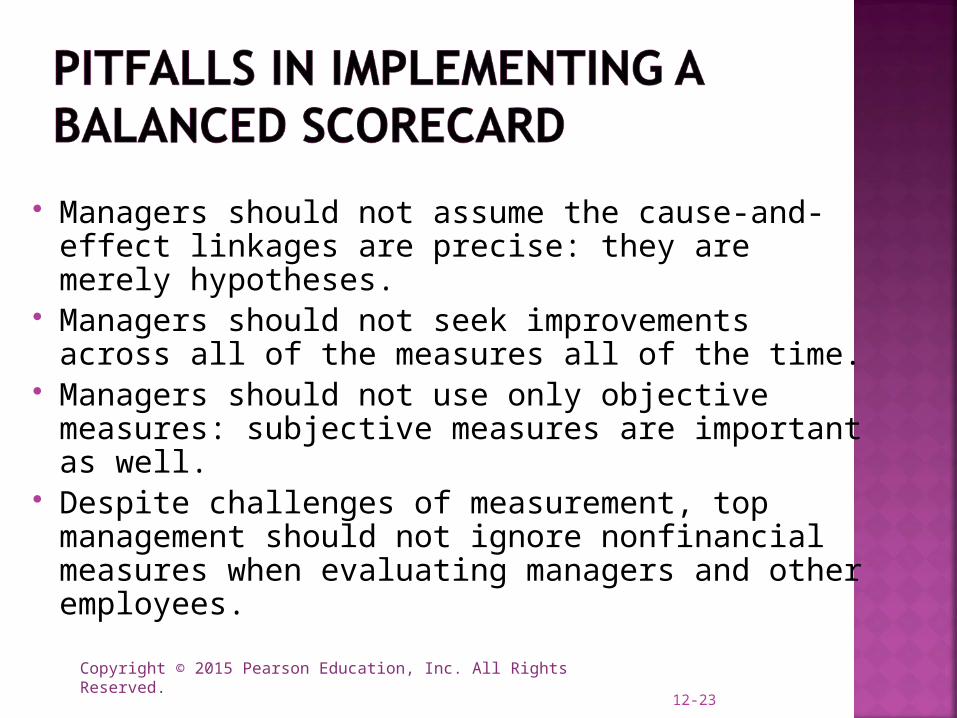
Managers should not assume the cause-and-effect linkages are precise: they are merely hypotheses.
Managers should not seek improvements across all of the measures all of the time.
Managers should not use only objective measures: subjective measures are important as well.
Despite challenges of measurement, top management should not ignore nonfinancial measures when evaluating managers and other employees.
12-23
Copyright © 2015 Pearson Education, Inc. All Rights Reserved.
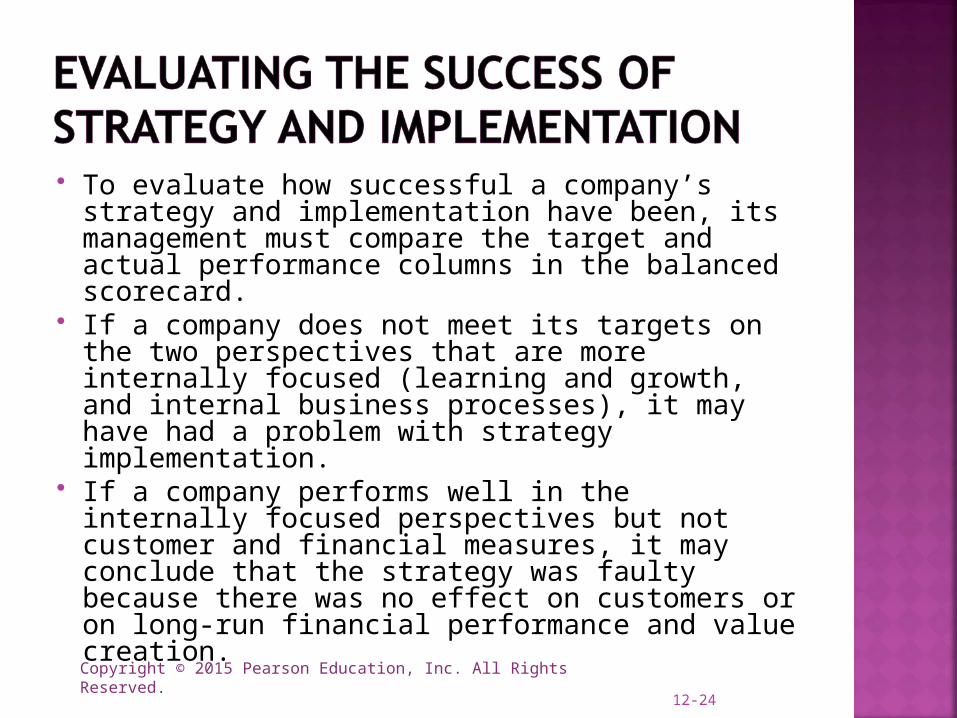
To evaluate how successful a company’s strategy and implementation have been, its management must compare the target and actual performance columns in the balanced scorecard.
If a company does not meet its targets on the two perspectives that are more internally focused (learning and growth, and internal business processes), it may have had a problem with strategy implementation.
If a company performs well in the internally focused perspectives but not customer and financial measures, it may conclude that the strategy was faulty because there was no effect on customers or on long-run financial performance and value creation.
12-24
Copyright © 2015 Pearson Education, Inc. All Rights Reserved.
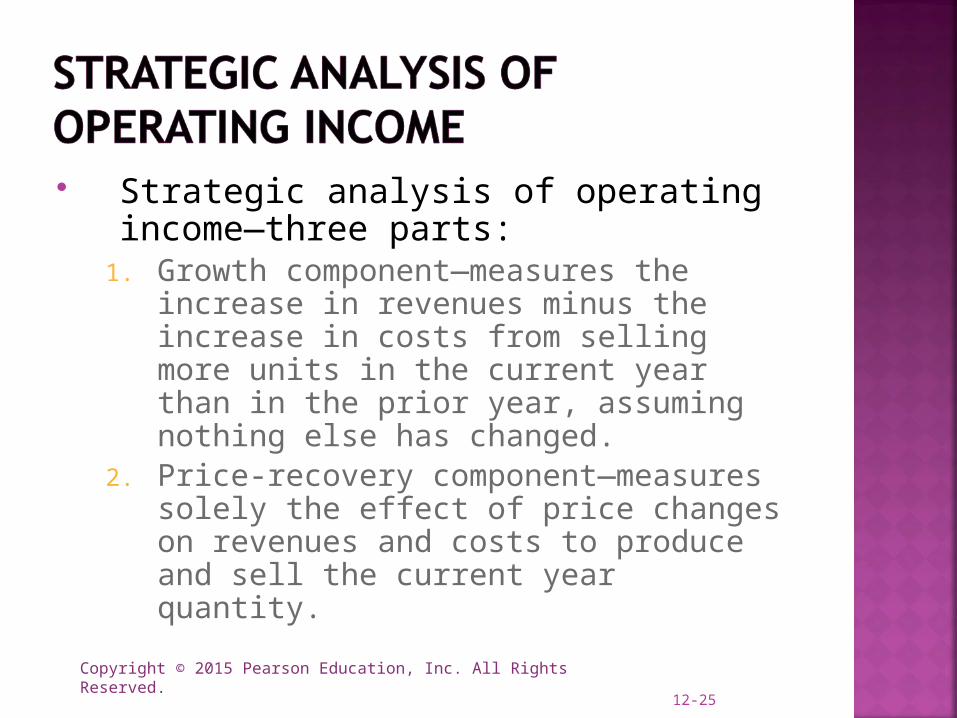
Strategic analysis of operating income—three parts:
1. Growth component—measures the increase in revenues minus the increase in costs from selling more units in the current year than in the prior year, assuming nothing else has changed.
2. Price-recovery component—measures solely the effect of price changes on revenues and costs to produce and sell the current year quantity.
12-25
Copyright © 2015 Pearson Education, Inc. All Rights Reserved.
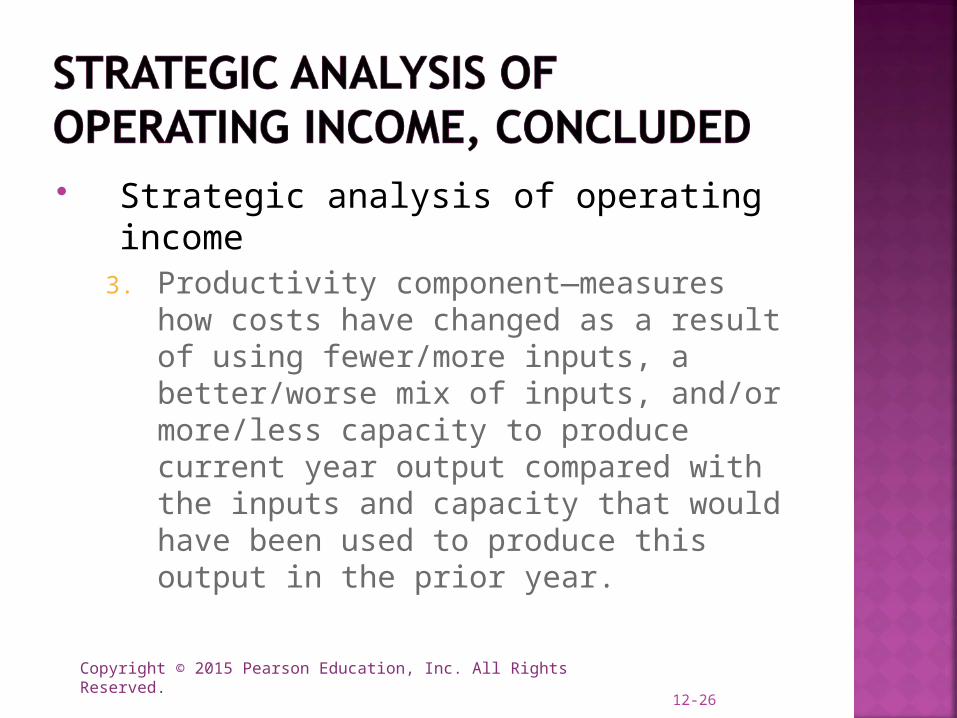
Strategic analysis of operating income3. Productivity component—measures how
costs have changed as a result of using fewer/more inputs, a better/worse mix of inputs, and/or more/less capacity to produce current year output compared with the inputs and capacity that would have been used to produce this output in the prior year.
12-26
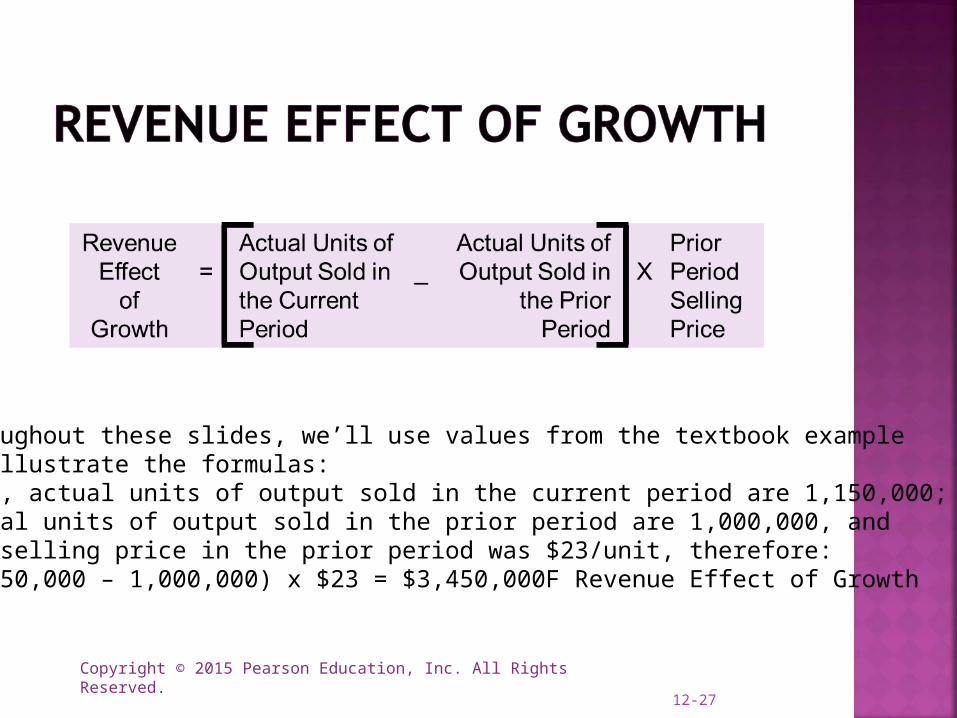
Copyright © 2015 Pearson Education, Inc. All Rights Reserved.12-27
Throughout these slides, we’ll use values from the textbook exampleto illustrate the formulas:Here, actual units of output sold in the current period are 1,150,000;Actual units of output sold in the prior period are 1,000,000, andThe selling price in the prior period was $23/unit, therefore:(1,150,000 – 1,000,000) x $23 = $3,450,000F Revenue Effect of Growth
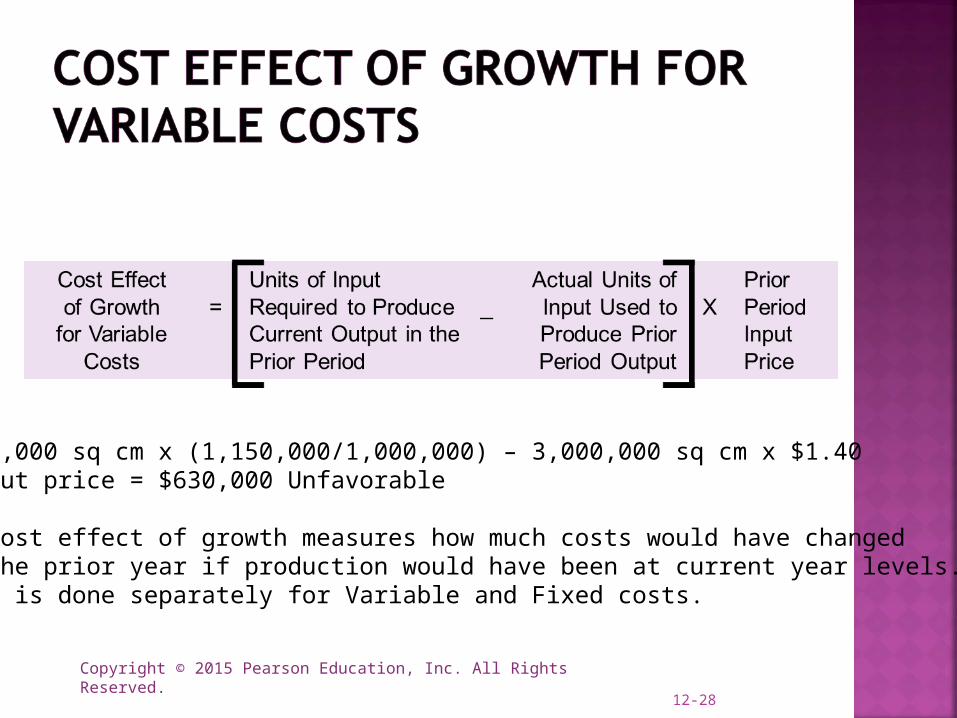
Copyright © 2015 Pearson Education, Inc. All Rights Reserved.12-28
3,000,000 sq cm x (1,150,000/1,000,000) – 3,000,000 sq cm x $1.40 input price = $630,000 Unfavorable
The cost effect of growth measures how much costs would have changed in the prior year if production would have been at current year levels. This is done separately for Variable and Fixed costs.
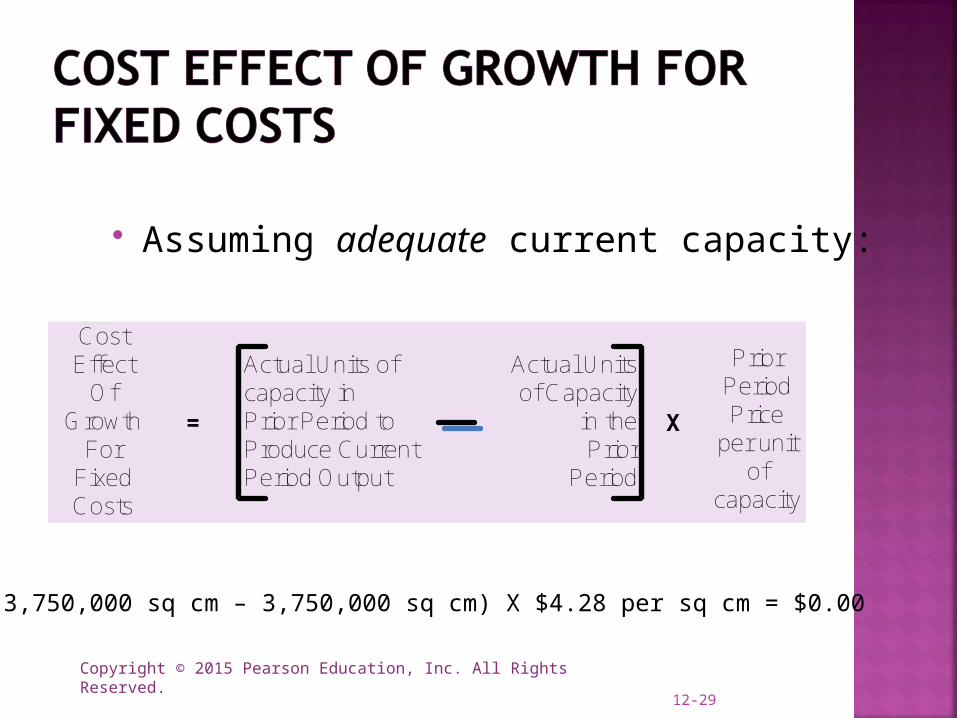
Copyright © 2015 Pearson Education, Inc. All Rights Reserved.
Actual Units of Capacity
in the Prior
Period
Actual Units of capacity in Prior Period to Produce Current Period Output
X
Prior Period Price
per unit of
capacity
CostEffect
OfGrowth
For FixedCosts
=
12-29
Assuming adequate current capacity:
(3,750,000 sq cm – 3,750,000 sq cm) X $4.28 per sq cm = $0.00

Copyright © 2015 Pearson Education, Inc. All Rights Reserved.
Prior Period Selling Price
Current Period Selling Price X
CurrentPeriod Units Sold
RevenueEffect
OfPrice-
Recovery
=
12-30
($22 per unit current year - $23 per unit prior year) X 1,150,000 actual units of output sold in current year = $1,150,000 Unfavorable
Copyright © 2015 Pearson Education, Inc. All Rights Reserved.
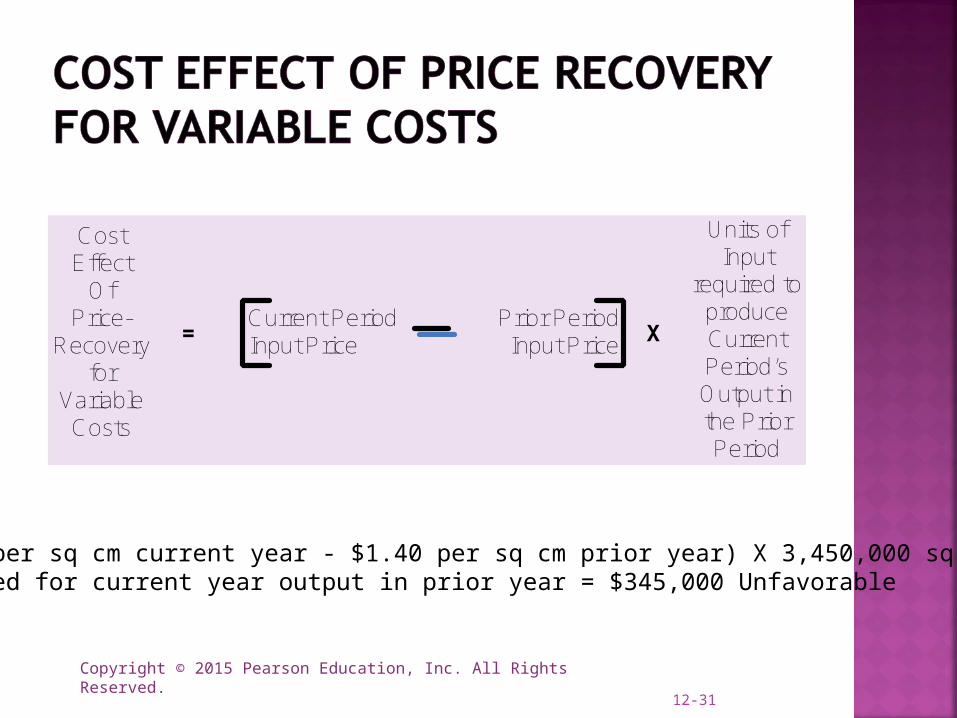
Prior Period Input Price
Current Period Input Price X
Units of Input
required to produce Current Period’s Output in the Prior Period
CostEffect
OfPrice-
Recovery for
Variable Costs
=
12-31
($1.50 per sq cm current year - $1.40 per sq cm prior year) X 3,450,000 sq cm required for current year output in prior year = $345,000 Unfavorable
Copyright © 2015 Pearson Education, Inc. All Rights Reserved.
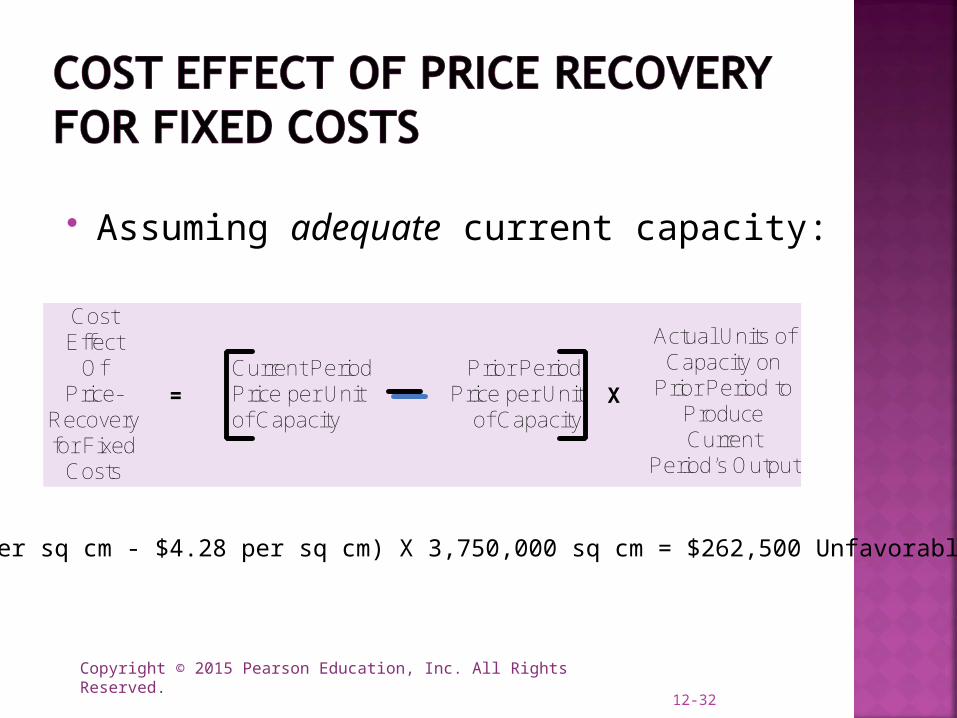
Prior Period Price per Unit
of Capacity
Current Period Price per Unit of Capacity
X
Actual Units of Capacity on
Prior Period to Produce Current
Period’s Output
CostEffect
OfPrice-
Recovery for Fixed
Costs
=
12-32
Assuming adequate current capacity:
$4.35 per sq cm - $4.28 per sq cm) X 3,750,000 sq cm = $262,500 Unfavorable

Copyright © 2015 Pearson Education, Inc. All Rights Reserved.
Units of Input Required to
Produce Current Period’s Output
in Prior Period
Actual Units of Input used to Produce Current Period Output
X Input Price in Current Period
CostEffect
OfProductivity for Variable
Costs
=
12-33
(2,900,000 sq cm for current period output – 3,450,000 sq cm for current period output in prior period) X $1.50 per sq cm = $825,000 Favorable

Copyright © 2015 Pearson Education, Inc. All Rights Reserved.
Actual Units of Capacity in Prior
Period to Produce Current Period’s Output
Actual Units of Capacity in Current Period
XPrice Per Unit of
Capacity in Current Period
CostEffect
OfProductivity
for Fixed Costs
=
12-34
Assuming adequate current capacity:
(3,500,000 sq cm – 3,750,000 sq cm) X $4.35 per sq cm = $1,087,500 Favorable
Copyright © 2015 Pearson Education, Inc. All Rights Reserved.12-35
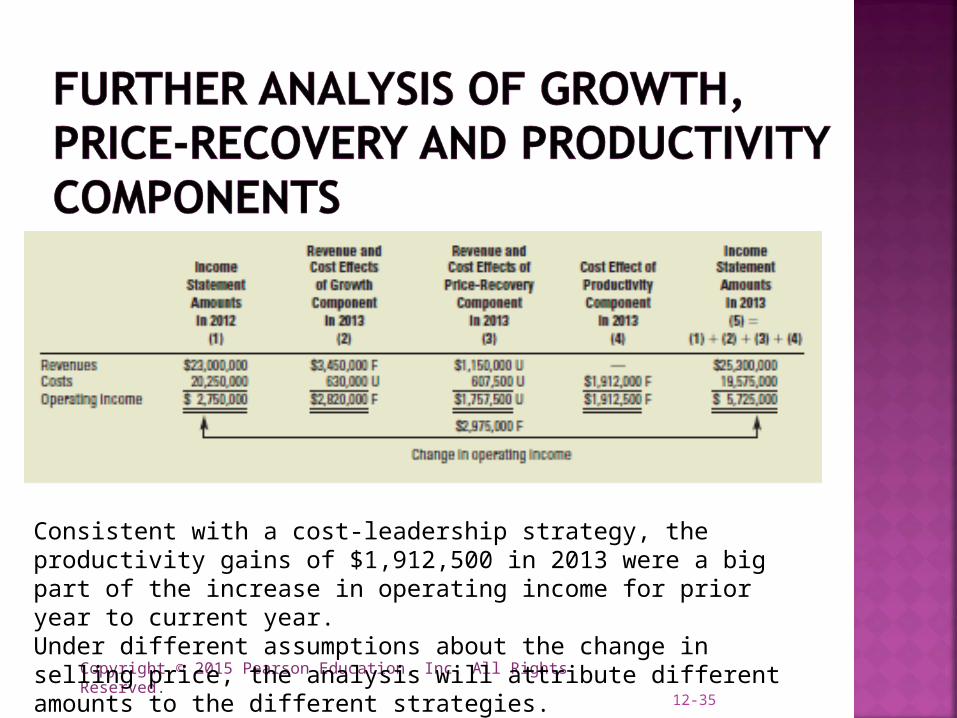
Consistent with a cost-leadership strategy, the productivity gains of $1,912,500 in 2013 were a big part of the increase in operating income for prior year to current year. Under different assumptions about the change in selling price, the analysis will attribute different amounts to the different strategies.

Copyright © 2015 Pearson Education, Inc. All Rights Reserved.
Managers can reduce capacity-based fixed costs by measuring and managing unused capacity.
Unused capacity is the amount of productive capacity available over and above the productive capacity employed to meet consumer demand in the current period.
To better understand this concept of unused capacity, it is necessary to distinguish engineered costs from discretionary costs.
12-36

Copyright © 2015 Pearson Education, Inc. All Rights Reserved.
1. Engineered costs result from a cause-and-effect relationship between the cost driver (output) and the (direct or indirect) resources used to produce that output. Engineered costs have a detailed, physically observable and repetitive relationship with output.
2. Discretionary costs have two important features:1. They arise from periodic (usually annual) decisions
regarding the maximum amount to be incurred.2. They have no measurable cause-and-effect
relationship between output and resources used.
12-37

Copyright © 2015 Pearson Education, Inc. All Rights Reserved.
Downsizing (rightsizing) is an integrated approach of configuring processes, products, and people to match costs to the activities that need to be performed to operate effectively and efficiently in the present and future.
Downsizing often means eliminating jobs, which can adversely affect employee morale and the culture of a company.
12-38
Copyright © 2015 Pearson Education, Inc. All Rights Reserved.
TERMS TO LEARN PAGE NUMBER REFERENCE
Balanced scorecard Page 476
Cost leadership Page 474
Discretionary costs Page 496
Downsizing Page 497
Engineered costs Page 496
Growth component Page 489
Partial productivity Page 503
Price-recovery component Page 489
Product differentiation Page 474
Productivity Page 503
12-39
Copyright © 2015 Pearson Education, Inc. All Rights Reserved.
TERMS TO LEARN PAGE NUMBER REFERENCE
Productivity component Page 489
Reengineering Page 475
Rightsizing Page 497
Strategy map Page 477
Total factor productivity Page 504
Unused capacity Page 496
12-40

Copyright © 2015 Pearson Education, Inc. All Rights Reserved. 41
Recommended