Consumer Staples Company Presentation
Des DudaneyErica ElsasserNeil HertensteinMun Yi Se Tho
May 18th, 2010
Company Comparison PepsiCo Analysis P&G Analysis Recomm-endationsSector Summary
1. Sector Summary2. Company Comparison3. PepsiCo Analysis4. P & G Analysis5. Recommendation
Table of Contents
Company Comparison PepsiCo Analysis P&G Analysis Recomm-endationsSector Summary
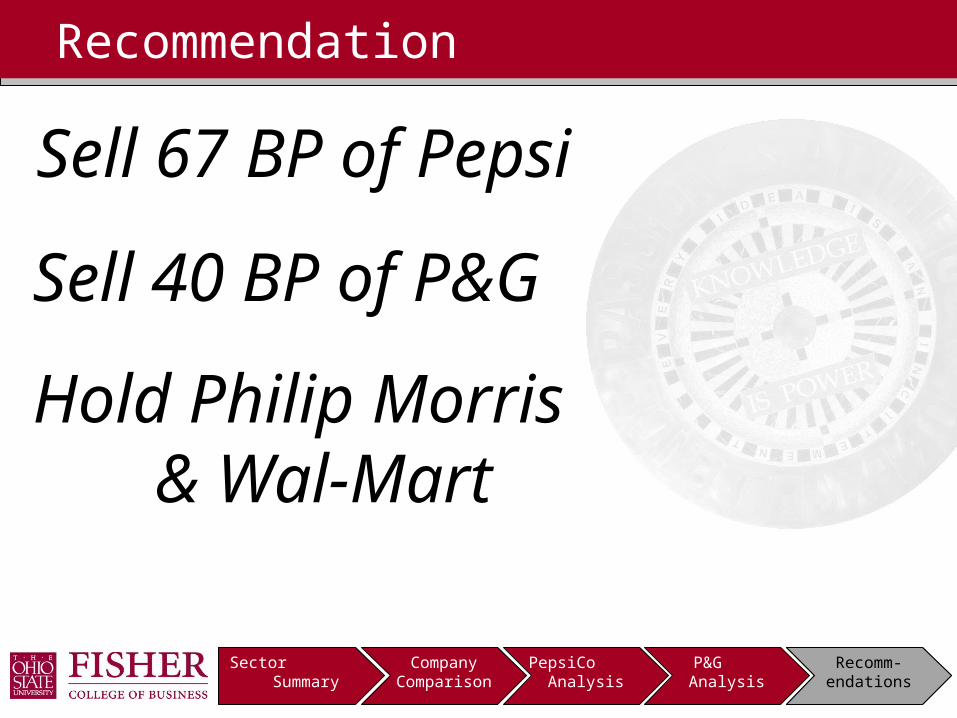
Recommendation
Sell 67 BP of Pepsi
Sell 40 BP of P&G
Hold Philip Morris & Wal-Mart
Recomm-endations

Sector Summary
Company Comparison PepsiCo Analysis P&G Analysis Recomm-endationsSector Summary
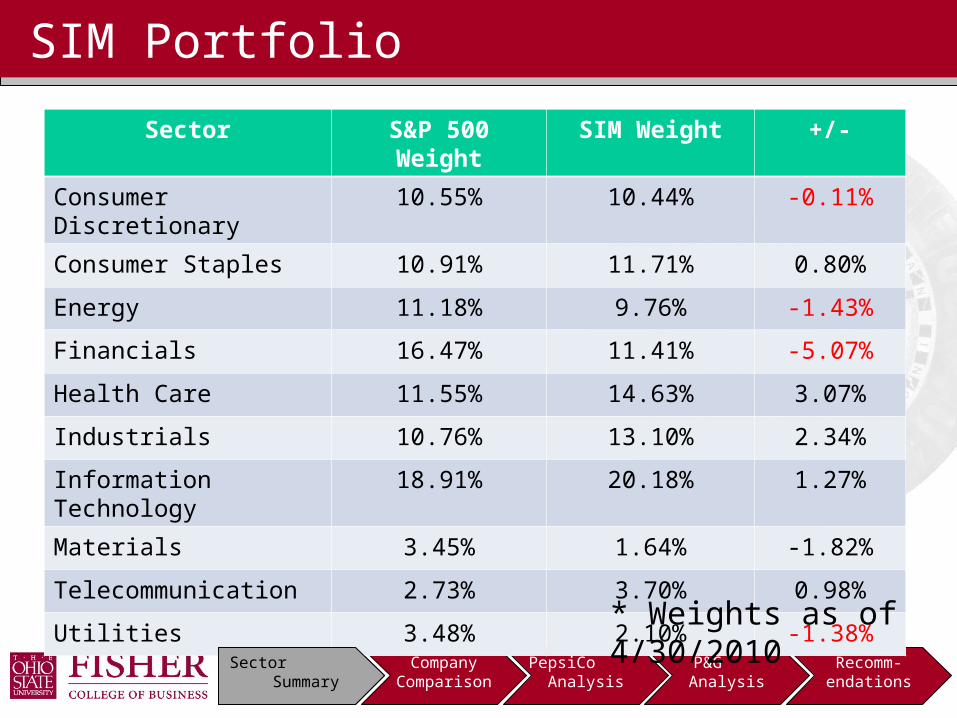
SIM Portfolio
Sector S&P 500 Weight SIM Weight +/-
Consumer Discretionary 10.55% 10.44% -0.11%
Consumer Staples 10.91% 11.71% 0.80%
Energy 11.18% 9.76% -1.43%
Financials 16.47% 11.41% -5.07%
Health Care 11.55% 14.63% 3.07%
Industrials 10.76% 13.10% 2.34%
Information Technology 18.91% 20.18% 1.27%
Materials 3.45% 1.64% -1.82%
Telecommunication 2.73% 3.70% 0.98%
Utilities 3.48% 2.10% -1.38%
* Weights as of 4/30/2010Sector Summary
Company Comparison PepsiCo Analysis P&G Analysis Recomm-endationsSector Summary
CS Sector Recap
Decrease weight of Consumer Staples by 107 basis points Provides a 27 bp underweighting
Defensive sector and lower returns in economic growth
Allows more cyclical sectors to experience higher gains
Sector Summary
Company Comparison PepsiCo Analysis P&G Analysis Recomm-endationsSector Summary
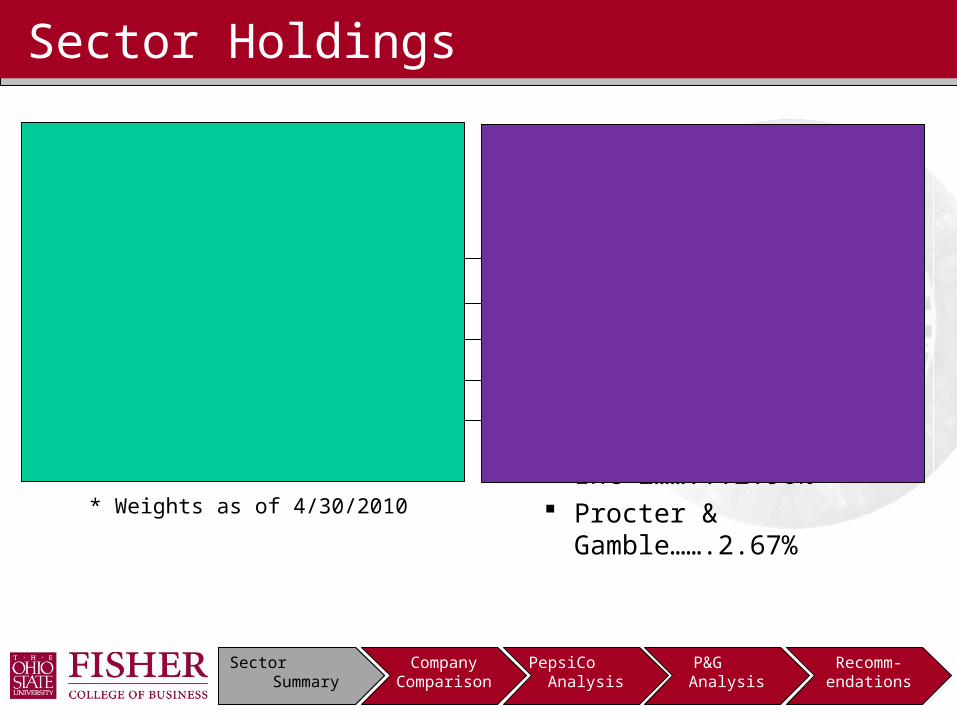
Sector Holdings
Current Holdings
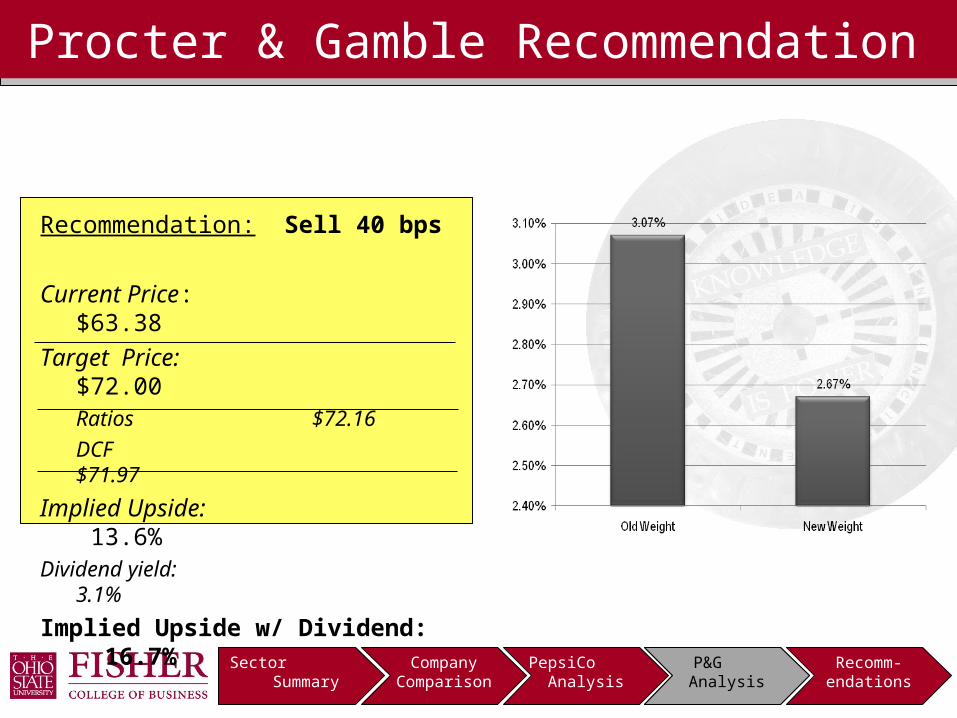
SIM – 11.71% PepsiCo………………2.90% Wal-Mart Stores Inc…2.78% Philip Morris Int’l……..2.96% Procter & Gamble……3.07%
* Weights as of 4/30/2010
Recommended Holdings
SIM – 10.64% PepsiCo……………….2.23% Wal-Mart Stores Inc….2.78% Philip Morris Int’l……...2.96% Procter & Gamble…….2.67%
Sector Summary
Company Comparison PepsiCo Analysis P&G Analysis Recomm-endationsSector Summary
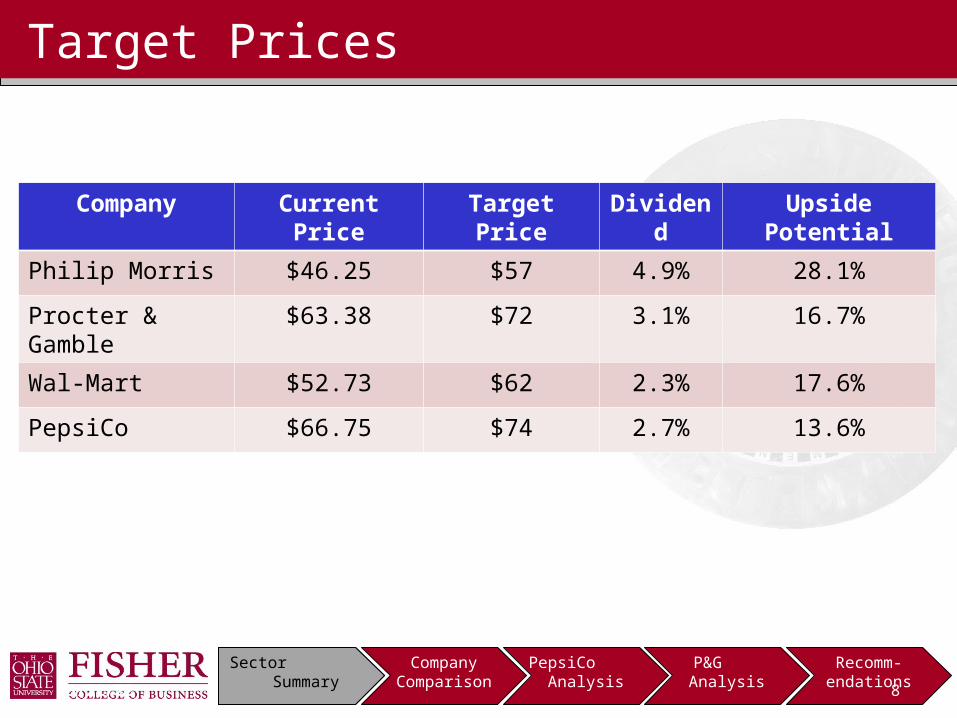
Target Prices
04/20/23 8
Company Current Price Target Price Dividend Upside Potential
Philip Morris $46.25 $57 4.9% 28.1%
Procter & Gamble $63.38 $72 3.1% 16.7%
Wal-Mart $52.73 $62 2.3% 17.6%
PepsiCo $66.75 $74 2.7% 13.6%
Prices as of 5/13/2010
Sector Summary
Company Comparison PepsiCo Analysis P&G Analysis Recomm-endationsSector Summary
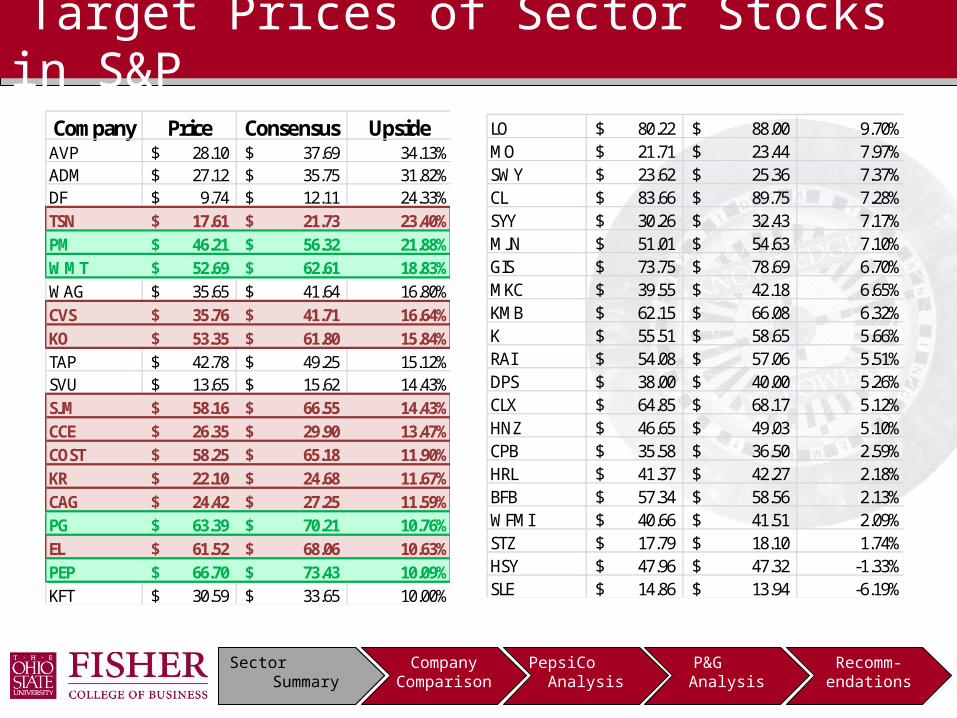
Target Prices of Sector Stocks in S&P
Company Price Consensus UpsideAVP 28.10$ 37.69$ 34.13%ADM 27.12$ 35.75$ 31.82%DF 9.74$ 12.11$ 24.33%TSN 17.61$ 21.73$ 23.40%PM 46.21$ 56.32$ 21.88%WMT 52.69$ 62.61$ 18.83%WAG 35.65$ 41.64$ 16.80%CVS 35.76$ 41.71$ 16.64%KO 53.35$ 61.80$ 15.84%TAP 42.78$ 49.25$ 15.12%SVU 13.65$ 15.62$ 14.43%SJM 58.16$ 66.55$ 14.43%CCE 26.35$ 29.90$ 13.47%COST 58.25$ 65.18$ 11.90%KR 22.10$ 24.68$ 11.67%CAG 24.42$ 27.25$ 11.59%PG 63.39$ 70.21$ 10.76%EL 61.52$ 68.06$ 10.63%PEP 66.70$ 73.43$ 10.09%KFT 30.59$ 33.65$ 10.00%
LO 80.22$ 88.00$ 9.70%MO 21.71$ 23.44$ 7.97%SWY 23.62$ 25.36$ 7.37%CL 83.66$ 89.75$ 7.28%SYY 30.26$ 32.43$ 7.17%MJN 51.01$ 54.63$ 7.10%GIS 73.75$ 78.69$ 6.70%MKC 39.55$ 42.18$ 6.65%KMB 62.15$ 66.08$ 6.32%K 55.51$ 58.65$ 5.66%RAI 54.08$ 57.06$ 5.51%DPS 38.00$ 40.00$ 5.26%CLX 64.85$ 68.17$ 5.12%HNZ 46.65$ 49.03$ 5.10%CPB 35.58$ 36.50$ 2.59%HRL 41.37$ 42.27$ 2.18%BFB 57.34$ 58.56$ 2.13%WFMI 40.66$ 41.51$ 2.09%STZ 17.79$ 18.10$ 1.74%HSY 47.96$ 47.32$ -1.33%SLE 14.86$ 13.94$ -6.19%
Sector Summary
Company Information
Company Comparison PepsiCo Analysis P&G Analysis Recomm-endationsSector Summary
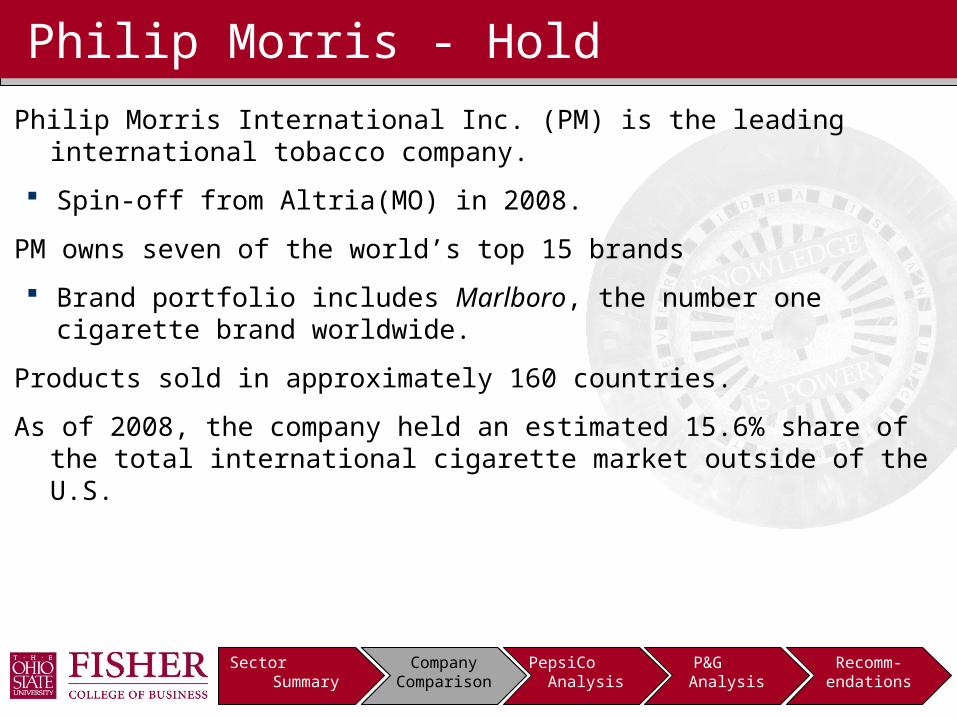
Philip Morris - Hold
Philip Morris International Inc. (PM) is the leading international tobacco company.
Spin-off from Altria(MO) in 2008.
PM owns seven of the world’s top 15 brands
Brand portfolio includes Marlboro, the number one cigarette brand worldwide.
Products sold in approximately 160 countries.
As of 2008, the company held an estimated 15.6% share of the total international cigarette market outside of the U.S.
Company Comparison
Company Comparison PepsiCo Analysis P&G Analysis Recomm-endationsSector Summary
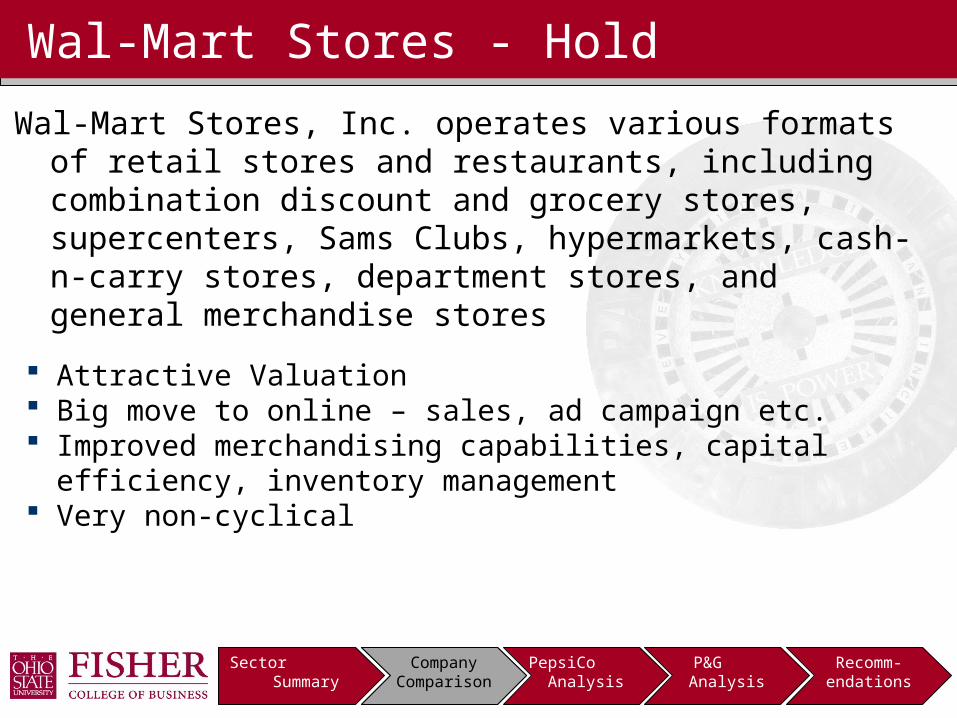
Wal-Mart Stores - Hold
Wal-Mart Stores, Inc. operates various formats of retail stores and restaurants, including combination discount and grocery stores, supercenters, Sams Clubs, hypermarkets, cash-n-�carry stores, department stores, and general merchandise stores
Attractive Valuation Big move to online – sales, ad campaign etc. Improved merchandising capabilities, capital efficiency, inventory
management Very non-cyclical
Company Comparison
Company Comparison PepsiCo Analysis P&G Analysis Recomm-endationsSector Summary
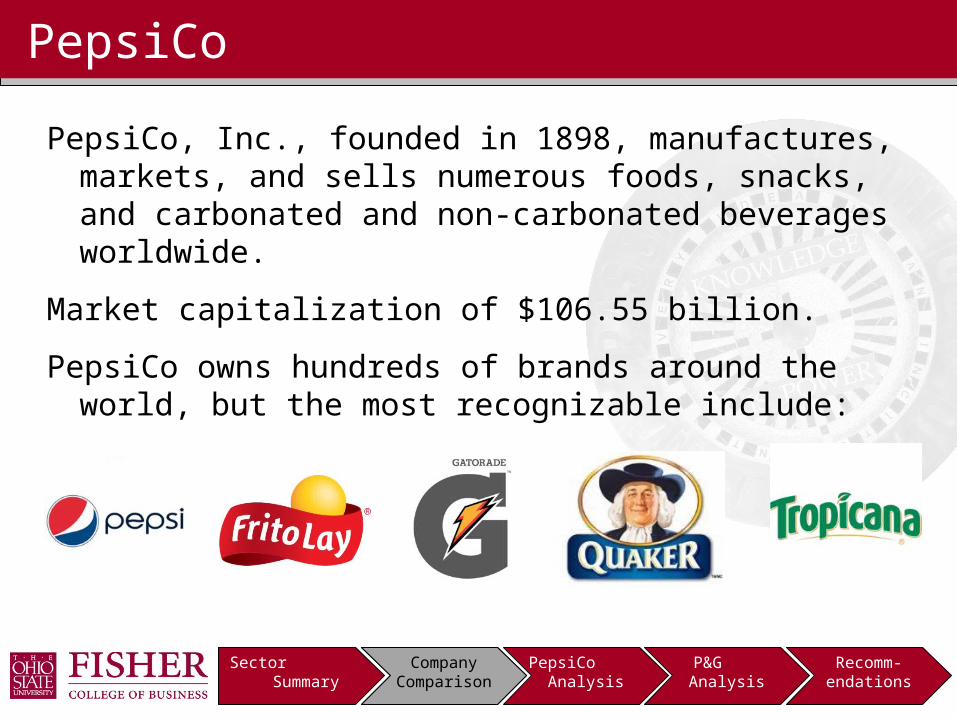
PepsiCo
PepsiCo, Inc., founded in 1898, manufactures, markets, and sells numerous foods, snacks, and carbonated and non-carbonated beverages worldwide.
Market capitalization of $106.55 billion.
PepsiCo owns hundreds of brands around the world, but the most recognizable include:
Company Comparison
Company Comparison PepsiCo Analysis P&G Analysis Recomm-endationsSector Summary
Procter & Gamble
The Procter & Gamble Company (P&G), founded in 1837, engages in the manufacture and sale of consumer goods worldwide.
The company operates in 3 global business units: Beauty
Health and Well-Being
Household Care
Products are sold in over 180 countries worldwide
Company Comparison
PepsiCo Analysis
Company Comparison PepsiCo Analysis P&G Analysis Recomm-endationsSector Summary
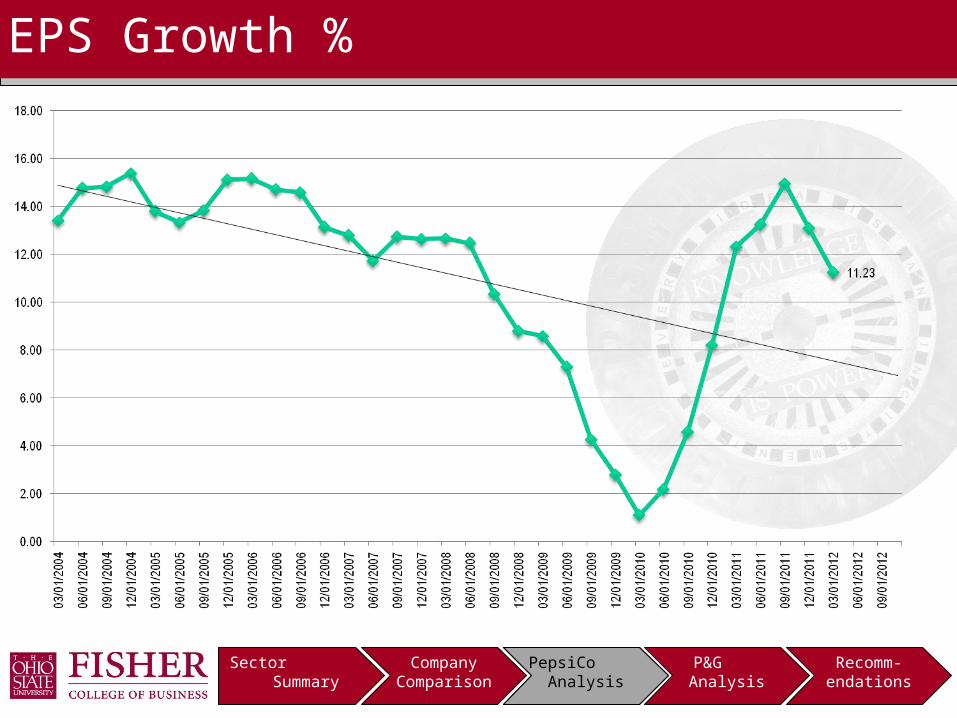
•EPS is expected to increase, but remain significantly lower than before.
EPS Growth %
PepsiCo Analysis
Company Comparison PepsiCo Analysis P&G Analysis Recomm-endationsSector Summary
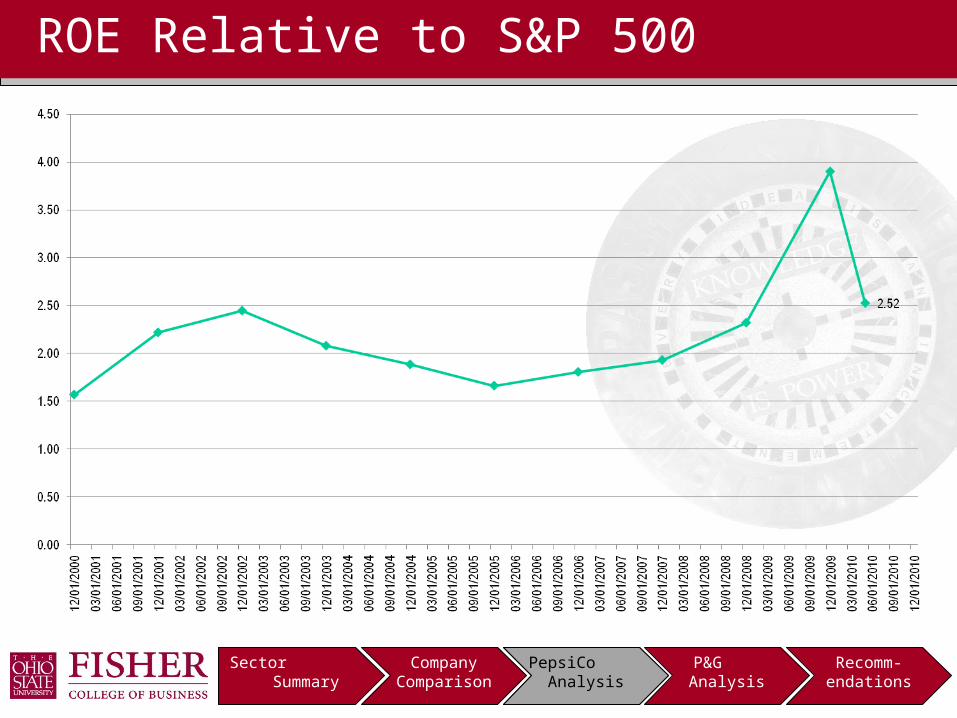
•ROE has been on a slight upward trend, but is expected to decrease.
ROE Relative to S&P 500
PepsiCo Analysis
Company Comparison PepsiCo Analysis P&G Analysis Recomm-endationsSector Summary
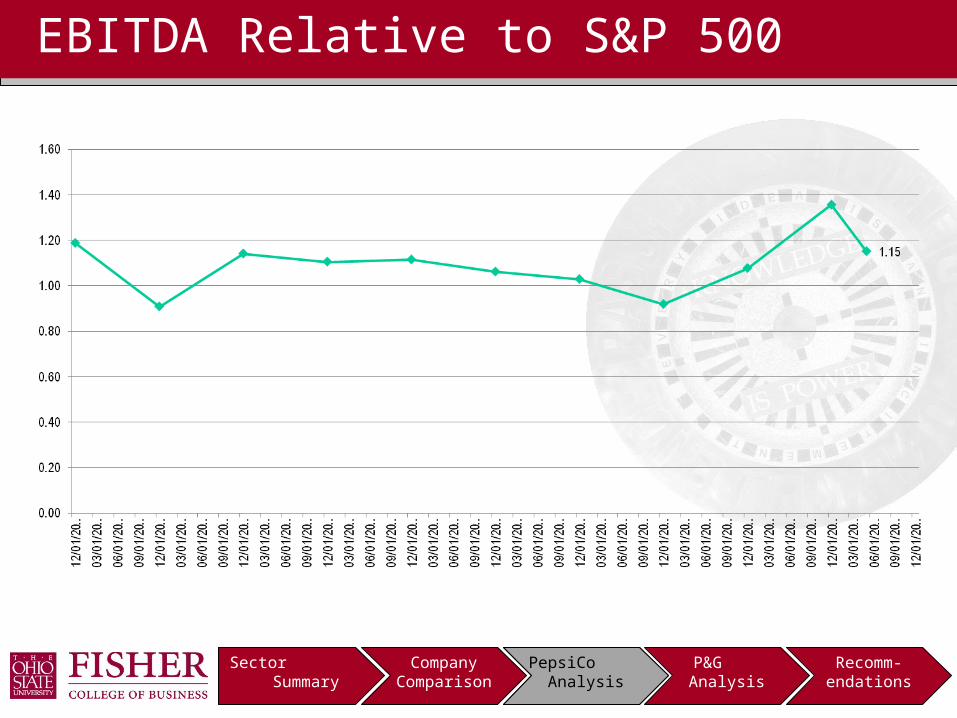
•EBITDA Margin is expected to decrease.
EBITDA Relative to S&P 500
PepsiCo Analysis
Company Comparison PepsiCo Analysis P&G Analysis Recomm-endationsSector Summary
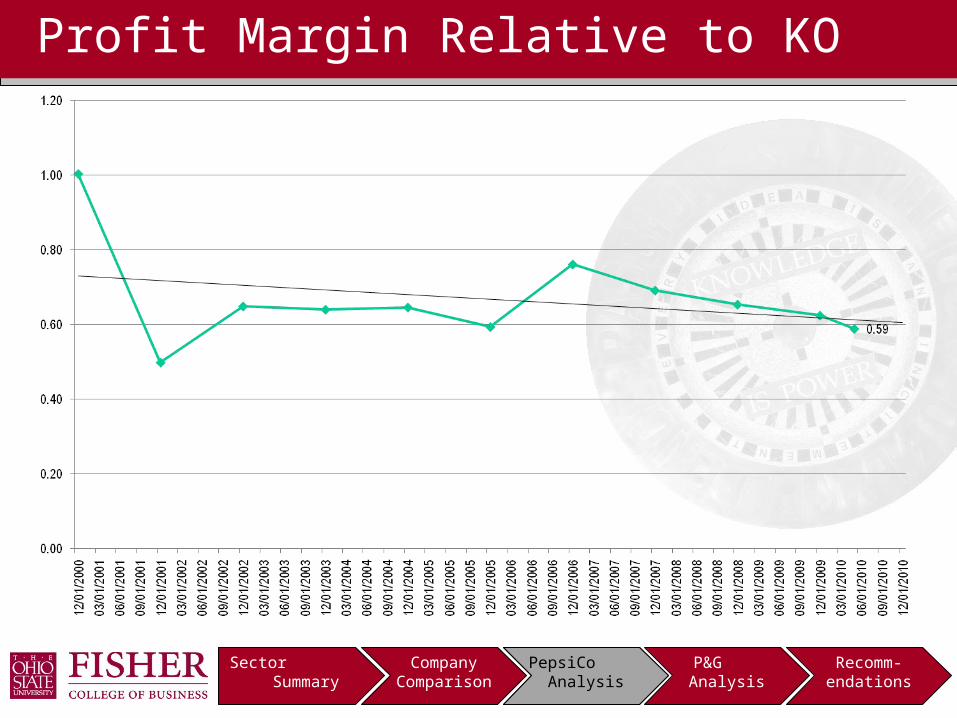
•Net profit margin is lower than Coca-Cola’s.
Profit Margin Relative to KO
PepsiCo Analysis
Company Comparison PepsiCo Analysis P&G Analysis Recomm-endationsSector Summary
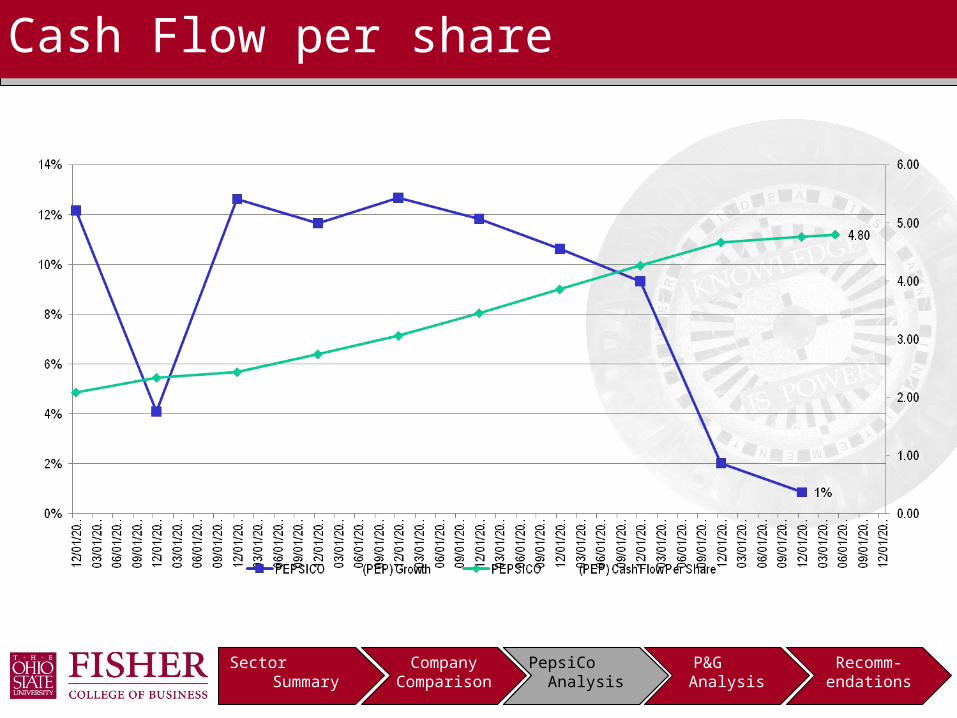
Cash Flow per share
PepsiCo Analysis
Company Comparison PepsiCo Analysis P&G Analysis Recomm-endationsSector Summary
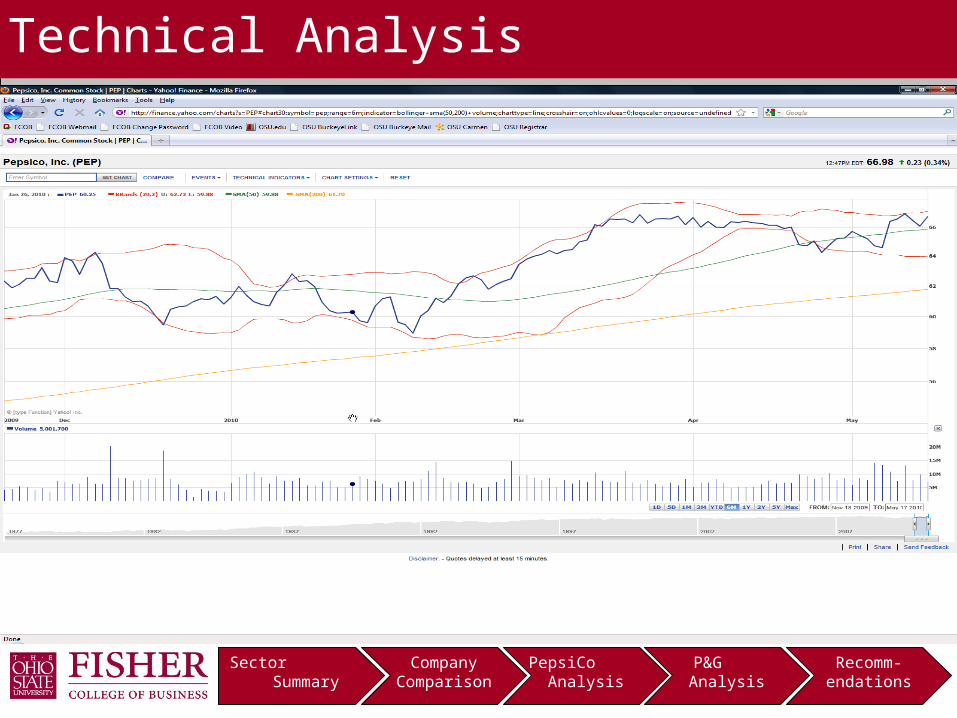
Technical Analysis
Company Comparison PepsiCo Analysis P&G Analysis Recomm-endationsSector Summary
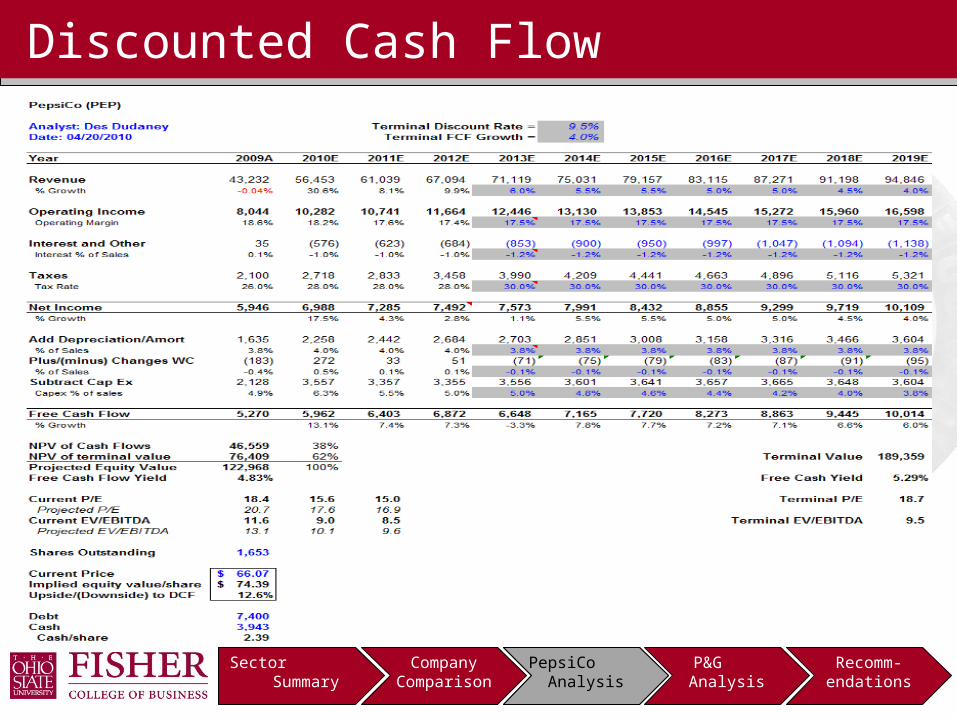
Discounted Cash Flow
PepsiCo Analysis
Company Comparison PepsiCo Analysis P&G Analysis Recomm-endationsSector Summary
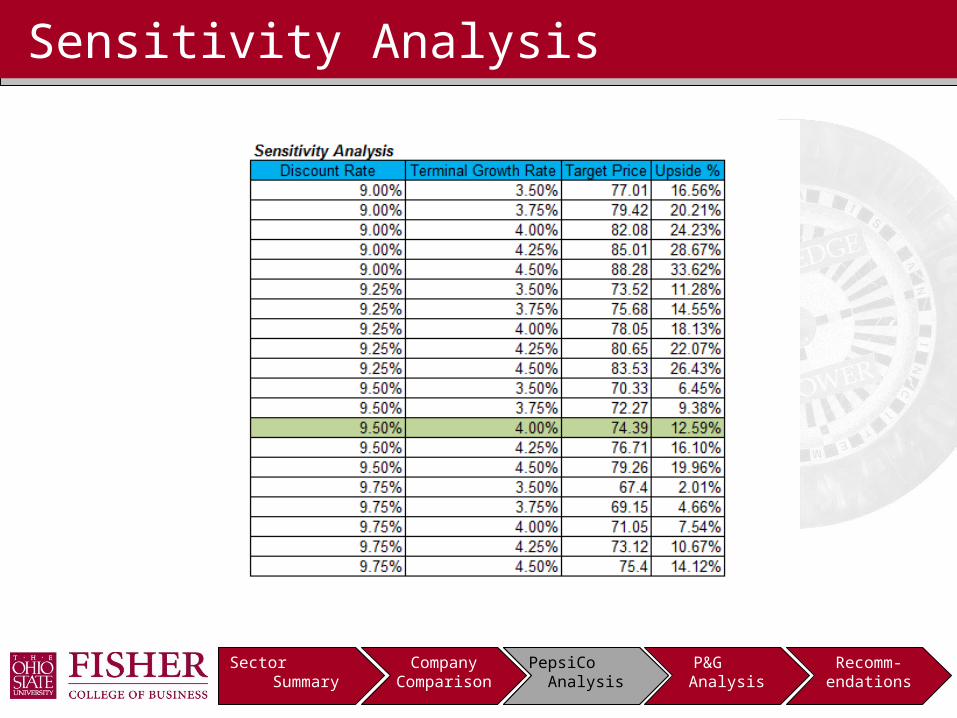
Sensitivity Analysis
PepsiCo Analysis
Company Comparison PepsiCo Analysis P&G Analysis Recomm-endationsSector Summary
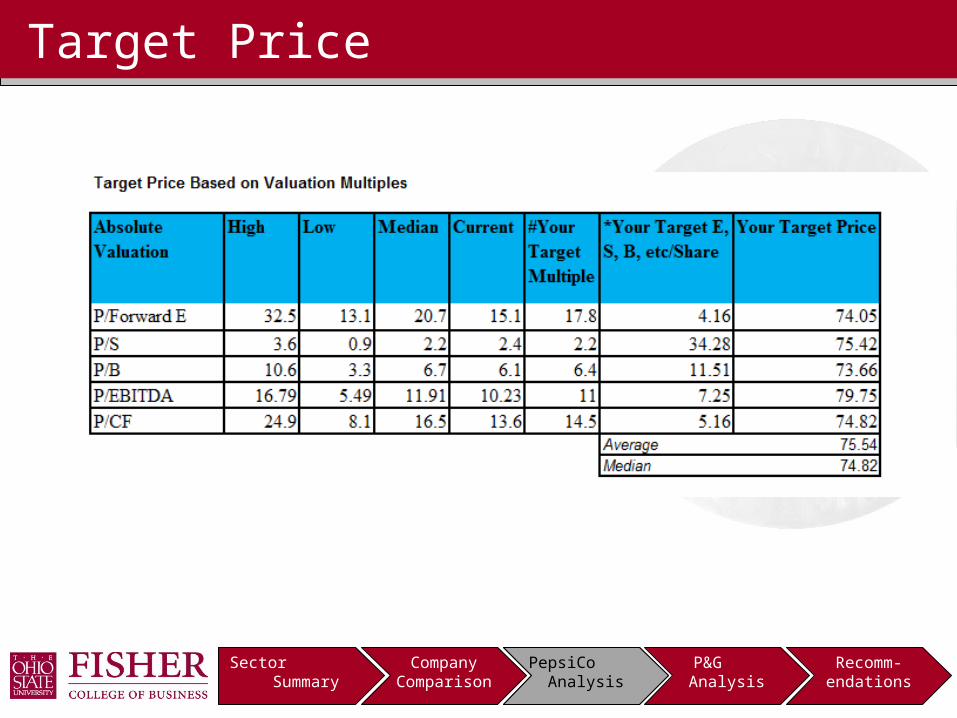
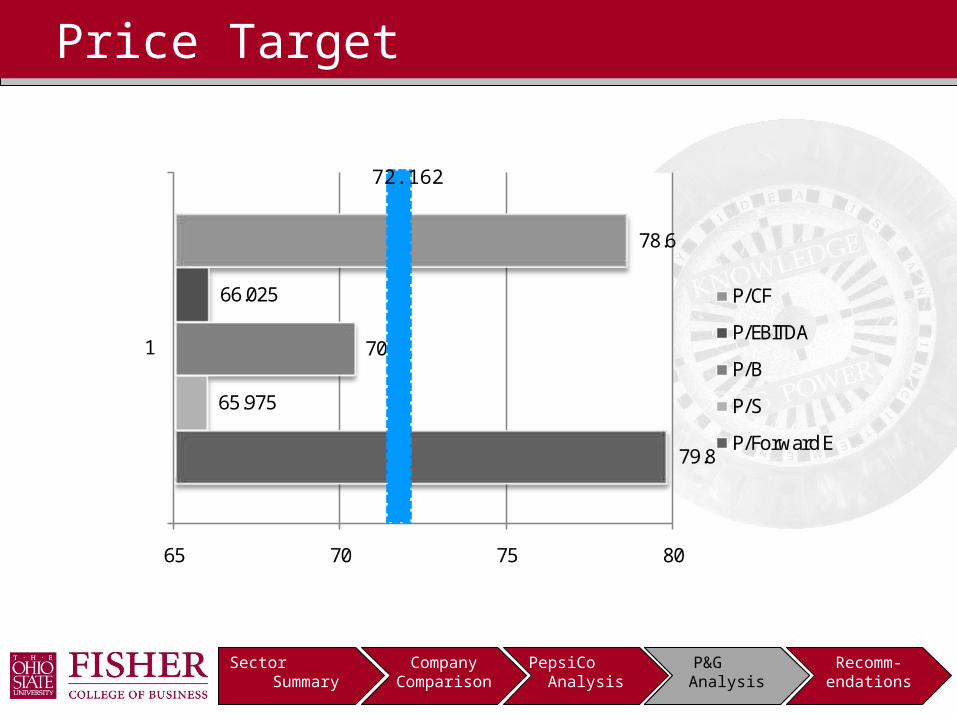
Target Price
PepsiCo Analysis
Company Comparison PepsiCo Analysis P&G Analysis Recomm-endationsSector Summary
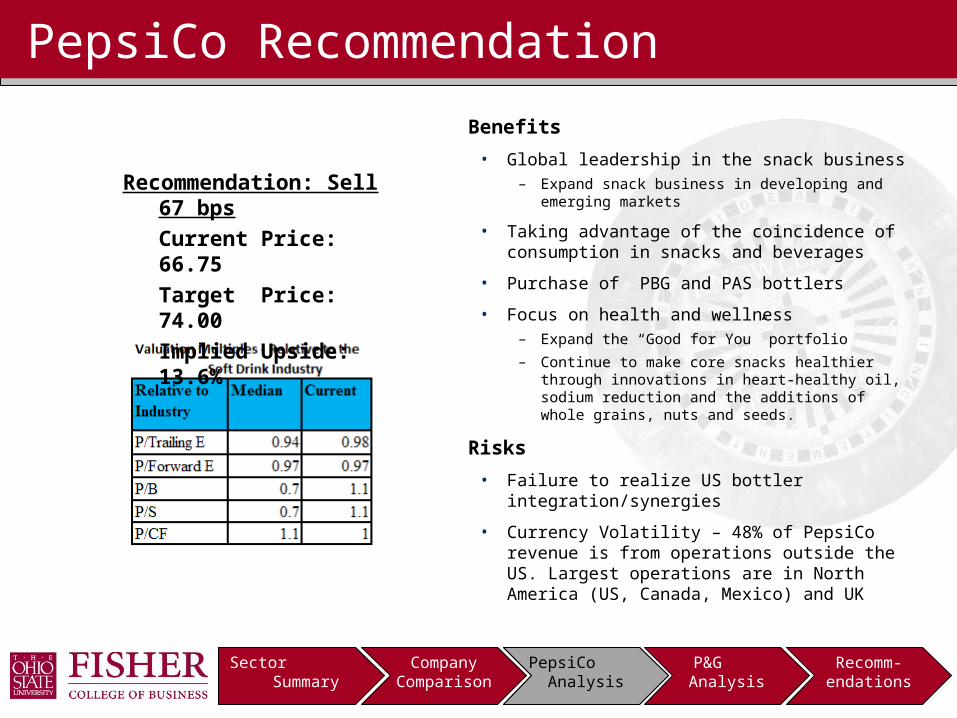
PepsiCo Recommendation
Benefits
• Global leadership in the snack business – Expand snack business in developing and emerging
markets
• Taking advantage of the coincidence of consumption in snacks and beverages
• Purchase of PBG and PAS bottlers
• Focus on health and wellness– Expand the “Good for You” portfolio– Continue to make core snacks healthier through
innovations in heart-healthy oil, sodium reduction and the additions of whole grains, nuts and seeds.
Risks
• Failure to realize US bottler integration/synergies
• Currency Volatility – 48% of PepsiCo revenue is from operations outside the US. Largest operations are in North America (US, Canada, Mexico) and UK
Recommendation: Sell 67 bps
Current Price: 66.75
Target Price: 74.00
Implied Upside: 13.6%
PepsiCo Analysis
Procter & Gamble Analysis
Company Comparison PepsiCo Analysis P&G Analysis Recomm-endationsSector Summary
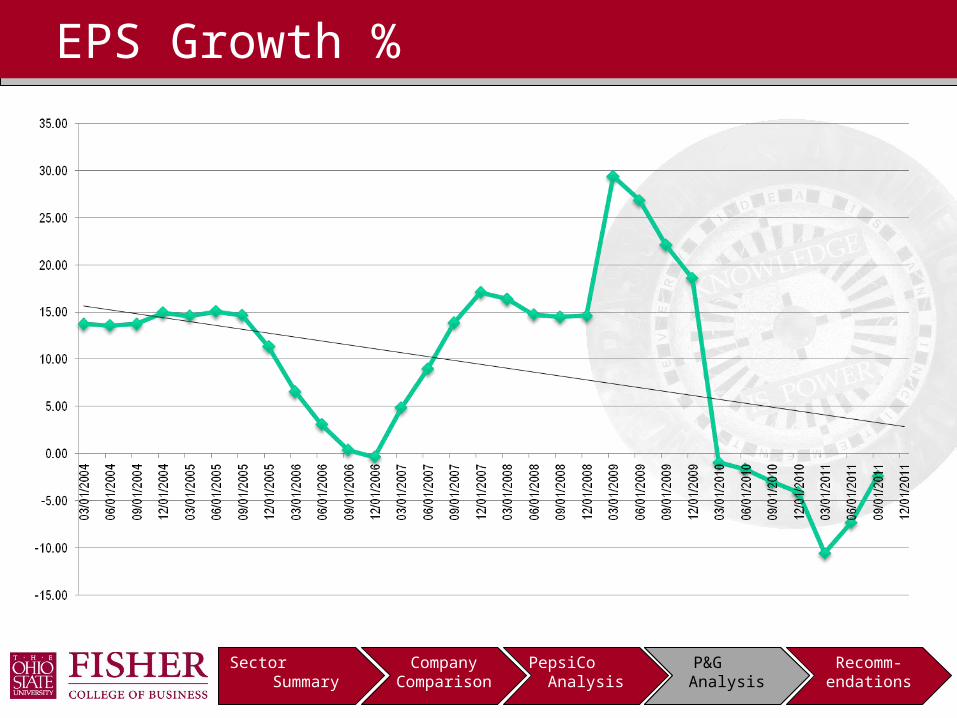
•EPS growth is expected to remain negative.
EPS Growth %
P&G Analysis
Company Comparison PepsiCo Analysis P&G Analysis Recomm-endationsSector Summary
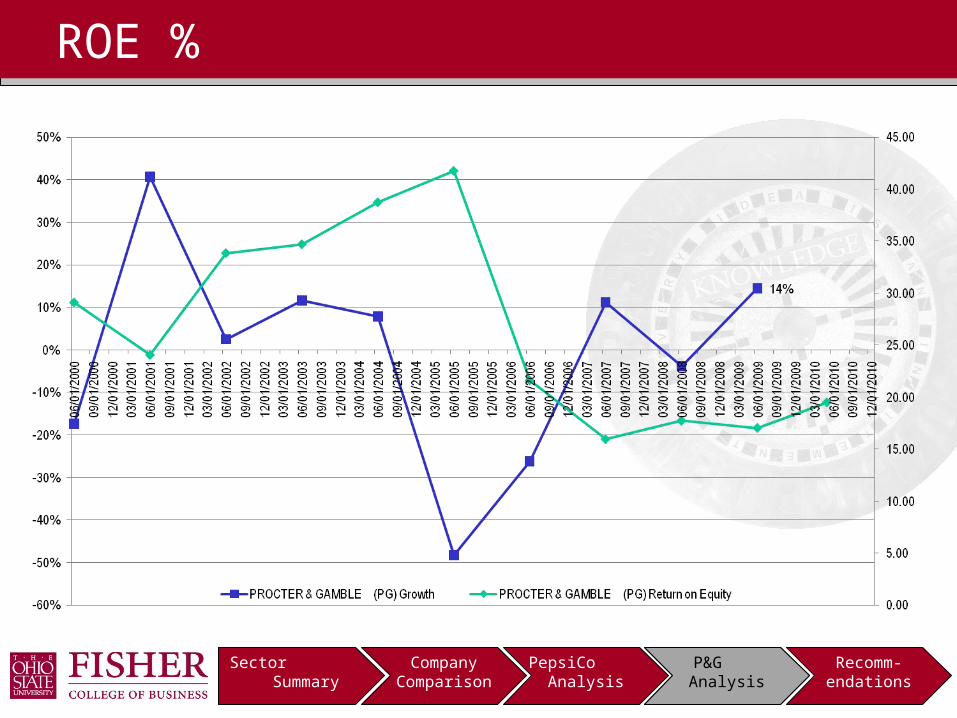
•ROE is at low levels of the decade.
ROE %
P&G Analysis
Company Comparison PepsiCo Analysis P&G Analysis Recomm-endationsSector Summary
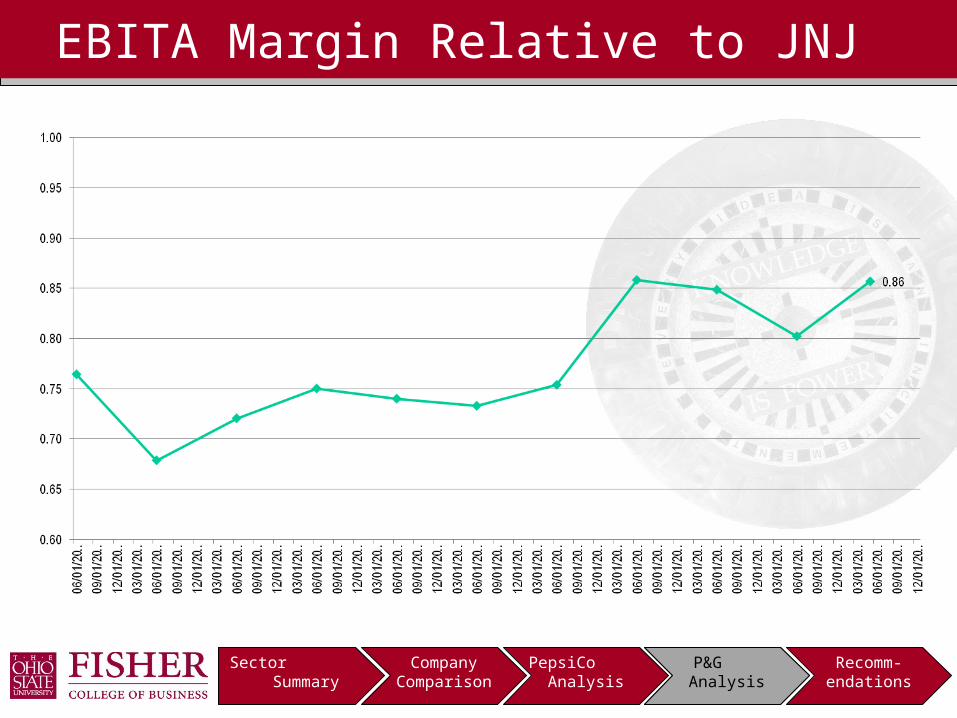
•EBITDA margin is below JNJ.
EBITA Margin Relative to JNJ
P&G Analysis
Company Comparison PepsiCo Analysis P&G Analysis Recomm-endationsSector Summary
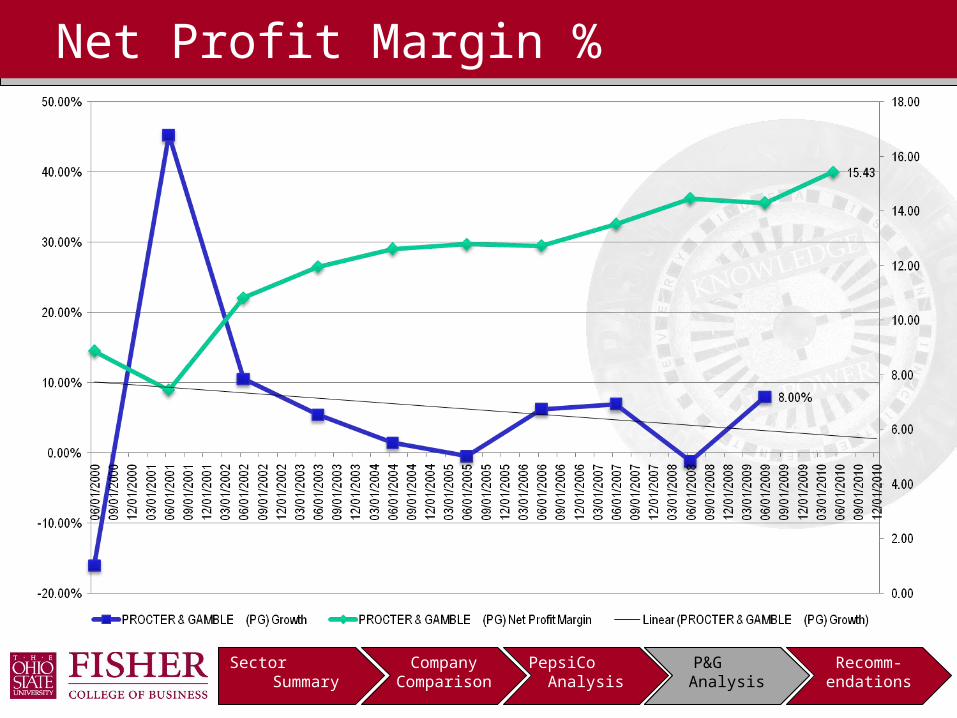
•Net Profit Margin has low growth rate and is expected to remain so.
Net Profit Margin %
P&G Analysis
Company Comparison PepsiCo Analysis P&G Analysis Recomm-endationsSector Summary
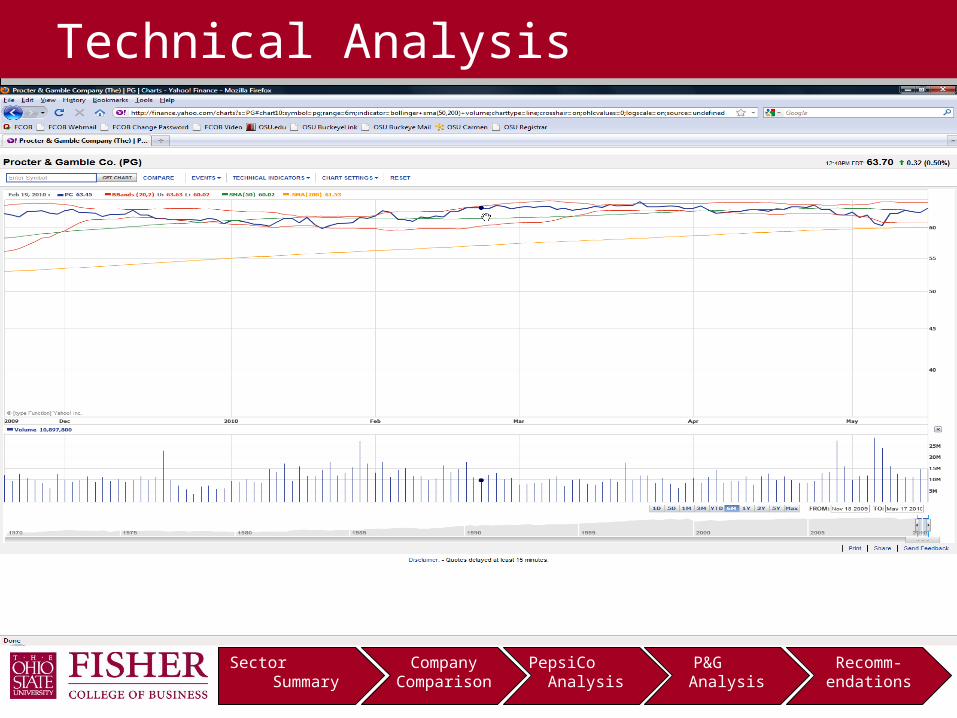
Technical Analysis
Company Comparison PepsiCo Analysis P&G Analysis Recomm-endationsSector Summary
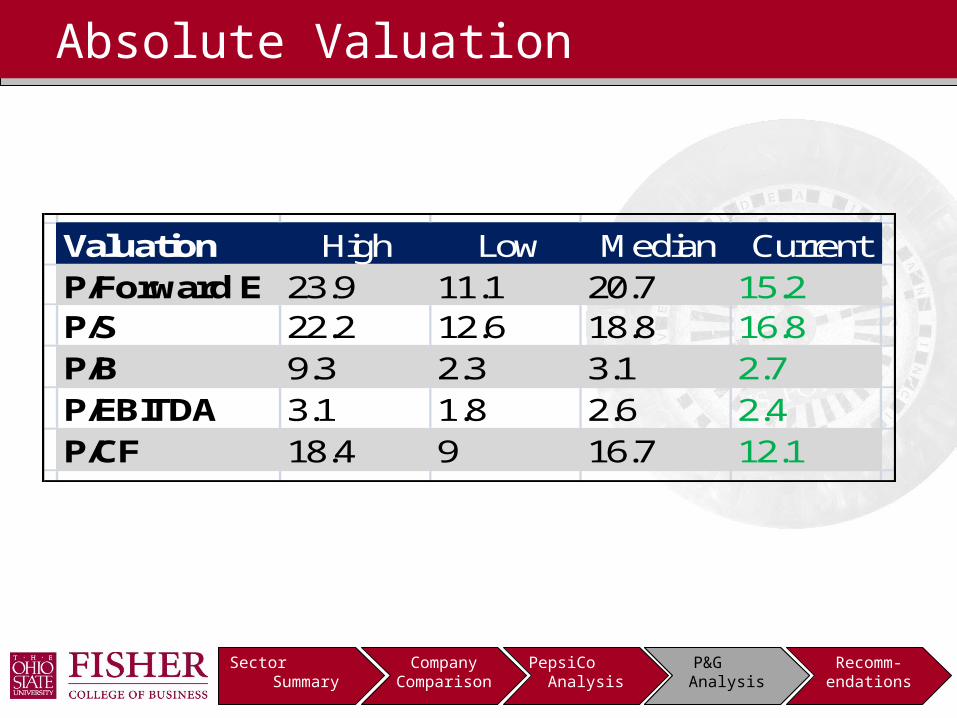
Absolute Valuation
Valuation High Low Median CurrentP/Forward E 23.9 11.1 20.7 15.2P/S 22.2 12.6 18.8 16.8P/B 9.3 2.3 3.1 2.7P/EBITDA 3.1 1.8 2.6 2.4P/CF 18.4 9 16.7 12.1
P&G Analysis
Company Comparison PepsiCo Analysis P&G Analysis Recomm-endationsSector Summary
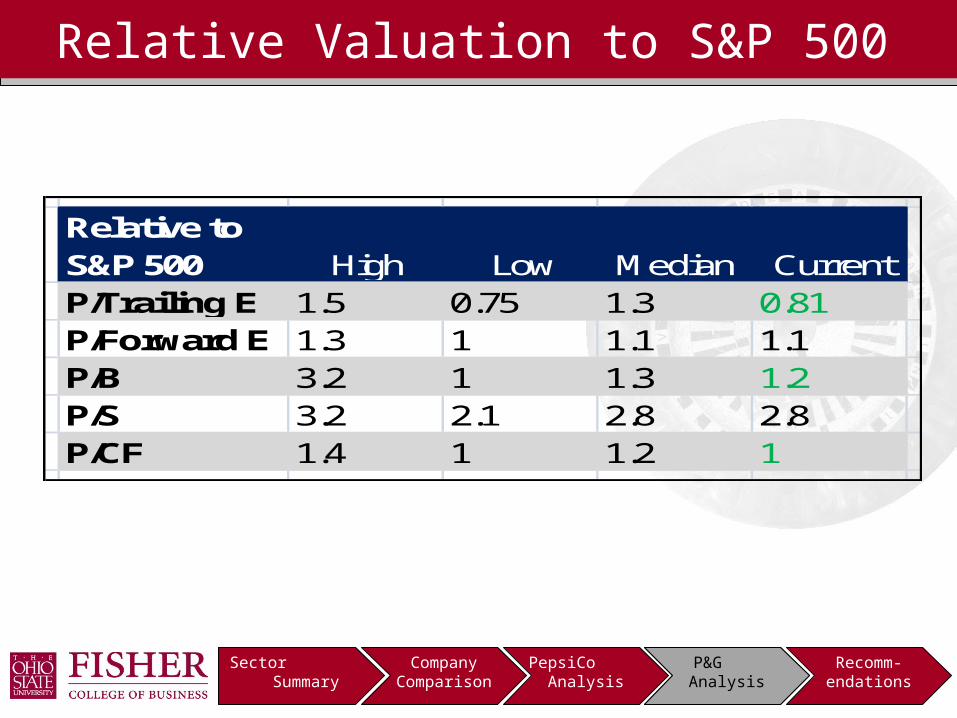
Relative Valuation to S&P 500
Relative to S&P 500 High Low Median CurrentP/Trailing E 1.5 0.75 1.3 0.81P/Forward E 1.3 1 1.1 1.1P/B 3.2 1 1.3 1.2P/S 3.2 2.1 2.8 2.8P/CF 1.4 1 1.2 1
P&G Analysis
Company Comparison PepsiCo Analysis P&G Analysis Recomm-endationsSector Summary
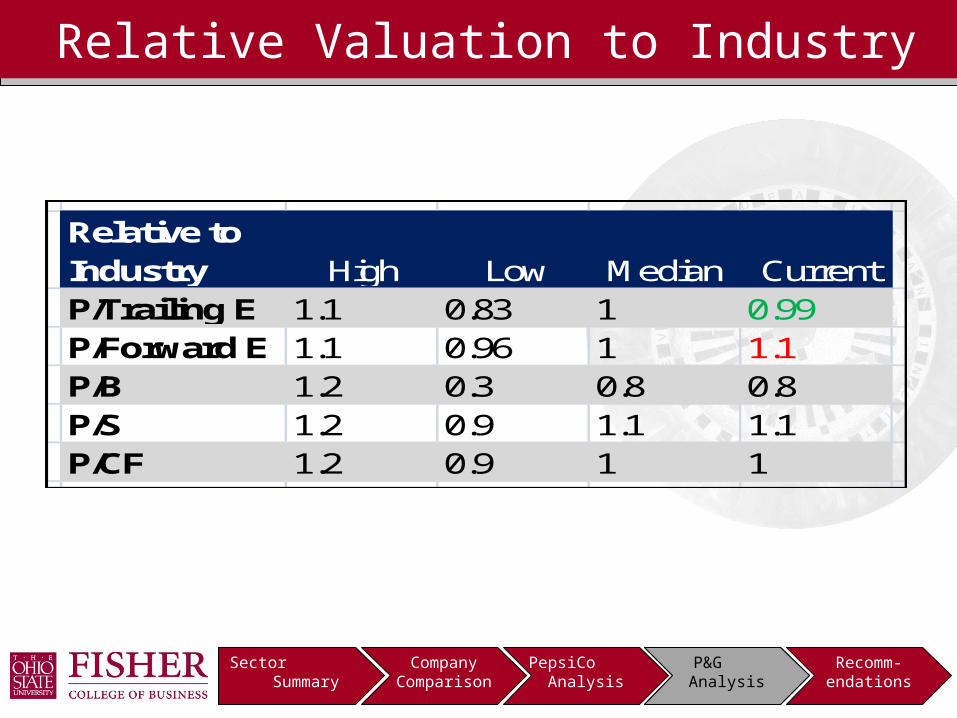
Relative Valuation to Industry
Relative to Industry High Low Median CurrentP/Trailing E 1.1 0.83 1 0.99P/Forward E 1.1 0.96 1 1.1P/B 1.2 0.3 0.8 0.8P/S 1.2 0.9 1.1 1.1P/CF 1.2 0.9 1 1
P&G Analysis
Company Comparison PepsiCo Analysis P&G Analysis Recomm-endationsSector Summary
78.6
70.41
66.025
65.975
79.8
65 70 75 80
1
P/CF
P/EBITDA
P/B
P/S
P/Forward E
72.162
Price Target
P&G Analysis
Company Comparison PepsiCo Analysis P&G Analysis Recomm-endationsSector Summary
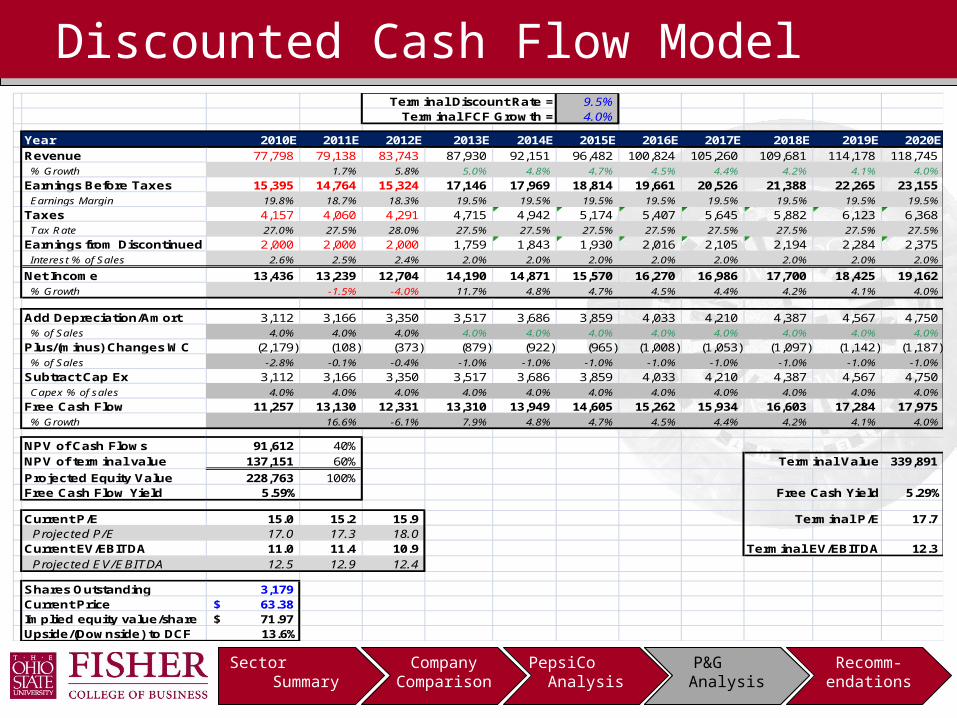
Terminal Discount Rate = 9.5%Terminal FCF Growth = 4.0%
Year 2010E 2011E 2012E 2013E 2014E 2015E 2016E 2017E 2018E 2019E 2020ERevenue 77,798 79,138 83,743 87,930 92,151 96,482 100,824 105,260 109,681 114,178 118,745 % Growth 1.7% 5.8% 5.0% 4.8% 4.7% 4.5% 4.4% 4.2% 4.1% 4.0%
Earnings Before Taxes 15,395 14,764 15,324 17,146 17,969 18,814 19,661 20,526 21,388 22,265 23,155 Earnings Margin 19.8% 18.7% 18.3% 19.5% 19.5% 19.5% 19.5% 19.5% 19.5% 19.5% 19.5%
Taxes 4,157 4,060 4,291 4,715 4,942 5,174 5,407 5,645 5,882 6,123 6,368 Tax Rate 27.0% 27.5% 28.0% 27.5% 27.5% 27.5% 27.5% 27.5% 27.5% 27.5% 27.5%
Earnings from Discontinued 2,000 2,000 2,000 1,759 1,843 1,930 2,016 2,105 2,194 2,284 2,375 Interest % of Sales 2.6% 2.5% 2.4% 2.0% 2.0% 2.0% 2.0% 2.0% 2.0% 2.0% 2.0%
Net Income 13,436 13,239 12,704 14,190 14,871 15,570 16,270 16,986 17,700 18,425 19,162 % Growth -1.5% -4.0% 11.7% 4.8% 4.7% 4.5% 4.4% 4.2% 4.1% 4.0%
Add Depreciation/Amort 3,112 3,166 3,350 3,517 3,686 3,859 4,033 4,210 4,387 4,567 4,750 % of Sales 4.0% 4.0% 4.0% 4.0% 4.0% 4.0% 4.0% 4.0% 4.0% 4.0% 4.0%
Plus/(minus) Changes WC (2,179) (108) (373) (879) (922) (965) (1,008) (1,053) (1,097) (1,142) (1,187) % of Sales -2.8% -0.1% -0.4% -1.0% -1.0% -1.0% -1.0% -1.0% -1.0% -1.0% -1.0%
Subtract Cap Ex 3,112 3,166 3,350 3,517 3,686 3,859 4,033 4,210 4,387 4,567 4,750 Capex % of sales 4.0% 4.0% 4.0% 4.0% 4.0% 4.0% 4.0% 4.0% 4.0% 4.0% 4.0%
Free Cash Flow 11,257 13,130 12,331 13,310 13,949 14,605 15,262 15,934 16,603 17,284 17,975 % Growth 16.6% -6.1% 7.9% 4.8% 4.7% 4.5% 4.4% 4.2% 4.1% 4.0%
NPV of Cash Flows 91,612 40%NPV of terminal value 137,151 60% Terminal Value 339,891
Projected Equity Value 228,763 100%Free Cash Flow Yield 5.59% Free Cash Yield 5.29%
Current P/E 15.0 15.2 15.9 Terminal P/E 17.7 Projected P/E 17.0 17.3 18.0 Current EV/EBITDA 11.0 11.4 10.9 Terminal EV/EBITDA 12.3 Projected EV/EBITDA 12.5 12.9 12.4
Shares Outstanding 3,179 Current Price 63.38$ Implied equity value/share 71.97$ Upside/(Downside) to DCF 13.6%
Discounted Cash Flow Model
P&G Analysis
Company Comparison PepsiCo Analysis P&G Analysis Recomm-endationsSector Summary
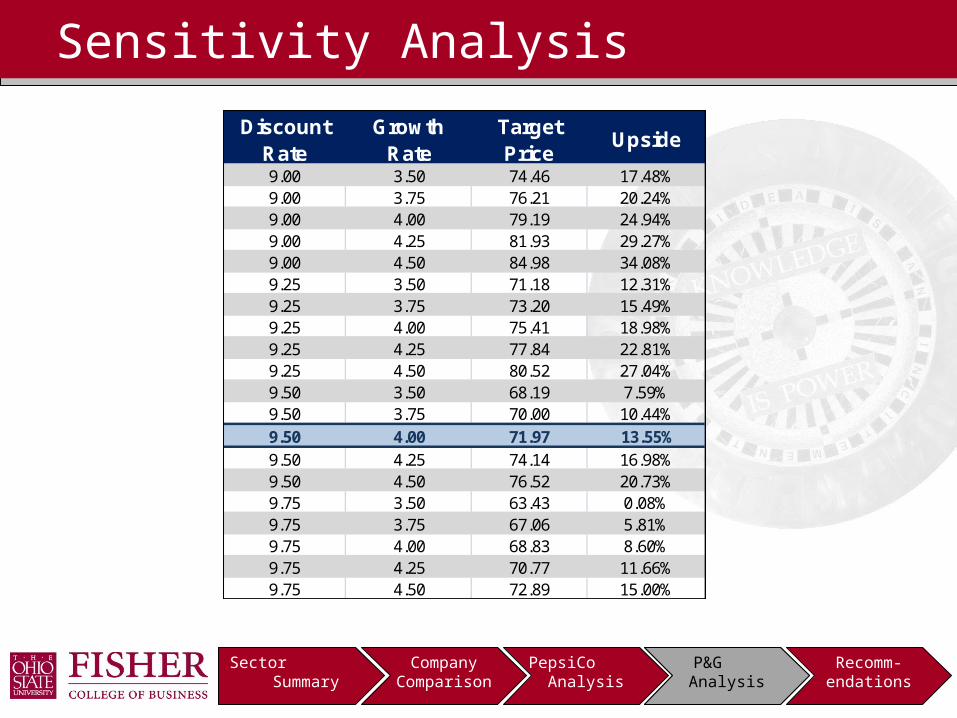
Sensitivity Analysis
Discount Rate
Growth Rate
Target Price
Upside
9.00 3.50 74.46 17.48%9.00 3.75 76.21 20.24%9.00 4.00 79.19 24.94%9.00 4.25 81.93 29.27%9.00 4.50 84.98 34.08%9.25 3.50 71.18 12.31%9.25 3.75 73.20 15.49%9.25 4.00 75.41 18.98%9.25 4.25 77.84 22.81%9.25 4.50 80.52 27.04%9.50 3.50 68.19 7.59%9.50 3.75 70.00 10.44%9.50 4.00 71.97 13.55%9.50 4.25 74.14 16.98%9.50 4.50 76.52 20.73%9.75 3.50 63.43 0.08%9.75 3.75 67.06 5.81%9.75 4.00 68.83 8.60%9.75 4.25 70.77 11.66%9.75 4.50 72.89 15.00%
P&G Analysis
Company Comparison PepsiCo Analysis P&G Analysis Recomm-endationsSector Summary
Procter & Gamble Recommendation
Recommendation: Sell 40 bps
Current Price: $63.38
Target Price: $72.00Ratios $72.16
DCF $71.97
Implied Upside: 13.6%
Dividend yield: 3.1%
Implied Upside w/ Dividend: 16.7% P&G Analysis
Company Comparison PepsiCo Analysis P&G Analysis Recomm-endationsSector Summary P&G Analysis
Benefits
• International initiative
• Product Expansion
• Product leadership
• Increased Advertising
• Very defensive
• Consistent dividends
Procter & Gamble Risks and Benefits
Risks
• Currency Volatility
• Pampers Lawsuit
• Changes in consumer spending
• Lower upside relative to other consumer staple companies

Recommendations
Company Comparison PepsiCo Analysis P&G Analysis Recomm-endationsSector Summary
Stock Recommendation
Sell 107 bp Sell 67 bp of Pepsi
Sell 40 bp of Procter & Gamble
Limited potential upside in both stocks
Hold Wal-Mart and Philip Morris due to high upside
Sale of 107 bp in our sector will allow other sectors to utilize it to gain better returns for the portfolio
Risks Sale of 107 bp will leave the portfolio less defensive should the
economy decline again
Recomm-endations

Questions?
Recommended