Embed Size (px)
Citation preview
Barclays Global Consumer Staples Conference
September 6-8, 2016 Boston 1
Forward-Looking Statements
This presentation includes forward-looking statements including, but not limited to, statements regarding Coca-Colaİçecek’s (“CCI”) plans, objectives, expectations and intentions and other statements that are not historical facts.Forward-looking statements can generally be identified by the use of words such as “may,” “will,” “expect,” “intend,”“estimate,” “anticipate,” “plan,” “target,” “believe” or other words of similar meaning. These forward-looking statementsreflect the current views and assumptions of management and are inherently subject to significant business, economicand other risks and uncertainties. Although management believes the expectations reflected in the forward-lookingstatements are reasonable, at this time, you should not place undue reliance on such forward-looking statements.Important factors that could cause actual results to differ materially from CCI’s expectations include, without limitation:changes in CCI’s relationship with The Coca-Cola Company and its exercise of its rights under our bottler's agreements;CCI’s ability to maintain and improve its competitive position in its markets; CCI’s ability to obtain raw materials andpackaging materials at reasonable prices; changes in CCI’s relationship with its significant shareholders; the level ofdemand for its products in its markets; fluctuations in the value of the Turkish Lira or the level of inflation in Turkey;other changes in the political or economic environment in Turkey or CCI’s other markets; adverse weather conditionsduring the summer months; changes in the level of tourism in Turkey; CCI’s ability to successfully implement itsstrategy; and other factors. Should any of these risks and uncertainties materialize, or should any of management’sunderlying assumptions prove to be incorrect, CCI’s actual results from operations or financial conditions could differmaterially from those described herein as anticipated, believed, estimated or expected. Forward-looking statementsspeak only as of this date and CCI has no obligation to update those statements to reflect changes that may occur afterthat date.
2
3
Agenda
A regional powerhouse...
...winning in the marketplace...
...to create shareholder value
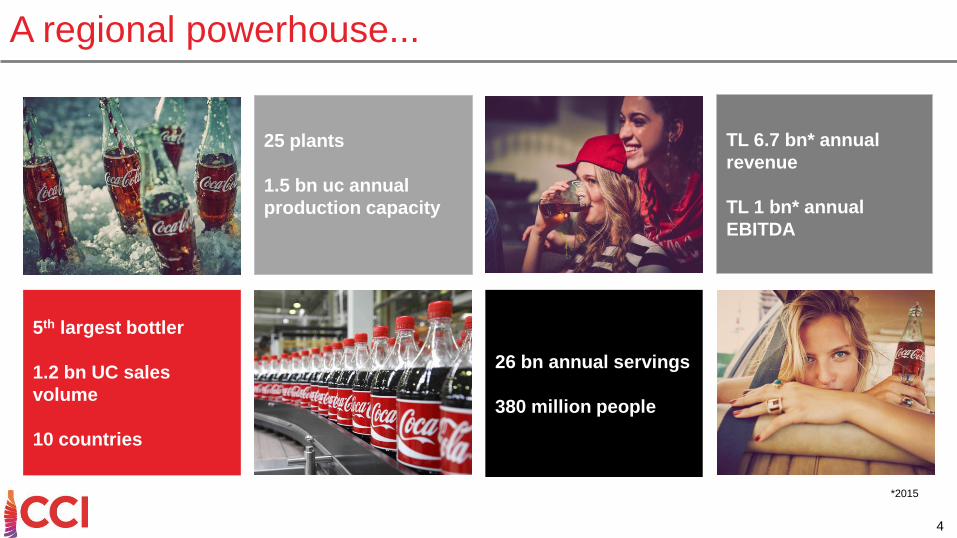
A regional powerhouse...
5th largest bottler
1.2 bn UC sales
volume
10 countries
25 plants
1.5 bn uc annual
production capacity
26 bn annual servings
380 million people
TL 6.7 bn* annual
revenue
TL 1 bn* annual
EBITDA
4
*2015
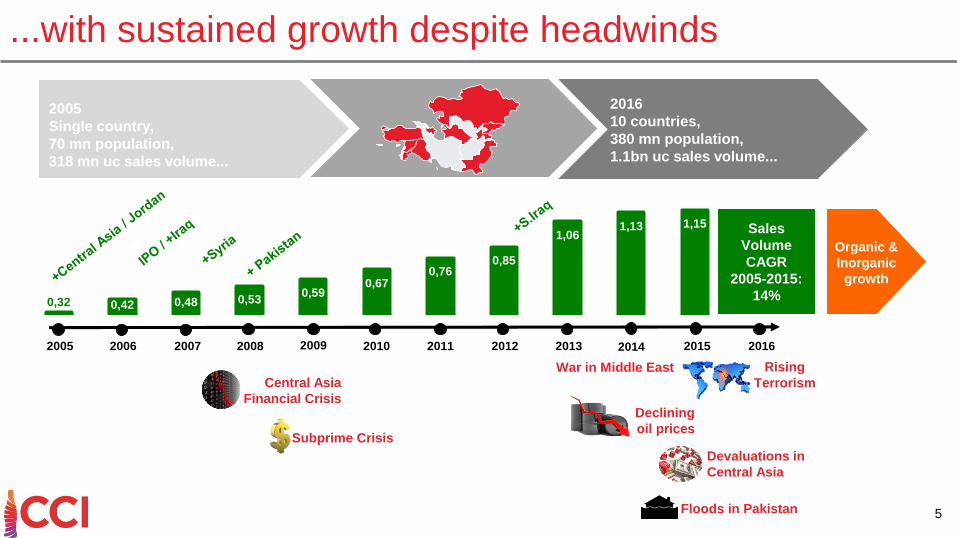
...with sustained growth despite headwinds
2005
Single country,
70 mn population,
318 mn uc sales volume...
2016
10 countries,
380 mn population,
1.1bn uc sales volume...
War in Middle East Rising
TerrorismCentral Asia
Financial Crisis
Devaluations in
Central Asia
Declining
oil pricesSubprime Crisis
Floods in Pakistan
0,32 0,42 0,48 0,530,59
0,670,76
0,85
1,061,13 1,15
2005 2007 2008 2009 2010 2011 2012 2013 20142006 2015 2016
Sales
Volume
CAGR
2005-2015:
14%
Organic &
Inorganic
growth
5
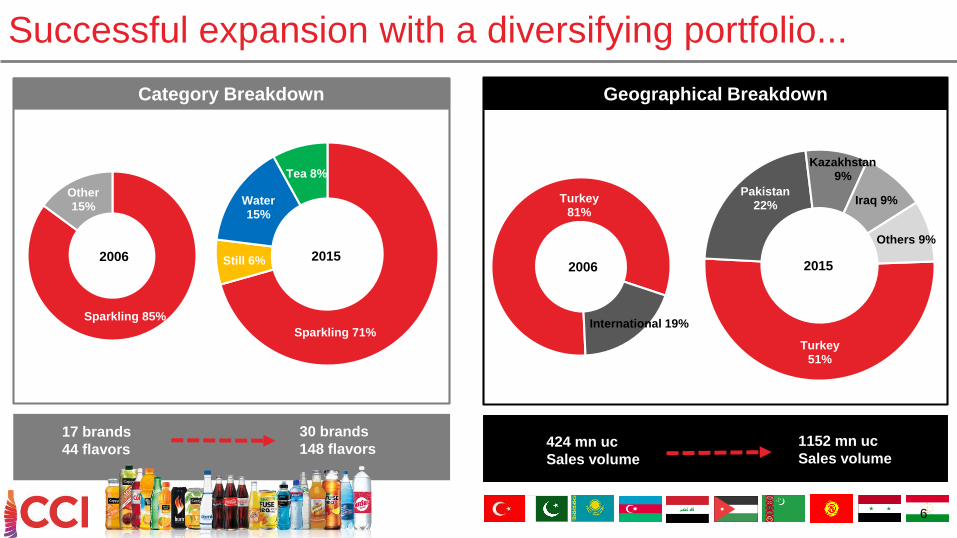
Successful expansion with a diversifying portfolio...
Turkey51%
Pakistan22%
Kazakhstan9%
Iraq 9%
Others 9%
Turkey81%
International 19%
2006 2015
Geographical Breakdown
Sparkling 71%
Still 6%
Water15%
Tea 8%
2015
Sparkling 85%
Other15%
2006
Category Breakdown Geographical Breakdown
1152 mn uc
Sales volume424 mn uc
Sales volume
17 brands
44 flavors
30 brands
148 flavors
6
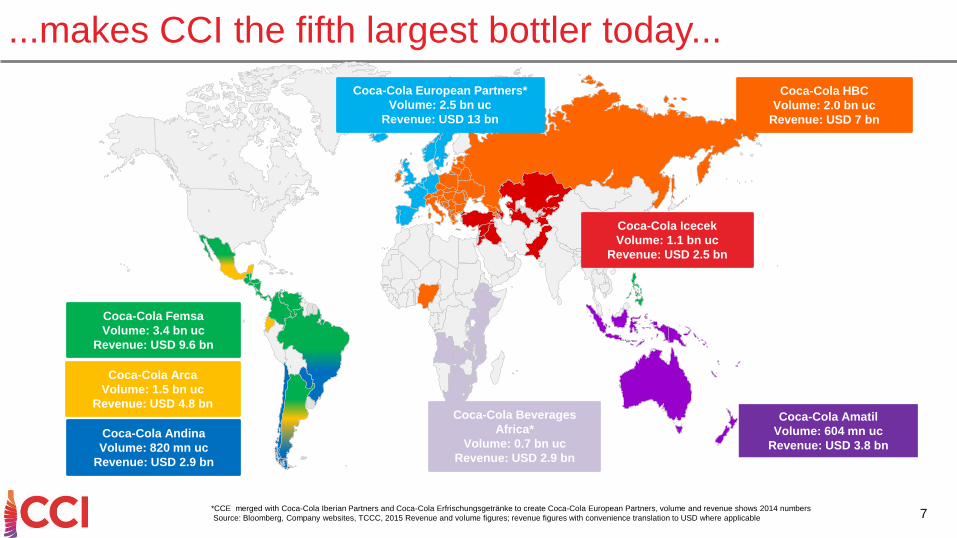
Coca-Cola Femsa
Volume: 3.4 bn uc
Revenue: USD 9.6 bn
Coca-Cola Arca
Volume: 1.5 bn uc
Revenue: USD 4.8 bn
Coca-Cola Andina
Volume: 820 mn uc
Revenue: USD 2.9 bn
Coca-Cola HBC
Volume: 2.0 bn uc
Revenue: USD 7 bn
Coca-Cola Amatil
Volume: 604 mn uc
Revenue: USD 3.8 bn
Coca-Cola Icecek
Volume: 1.1 bn uc
Revenue: USD 2.5 bn
Coca-Cola European Partners*
Volume: 2.5 bn uc
Revenue: USD 13 bn
*CCE merged with Coca-Cola Iberian Partners and Coca-Cola Erfrischungsgetränke to create Coca-Cola European Partners, volume and revenue shows 2014 numbers
Source: Bloomberg, Company websites, TCCC, 2015 Revenue and volume figures; revenue figures with convenience translation to USD where applicable
Coca-Cola Beverages
Africa*
Volume: 0.7 bn uc
Revenue: USD 2.9 bn
...makes CCI the fifth largest bottler today...
7
8
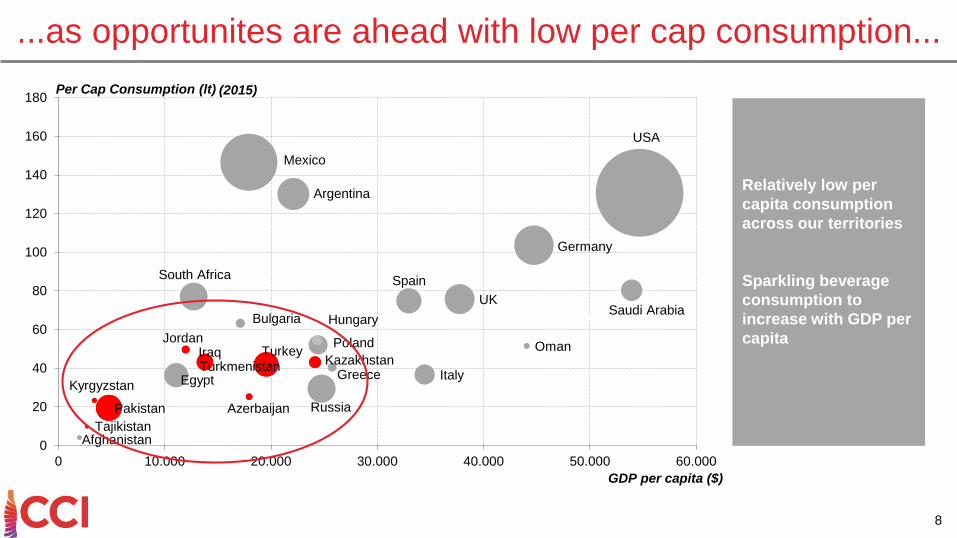
Kyrgyzstan
Afghanistan
Egypt
Pakistan
TurkmenistanIraq
Azerbaijan
Kazakhstan
Russia
TurkeyJordan
Italy
OmanPoland
Greece
South Africa
Saudi ArabiaHungary
UK
Spain
Germany
Bulgaria
Argentina
USA
Mexico
Tajikistan
0
20
40
60
80
100
120
140
160
180
0 10.000 20.000 30.000 40.000 50.000 60.000
#4
Per Cap Consumption (lt)
GDP per capita ($)
(2015)
...as opportunites are ahead with low per cap consumption...
Relatively low per
capita consumption
across our territories
Sparkling beverage
consumption to
increase with GDP per
capita
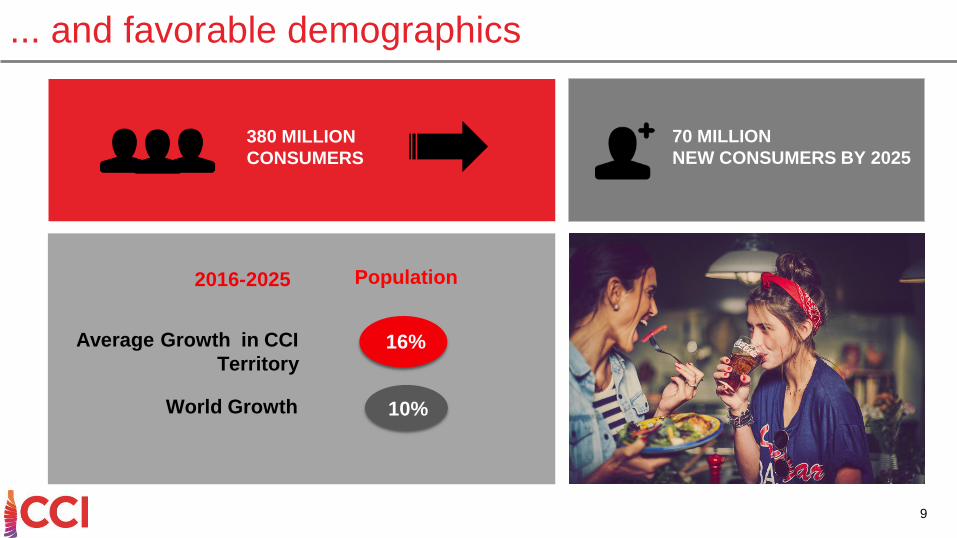
... and favorable demographics
380 MILLION
CONSUMERS
70 MILLION
NEW CONSUMERS BY 2025
World Growth
Average Growth in CCI
Territory
2016-2025 Population
16%
10%
9
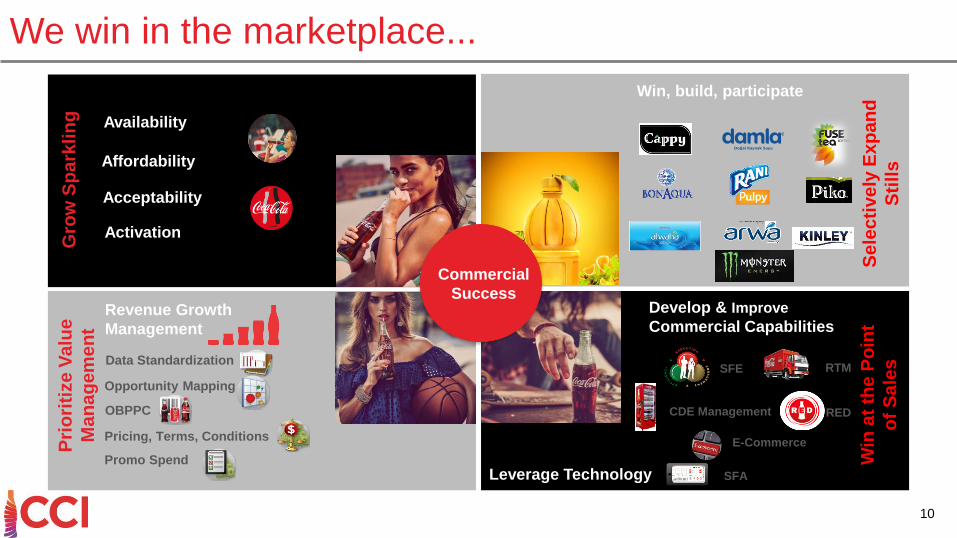
We win in the marketplace...
Availability
Acceptability
Activation
Gro
w S
pa
rkli
ng
Se
lec
tive
ly E
xp
an
d
Sti
lls
Win, build, participate
Revenue Growth
Management
Pri
ori
tize
Va
lue
Ma
na
gem
en
t
Opportunity Mapping
OBPPC
Pricing, Terms, Conditions
Promo Spend
Data Standardization
Win
at
the
Po
int
of
Sa
les
Develop & Improve
Commercial Capabilities
SFE RTM
RED
E-Commerce
CDE Management
Leverage Technology SFA
Commercial
Success
10
Affordability
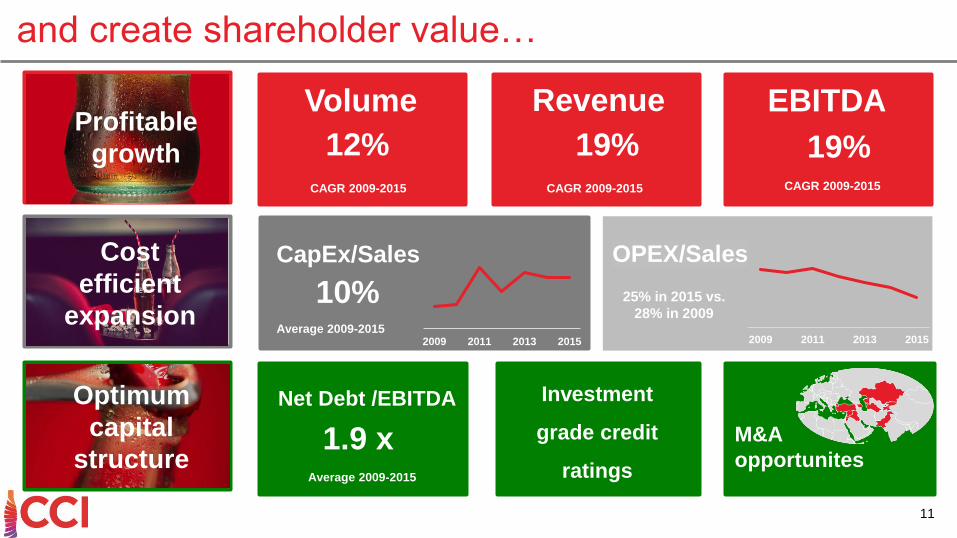
19%
Revenue
CAGR 2009-2015
and create shareholder value…
12%
Volume
CAGR 2009-2015
19%
EBITDA
CAGR 2009-2015
Profitable
growth
10%
CapEx/Sales
Average 2009-2015
1.9 x
Net Debt /EBITDA
Average 2009-2015
M&A
opportunites
11
OPEX/Sales
2009 2011 2013 2015
Optimum
capital
structure
Cost
efficient
expansion
Investment
grade credit
ratings
25% in 2015 vs.
28% in 2009
2009 2011 2013 2015
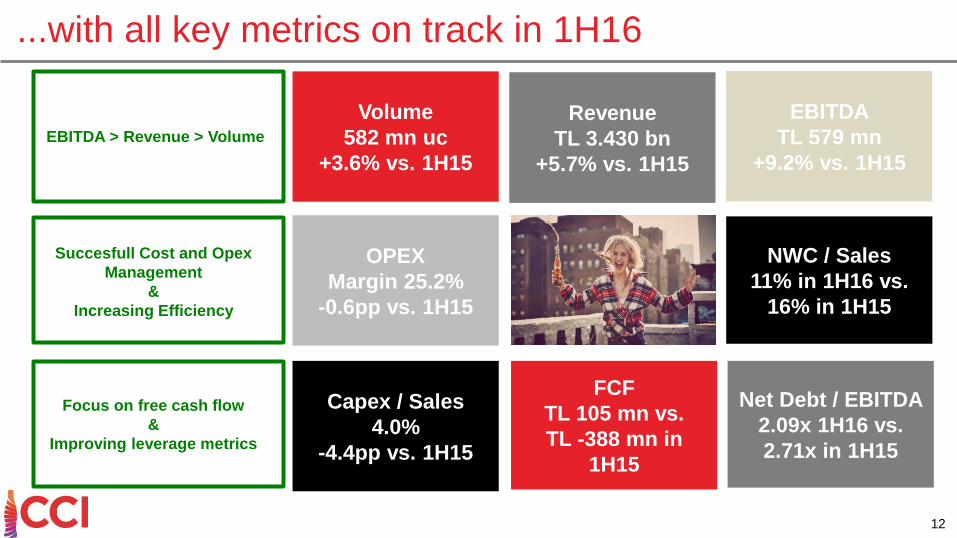
Net Debt / EBITDA
2.09x 1H16 vs.
2.71x in 1H15
...with all key metrics on track in 1H16
Volume
582 mn uc
+3.6% vs. 1H15
EBITDA
TL 579 mn
+9.2% vs. 1H15
OPEX
Margin 25.2%
-0.6pp vs. 1H15
FCF
TL 105 mn vs.
TL -388 mn in
1H15
Revenue
TL 3.430 bn
+5.7% vs. 1H15
Capex / Sales
4.0%
-4.4pp vs. 1H15
12
NWC / Sales
11% in 1H16 vs.
16% in 1H15
EBITDA > Revenue > Volume
Succesfull Cost and Opex
Management
&
Increasing Efficiency
Focus on free cash flow
&
Improving leverage metrics
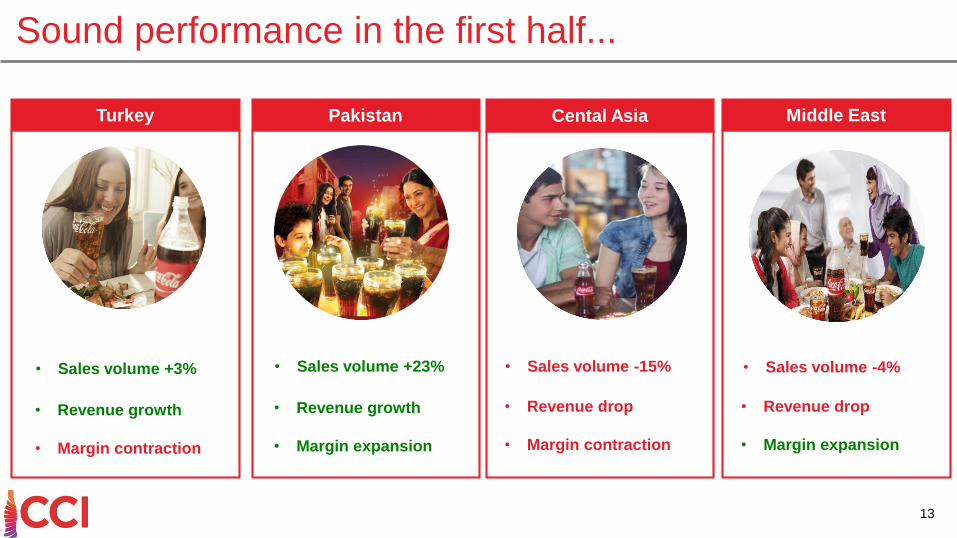
Sound performance in the first half...
Turkey Middle EastCental AsiaPakistan
• Sales volume +3% • Sales volume +23% • Sales volume -15% • Sales volume -4%
• Revenue growth
• Margin contraction
• Revenue growth
• Margin expansion
• Revenue drop
• Margin contraction
• Revenue drop
• Margin expansion
13
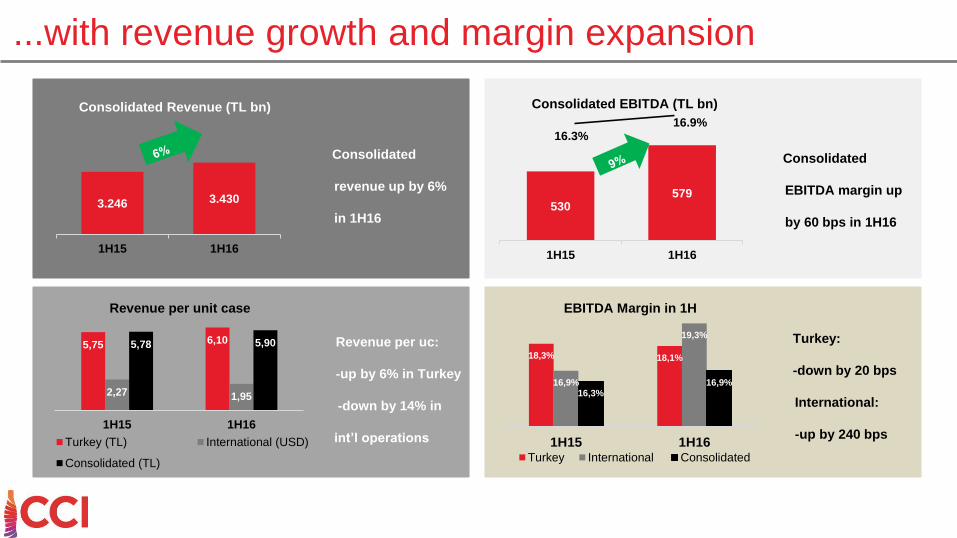
...with revenue growth and margin expansion
3.246 3.430
1H15 1H16
Consolidated Revenue (TL bn)
5,75 6,10
2,27 1,95
5,78 5,90
1H15 1H16
Revenue per unit case
Turkey (TL) International (USD)
Consolidated (TL)
Consolidated
revenue up by 6%
in 1H16
Turkey:
-down by 20 bps
International:
-up by 240 bps
530579
1H15 1H16
Consolidated EBITDA (TL bn)
16.3%16.9%
18,3% 18,1%
16,9%
19,3%
16,3%16,9%
1H15 1H16
EBITDA Margin in 1H
Turkey International Consolidated
Consolidated
EBITDA margin up
by 60 bps in 1H16
Revenue per uc:
-up by 6% in Turkey
-down by 14% in
int’l operations
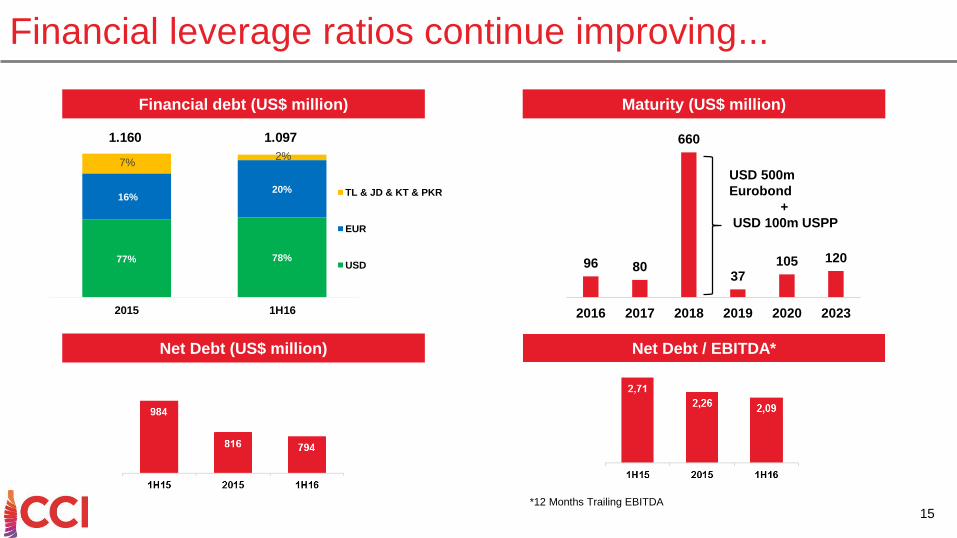
Financial leverage ratios continue improving...
77% 78%
16%20%
7%2%
2015 1H16
TL & JD & KT & PKR
EUR
USD
1.0971.160
Financial debt (US$ million)
Net Debt (US$ million) Net Debt / EBITDA*
Maturity (US$ million)
*12 Months Trailing EBITDA
15
96 80
660
37105 120
2016 2017 2018 2019 2020 2023
USD 500m
Eurobond
+
USD 100m USPP
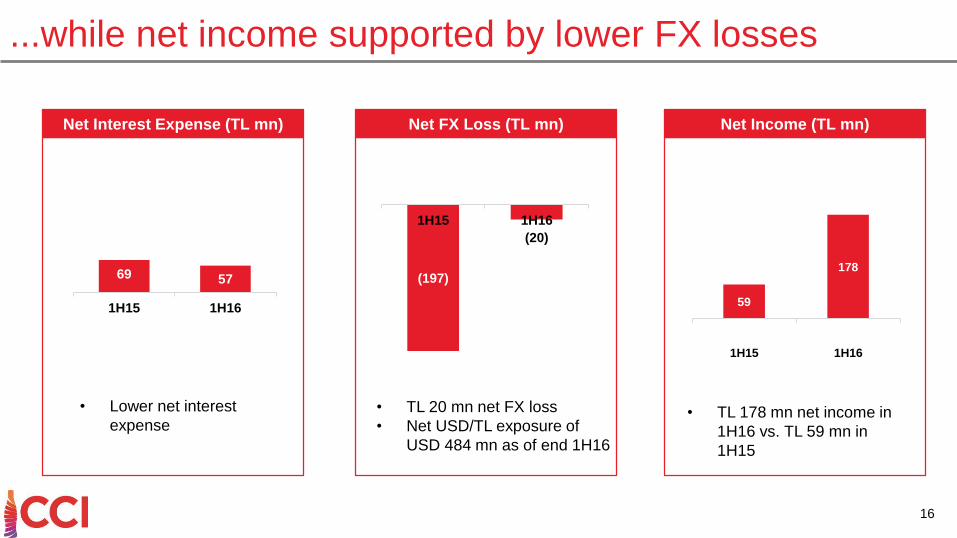
...while net income supported by lower FX losses
• TL 178 mn net income in
1H16 vs. TL 59 mn in
1H15
• Lower net interest
expense• TL 20 mn net FX loss
• Net USD/TL exposure of
USD 484 mn as of end 1H16
Net Interest Expense (TL mn) Net FX Loss (TL mn) Net Income (TL mn)
69 57
1H15 1H16
(197)
(20)
1H15 1H16
59
178
1H15 1H16
16
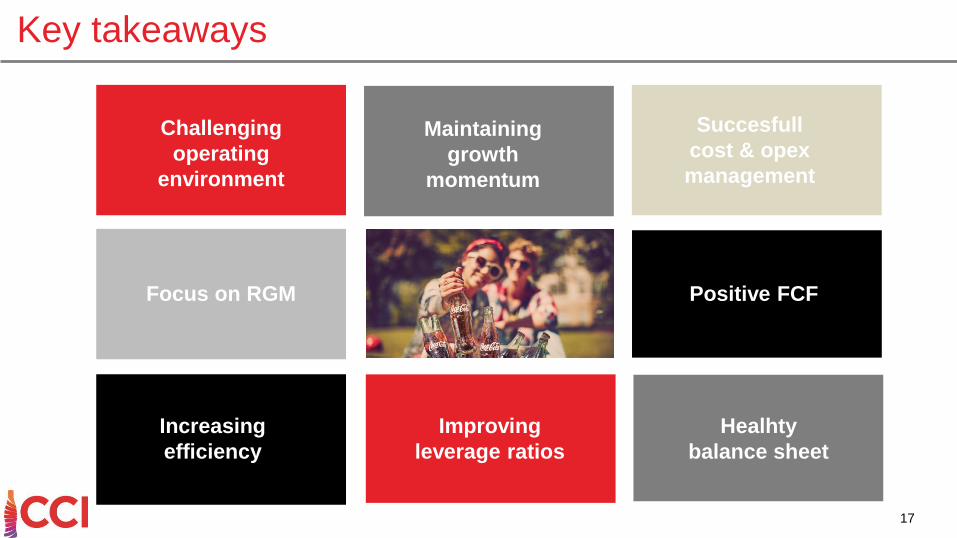
Key takeaways
17
Challenging
operating
environment
Improving
leverage ratios
Positive FCF
Maintaining
growth
momentum
Succesfull
cost & opex
management
Healhty
balance sheet
Focus on RGM
Increasing
efficiency
Appendix18
19
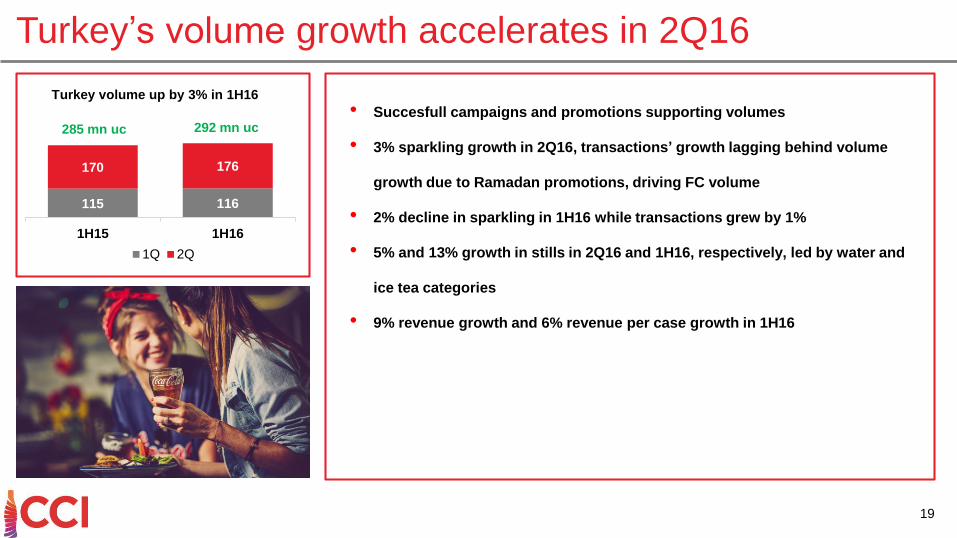
Turkey’s volume growth accelerates in 2Q16
• Succesfull campaigns and promotions supporting volumes
• 3% sparkling growth in 2Q16, transactions’ growth lagging behind volume
growth due to Ramadan promotions, driving FC volume
• 2% decline in sparkling in 1H16 while transactions grew by 1%
• 5% and 13% growth in stills in 2Q16 and 1H16, respectively, led by water and
ice tea categories
• 9% revenue growth and 6% revenue per case growth in 1H16
115 116
170 176
1H15 1H16
Turkey volume up by 3% in 1H16
1Q 2Q
285 mn uc 292 mn uc
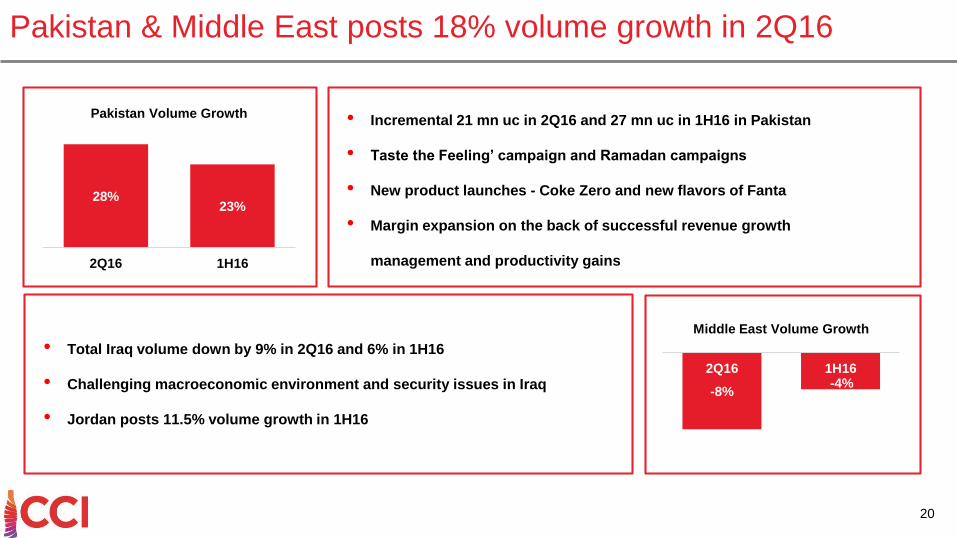
• Incremental 21 mn uc in 2Q16 and 27 mn uc in 1H16 in Pakistan
• Taste the Feeling’ campaign and Ramadan campaigns
• New product launches - Coke Zero and new flavors of Fanta
• Margin expansion on the back of successful revenue growth
management and productivity gains
• Total Iraq volume down by 9% in 2Q16 and 6% in 1H16
• Challenging macroeconomic environment and security issues in Iraq
• Jordan posts 11.5% volume growth in 1H16
Pakistan & Middle East posts 18% volume growth in 2Q16
20
28%23%
2Q16 1H16
Pakistan Volume Growth
-8%-4%
2Q16 1H16
Middle East Volume Growth
21
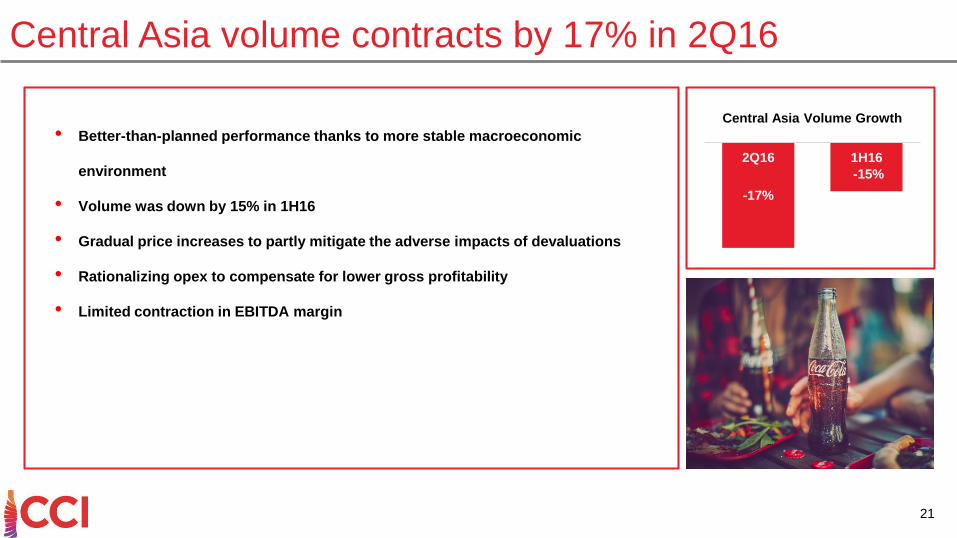
Central Asia volume contracts by 17% in 2Q16
• Better-than-planned performance thanks to more stable macroeconomic
environment
• Volume was down by 15% in 1H16
• Gradual price increases to partly mitigate the adverse impacts of devaluations
• Rationalizing opex to compensate for lower gross profitability
• Limited contraction in EBITDA margin
-17%
-15%
2Q16 1H16
Central Asia Volume Growth
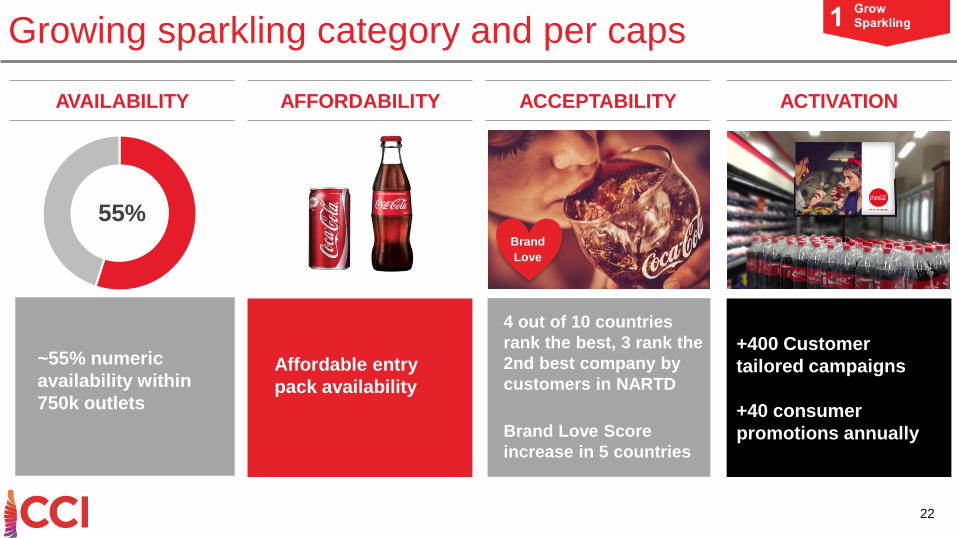
AVAILABILITY AFFORDABILITY ACCEPTABILITY
55%
ACTIVATION
Affordable entry
pack availability
Brand
Love
Growing sparkling category and per caps
~55% numeric
availability within
750k outlets
4 out of 10 countries
rank the best, 3 rank the
2nd best company by
customers in NARTD
Brand Love Score
increase in 5 countries
+400 Customer
tailored campaigns
+40 consumer
promotions annually
22
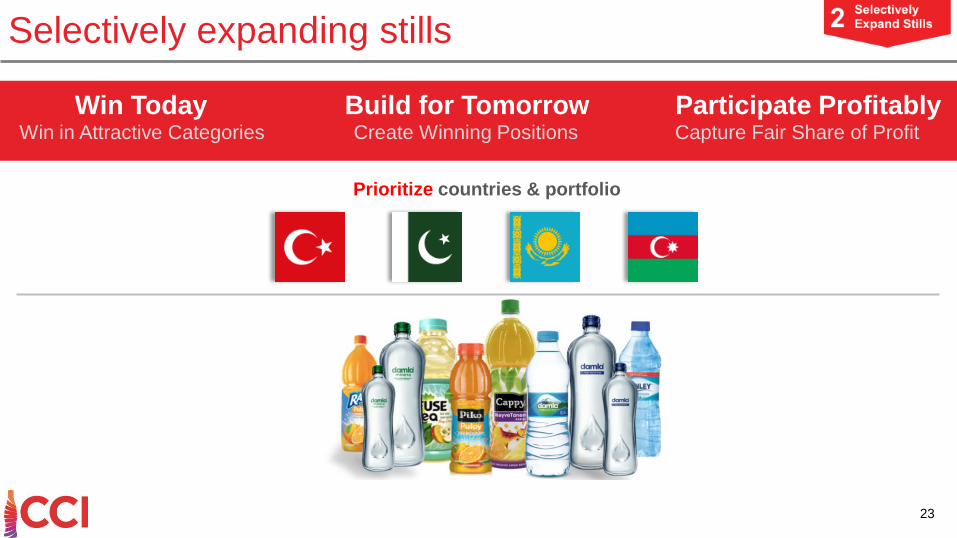
Selectively expanding stills
Win Today Build for Tomorrow Participate ProfitablyWin in Attractive Categories Create Winning Positions Capture Fair Share of Profit
Prioritize countries & portfolio
23
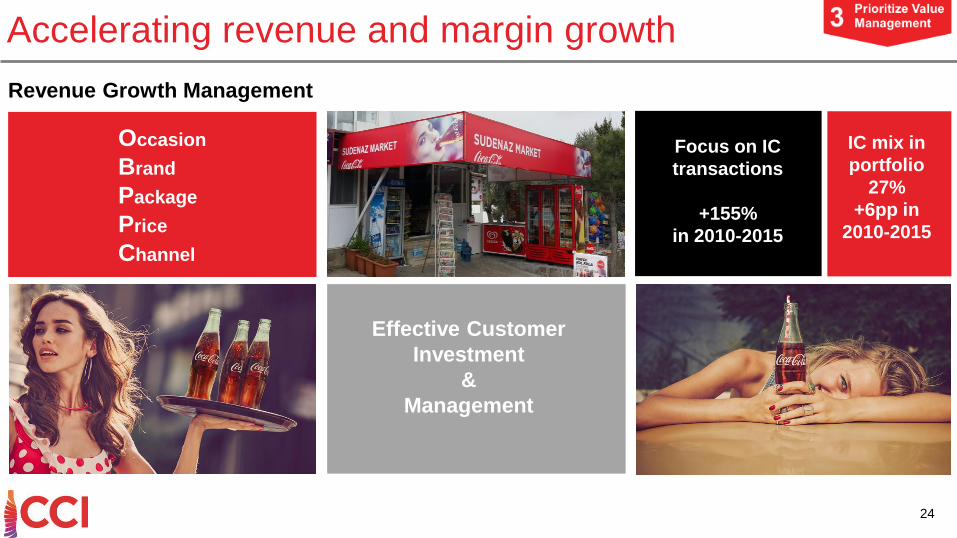
Occasion
Brand
Package
Price
Channel
IC mix in
portfolio
27%
+6pp in
2010-2015
Revenue Growth Management
24
Accelerating revenue and margin growth
Effective Customer
Investment
&
Management
Focus on IC
transactions
+155%
in 2010-2015
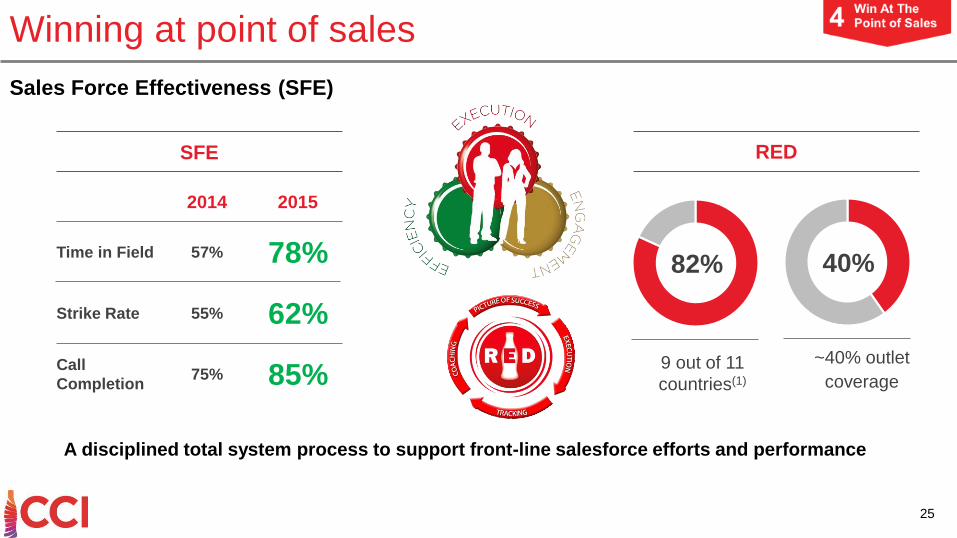
Winning at point of sales
SFE
2015
Time in Field 57% 78%
2014
Strike Rate 55% 62%
Call
Completion75% 85%
RED
9 out of 11
countries(1)
82% 40%
~40% outlet
coverage
A disciplined total system process to support front-line salesforce efforts and performance
Sales Force Effectiveness (SFE)
25
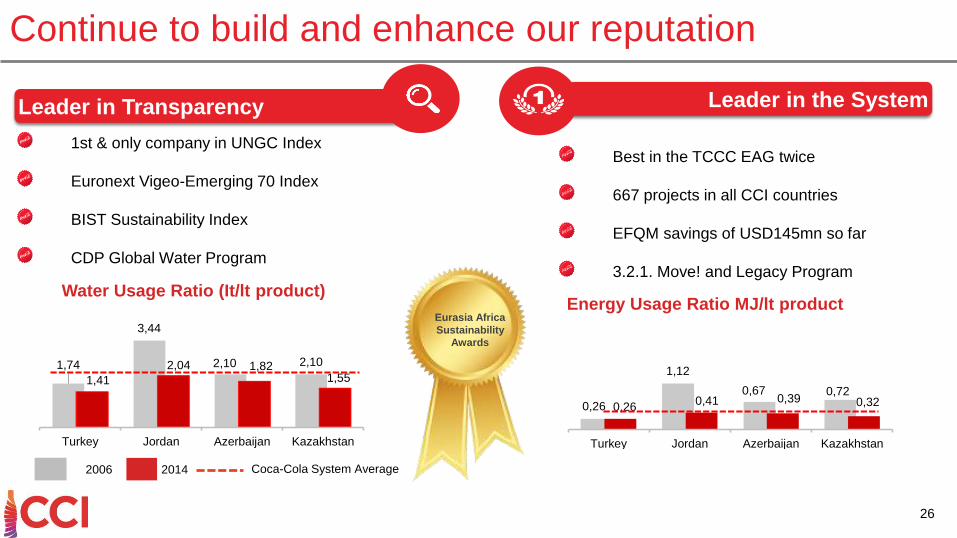
Continue to build and enhance our reputation
1st & only company in UNGC Index
Euronext Vigeo-Emerging 70 Index
BIST Sustainability Index
CDP Global Water Program
Leader in Transparency
Best in the TCCC EAG twice
667 projects in all CCI countries
EFQM savings of USD145mn so far
3.2.1. Move! and Legacy Program
Leader in the System
1,74
3,44
2,10 2,10
1,41
2,04 1,821,55
Turkey Jordan Azerbaijan Kazakhstan
Water Usage Ratio (It/lt product)
0,26
1,12
0,67 0,72
0,260,41 0,39 0,32
Turkey Jordan Azerbaijan Kazakhstan
20142006 Coca-Cola System Average
Energy Usage Ratio MJ/lt productEurasia Africa
Sustainability
Awards
26
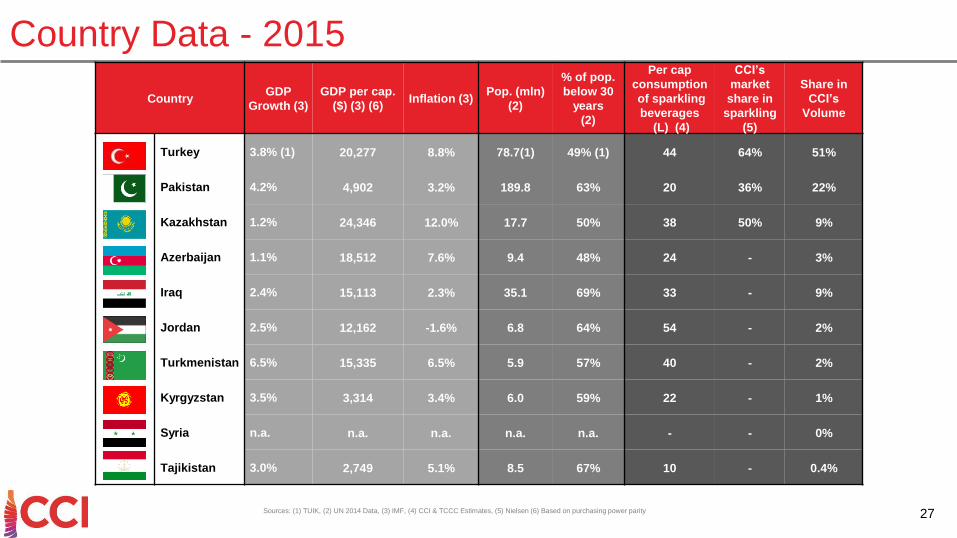
CountryGDP
Growth (3)
GDP per cap.
($) (3) (6)Inflation (3)
Pop. (mln)
(2)
% of pop.
below 30
years
(2)
Per cap
consumption
of sparkling
beverages
(L) (4)
CCI’s
market
share in
sparkling
(5)
Share in
CCI’s
Volume
Turkey 3.8% (1) 20,277 8.8% 78.7(1) 49% (1) 44 64% 51%
Pakistan 4.2% 4,902 3.2% 189.8 63% 20 36% 22%
Kazakhstan 1.2% 24,346 12.0% 17.7 50% 38 50% 9%
Azerbaijan 1.1% 18,512 7.6% 9.4 48% 24 - 3%
Iraq 2.4% 15,113 2.3% 35.1 69% 33 - 9%
Jordan 2.5% 12,162 -1.6% 6.8 64% 54 - 2%
Turkmenistan 6.5% 15,335 6.5% 5.9 57% 40 - 2%
Kyrgyzstan 3.5% 3,314 3.4% 6.0 59% 22 - 1%
Syria n.a. n.a. n.a. n.a. n.a. - - 0%
Tajikistan 3.0% 2,749 5.1% 8.5 67% 10 - 0.4%
Sources: (1) TUIK, (2) UN 2014 Data, (3) IMF, (4) CCI & TCCC Estimates, (5) Nielsen (6) Based on purchasing power parity
Country Data - 2015
27
28
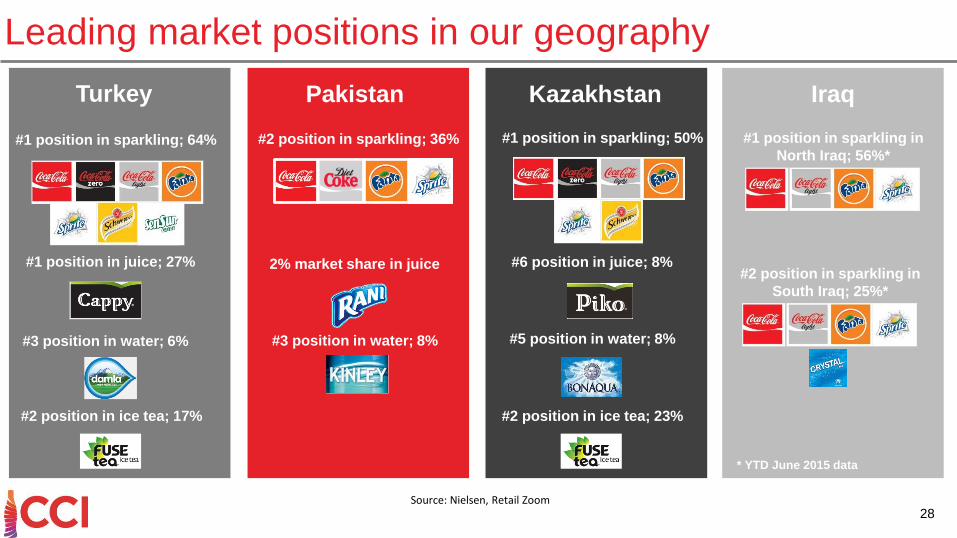
Leading market positions in our geography
Turkey
#1 position in sparkling; 64%
#1 position in juice; 27%
#3 position in water; 6%
#2 position in ice tea; 17%
Pakistan
#2 position in sparkling; 36%
#3 position in water; 8%
Kazakhstan
#1 position in sparkling; 50%
#6 position in juice; 8%
#5 position in water; 8%
#2 position in ice tea; 23%
Iraq
#1 position in sparkling in
North Iraq; 56%*
2% market share in juice
* YTD June 2015 data
#2 position in sparkling in
South Iraq; 25%*
Source: Nielsen, Retail Zoom
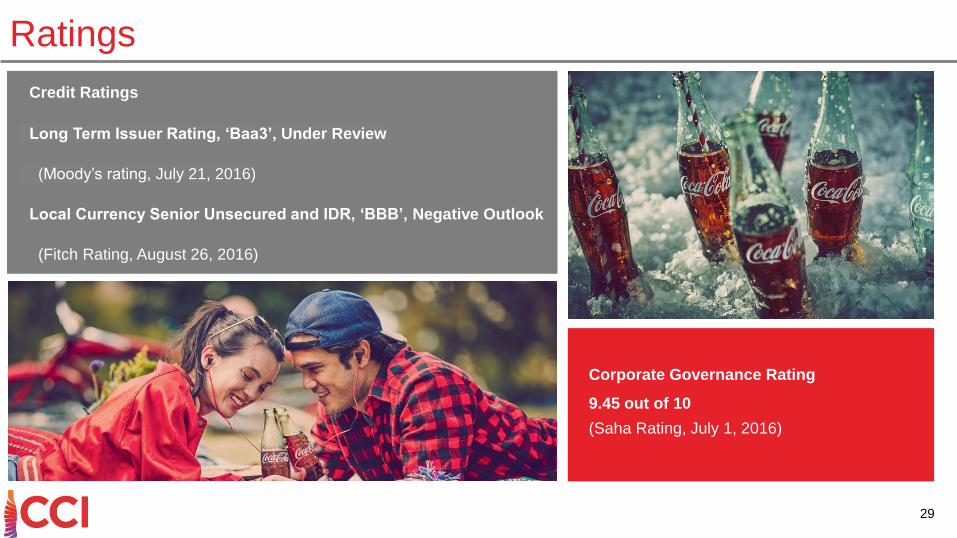
Ratings
29
Credit Ratings
Long Term Issuer Rating, ‘Baa3’, Under Review
(Moody’s rating, July 21, 2016)
Local Currency Senior Unsecured and IDR, ‘BBB’, Negative Outlook
(Fitch Rating, August 26, 2016)
Corporate Governance Rating
9.45 out of 10
(Saha Rating, July 1, 2016)
Coca-Cola İçecek Investor Relations
Tel: +90 216 528 4000 Fax: +90 216 365 8457
------------------------------------Deniz Can Yücel
Investor Relations ManagerTel: +90 216 528 3386
Borsa Istanbul: CCOLA.IS - Bloomberg: CCOLA TI - Reuters: CCOLA.IS ADR-OTC: COLAY - Eurobond - Irish Stock Exchange: CCOLAT 30