First Half of the Fiscal Year Ending March 31, 2020
(April 1, 2019 - September 30, 2019)
November 8, 2019
DAIFUKU CO., LTD.
Consolidated Financial Results
© 2019 Daifuku Co., Ltd.
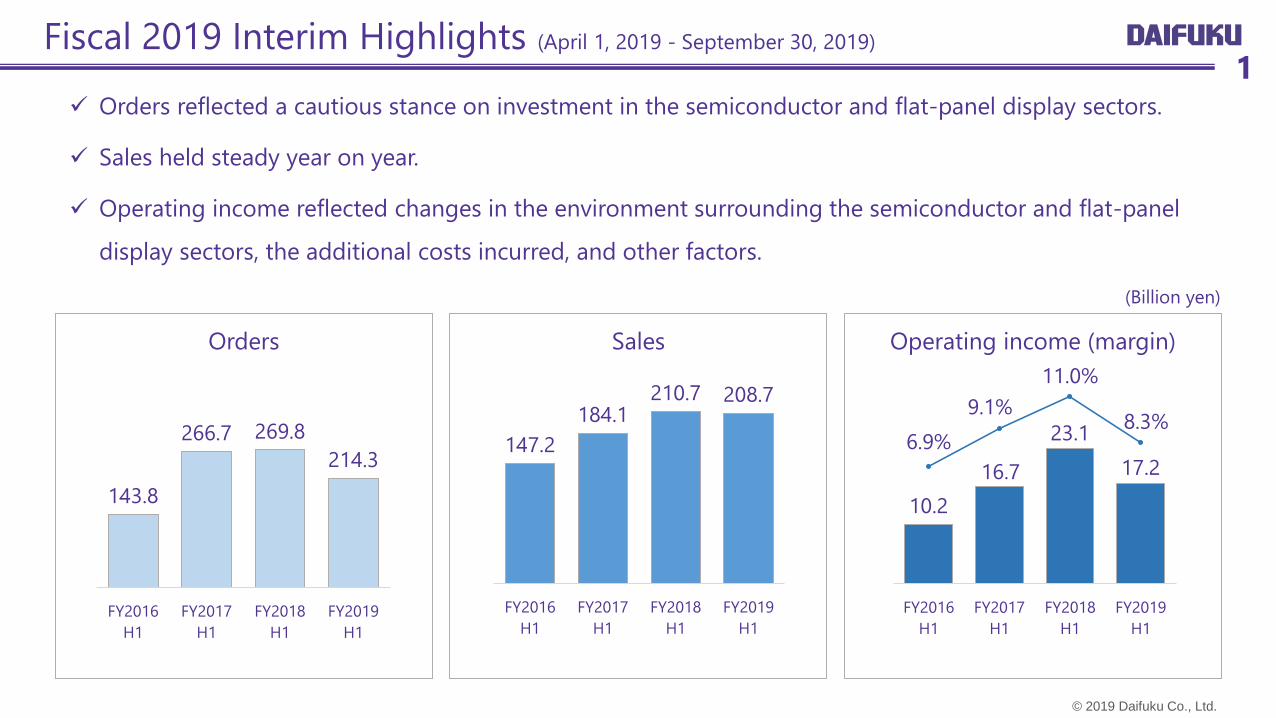
10.2
16.7
23.1
17.2
6.9%
9.1%
11.0%
8.3%
FY2016
H1
FY2017
H1
FY2018
H1
FY2019
H1
Operating income (margin)
Fiscal 2019 Interim Highlights (April 1, 2019 - September 30, 2019)
147.2
184.1210.7 208.7
FY2016
H1
FY2017
H1
FY2018
H1
FY2019
H1
Sales
143.8
266.7 269.8
214.3
FY2016
H1
FY2017
H1
FY2018
H1
FY2019
H1
Orders
(Billion yen)
1✓ Orders reflected a cautious stance on investment in the semiconductor and flat-panel display sectors.
✓ Sales held steady year on year.
✓ Operating income reflected changes in the environment surrounding the semiconductor and flat-panel
display sectors, the additional costs incurred, and other factors.
© 2019 Daifuku Co., Ltd.
FY2018 H1
results
FY2019 H1
forecast as of
August 8, 2019
FY2019 H1
resultsYear-on-year
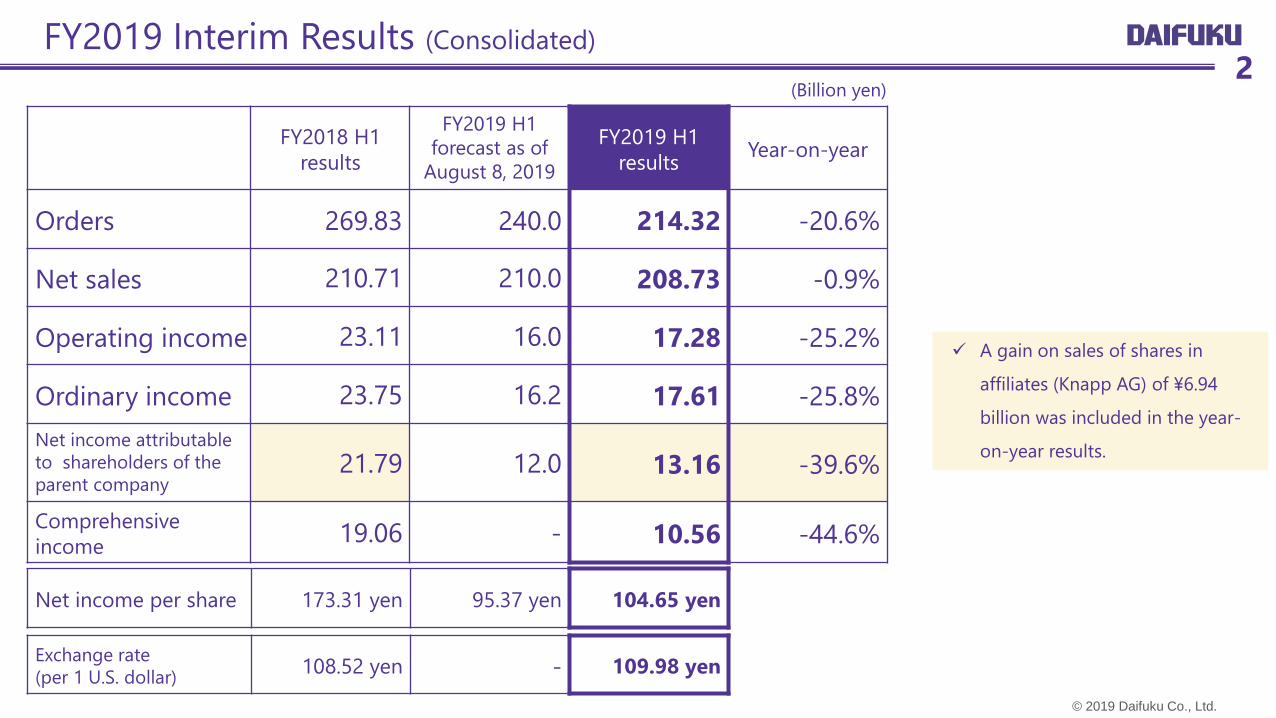
Orders 269.83 240.0 214.32 -20.6%
Net sales 210.71 210.0 208.73 -0.9%
Operating income 23.11 16.0 17.28 -25.2%
Ordinary income 23.75 16.2 17.61 -25.8%
Net income attributable
to shareholders of the
parent company21.79 12.0 13.16 -39.6%
Comprehensive
income19.06 - 10.56 -44.6%
Net income per share 173.31 yen 95.37 yen 104.65 yen
Exchange rate
(per 1 U.S. dollar)108.52 yen - 109.98 yen
(Billion yen)
FY2019 Interim Results (Consolidated)2
✓ A gain on sales of shares in
affiliates (Knapp AG) of ¥6.94
billion was included in the year-
on-year results.
© 2019 Daifuku Co., Ltd.
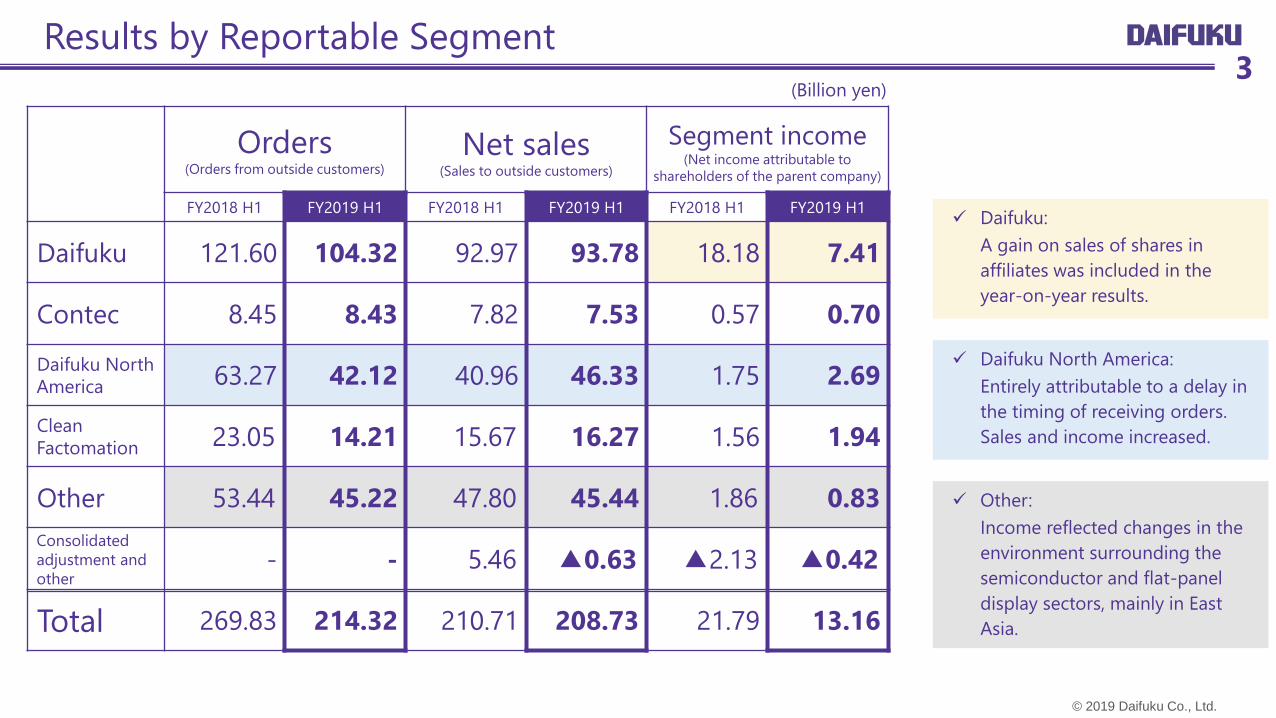
Orders(Orders from outside customers)
Net sales(Sales to outside customers)
Segment income(Net income attributable to
shareholders of the parent company)
FY2018 H1 FY2019 H1 FY2018 H1 FY2019 H1 FY2018 H1 FY2019 H1
Daifuku 121.60 104.32 92.97 93.78 18.18 7.41
Contec 8.45 8.43 7.82 7.53 0.57 0.70
Daifuku North
America 63.27 42.12 40.96 46.33 1.75 2.69
Clean
Factomation 23.05 14.21 15.67 16.27 1.56 1.94
Other 53.44 45.22 47.80 45.44 1.86 0.83
Consolidated
adjustment and
other- - 5.46 ▲0.63 ▲2.13 ▲0.42
Total 269.83 214.32 210.71 208.73 21.79 13.16
(Billion yen)3
✓ Daifuku:
A gain on sales of shares in
affiliates was included in the
year-on-year results.
✓ Daifuku North America:
Entirely attributable to a delay in
the timing of receiving orders.
Sales and income increased.
✓ Other:
Income reflected changes in the
environment surrounding the
semiconductor and flat-panel
display sectors, mainly in East
Asia.
Results by Reportable Segment
© 2019 Daifuku Co., Ltd.
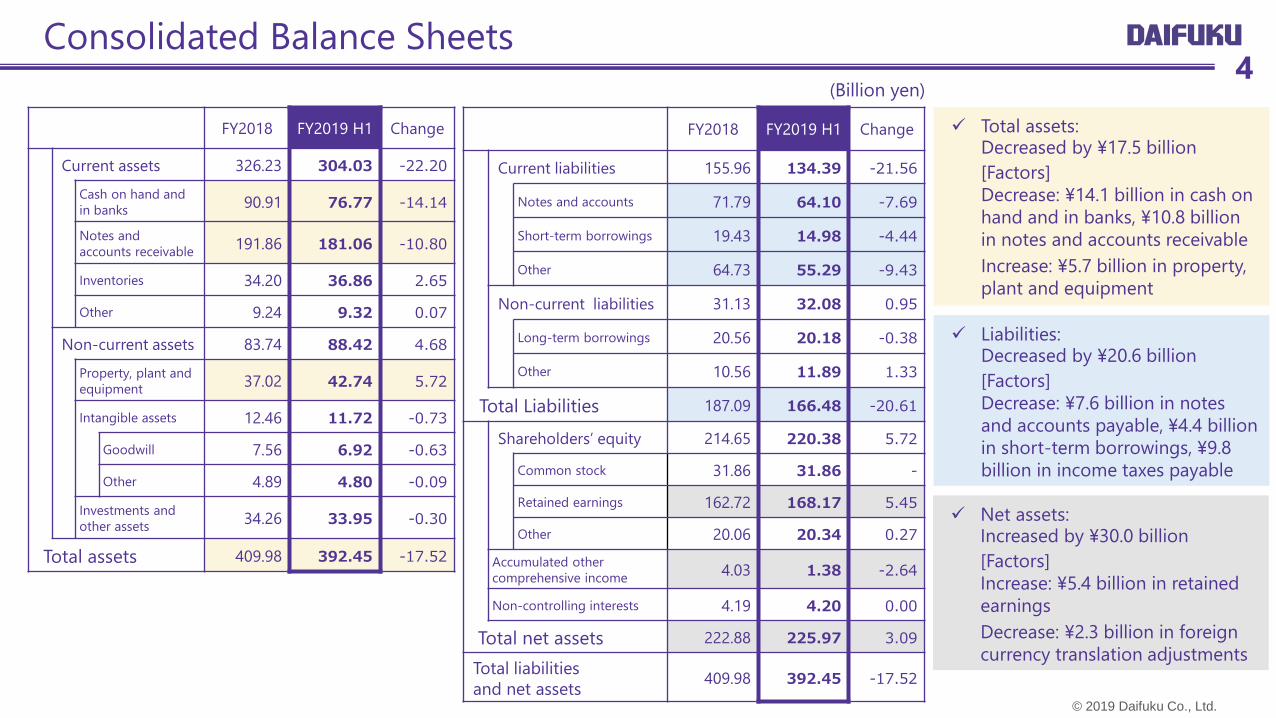
FY2018 FY2019 H1 Change
Current assets 326.23 304.03 -22.20
Cash on hand and
in banks90.91 76.77 -14.14
Notes and
accounts receivable191.86 181.06 -10.80
Inventories 34.20 36.86 2.65
Other 9.24 9.32 0.07
Non-current assets 83.74 88.42 4.68
Property, plant and
equipment37.02 42.74 5.72
Intangible assets 12.46 11.72 -0.73
Goodwill 7.56 6.92 -0.63
Other 4.89 4.80 -0.09
Investments and
other assets34.26 33.95 -0.30
Total assets 409.98 392.45 -17.52
FY2018 FY2019 H1 Change
Current liabilities 155.96 134.39 -21.56
Notes and accounts 71.79 64.10 -7.69
Short-term borrowings 19.43 14.98 -4.44
Other 64.73 55.29 -9.43
Non-current liabilities 31.13 32.08 0.95
Long-term borrowings 20.56 20.18 -0.38
Other 10.56 11.89 1.33
Total Liabilities 187.09 166.48 -20.61
Shareholders’ equity 214.65 220.38 5.72
Common stock 31.86 31.86 -
Retained earnings 162.72 168.17 5.45
Other 20.06 20.34 0.27
Accumulated other
comprehensive income4.03 1.38 -2.64
Non-controlling interests 4.19 4.20 0.00
Total net assets 222.88 225.97 3.09
Total liabilities
and net assets409.98 392.45 -17.52
Consolidated Balance Sheets
(Billion yen)4
✓ Total assets: Decreased by ¥17.5 billion
[Factors]
Decrease: ¥14.1 billion in cash on
hand and in banks, ¥10.8 billion
in notes and accounts receivable
Increase: ¥5.7 billion in property,
plant and equipment
✓ Liabilities: Decreased by ¥20.6 billion
[Factors]
Decrease: ¥7.6 billion in notes
and accounts payable, ¥4.4 billion
in short-term borrowings, ¥9.8
billion in income taxes payable
✓ Net assets: Increased by ¥30.0 billion
[Factors]
Increase: ¥5.4 billion in retained
earnings
Decrease: ¥2.3 billion in foreign
currency translation adjustments
© 2019 Daifuku Co., Ltd.
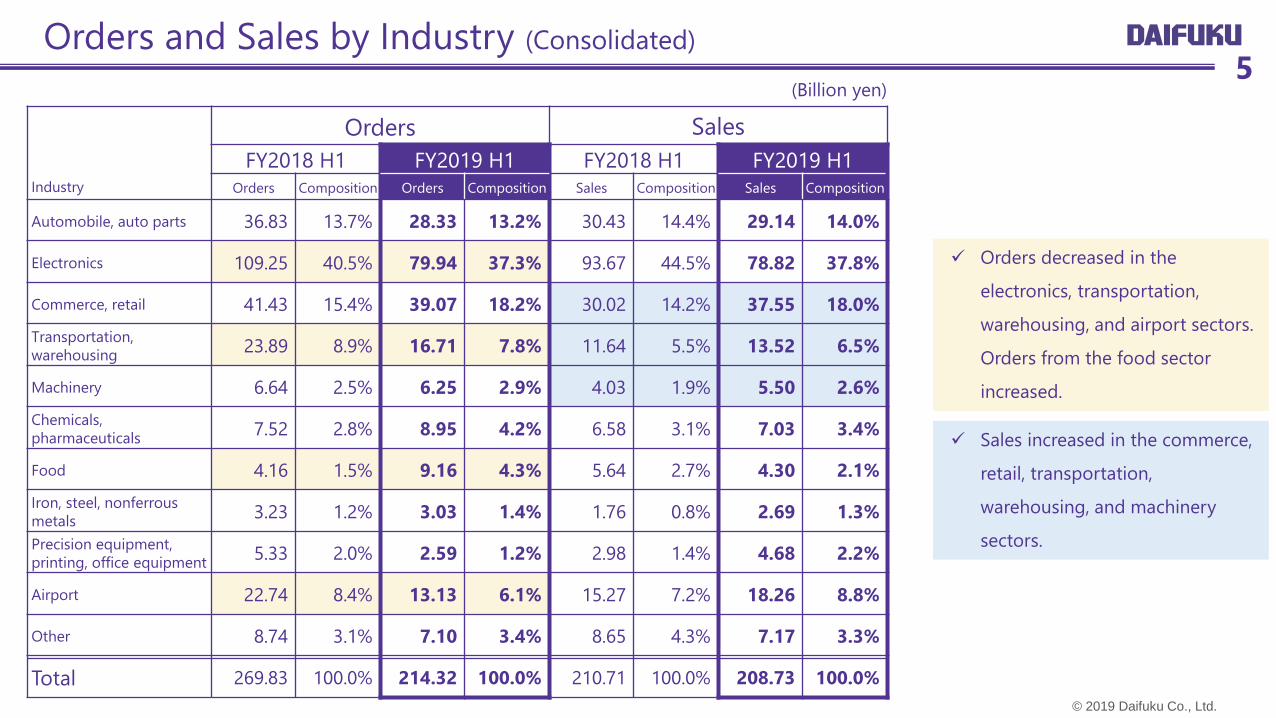
✓ Orders decreased in the
electronics, transportation,
warehousing, and airport sectors.
Orders from the food sector
increased.
Industry
Orders Sales
FY2018 H1 FY2019 H1 FY2018 H1 FY2019 H1
Orders Composition Orders Composition Sales Composition Sales Composition
Automobile, auto parts 36.83 13.7% 28.33 13.2% 30.43 14.4% 29.14 14.0%
Electronics 109.25 40.5% 79.94 37.3% 93.67 44.5% 78.82 37.8%
Commerce, retail 41.43 15.4% 39.07 18.2% 30.02 14.2% 37.55 18.0%
Transportation,
warehousing23.89 8.9% 16.71 7.8% 11.64 5.5% 13.52 6.5%
Machinery 6.64 2.5% 6.25 2.9% 4.03 1.9% 5.50 2.6%
Chemicals,
pharmaceuticals7.52 2.8% 8.95 4.2% 6.58 3.1% 7.03 3.4%
Food 4.16 1.5% 9.16 4.3% 5.64 2.7% 4.30 2.1%
Iron, steel, nonferrous
metals3.23 1.2% 3.03 1.4% 1.76 0.8% 2.69 1.3%
Precision equipment,
printing, office equipment5.33 2.0% 2.59 1.2% 2.98 1.4% 4.68 2.2%
Airport 22.74 8.4% 13.13 6.1% 15.27 7.2% 18.26 8.8%
Other 8.74 3.1% 7.10 3.4% 8.65 4.3% 7.17 3.3%
Total 269.83 100.0% 214.32 100.0% 210.71 100.0% 208.73 100.0%
Orders and Sales by Industry (Consolidated)
(Billion yen)5
✓ Sales increased in the commerce,
retail, transportation,
warehousing, and machinery
sectors.
© 2019 Daifuku Co., Ltd.
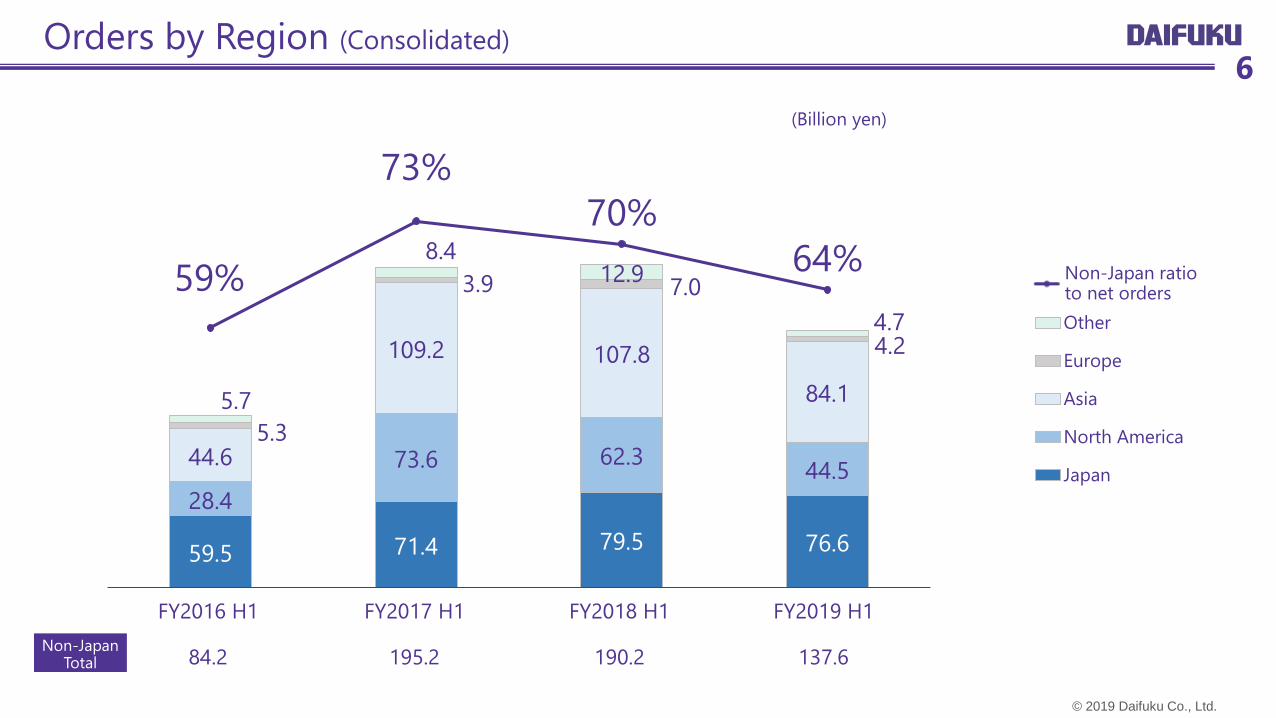
Orders by Region (Consolidated)6
59.5 71.4 79.5 76.6
28.4
73.6 62.344.5
44.6
109.2 107.8
84.1
5.3
3.9 7.0
4.2
5.7
8.412.9
4.7
59%
73%
70%
64%
Other
Europe
Asia
North America
Japan
Ratio to net sales
Non-Japan Total
FY2016 H1
84.2
FY2017 H1
195.2
FY2019 H1
137.6
FY2018 H1
190.2
Non-Japan ratio to net orders
(Billion yen)
© 2019 Daifuku Co., Ltd.
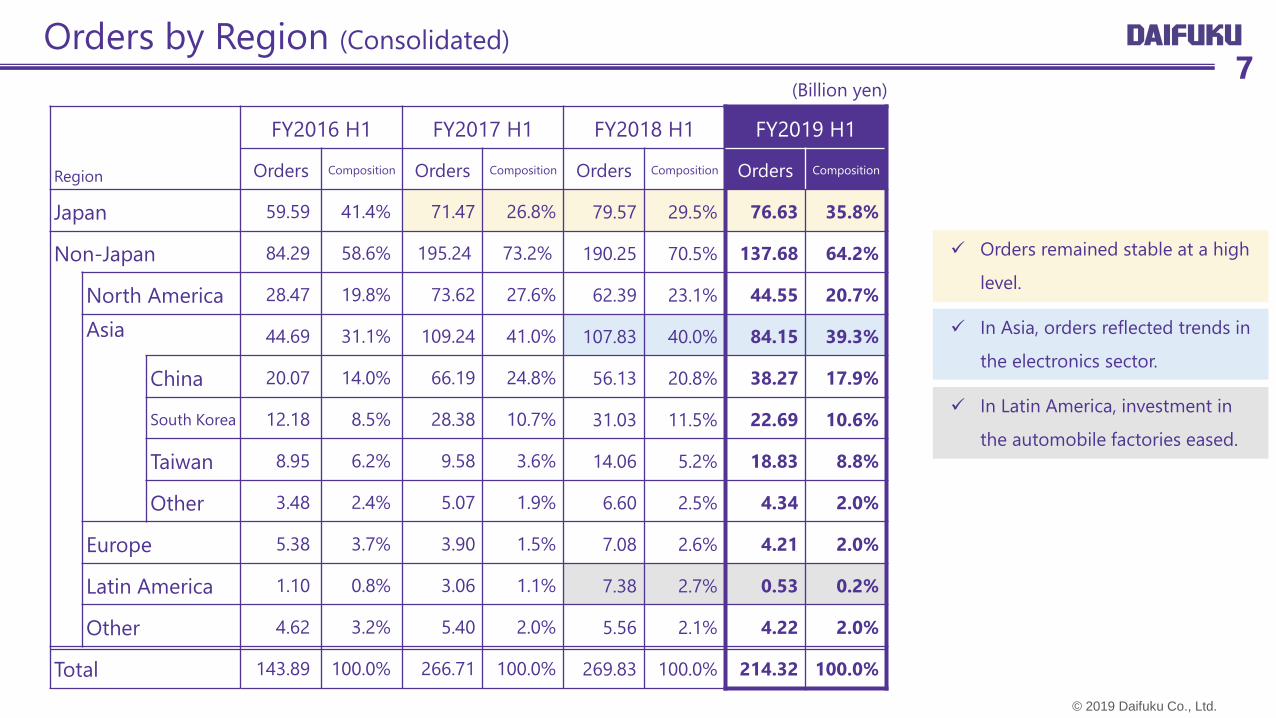
✓ In Latin America, investment in
the automobile factories eased.
✓ In Asia, orders reflected trends in
the electronics sector.
✓ Orders remained stable at a high
level.
Region
FY2016 H1 FY2017 H1 FY2018 H1 FY2019 H1
Orders Composition Orders Composition Orders Composition Orders Composition
Japan 59.59 41.4% 71.47 26.8% 79.57 29.5% 76.63 35.8%
Non-Japan 84.29 58.6% 195.24 73.2% 190.25 70.5% 137.68 64.2%
North America 28.47 19.8% 73.62 27.6% 62.39 23.1% 44.55 20.7%
Asia 44.69 31.1% 109.24 41.0% 107.83 40.0% 84.15 39.3%
China 20.07 14.0% 66.19 24.8% 56.13 20.8% 38.27 17.9%
South Korea 12.18 8.5% 28.38 10.7% 31.03 11.5% 22.69 10.6%
Taiwan 8.95 6.2% 9.58 3.6% 14.06 5.2% 18.83 8.8%
Other 3.48 2.4% 5.07 1.9% 6.60 2.5% 4.34 2.0%
Europe 5.38 3.7% 3.90 1.5% 7.08 2.6% 4.21 2.0%
Latin America 1.10 0.8% 3.06 1.1% 7.38 2.7% 0.53 0.2%
Other 4.62 3.2% 5.40 2.0% 5.56 2.1% 4.22 2.0%
Total 143.89 100.0% 266.71 100.0% 269.83 100.0% 214.32 100.0%
(Billion yen)
Orders by Region (Consolidated)7
© 2019 Daifuku Co., Ltd.
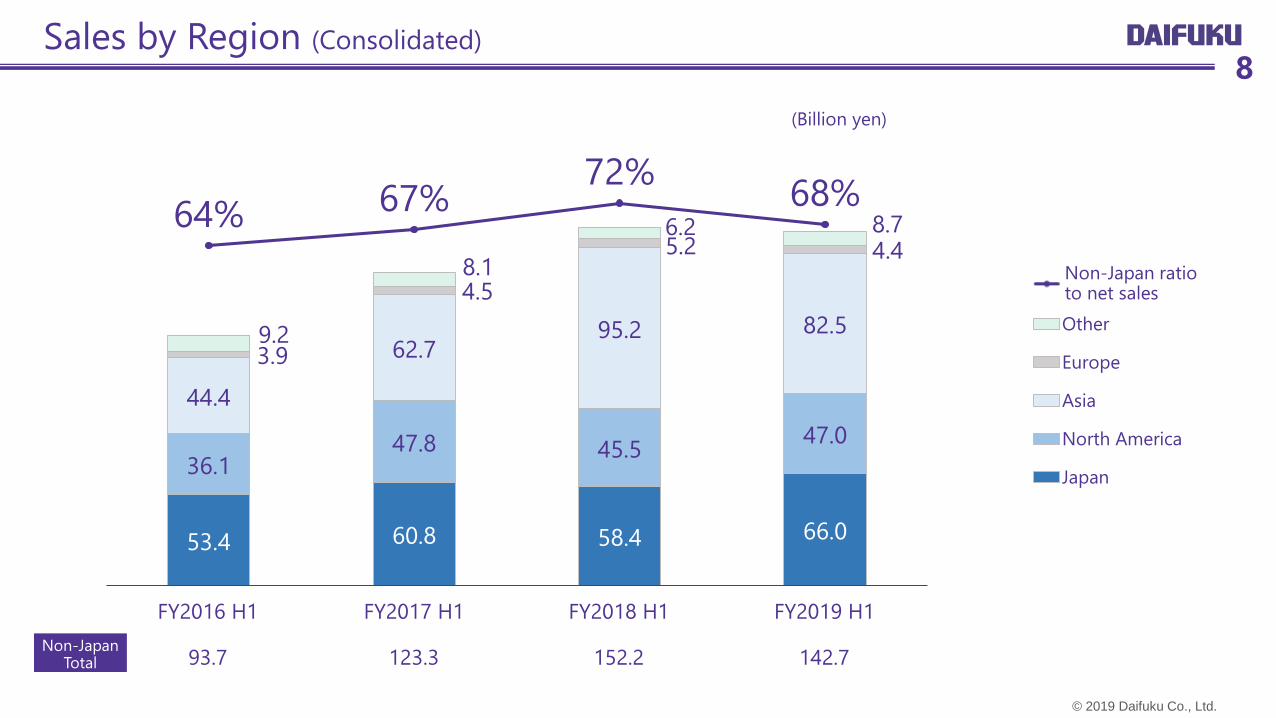
Sales by Region (Consolidated)8
53.4 60.8 58.4 66.0
36.147.8 45.5
47.0
44.4
62.795.2 82.5
3.9
4.5
5.2 4.4
9.2
8.1
6.2 8.764% 67%72%
68%
Other
Europe
Asia
North America
Japan
Ratio to net sales
FY2019 H1
142.7
FY2016 H1
93.7
FY2017 H1
123.3
FY2018 H1
152.2Non-Japan
Total
(Billion yen)
Non-Japan ratio to net sales
© 2019 Daifuku Co., Ltd.
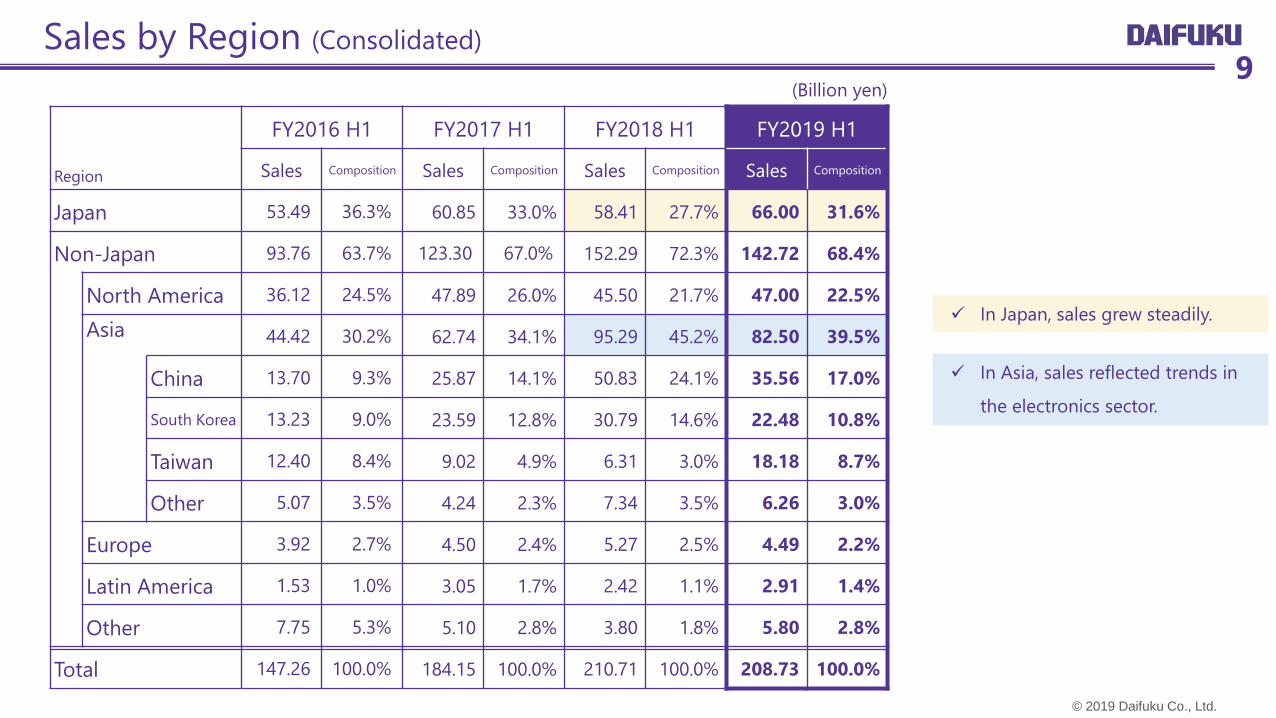
Region
FY2016 H1 FY2017 H1 FY2018 H1 FY2019 H1
Sales Composition Sales Composition Sales Composition Sales Composition
Japan 53.49 36.3% 60.85 33.0% 58.41 27.7% 66.00 31.6%
Non-Japan 93.76 63.7% 123.30 67.0% 152.29 72.3% 142.72 68.4%
North America 36.12 24.5% 47.89 26.0% 45.50 21.7% 47.00 22.5%
Asia 44.42 30.2% 62.74 34.1% 95.29 45.2% 82.50 39.5%
China 13.70 9.3% 25.87 14.1% 50.83 24.1% 35.56 17.0%
South Korea 13.23 9.0% 23.59 12.8% 30.79 14.6% 22.48 10.8%
Taiwan 12.40 8.4% 9.02 4.9% 6.31 3.0% 18.18 8.7%
Other 5.07 3.5% 4.24 2.3% 7.34 3.5% 6.26 3.0%
Europe 3.92 2.7% 4.50 2.4% 5.27 2.5% 4.49 2.2%
Latin America 1.53 1.0% 3.05 1.7% 2.42 1.1% 2.91 1.4%
Other 7.75 5.3% 5.10 2.8% 3.80 1.8% 5.80 2.8%
Total 147.26 100.0% 184.15 100.0% 210.71 100.0% 208.73 100.0%
(Billion yen)
Sales by Region (Consolidated)9
✓ In Japan, sales grew steadily.
✓ In Asia, sales reflected trends in
the electronics sector.
© 2019 Daifuku Co., Ltd.
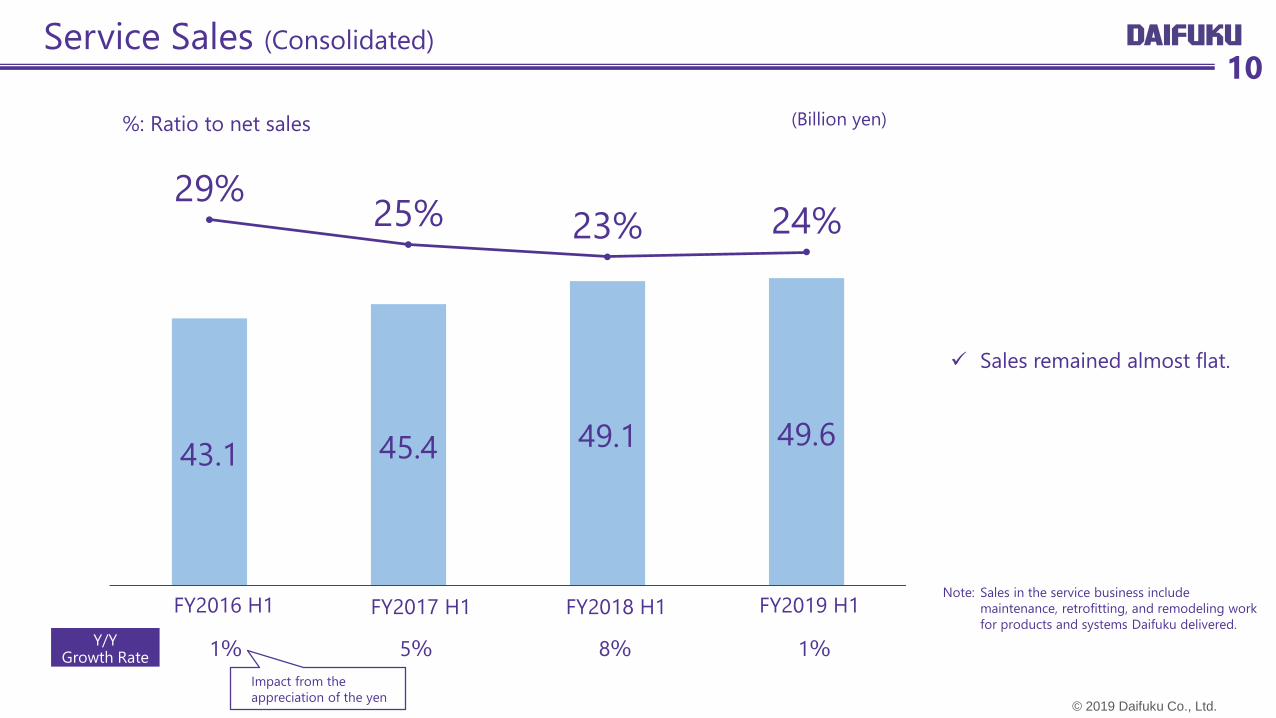
5%1%
43.1 45.4 49.1 49.6
29%25% 23% 24%
8%
FY2016 H1 FY2017 H1 FY2018 H1
✓ Sales remained almost flat.
FY2019 H1
1%
Note: Sales in the service business include
maintenance, retrofitting, and remodeling work
for products and systems Daifuku delivered.
Service Sales (Consolidated)
%: Ratio to net sales
Impact from the
appreciation of the yen
10
Y/Y Growth Rate
(Billion yen)
© 2019 Daifuku Co., Ltd.
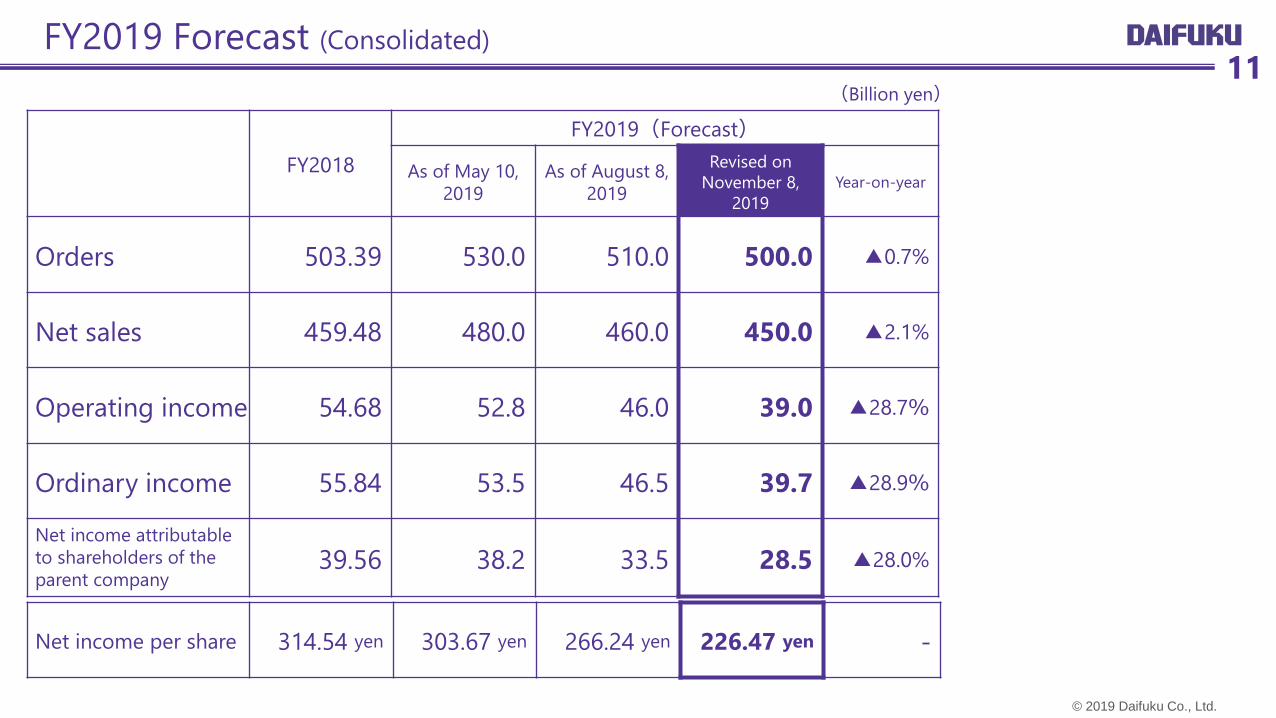
FY2019 Forecast (Consolidated)11
FY2018
FY2019(Forecast)
As of May 10,
2019
As of August 8,
2019
Revised on
November 8,
2019
Year-on-year
Orders 503.39 530.0 510.0 500.0 ▲0.7%
Net sales 459.48 480.0 460.0 450.0 ▲2.1%
Operating income 54.68 52.8 46.0 39.0 ▲28.7%
Ordinary income 55.84 53.5 46.5 39.7 ▲28.9%
Net income attributable
to shareholders of the
parent company39.56 38.2 33.5 28.5 ▲28.0%
Net income per share 314.54 yen 303.67 yen 266.24 yen 226.47 yen -
(Billion yen)
© 2019 Daifuku Co., Ltd.
10 10 10 5 5 5 5 7 10 12
2530 3016 16 10
10 10 10 13 1520
25
45
60
45
526 2620
15 15 15 18 2230
42
70
90
75
FY2007 FY2008 FY2009 FY2010 FY2011 FY2012 FY2013 FY2014 FY2015 FY2016 FY2017 FY2018 FY2019
Interim Year-end Commemorative dividend
(80th anniversary)
12Dividends
(Plan)
(Yen)
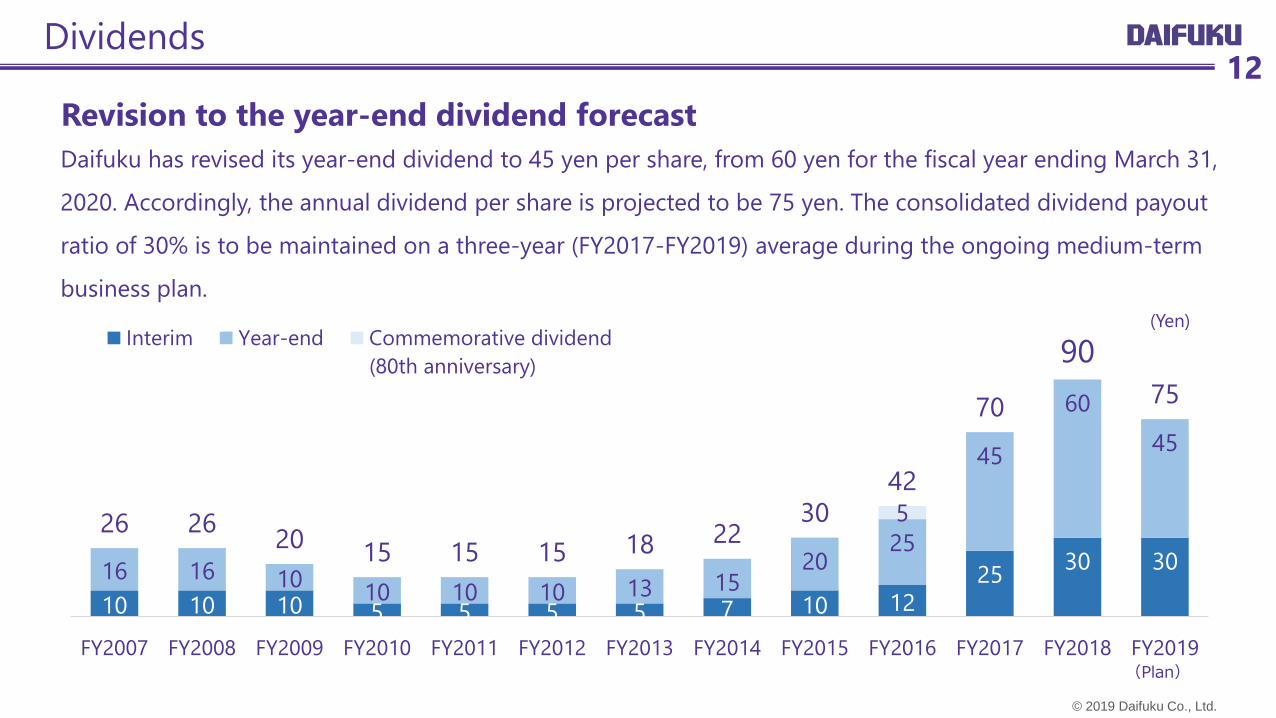
Revision to the year-end dividend forecast
Daifuku has revised its year-end dividend to 45 yen per share, from 60 yen for the fiscal year ending March 31,
2020. Accordingly, the annual dividend per share is projected to be 75 yen. The consolidated dividend payout
ratio of 30% is to be maintained on a three-year (FY2017-FY2019) average during the ongoing medium-term
business plan.
© 2019 Daifuku Co., Ltd.
60.6
83.2
103.1 109.4
148.5
118.1
120.8
100.4
129.1
140.6
104.8
128.7
100.4 113.8
74.0
73.2
77.0 96.5
85.099.0
108.0
112.7
97.2
113.4
119.9128.8
96.1
112.5
Q1 Q2 Q3 Q4 Q1 Q2 Q3 Q4 Q1 Q2 Q3 Q4 Q1 Q2 Q3 Q4
FY2016 FY2017 FY2018 FY2019
Orders
Sales
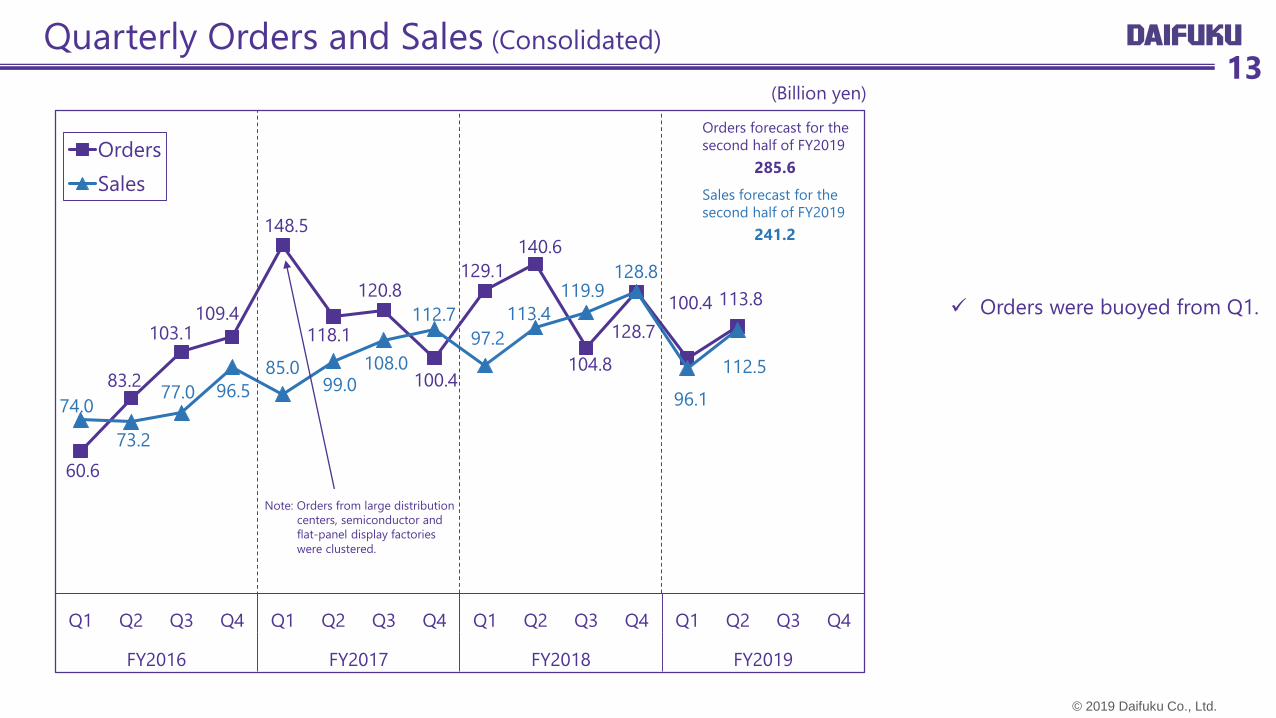
✓ Orders were buoyed from Q1.
Note: Orders from large distribution
centers, semiconductor and
flat-panel display factories
were clustered.
Orders forecast for the
second half of FY2019
Sales forecast for the
second half of FY2019
(Billion yen)
Quarterly Orders and Sales (Consolidated)13
285.6
241.2
© 2019 Daifuku Co., Ltd.
182.4192.3
218.5
231.4
294.9
314.0326.8
314.5
346.4
373.6 358.5 358.4
362.7 364.0
386.2408.4
Q1 Q2 Q3 Q4 Q1 Q2 Q3 Q4 Q1 Q2 Q3 Q4 Q1 Q2 Q3 Q4
FY2016 FY2017 FY2018 FY2019
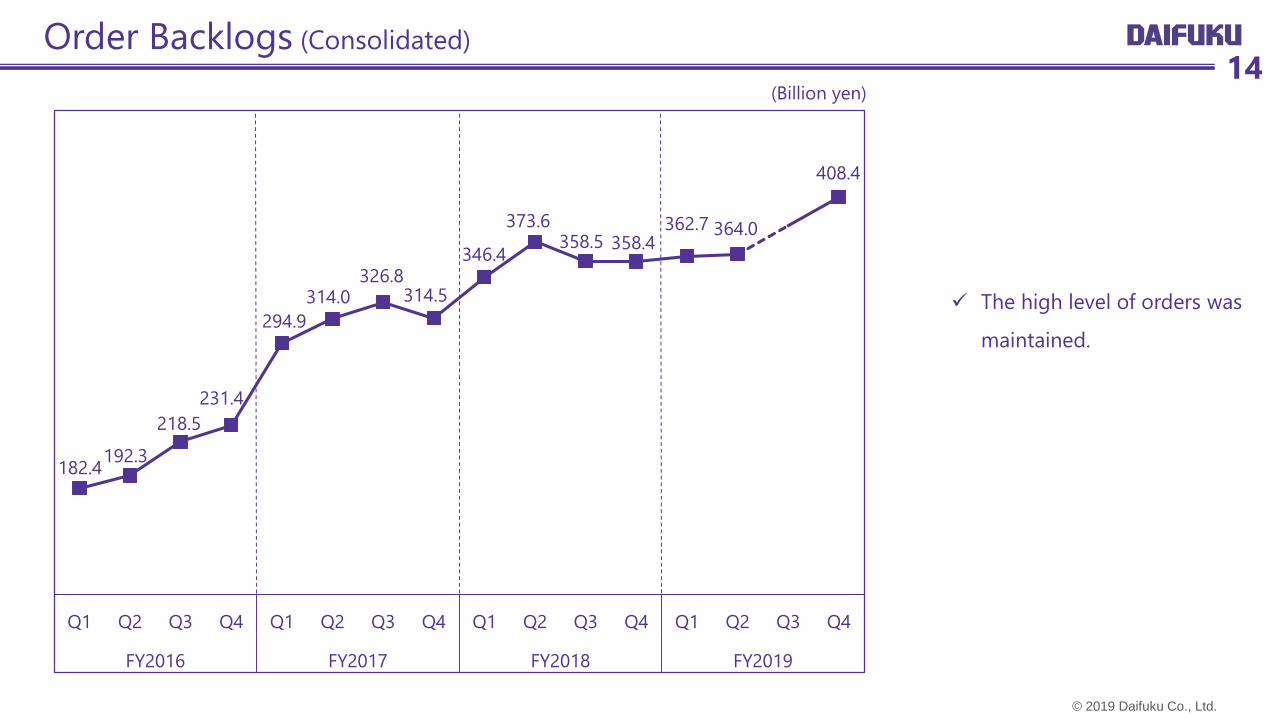
✓ The high level of orders was
maintained.
Order Backlogs (Consolidated)14
(Billion yen)
© 2019 Daifuku Co., Ltd.
15Topics
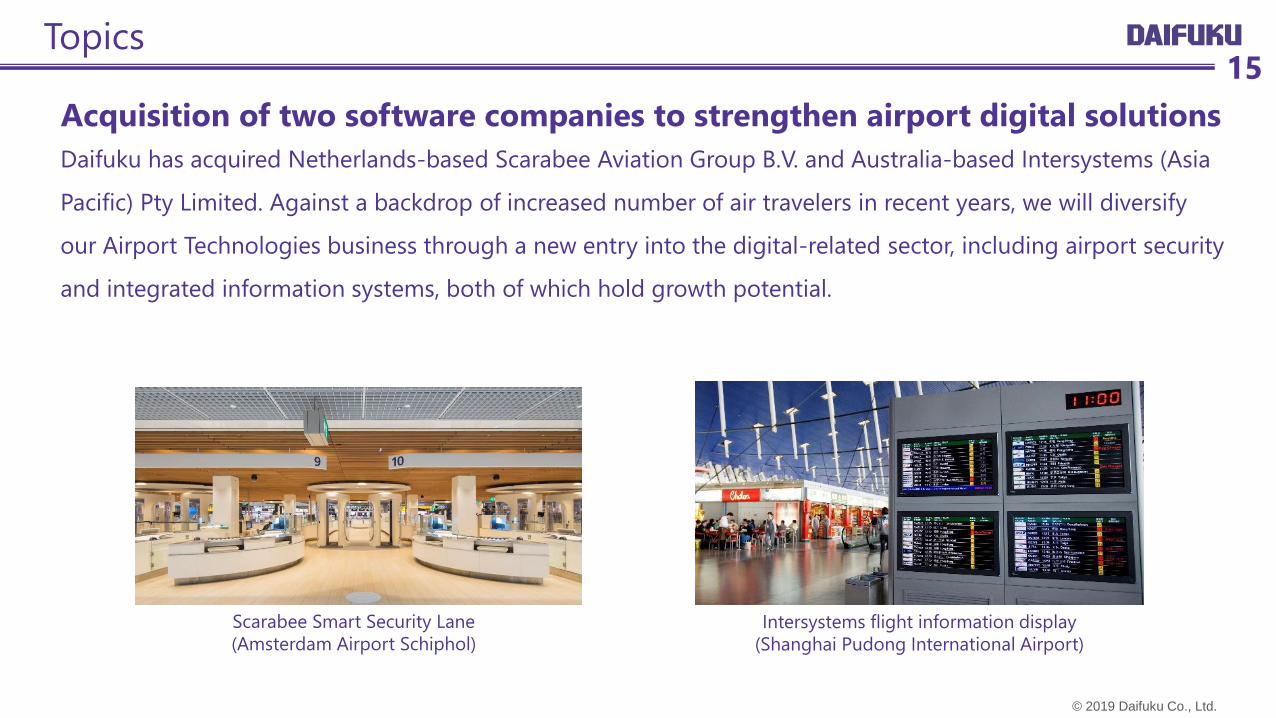
Acquisition of two software companies to strengthen airport digital solutions
Daifuku has acquired Netherlands-based Scarabee Aviation Group B.V. and Australia-based Intersystems (Asia
Pacific) Pty Limited. Against a backdrop of increased number of air travelers in recent years, we will diversify
our Airport Technologies business through a new entry into the digital-related sector, including airport security
and integrated information systems, both of which hold growth potential.
Scarabee Smart Security Lane
(Amsterdam Airport Schiphol)
Intersystems flight information display
(Shanghai Pudong International Airport)
© 2019 Daifuku Co., Ltd.
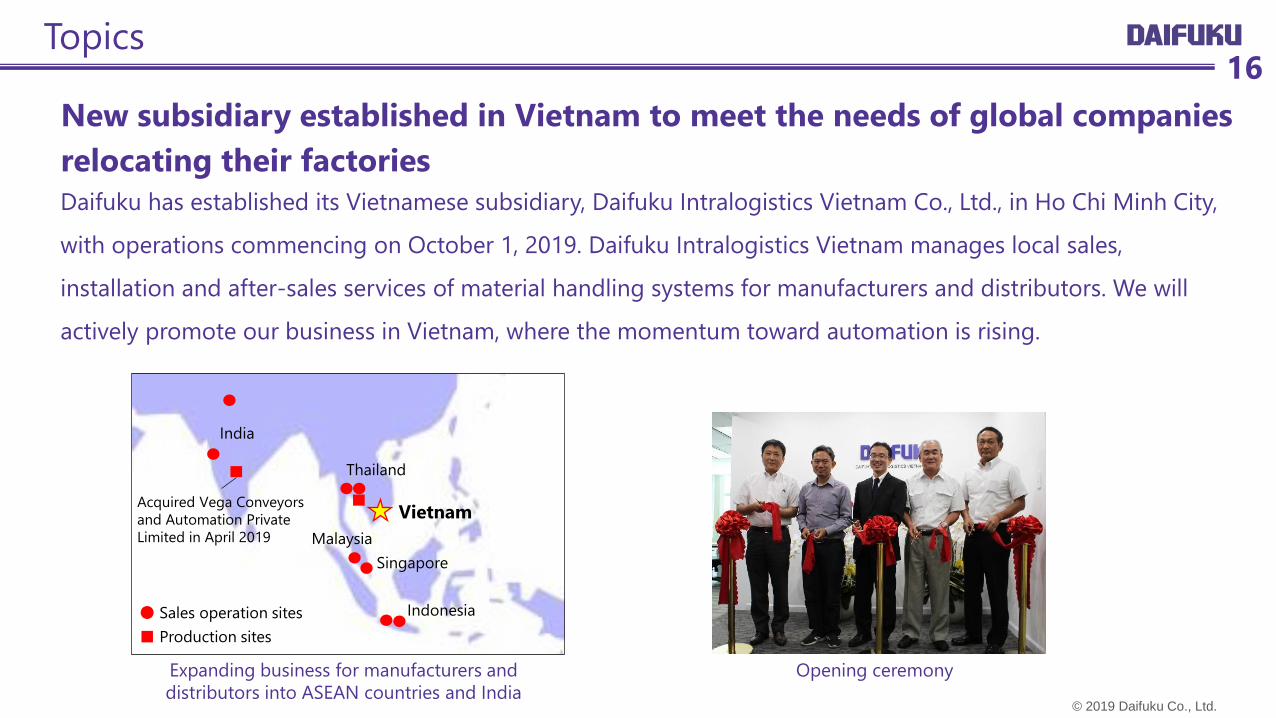
16Topics
Vietnam
Malaysia
Singapore
India
Indonesia
Expanding business for manufacturers and
distributors into ASEAN countries and India
Opening ceremony
Thailand
● Sales operation sites
■ Production sites
Acquired Vega Conveyors
and Automation Private
Limited in April 2019
New subsidiary established in Vietnam to meet the needs of global companies
relocating their factories
Daifuku has established its Vietnamese subsidiary, Daifuku Intralogistics Vietnam Co., Ltd., in Ho Chi Minh City,
with operations commencing on October 1, 2019. Daifuku Intralogistics Vietnam manages local sales,
installation and after-sales services of material handling systems for manufacturers and distributors. We will
actively promote our business in Vietnam, where the momentum toward automation is rising.
© 2019 Daifuku Co., Ltd.
Cautionary Statement with Respect to Forward-Looking Statements
The strategies, beliefs and plans related to future business performance as described in this document are not established facts. They are business prospects based on the assumptions and beliefs of themanagement team judging from the most current information, and therefore, these prospects are subject to potential risks and uncertainties. Due to various crucial factors, actual results may differmaterially from these forward-looking statements. These crucial factors that may adversely affect performance include 1) consumer trends and economic conditions in the Daifuku Group's operatingenvironment; 2) the effect of yen exchange rates on sales, assets and liabilities denominated in U.S. dollars and other currencies; 3) the tightening of laws and regulations regarding safety and othermatters that may lead to higher costs or sales restrictions; and 4) the impact of natural disasters and intentional threats, war, acts of terrorism, strikes, and plagues. Moreover, there are other factors thatmay adversely affect the Group's performance.
© 2019 Daifuku Co., Ltd.
Recommended
![[Overview of the consolidated financial results]...[Overview of the consolidated financial results] We posted revenue of 4,527.1 billion yen, up 2.6 billion yen from the previous year,](https://img.pdfslide.us/doc/110x75/5e2c1adca539961b0e2c7a89/overview-of-the-consolidated-financial-results-overview-of-the-consolidated.jpg)