Confidential & Proprietary Copyright © 2007 The Nielsen Company
“People, Places and Effecting Change in the consumption of Fruit and Vegetables”
Ron LemaireRon Lemaire5 to 10 a day, for better health!5 to 10 a day, for better health!

Footer
Objectives
Eating Well With Canada’s Food Guide provides clear recommendations for fruit and vegetable consumption. The 5 to 10 a Day program has been promoting the consumption of fruit and vegetables to Canadians since the early nineties through its partners the Heart and Stroke Foundation of Canada, the Canadian Cancer Society and the Canadian Produce Marketing Association. The program clearly indicates the health benefits of consuming the recommended number of servings per day. Despite these efforts, the vast majority of Canadians are not eating the recommended amounts of fruits and vegetables per day. Canadian Community Health Survey data indicate variation of fruit and vegetable consumption by age, gender and socioeconomic status.
This presentation will: • Review demographic variation in fruit and vegetable consumption and its relationship to public health. • Analyze prices and price variances for the top ten fruits and vegetables sold in Canada on a national and regional level and place these within the context of food security issues. • Identify opportunities and challenges in implementing interventions to address the increased consumption of fruit and vegetables in Canada.

Footer
Awareness among both men and women is now at record high levels. More than half of adult Canadian women are aware of the program (51% combined).
40%37%
35%33%
22%18%
55%51%52%
44%
34%28%
0%
10%
20%
30%
40%
50%
60%
2001 2002 2003 2005 2007 2008
Males
Females
Source: Nielsen “5 to 10 a day for better health” survey results for 2001, 2002, 2003, 2005, 2007 and 2008.
Gender - National Awareness of the “5 to 10 per day” campaignGender - National Awareness of the “5 to 10 per day” campaign

Footer
Although general awareness of the campaign is encouraging and growing, still less than a quarter of Canadians actually consume the recommended daily servings of
fruits/vegetables.
26% 25% 25% 26%24%
2002 2003 2005 2007 2008
National % of Canadian Head of HHLD Who National % of Canadian Head of HHLD Who Consume at least the required 5 to 10 per dayConsume at least the required 5 to 10 per day

Footer
While a large group of Canadians are not reaching their consumption objectives we have a large group one serving away from our 5 a day goal.
National % of Canadian Head of HHLD Who National % of Canadian Head of HHLD Who Consume less than 5 to 10 per dayConsume less than 5 to 10 per day

Footer
Provincial 5 a day winners!
21%24% 23% 23% 24% 25%
Maritimes Quebec Ontario Man/Sask Alberta BC
National % of Canadian Head of HHLD Who National % of Canadian Head of HHLD Who Consume at least the required 5 to 10 per day Consume at least the required 5 to 10 per day
by Provinceby Province

Footer
Does Income matter?
National % of Canadian Head of HHLD Who National % of Canadian Head of HHLD Who Consume produce by serving Consume produce by serving
44 43
37 3634
30
39 38 39
43 42 43
1719
2421
2427
under$20k
$20-$29k $30-$39k $40-$49k $50-$69k $70k+
less than 3
3 to 4 Servings
more than 5

Footer
Consumption by Province
0
5
10
15
20
25
30
35
40
45
50
Mar
itim
es PQ ON
Man
/Sas
k AB BC
Less than 3 servings
3-4 servings
More than 5

Footer
Serving consumed by Age
0
10
20
30
40
50
60
70
80
90
Hhage18-24
Hhage25-34
Hhage35/44
Hhage<40
Hhage45/54
Hhage55/64
Hhage65+
Less than 5
More than 5

Footer
Quality and price are also the greatest influencing factors when choosing which fruits or vegetables to buy.
77% 77%
52%43%
39% 36%
10% 9% 8%
Quality Price Preference ofhousehold
Produce issold loose
HealthBenefits
Produce islocally grown
Produce isorganic
Other Produce issold pre-packaged
National – Choice InfluencersNational – Choice Influencers
Source: Nielsen “5 to 10 a day for better health” survey results for 2008.

Footer
Interestingly, price sensitivity doesn’t seem to be higher for lower income households. All income brackets seem equally as sensitive to price when
choosing which fruit or vegetable to purchase.
79% 75% 76% 79% 76% 76%
under $20k $20-$29k $30-$39k $40-$49k $50-$69k $70k+
Source: Nielsen “5 to 10 a day for better health” survey results for 2008.
National – Price sensitivity amongst income groupsNational – Price sensitivity amongst income groups

Footer
Where we Shop?
0
10
20
30
40
50
60
70
80
90
100
U$20K $20-$29K
$30-$39K
$40-$49K
$50-$69K
$70K+
TRADITIONAL GROCERYSUPERMARKET
WAREHOUSE CLUBOUTLET
PRODUCE SPECIALITYSTORE
OTHER
DO NOT PURCHASE ANYFRESH FRUITS ORVEGETABLES

Footer
The principle reason I shop at this location is because
of the fresh fruits and vegetables sold there.
0.0
10.0
20.0
30.0
40.0
50.0
60.0
70.0
80.0
90.0
100.0
U$20K $20-$29K $30-$39K $40-$49K
FALSE
TRUE

Footer
Feeding Canada

Footer
Feeding the North – F&V
Food Mail SuccessFood Mail SuccessFunded by INAC Funded by INAC
Federal Government SubsidizedFederal Government SubsidizedCanada Post SupportCanada Post Support
LobbyingLobbyingHealth CanadaHealth CanadaDiabetes foundationDiabetes foundationNorth West CompanyNorth West Company

Footer
Comparative Food Price Increases
Inflation Feb 2008• Fruit, -6.7%• Veggies, -11.6%
Footer
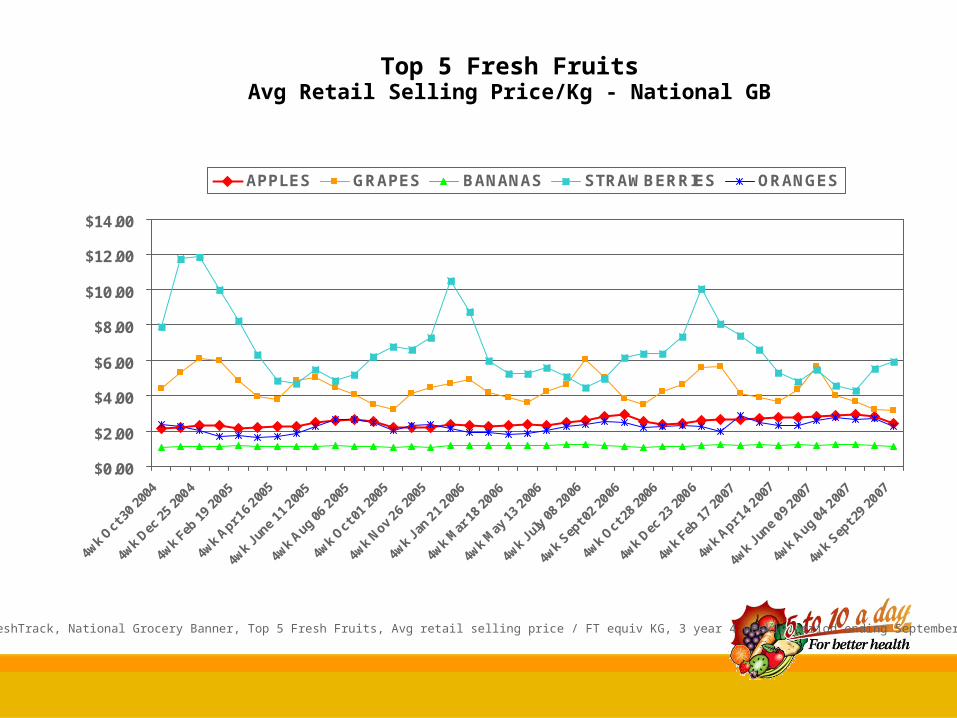
Top 5 Fresh FruitsAvg Retail Selling Price/Kg - National GB
Source: Nielsen FreshTrack, National Grocery Banner, Top 5 Fresh Fruits, Avg retail selling price / FT equiv KG, 3 year 4 weekly period ending September 29th, 2007.
$0.00
$2.00
$4.00
$6.00
$8.00
$10.00
$12.00
$14.00
4wk O
ct 30
2004
4wk D
ec 2
5 20
04
4wk F
eb 1
9 2005
4wk A
pr 16 2
005
4wk J
une 1
1 200
5
4wk A
ug 06 2
005
4wk O
ct 01
2005
4wk N
ov 26
2005
4wk J
an 2
1 200
6
4wk M
ar 1
8 2006
4wk M
ay 13
200
6
4wk J
uly
08 2
006
4wk S
ept 0
2 2006
4wk O
ct 28
2006
4wk D
ec 2
3 20
06
4wk F
eb 1
7 2007
4wk A
pr 14 2
007
4wk J
une 0
9 200
7
4wk A
ug 04 2
007
4wk S
ept 2
9 2007
APPLES GRAPES BANANAS STRAWBERRIES ORANGES

Footer
$0.00
$5.00
$10.00
$15.00
$20.00
$25.00
$30.00
$35.00
$40.00
$45.00
$50.00
4wk O
ct 30
2004
4wk D
ec 2
5 20
04
4wk F
eb 1
9 2005
4wk A
pr 16 2
005
4wk J
une 1
1 200
5
4wk A
ug 06 2
005
4wk O
ct 01
2005
4wk N
ov 26
2005
4wk J
an 2
1 200
6
4wk M
ar 1
8 2006
4wk M
ay 13
200
6
4wk J
uly
08 2
006
4wk S
ept 0
2 2006
4wk O
ct 28
2006
4wk D
ec 2
3 20
06
4wk F
eb 1
7 2007
4wk A
pr 14 2
007
4wk J
une 0
9 200
7
4wk A
ug 04 2
007
4wk S
ept 2
9 2007
TANGERINES/CLEMENTINES CHERRIES PEARS WATERMELON BLUEBERRIES
Source: Nielsen FreshTrack, National Grocery Banner, Bottom 5 Fresh Fruits, Avg retail selling price / FT equiv KG, 3 year 4 weekly period ending September 29th, 2007.
Bottom 5 Fresh FruitsAvg Retail Selling Price/Kg - National GB

Footer
What is 1KG of fruit?
Apples: $2.87
Pears $3.41Bananas $1.31
Oranges $3.10
21 servings of Fruit - Total: 10.69

Footer
Top 5 Fresh VegetablesAvg Retail Selling Price/Kg - National GB
Source: Nielsen FreshTrack, National Grocery Banner, Top 5 Fresh Vegetables, Avg retail selling price / FT equiv KG, 3 year 4 weekly period ending September 29th, 2007.
$0.00
$1.00
$2.00
$3.00
$4.00
$5.00
$6.00
$7.00
$8.00
4wk O
ct 30
2004
4wk D
ec 2
5 20
04
4wk F
eb 1
9 2005
4wk A
pr 16 2
005
4wk J
une 1
1 200
5
4wk A
ug 06 2
005
4wk O
ct 01
2005
4wk N
ov 26
2005
4wk J
an 2
1 200
6
4wk M
ar 1
8 2006
4wk M
ay 13
200
6
4wk J
uly
08 2
006
4wk S
ept 0
2 2006
4wk O
ct 28
2006
4wk D
ec 2
3 20
06
4wk F
eb 1
7 2007
4wk A
pr 14 2
007
4wk J
une 0
9 200
7
4wk A
ug 04 2
007
4wk S
ept 2
9 2007
TOMATOES POTATOES PEPPERS CARROTS ONIONS

Footer
Bottom 5 Fresh VegetablesAvg Retail Selling Price/Kg - National GB
Source: Nielsen FreshTrack, National Grocery Banner, Bottom 5 Fresh Vegetables, Avg retail selling price / FT equiv KG, 3 year 4 weekly period ending September 29th, 2007.
$0.00
$1.00
$2.00
$3.00
$4.00
$5.00
$6.00
$7.00
$8.00
$9.00
4wk O
ct 30
2004
4wk D
ec 2
5 20
04
4wk F
eb 1
9 2005
4wk A
pr 16 2
005
4wk J
une 1
1 200
5
4wk A
ug 06 2
005
4wk O
ct 01
2005
4wk N
ov 26
2005
4wk J
an 2
1 200
6
4wk M
ar 1
8 2006
4wk M
ay 13
200
6
4wk J
uly
08 2
006
4wk S
ept 0
2 2006
4wk O
ct 28
2006
4wk D
ec 2
3 20
06
4wk F
eb 1
7 2007
4wk A
pr 14 2
007
4wk J
une 0
9 200
7
4wk A
ug 04 2
007
4wk S
ept 2
9 2007
LETTUCE MUSHROOMS CUCUMBERS BROCCOLI CELERY

Footer
What is 1kg of Veggies?
Carrots loose:2 @ $1.29
OR
Baby Carrots: $1.99
Tomato: $4.01
Mushrooms loose: $6.49
Red Peppers: $5.71

Footer
What is 1kg of Veggies?
Broccoli $3.98
White Onions:$2.51
Cucumbers: $2.37
61 servings of Veggie Total: 31.95
Potatoes: $2.31
Head lettuce $2.58

Footer
The Total Impact
13kg of food is approx 113 servings of F&V - Total Cost of $42.64 (Ottawa)
113 servings can feed a family of four for one weekwith the recommended number of servings per day

Footer
Opportunity
• 41% of Canadians between 3 to 4 servings.– Need for more social and environment reform to support access
issues
• Provide Target programs to core groups (kids and lower SES)• Changes in regulatory environment to support more fruit
and vegetable consumption through labelling regs, access etc. • Changing cultural and social environments towards fruit
and vegetables.• 5 to 10 a day message is beginning to penetrate market
(we need to work together – 5 to 10 a day - gov’t and public health)

Footer
How do we work together? What tools

FooterConfidential & Proprietary • Copyright © 2007 The Nielsen Company
Contact CPMA for more Contact CPMA for more informationinformation
613-226-4187613-226-4187
Recommended