29AP08UMPIRE 1
Comparison of University of
Michigan CIREN Cases to
Existing Types of Crash Tests
University of Michigan Program for Injury Research and Education

29AP08UMPIRE 2
Project Focus
• The key to advancing crash safety is to
understand and address serious injuries to
motor vehicle crash-involved occupants
• The goals of this study were to:
– Compare the cases in the U of M - CIREN
database to existing industry crash test types
– Analyze the injuries in these cases in terms of
biomechanics, injury assessment methods,
and vehicle design enablers

29AP08UMPIRE 3
U-M CIREN data
• The U-M CIREN database is a subset of the Crash Injury Research Engineering Network (CIREN) database, which represents seriously injured motor vehicle crash-involved occupants treated at level I trauma centers
• CIREN contains extensive crash reconstruction and medical injury profiles for each case
• CIREN contains the injuries and crashes within its selection criteria that are occurring in spite of advancements of crash safety and need to be addressed to further improve crash safety

29AP08UMPIRE 4
CIREN Database Considerations
• The CIREN database does not represent the entire accident-involved population
• The CIREN database includes only relatively seriously injured occupants which makes it difficult to draw conclusions about the effectiveness of current safety and vehicle development practices
• Consideration must be made to ensure that countermeasures implemented to address serious injuries in the U of M - CIREN database do not increase the potential for injury to currently uninjured occupants and those with only minor injuries
uninjured)#injured(#
injured#
exposed#
injured#risk

29AP08UMPIRE 5
CIREN Adult Selection CriteriaRevised 10/2006
* Cases where the vehicle is >6 yrs old may be considered for enrollment if the vehicle contained advanced safety components – NHTSA approval required
** AIS of 2 in 2 or more body regions with medical significance (avoid concussive type injury for inclusion)
* *AIS of 2 in the lower extremity with significant articular injury (pilon/talus/calcaneus/Lisfranc/Choparts)
*** Max. PI SI cases allowed per site per year would be 5 based on a 50 case enrollment (10%)
**** Cases must be extraordinary for consideration – NHTSA approval required
Case Type Crash Direction Vehicle Criteria Restraint Criteria Occupant
Positions
Injury Thresholds
Air bag, Air bag and 3-point belt Row 1
Must be in 3-point belt and gross misuse not
documentedRows 2+
Side8 to 10 o'clock
2 to 4 o' clock
CY-6 yrs*
(Priority on
newest vehicles)
Any and all, including unrestrained on struck side and
far sideAny AIS>3 or **
Rollover All
CY-6 yrs*
(Priority on
newest vehicles)
Any and all, including unrestrained (EXCEPTION =
100% EJECTION)Any AIS>3 or **
Pregnant
Occupant
(total
enrollment
limited)
10 to 2 o'clock
Full frontal
Offset Frontal
CY-8 yrs*
(Priority on
newest vehicles)
Must be in a 3-point belt and gross misuse not
documented
Avoid out-of-position cases
(call NHTSA on non-belted cases for consideration)
Any
AIS2+
AIS1
(with modedrate to
severe impact)
PI Special
Interest ***Any Any Any Any Any
Success
Case****Any CY-6 yrs*
Appropriate restraint usage
(belt and/or air bag)Any Any
Fire All Any Any and all, including unrestrained Any AIS>2
Frontal
10 to 2 o'clock
Full frontal
Offset Frontal
CY-6 yrs*
(Priority on
newest vehicles)
AIS>3 or **
29AP08UMPIRE 6
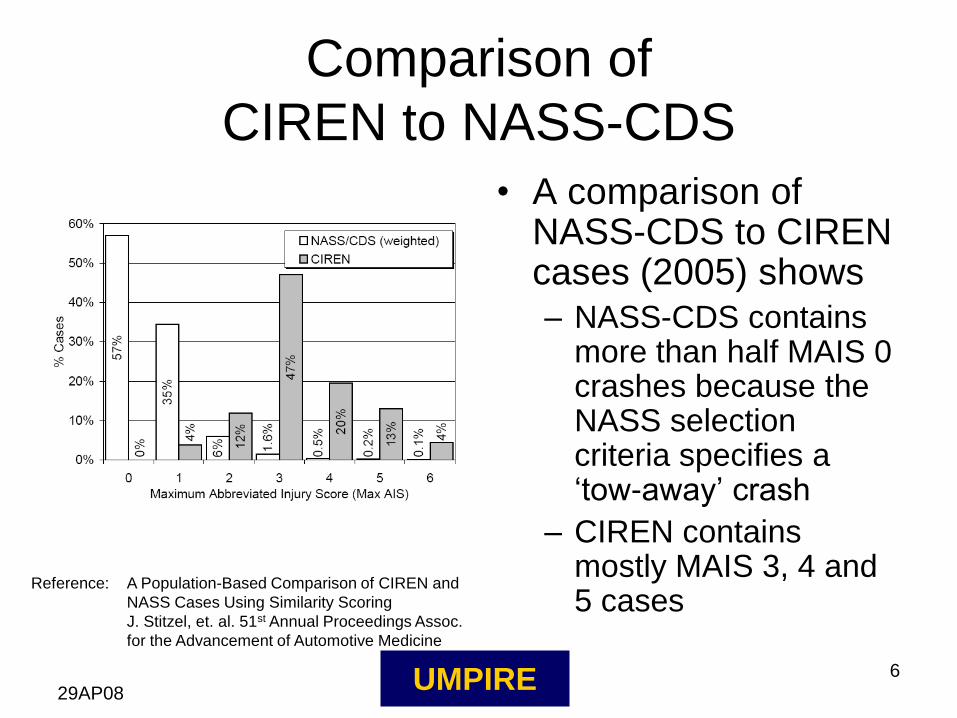
Comparison of
CIREN to NASS-CDS
• A comparison of NASS-CDS to CIREN cases (2005) shows– NASS-CDS contains
more than half MAIS 0 crashes because the NASS selection criteria specifies a ‘tow-away’ crash
– CIREN contains mostly MAIS 3, 4 and 5 cases
Reference: A Population-Based Comparison of CIREN and
NASS Cases Using Similarity Scoring
J. Stitzel, et. al. 51st Annual Proceedings Assoc.
for the Advancement of Automotive Medicine

29AP08UMPIRE 7
Comparison of
CIREN to NASS-CDS
• A comparison of AIS
3+ NASS-CDS to
CIREN cases (2005)
shows a similar
distribution of
Maximum AIS
Reference: A Population-Based Comparison of CIREN and
NASS Cases Using Similarity Scoring
J. Stitzel, et. al. 51st Annual Proceedings Assoc.
for the Advancement of Automotive Medicine

29AP08UMPIRE 8
Study Population
• The study included 442 cases from the U
of M – CIREN database as of August,
2007
• Injury analysis focused on AIS 3+ injuries

29AP08UMPIRE 9
U of M – CIREN Database
Demographics – Highlights• Occupants:
– 54% female, 46% male
– Average age of 40 years old
– Average Body Mass Index (BMI) of 26.5 = Overweight category
– 71% were drivers, 20% were right front passengers
• Restraints:– 68% of women were using 3-point seat belts
– 55% of men were using 3-point seat belts
• Vehicles:– 84% were produced by GM, Ford and Chrysler
– Vehicle age ranged from 1989-2006 model year with 63% of vehicles from 1995-2000 model years

29AP08UMPIRE 10
NHTSA rescinds Passive Rule
NHTSA proposes Passive Restraint / Belt Use Alt.
Hybrid III test dummy allowed as alternative to HII
Advanced Air Bag Rule
Advanced Air Bag Proposal
Hybrid III test dummy only allowed (on & after 9/97)
NHTSA requires air bags (phase-in effective 9/96 thru 9/98)
Passive Restraint Rule for LTVs (Phase-in effective 9/94 thru 9/97)
Advanced Air Bag RuleΦ3: 9/09 – 9/12 (5th @ 35mph)
Advanced Air Bag RuleΦ1: 9/03 – 9/06
NHTSA allows
Depowered Air Bags
On and after 9/1/91 - All LTVs < 8,500# GVWR and < 5,500# UVW; must
comply with dynamic test requirements with manual lap/shoulder belts
Passive Restraint Rule for Passenger Cars
Phase-in (9/86 thru 9/89)
Advanced Air Bag RuleΦ2: 9/07 – 9/10 (50th @ 35mph)
2010200019901980
FMVSS 208 occupant crash
protection technology and
requirements have evolved.
Thus not all case vehicles
were designed to the same
requirements.

29AP08UMPIRE 11
Assigning CDCs to Crash Test Types
• Collision Deformation Codes (CDCs) were
assigned to regulated and other common
industry crash tests of
– Midsize sedans
– Small sedans
– Small coupes
– Large SUVs

29AP08UMPIRE 12
CDC coding:
Reference: SAE Surface Vehicle Standard J224
Collision Deformation Classification, Rev. March, 1980
Columns 1 and 2 Column 3
F Front Column 7
Front R Right Side
B Back/Rear
L Left Side
T Top
Left Right U Undercarriage
X Unclassifiable
Rear
Column 4 Column 5
D Distributed - side or end Vert Choices - for front/side rear
L Left - front or rear A All
C Center - front or rear H Top of frame to top of vehicle
R Right - front or rear E Everything below beltline
F Side front - left or right G Beltline and above
P Side center section - left or right M Middle - top of frame to beltline/hood
B Side rear - left or right L Frame - top of frame to bottom frame
Y F+P or L+C W Wheels/tires - below undercarriage
Z B+P or R+C
Column 6
W Wide impact area (>16")
N Narrow impact area (<16")
S Sideswipe (0" to 4") Lat Choices - for Top and Undercarriage
O Rollover D Distributed
A Overhanging structures (inverted step) L Left
E Corner (from corner to 16"/410mm) C Center
K Conversion in impact type (mult. CDC) R Right
U No residual deformation Y L and C
Z R and C

29AP08UMPIRE 13
CDC Extent
• There are many possible measures of
crash severity (Delta V, Equivalent Barrier
Speed, Extent of Crush, etc.)
• This analysis is based only on CDC extent
which is determined by how far the crush
extends into the vehicle in the impact
direction

29AP08UMPIRE 14
U of M - CIREN Case Matching to
Crash Test Configurations• 295 of 442 cases were matched to current crash
test configurations (regulated, consumer metric, and development tests) based on CDCs developed from crash test photos (ignoring CDC extent)
• 61 additional cases were matched to current crash test configurations after in-depth case reviews
• 77 cases were assigned to crash configurations without a matching crash test
• 9 cases were so unique that they could not be categorized

29AP08UMPIRE 15
In many cases, crash damage
closely resembled deformation
from crash tests

29AP08UMPIRE 16
0 Degree Frontal
Comparable Case PhotoCrash Test Photo

29AP08UMPIRE 17
Frontal Center Pole
Crash Test Photo Comparable Case Photo

29AP08UMPIRE 18
IIHS Side Impact
Comparable Case PhotoCrash Test Photo

29AP08UMPIRE 19
In some cases, crash damage within a
CDC category varied from crash test
deformation.

29AP08UMPIRE 20
12FYEW3 – Left Angle or Offset

29AP08UMPIRE 21
31.7% of cases had similar configurations but greater CDC extents than current crash tests
19.5% of cases had configurations that differed from current crash tests
= Test Configuration
≤ Test Extent
= Test Configuration
> Test Extent
≠ Test Configuration
48.9% of cases had configurations and CDC extents similar to current crash tests
U-M CIREN
All Cases

29AP08UMPIRE 22
U-M CIREN vs. All CIREN
First impact only
Excluding "unknow n" CDCs
Excluding cases w ithout CDCs
n=2089
Does not match U-M CIREN CDC
48.9% 47.5%
U-M CIREN n=442 All CIREN n=2089
25.8%
14.4%
12.3%
31.7%
19.5%
= Test Configuration
≤ Test Extent
= Test Configuration
> Test Extent
≠ Test Configuration

29AP08UMPIRE 23
= Test Configuration, ≤ Test Extent
By Test Type
= Test Configuration
≤ Test Extent
0.0%
2.0%
4.0%
6.0%
8.0%
10.0%
12.0%
14.0%
16.0%
18.0%
0 d
eg fro
nta
l
left a
ngle
or
offset
right angle
or
offset
fronta
l cente
r pole
fronta
l offset pole
bum
per
underr
ide
sid
e N
CA
P
IIH
S s
ide
sid
e p
ole
rollo
ver
Perc
en
tag
e o
f D
ata
set
U-M CIREN
All CIREN
0
10
20
30
40
50
60
70
0 deg frontal left angle or
offset
right angle
or offset
frontal
center pole
frontal offset
pole
bumper
underride
side NCAP IIHS side side pole rollover
Frontal Impact Test Types Side Impact Test Types Non-
arrested
rollover
Co
un
t o
f U
MP
IRE
Cases

29AP08UMPIRE 24
= Test Configuration, > Test Extent
By Test Type
= Test Configuration
> Test Extent
0.0%
1.0%
2.0%
3.0%
4.0%
5.0%
6.0%
7.0%
8.0%
9.0%
10.0%
0 d
eg fro
nta
l
left a
ngle
or
offset
right angle
or
offset
fronta
l cente
r pole
fronta
l offset pole
bum
per
underr
ide
IIH
S s
ide
sid
e N
CA
P
sid
e p
ole
rollo
ver
Perc
en
tag
e o
f D
ata
set
U-M CIREN
All CIREN
0
10
20
30
40
50
60
70
0 deg frontal left angle or
offset
right angle
or offset
frontal
center pole
frontal offset
pole
bumper
underride
side NCAP IIHS side side pole rollover
Frontal Impact Test Types Side Impact Test Types Non-
arrested
rollover
Co
un
t o
f U
MP
IRE
Cases

29AP08UMPIRE 25
≠ Test Configuration
By Configuration
≠ Test Configuration
0
5
10
15
20
25
30
left s
mall
overlap
right sm
all
overlap
underr
ide
hig
h
underc
arr
iage
corn
er
underr
ide
offset
underr
ide
sid
esw
ipe
sid
e im
p. non-
occ. com
p.
IIH
S s
ide -
shift
ed r
wd
obliq
ue s
ide
IIH
S s
ide -
dis
trib
ute
d
IIH
S s
ide -
shift
ed fw
d
sid
e N
CA
P -
shift
ed r
wd
sid
e N
CA
P -
dis
trib
ute
d
sid
e o
bliq
ue
pole
not
cate
gorized
arr
este
d
rollo
ver
full
overlap
rear
impact
part
ial o
verlap
rear
impact
rear
angle
narr
ow
overlap r
ear
Add'l Frontal Crash Types Add'l Side Crash Types Other
Crash
Types
Add'l Rear Crash
Types
Co
un
t o
f U
MP
IRE
Cases
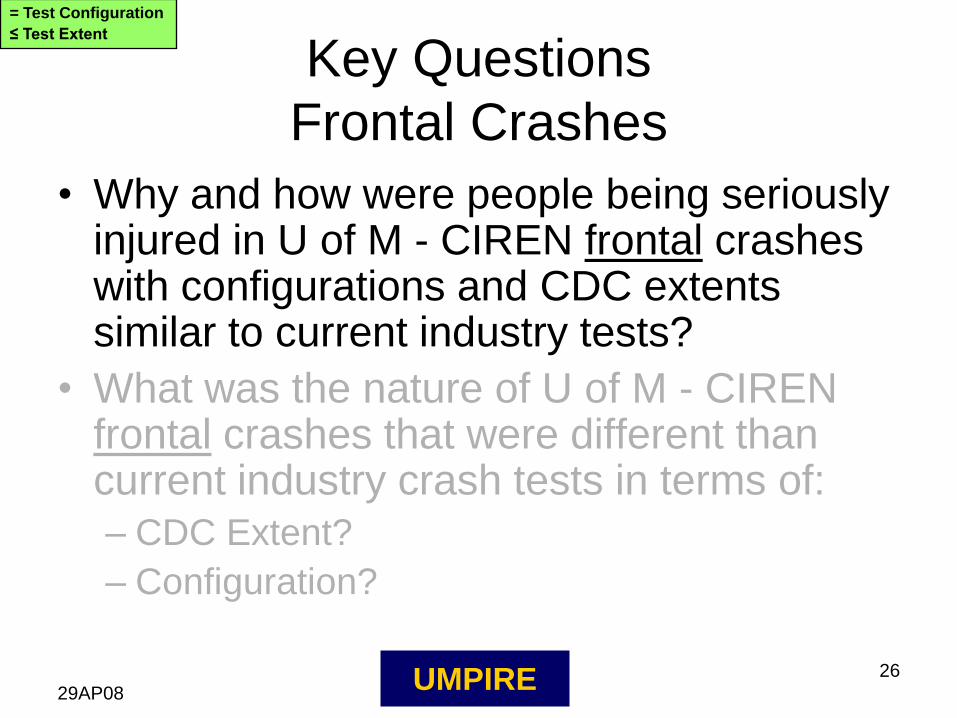
29AP08UMPIRE 26
Key Questions
Frontal Crashes
• Why and how were people being seriously injured in U of M - CIREN frontal crashes with configurations and CDC extents similar to current industry tests?
• What was the nature of U of M - CIREN frontal crashes that were different than current industry crash tests in terms of:
– CDC Extent?
– Configuration?
= Test Configuration
≤ Test Extent

29AP08UMPIRE 27
32.1% of frontal cases had similar configurations but greater CDC extents than current crash tests
14.1% of frontal cases had configurations that differed from current crash tests
= Test Configuration
≤ Test Extent
= Test Configuration
> Test Extent
≠ Test Configuration
53.8% of frontal cases had configurations and CDC extents similar to current crash tests
U-M CIREN
Frontal Cases

29AP08UMPIRE 28
Top 10 Contact Locations
Frontal CrashesFrontal Impact Test Types - AIS 3+ - Extent <= test
0 20 40 60 80 100
Seat
Seatbelt and
airbag
Roof/Roofrail
Toe pan/pedals
Door
Side structure
Airbag
Steering wheel
Seatbelt
Instrument panel
Co
nta
ct
Lo
cati
on
Number of Injuries
• 65% of injuries were
assigned to contact
with the instrument
panel, seatbelt,
steering wheel, and
airbag
• 11% of injuries were
assigned to contact
with the vehicle side
structure and door
= Test Configuration
≤ Test Extent

29AP08UMPIRE 29
Frontal Crashes
Injuries Assigned to
Instrument Panel
= Test Configuration
≤ Test Extent

29AP08UMPIRE 30
Frontal Crashes
Instrument Panel – Injuries by Body Region
• 72% of injuries
assigned to the
instrument panel were
to lower extremities
• 12% were forearm
injuries
Body regions with ≤ 1 injury/region not shown
= Test Configuration
≤ Test Extent
0 10 20 30 40 50
lung
ribs
radius
ulna
tibia
pelvis
femur
Instr
um
ent
panel
Co
nta
ct
Lo
cati
on
Number of Injuries

29AP08UMPIRE 31
Frontal Impact Cases
Instrument Panel – Injuries by Gender
• Women had fewer pelvic fractures
– The difference in belt usage rates
alone between men (55%) and women
(68%) did not completely account for
this
Body regions with ≤ 1 injury/region not shown
= Test Configuration
≤ Test Extent
0 5 10 15 20 25
lung
ribs
radius
ulna
tibia
pelvis
femur
Instr
um
ent
panel
Co
nta
ct
Lo
cati
on
Number of Injuries
Frontal Impact Test Types - AIS 3+ - Extent <= test - Male
Frontal Impact Test Types - AIS 3+ - Extent <= test - Female
Male Female

29AP08UMPIRE 32
Frontal Impact Cases
Instrument Panel – Injuries by Gender
• Women had fewer pelvic fractures
– Pelvic geometry and weight distribution
differences are likely responsible.
Body regions with ≤ 1 injury/region not shown
= Test Configuration
≤ Test Extent
0 5 10 15 20 25
lung
ribs
radius
ulna
tibia
pelvis
femur
Instr
um
ent
panel
Co
nta
ct
Lo
cati
on
Number of Injuries
Frontal Impact Test Types - AIS 3+ - Extent <= test - Male
Frontal Impact Test Types - AIS 3+ - Extent <= test - Female
Male Female
– Abdominal weight of men loads through
the pelvis during a frontal impact.
– Hip weight of women is more closely
coupled to the thighs and loads the
pelvis less during a frontal impact.
Male Female

29AP08UMPIRE 33
Frontal Impact Cases
Instrument Panel – Injuries by Gender
• Women had fewer pelvic fractures
– Pelvic geometry and weight distribution
differences are likely responsible.
Body regions with ≤ 1 injury/region not shown
= Test Configuration
≤ Test Extent
0 5 10 15 20 25
lung
ribs
radius
ulna
tibia
pelvis
femur
Instr
um
ent
panel
Co
nta
ct
Lo
cati
on
Number of Injuries
Frontal Impact Test Types - AIS 3+ - Extent <= test - Male
Frontal Impact Test Types - AIS 3+ - Extent <= test - Female
Male Female
– The male pelvis is generally taller and
narrower than the female pelvis
– The cup of the acetabulum is oriented
more laterally in the male as opposed to
the female
– Thus the male pelvis may be more
susceptible to acetabulum fracture
Male Female

29AP08UMPIRE 34
Frontal Impact Cases
Instrument Panel – Injuries by Gender
• Women appeared to have slightly more
femur and tibia fractures.
– This also may be attributed to the
difference in pelvis geometry and weight
distribution as well as the proximity to the
instrument panel
• Women appeared to have slightly more
forearm fractures (may not be
statistically significant…)
Body regions with ≤ 1 injury/region not shown
= Test Configuration
≤ Test Extent
0 5 10 15 20 25
lung
ribs
radius
ulna
tibia
pelvis
femur
Instr
um
ent
panel
Co
nta
ct
Lo
cati
on
Number of Injuries
Frontal Impact Test Types - AIS 3+ - Extent <= test - Male
Frontal Impact Test Types - AIS 3+ - Extent <= test - Female
Male Female

29AP08UMPIRE 35
Frontal Impact Cases
Instrument Panel – Injuries by BMI
Frontal Impact Test Types - AIS 3+ - Extent <= test
0 5 10 15 20 25 30 35 40
Underweight
Normal
Overweight
Obese
Instr
um
ent
panel
Co
nta
ct
Lo
cati
on
Number of Injuries
Frontal Impact Test Types - AIS 3+ - Extent <= test
UMPIRE Database
0 10 20 30 40 50 60
Under weight
Normal
Overweight
Obese
Count of UMPIRE Cases
Frontal Impact Test Types - Extent <= test
• Femur, pelvic, and tibia injuries increased with BMI
• Increasing BMI provides additional mass which increases occupant energy without an equivalent increase in bone strength
Femur, Pelvic, Tibia Injuries only
= Test Configuration
≤ Test Extent
All Frontal Cases
Count of cases

29AP08UMPIRE 36
Frontal Impact Cases
Injuries Assigned to Instrument Panel
Engineering Observations
= Test Configuration
≤ Test Extent
Femur loads are measured in the Hybrid III ATDs (Anthrpomorphic Test Devices or crash dummies) and regulated in crash tests

29AP08UMPIRE 37
Injury Assessment Reference Value Discussion
Femur Load Tolerance
• FMVSS 208 limits
represent a 35% risk
of a femur/patella
fracture2
– 50th Male = 10kN
– 5th Female = 6.8kN
• Femur fractures are
all AIS 3 injuries (AIS
2000)
= Test Configuration
≤ Test Extent
References: 1 Development of Improved Injury Criteria for the Assessment of
Advanced Automotive Restraint Systems
Kippenberger, et. al., 1998
Injury risk curve – 50th %ile Male1
2 Supplement: Development of Improved Injury Criteria for the
Assessment of Advanced Automotive Restraint Systems – II
Eppinger, et. al., 2000

29AP08UMPIRE 38
Frontal Impact Cases
Instrument Panel Injury
Engineering Observations
• Current trends in human body mass distribution are not
reflected in current ATDs
• Some ATDs have proportionally higher mass in the
skeleton than in the flesh as compared to humans
= Test Configuration
≤ Test Extent

29AP08UMPIRE 39
Frontal Crashes
Injuries Assigned to
Seatbelts
= Test Configuration
≤ Test Extent

29AP08UMPIRE 40
0 5 10 15 20
liver
pelvis
L-spine
hemo/pneumo
thorax/mediastinum
lung
C-spine
Hollow visceral
injury
ribs
Seatb
elt
Co
nta
ct
Lo
cati
on
Number of Injuries
Frontal Impact Cases
Seatbelt Injuries by Body Region
• 31% of injuries assigned to the seat belt were rib fractures
• 19% were hollow visceral injury (small bowel, colon, and mesentary)
• 15% were cervical spine injuries (bony and spinal cord)
Body regions with ≤ 1 injury/region not shown
= Test Configuration
≤ Test Extent

29AP08UMPIRE 41
0 2 4 6 8 10 12 14
liver
pelvis
L-spine
hemo/pneumo
thorax/mediastinum
lung
C-spine
Hollow visceral
injury
ribs
Se
atb
elt
Co
nta
ct
Lo
ca
tio
n
Number of Injuries
Frontal Impact Test Types - AIS 3+ - Male
Frontal Impact Test Types - AIS 3+ - Female
Frontal Impact Cases
Seatbelt – Injuries by Gender• Rib fractures
– Older women appear to be more susceptible
• 6 of the 12 were over 70
• 8 of the 12 were over 50
• Hollow visceral injuries (8 cases)– 4 of 5 adult male cases were in
the overweight BMI category
– 3 cases were lap-belt only restrained children
• Cervical spine injuries (7 cases)– 5 cases were older adult women
(over 56 years old)
– One case with bony cervical spine injuries involved a 4 year old female
Body regions with ≤ 1 injury/region not shown
= Test Configuration
≤ Test Extent
Male Female

29AP08UMPIRE 42
Frontal Impact Cases
Seatbelt Injuries by Age and Gender
0 2 4 6 8 10
0-10
11-20
21-30
31-40
41-50
51-60
61-70
71-80
81-90
Seatb
elt
Co
nta
ct
Lo
cati
on
Number of Injuries
Frontal Impact Test Types - AIS 3+ - Extent <= test - Male
Frontal Impact Test Types - AIS 3+ - Extent <= test - Female
0 5 10 15 20
0-10
11-20
21-30
31-40
41-50
51-60
61-70
71-80
81-90
Ag
e
Count of U-M CIREN Cases
Frontal Impact Test Types - Extent <= test - Male
Frontal Impact Test Types - Extent <= test - Female
• Seatbelt related injuries appeared to occur more frequently to younger and older occupants
– Older occupants, especially women, are more likely to be osteoporotic
– Seatbelt misuse was an issue with some younger occupants in this dataset
= Test Configuration
≤ Test Extent
Assigned to Seatbelt Contact All Frontal CasesC
on
tact
Lo
cati
on
= S
eatb
elt
Ag
e [
years
]
Male Female Male Female
Count of Cases

29AP08UMPIRE 43
Frontal Impact Cases
Seatbelt Injuries by BMIUMPIRE Database
0 10 20 30 40 50 60
Under weight
Normal
Overweight
Obese
Count of UMPIRE Cases
Frontal Impact Test Types - Extent <= test
• BMI appears to have the opposite effect on the potential for rib fractures assigned to belt contact as compared to femur, pelvic and tibia fractures assigned to instrument panel contact
• Increased BMI reduced the potential for rib fractures assigned to seat belt contact
Frontal Impact Test Types, AIS 3+, Extent <= test,
Seatbelt contacts, rib injuries
0 2 4 6 8 10
Underw eight
Normal
Overw eight
Obese
Count of Injuries
Frontal Impact Test Types, AIS 3+, Extent <= test, Seatbelt contacts,
rib injuries
= Test Configuration
≤ Test Extent
Rib Fractures
Assigned to Seatbelt Contact
All Frontal Cases
Count of Cases

29AP08UMPIRE 44
Frontal Impact Cases
Seat Belt Injury
Engineering Observations
Hybrid III ATDs
measure chest
acceleration and
chest compression
= Test Configuration
≤ Test Extent

29AP08UMPIRE 45
Frontal Impact Cases
Seat Belt Injury
Engineering Observations
• An ATD must be a repeatable and durable crash
test instrument, therefore, differences exist
between the dummy’s and a human’s rib cage
= Test Configuration
≤ Test Extent

29AP08UMPIRE 46
Injury Assessment Reference Value Discussion
Chest Deflection Tolerance
• FMVSS 208 limits
represent a 33% risk of
an AIS≥3 injury
– 50th Male = 63mm
– 5th Female = 52mm
• >3 rib fractures on one
side or 1 to 3 fractured
ribs and a hemo/pneumo
thorax is coded as an AIS
3 chest injury (AIS 2000)
= Test Configuration
≤ Test Extent
Reference: Development of Improved Injury Criteria for the Assessment
of Advanced Automotive Restraint Systems - II
Eppinger, et. al., 1999
Injury risk curve – 50th %ile Male

29AP08UMPIRE 47
Frontal Impact Cases
Seat Belt Injury
Engineering Observations
• Chest acceleration has been regulated in crash
tests since the 1970s
• Chest compression has more recently been
regulated in crash tests
– The mid-sized male Hybrid III has been required
since the 1998 model year but was previously allowed
– Recently, the small female was regulated and the
mid-sized male chest compression requirements were
made more stringent
= Test Configuration
≤ Test Extent

29AP08UMPIRE 48
Frontal Impact Cases
Summary• Femur, pelvic, and tibia injuries increased with BMI while
chest injuries decreased in cases with similar configurations and extents to industry crash tests
• Pelvic and femur injury patterns differed between men and women
• Rib injuries assigned to seatbelts appeared to occur more frequently to older and younger occupants
• Test dummies can not account for all of the variation seen in the human population because they must be repeatable and durable test devices
= Test Configuration
≤ Test Extent

29AP08UMPIRE 49
Key Questions
Frontal Crashes
• Why and how were people being seriously injured in U of M - CIREN frontal crashes with configurations and CDC extents similar to current industry tests?
• What was the nature of U of M - CIREN frontal crashes that were different than current industry crash tests in terms of:
– CDC Extent?
– Configuration?
= Test Configuration
> Test Extent

29AP08UMPIRE 50
CDC Position 7: Extent
= Test Configuration
> Test Extent
Reference: SAE Surface Vehicle Standard J224
Collision Deformation Classification, Rev. March, 1980

29AP08UMPIRE 51
Frontal Impact Cases with Configurations
Similar to Current Test Types
CDC Extent Comparison
= Test Configuration
> Test Extent
0
10
20
30
40
50
60
70
0 deg frontal left angle or offset right angle or offset frontal offset pole frontal center pole bumper underride
Frontal Impact Test Types
Co
un
t o
f U
MP
IRE
Cases
> Test Extent
≤ Test Extent
= Test Configuration
≤ Test Extent

29AP08UMPIRE 52
Frontal Impact Case Occupant Injuries
by Assigned Contact Location and Extent
0.00 0.20 0.40 0.60 0.80 1.00 1.20
Seat
Roof/Roofrail
Unknown
Side structure
Toe pan/pedals
Door
Airbag
Steering wheel
Seatbelt
Instrument panel
Co
nta
ct
Lo
ca
tio
n
Number of Injuries/Number of Cases
> Test Extent ≤Test Extent
• Data above and below current test CDC extents were normalized by dividing the number of injuries by the number of cases
• Injuries assigned to instrument panel and steering wheel contact increased with higher extents, however those assigned to seatbelt and airbag contact did not increase
= Test Configuration
> Test Extent
= Test Configuration
≤ Test Extent

29AP08UMPIRE 53
0 5 10 15 20 25 30
tibia
pelvis
femur
Instr
um
ent
panel
Co
nta
ct
Lo
cati
on
Number of Injuries
Frontal Impact Test Types - AIS 3+ - Unbelted
Frontal Impact Test Types - AIS 3+ - 3-Point Belt
0 5 10 15 20 25
tibia
pelvis
femur
Instr
um
ent
panel
Co
nta
ct
Lo
cati
on
Number of Injuries
Frontal Impact Test Types - AIS 3+ - Unbelted
Frontal Impact Test Types - AIS 3+ - 3-Point Belt
Frontal Impact Case Occupant Injuries
Instrument Panel Injuries
by Body Region, Belt Use, and Extent
• Belts appeared to be more effective in reducing femur, pelvic and tibia injuries in crashes with lower CDC extents
Femur, Pelvic and Tibia injuries only
= Test Configuration
> Test Extent
= Test Configuration
≤ Test Extent
= Test Configuration, ≤ Test Extent = Test Configuration, > Test Extent
3-pt belt Unbelted 3-pt belt Unbelted
Femur, Pelvic and Tibia injuries only
29AP08UMPIRE 54
Frontal Impact Cases
CDC Extent
Engineering Observations
• Injuries assigned to instrument panel and
steering wheel contact increased with higher
extents however those assigned to seatbelt and
airbag contact did not increase, possibly due to
– Load limiting seat belts
– Load sharing between the seatbelt and the airbag
– Loading other components, once the restraint
capacity of the seatbelt and the airbag was exceeded
= Test Configuration
> Test Extent
= Test Configuration
≤ Test Extent

29AP08UMPIRE 55
Frontal Impact Cases
CDC Extent
Engineering Observations
• There are many possible measures of crash severity (Delta V, Equivalent Barrier Speed, Extent of Crush, etc.)
• This analysis is based only on CDC extent
• Increasing crash test severities requires consideration of possible consequences that may increase injuries to people not currently being injured in more frequent / lower severity crashes
= Test Configuration
> Test Extent
= Test Configuration
≤ Test Extent

29AP08UMPIRE 56
Crash Severity Distribution1997-2006 NASS CDS
Distribution of Occupants in Frontal Towaway Crashes by Longitudinal -V
18.5%
43.8%
21.6%
10.6%
3.1%1.3% 0.6% 0.5%
62.3%
83.9%
94.5%97.6% 98.9% 99.5% 100.0%
0%
10%
20%
30%
40%
50%
60%
70%
80%
90%
100%
1 to 7 mph 8 to 12 mph 13 to 17 mph 18 to 22 mph 23 to 27 mph 28 to 32 mph 33 to 37 mph 38 mph and
above
Longitudinal -V, mph
Oc
cu
pa
nt
Fra
cti
on
Driver, All
= Test Configuration
> Test Extent

29AP08UMPIRE 57
High Severity
Crash Test
Requirements
Stiffer Vehicle
Crush Zones
•Aggressive
airbags
•Stiffer
restraint
systems
These changes may benefit some
occupants in infrequent high severity
crashes…
…but increase risk to occupants in more
frequent moderate severity crashes by
increasing the loads on the occupants.
drives
= Test Configuration
> Test Extent

29AP08UMPIRE 58
Key Questions
Frontal Crashes• Why and how were people being seriously
injured in U of M – CIREN frontal crashes with configurations and CDC extents similar to current industry tests?
• What was the nature of U of M - CIREN frontal crashes that were different than current industry crash tests in terms of:
– CDC Extent?
– Configuration?
≠ Test Configuration

29AP08UMPIRE 59
Cases with Frontal Crash Configurations
Different from Current Test Types
• Small overlap crashes comprised the majority of frontal crashes with configurations different than current test types
• Small overlap crashes comprised 10.7% of frontal cases in the U-M CIREN database
0
5
10
15
20
25
30
left s
mall
overlap
right sm
all
overlap
underr
ide
hig
h
underc
arr
iage
corn
er
underr
ide
offset underr
ide
sid
esw
ipe
Add'l Frontal Crash Types
Co
un
t o
f U
MP
IRE
Ca
se
s
≠ Test Configuration

29AP08UMPIRE 60
Small Overlap Examples
≠ Test Configuration

29AP08UMPIRE 61
0
10
20
30
40
50
60
70
80
90
100
1 2 3 4 5 6 7 8 9
Extent
Co
un
t o
f U
-M C
IRE
N C
as
es
≤ Test Extent
> Test Extent
1 2 3 4 5 6 7 8 9
Cases with Frontal Crash Configurations Different
from Current Test Types - Extent Discussion
≠ Test Configuration
0
1
2
3
4
5
6
7
8
1 2 3 4 5 6 7 8 9
Add'l Frontal Crash Types
Extent
Co
un
t o
f U
MP
IRE
Cas
es
≠ Test Configuration
1 2 3 4 5 6 7 8 9
= Test Configuration, ≤ Test Extent
= Test Configuration, > Test Extent
• Frontal crash configurations different from current test types tended to involve localized vehicle deformation that produced higher CDC extents
• Other measures of crash severity are less likely to show the same level of increase

29AP08UMPIRE 62
Cases with Frontal Crash Configurations Different
from Current Test Types
Top 10 Contact Locations
Add'l Frontal Crash Types - AIS 3+
0 5 10 15 20 25 30
Crash forces
Roof/Roofrail
Unknown
Windshield
Steering wheel
Seat
Seatbelt
Toe pan/pedals
Airbag
Door
Side structure
Instrument panel
Co
nta
ct
Lo
cati
on
Number of Injuries
Add'l Frontal Crash Types - AIS 3+
• Injuries assigned to instrument panel contact were still the most frequent
• Injuries assigned to side structure and door contact were more frequent than in cases with existing test configurations– Small overlap crashes
involve lateral occupant motion as well as lateral intrusion
≠ Test Configuration

29AP08UMPIRE 63
Frontal Impact Case Occupant Injuries
Side Structure Injuries
• Injuries assigned to
side structure contact
in this category were
all attributed to head
contact with the A-
pillar in 5 small
overlap crashes
Add'l Frontal Crash Types - AIS 3+
0 2 4 6 8 10 12
basilar skull fx
facial fx
head vessels
cerebrum
Sid
e s
tructu
re
Co
nta
ct
Lo
ca
tio
n
Number of Injuries
Body regions with ≤ 1 injury/region not shown
≠ Test Configuration

29AP08UMPIRE 64
Hybrid III Crash Dummy Head
Measurement
• Longitudinal, Lateral, and Vertical head acceleration is measured at the head center of gravity.
• These three measurements are combined to calculate a resultant head acceleration (a) which is used to calculate the Head Injury Criteria:
12
5.2
12
ttadttt
1HIC
2
1
t
t
≠ Test Configuration

29AP08UMPIRE 65
Injury Assessment Reference Value Discussion
15 ms Head Injury Criteria (HIC) Tolerance
• FMVSS 208 limit of
700 HIC represents a
5% risk of an AIS≥4
brain injury
• Brainstem and
diffuse axonal injuries
are examples of AIS 4
head injuries
Reference: Biomechanical Scaling Bases for Frontal and Side Impact
Injury Assessment Reference Values
Mertz, et. al., 2003
Brain Injury Risk Curve - Adults
≠ Test Configuration

29AP08UMPIRE 66
Frontal Impact Cases
≠ Test Configuration
Engineering Observations
• Small overlap crashes were the most frequent
crash type in the ≠ Test Configuration:
– Head injuries assigned to A-pillar contact
were attributed to lateral occupant motion and
A-pillar displacement rearward in the vehicle
≠ Test Configuration

29AP08UMPIRE 67
Summary
• Every field crash is unique and crash tests
represent general categories, therefore
judgment was used to group cases and
match with crash tests
• About 53% of U-M CIREN frontal cases
had crash configurations and CDC extents
similar to industry crash tests

29AP08UMPIRE 68
32.1% of frontal cases had similar configurations but greater CDC extents than current crash tests
14.1% of frontal cases had configurations that differed from current crash tests
= Test Configuration
≤ Test Extent
= Test Configuration
> Test Extent
≠ Test Configuration
53.8% of frontal cases had configurations and CDC extents similar to current crash tests
U-M CIREN
Frontal Cases

29AP08UMPIRE 69
Trends in injuries between greater and lesser CDC extents were observed
Any changes to further improve higher extent crash performance need to be balanced with performance in more frequent lower CDC extent crashes
Small overlap crashes were the most common crash type in this category
= Test Configuration
≤ Test Extent
= Test Configuration
> Test Extent
≠ Test Configuration
Injuries occur in cases that are similar to existing crash tests
Injury trends were identified that may help in improving data measurement and data interpretation from existing tests
U-M CIREN
Frontal Cases

29AP08UMPIRE 70
Conclusions
• The majority of injuries in this study occurred in crash configurations similar to existing crash tests, therefore, improvements in crash test data measurement and data interpretation may be beneficial in reducing injuries
• Small overlap frontal crashes were the most common configuration not represented by current crash tests, however, they represented only 10.7% of all frontal crashes in the U-M CIREN database
• Any consideration of increasing test severity must be addressed in a way that does not increase the risk to the current uninjured population
Recommended