Back-up
Investor PresentationMarch 2018

Strategy and Growth
Financial Performance
Investment Plan & Outlook
Company Overview

PTTEP: the E&P Flagship of PTT GroupPlays a pivotal role in Thailand’s oil and gas production
Notes:1. 51.1% is directly held by the Government of Thailand (Ministry of Finance), with the remaining 13.1% held by the state-controlled Vayupak Fund I as of 5 September 20172. Ownership as of 7 February 2018
Government of Thailand
Thailand’s national energy company
64.2%1
65.3%2
Credit ratings equivalent to parent and countryS&P Moody’s TRIS
BBB+ Baa1 AAA
As PTT’s Upstream Flagship Largest oil and gas producers in Thailand and Myanmar
Synergy with PTT’s gas value chain through its dominant position in the regional gas market
Opportunities to expand into regional investments
96% +99%
83% 13 USD/ BOE
of PTTEP’s total sales volume
Reliability of plants and field facilities*
of PTTEP’s sales volume sold to PTT
Average regional cash cost
* of PTTEP-operated projects in Gulf of Thailand, excl. planned shutdownAll figures are as of YE 2017
Approx. 20 KBOEDof net sales volume
Gas-weighted
Oil-weighted
PTTEP’s operations in SEA
3

A Firm Core for Accretive GrowthReflected in 2017’s performance
4
Operation Financials299 KBOED Sales volume as target29 $/BOECompetitive unit cost Diversified into MLNG Train 90.1 LTIF Safety record in top quartile
Healthy margin and liquidity70% EBITDA Margin
$4.5Bn Cash on hand
0.25x Gearing ratioDividend commitment
4.25 THB/Share (90% Payout)
Unlocking value through concrete growth platforms
Acquired 22.2222% stake from Shell
Expanded to new prolific areas with experienced partners
Bongkot
2 Deepwater blocks in Mexico

Strategy and Growth
Financial Performance
Investment Plan & Outlook
Company Overview

Sales Volume & Unit CostAchieved target sales volume with competitive cost
239,793 240,872 230,504
60,672 58,815 55,37121,702 19,834 13,331
0
100,000
200,000
300,000
400,000
Rest of World
Other SEA
Thailand
BOED 322,167 319,521
15.7512.67 13.94
0
10
20
30
40
DD&A 23.13 17.79 15.11Finance Cost 2.14 2.01 2.07Royalties 3.62 3.02 3.37G&A 2.39 1.93 2.30Exploration Expenses 1.56 0.63 0.48Operating Expenses 6.04 5.08 5.72
Lifting Cost 4.62 4.18 4.19
Sales Volume and Price
30.46$/BOE
29.05
38.88Unit Cost
FY 2015 FY 2016*
Gas ($/MMBTU) 7.20 5.60 5.59Liquid ($/BBL) 50.05 41.17 52.26Weighted Avg. ($/BOE) 45.29 35.91 39.20Avg. Dubai ($/BBL) 50.91 41.27 53.14Avg. HSFO ($/BBL) 44.89 35.48 49.64(High Sulphur Fuel Oil)
Volume Mix (Gas : Liquid) 70 : 30 69 : 31 70 : 30Revenue Mix (Gas : Liquid) 66 : 34 65 : 35 60 : 40
Cash Cost
Unit Cost
FY 2015 FY 2016* FY 2017
Note: * Represented and includes discontinued operations until end of August 2016The formulas for calculating ratios are provided in the supplementary section for your reference
299,206
FY2017
6

Cash Flow PerformanceSolid cash flows and liquidity for future growth
-
400
800
1,200
1,600
2,000
2,400
2,800
Sources Uses
Dividend & Interest & Finance CostRelated investment to PTTGLCAPEX & Others
Source & Use of Funds in 2017
2,864
2,308
2,687
71 71 70
50
60
70
80
90
100
0
1,000
2,000
3,000
FY 2015 FY 2016 FY 2017
Operating Cash Flows* (LHS)
MMUSD %
Cash Flow Performance
EBITDA Margin (RHS)MMUSD
Remark: * Net of adjustment for the effect of exchange rate changes on cash and cash equivalents** Excludes cash flows for investing in short-term investments (Fixed deposit > 3 months) *** Excludes Gain/(Loss) on FX, Deferred tax from Functional currency, Current Tax from FX Revaluation, Gain/(Loss) from Financial Instruments,
Impairment Loss on Assets, and etc.
Net Income (854) 372 594
Recurring Net Income*** 718 466 836
2,241 **
2,687 *
Operating Cash Flow
7
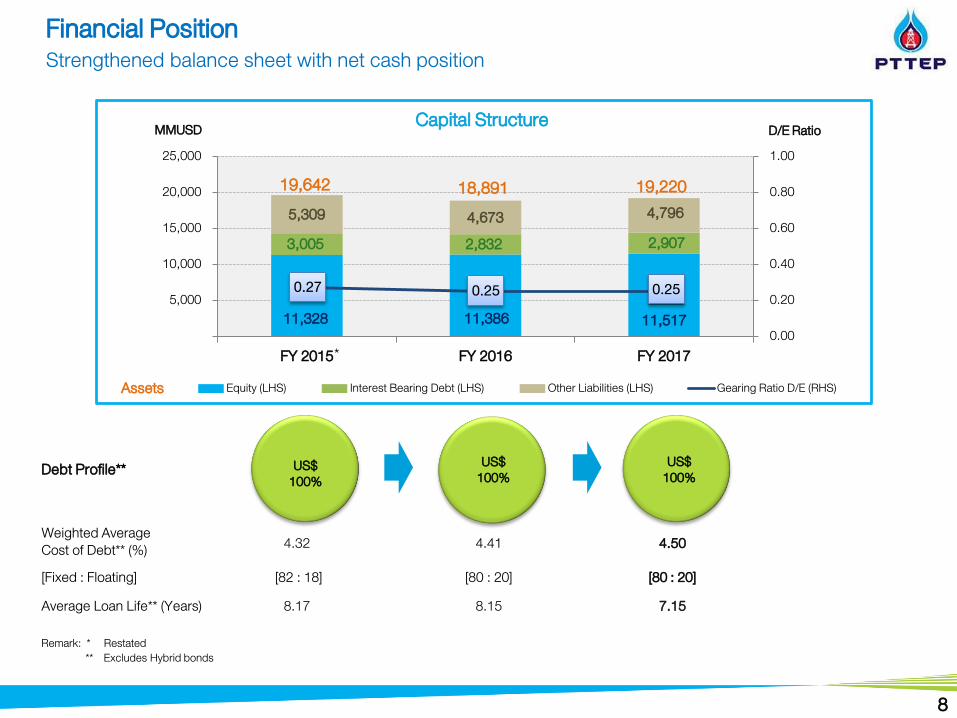
Financial PositionStrengthened balance sheet with net cash position
US$100%
US$100%
Weighted AverageCost of Debt** (%) 4.32 4.41 4.50
[Fixed : Floating] [82 : 18] [80 : 20] [80 : 20]Average Loan Life** (Years) 8.17 8.15 7.15
11,328 11,386 11,517
3,005 2,832 2,9075,309 4,673 4,796
0.27 0.25 0.25
0.00
0.20
0.40
0.60
0.80
1.00
0
5,000
10,000
15,000
20,000
25,000
FY 2015 FY 2016 FY 2017Equity (LHS) Interest Bearing Debt (LHS) Other Liabilities (LHS) Gearing Ratio D/E (RHS)
MMUSD D/E Ratio
Remark: * Restated ** Excludes Hybrid bonds
Capital Structure
Debt Profile**
Assets
18,891 19,22019,642
US$100%
*
8
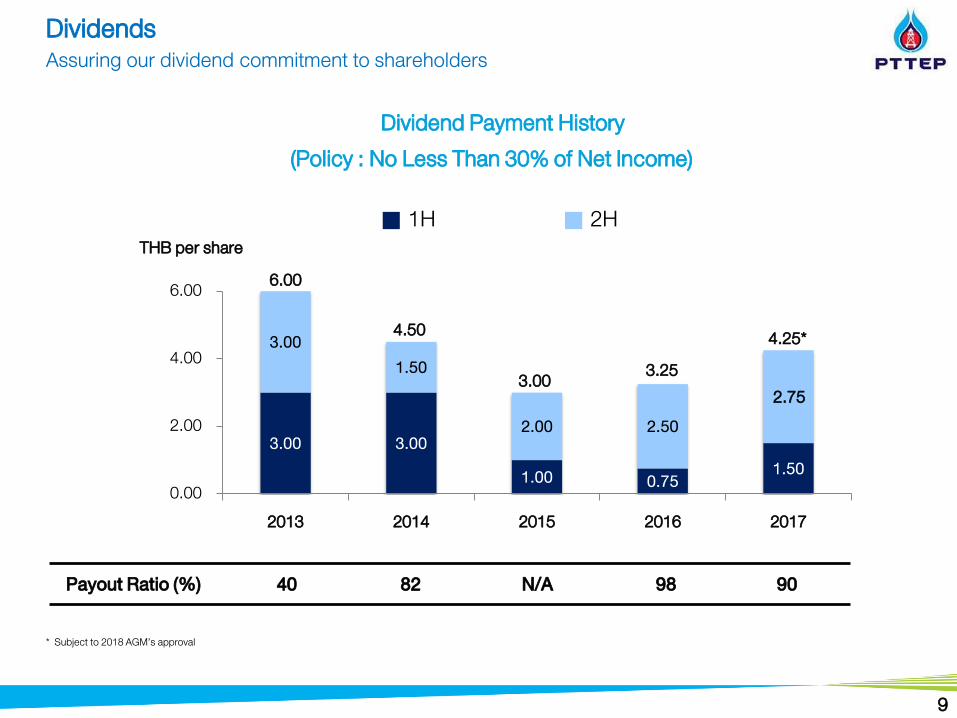
DividendsAssuring our dividend commitment to shareholders
3.00 3.001.00 0.75 1.50
3.001.50
2.00 2.50
0.00
2.00
4.00
6.00
2013 2014 2015 2016 2017
Dividend Payment History (Policy : No Less Than 30% of Net Income)
1H 2HTHB per share
6.00
4.50
Payout Ratio (%) 40 82 N/A 98 90
3.002.75
4.25*3.25
* Subject to 2018 AGM’s approval
9
Strategy and Growth
Financial Performance
Investment Plan & Outlook
Company Overview

Exploration Engineering & Construction Drilling & Well G & AProduction
OperationsMaintenance & Inspection Logistics Procurement Finance &
AccountingInitia
tives
11
A Firm Core Sustained by 3Rs StrategyRESET to optimize cost level and uphold competitiveness
Optimizing Producing Projects
Capital Management
Organizational Restructuringto cope with changing E&P landscape
Cost Management through SPEND SMART campaign
Unit: US$/BOE
2014 2015 2016 2017 2018E
Cash
38.8843.45
30.46 29.05
Cost reduction over 30%
Ways Results
Maintain competitive cost base in the top quartile among peers
2017 SPEND SMART results
$200MM Savings
$310MM equivalent in efficiency gain
500+ new ideas initiated
Non-cash

A Firm Core Sustained by 3Rs StrategyREFOCUS for sustainable future growth
12
Reinforce activities in prolific areas
Target producing assetsin focus areas; SEA and Middle East
Join-hand with PTT to capture LNG demand growth in Asia
Exploration
M&A
LNG Value Chain
New 2 Blocks in Gulf of Mexico
Materiality: Prolific area in major prospective resources
Optimize Value: Attractive fiscal terms and entry cost, Decreasing cost trend
Infrastructure: Well-established market and infrastructure
Consortium: Partnership with experienced operators
Drillingactivities
67%232MMUSD
Seismic study & others33%
2018 Budgets
Expanded to Mexico
ThailandAdditional 22.2222%
in Bongkot*
Daily Production
Add 35 KBOED
Cash FlowImmediate
cash-generation
1st step in Malaysia10% in MLNG Train 9 in Malaysia
Marked as first step into midstream LNG business and in vicinity of current
and future upstream opportunities
Note: * Subject to deal closing

A Firm Core Sustained by 3Rs StrategyREFOCUS for sustainable future growth
13
Strive to win Bongkot and Erawan biddingTentative Timeline* PTTEP is well-positioned to bid for
Bongkot and ErawanExperienced and reliableOperational efficiencySynergies in the Gulf of ThailandDeep subsurface understanding
Progressing toward FID of key pre-development projects
Preliminary Bidding Conditions*
• 2 PSCs: Bongkot and Erawan• Key focus: continuity of operations with
minimum production volume of 1,500 MMSCFD (Bongkot+Erawan) for at least 10 years
Algeria HBR
Approval of key legal framework and development plan Commencement of the resettlement action plan Significant progress on SPA negotiation with the
execution of 1st SPA of 1.2MTPA Project finance is ongoing as planned
Signed letter of agreement on wellhead gas prices and pipeline tariff in Q3 2017
Finalizing commercial agreements and FID once government approval on FDP is received
In process of FEEDDuring development preparation with current partners
Submitted development plan in Q4 2017 FID once government approval is receivedNote: First phase production of 10-13 KBPD, expected in 2019
Production Expected Start-up
Mozambique Rovuma Offshore Area 1
Ubon (Contract 4)
12MMTPA 2023
50KBPD 2023 25-30KBPD 2021
2021490MMSCFD
Southwest Vietnam
8.5% (operated by
Anadarko)
Production Expected Start-up
Production Expected Start-up Production Expected Start-up
(operated by PetroVietnam)
BlockB&48/95
8.5%Block 52/977.0%
24.5% (operator) 60%
(operated by Chevron)
* Based on MoE’s interview

14
A Firm Core Sustained by 3Rs StrategyRENEW to adapt in response to changing industry landscape
Enhancing Core Capability in Exploration & Production
Value through Business Diversification
ORGANIZATIONAL TRANSFORMATION
RENEWABLE ENERGY
GAS VALUE CHAIN
Innovative, agile and result-driven
DIGITAL TRANSFORMATION
Embrace digital technologies to drive efficiency
E&P TECHNOLOGYDrive exploration success, production
enhancement and green practices
Evaluate strategic and competency compatibility
Extend presence across the gas chain
Midstream LNG:
Invest to support E&P and develop diversified LNG supply and trading portfolio for Asian market
Gas Market:
Create market beyond Thailand; and capture value along the gas-to-power chain
E&P-RELATED BUSINESSExplore for value enhancement
e.g. decommissioning
Strategy and Growth
Financial Performance
Investment Plan & Outlook
Company Overview

16
Sales Volume (excluding additional stakes in Bongkot)M&As and concession bidding remain key upside
0
100
200
300
2017 2018 2019 2020 2021 2022
Thailand &MTJDA
Other SEARest of World
Unit : KBOED
283 276239
299 302 299
Note: Excludes the sales volume contribution from the acquisition of additional 22.2222% stakes in Bongkot from Shell * Subject to FID timing ** Expected project start-up in late 2021
Product Mix (%) Gas : Liquid 70 : 30 69 : 31 70 : 30 72 : 28 73 : 27 71 : 29
Key Project Start-up*
Algeria HBR(Full phase)
Capacity 50KBPD
Mozambique LNGCapacity 12 MMTPA
(~300KBOED)
Algeria HBR (phase l)Capacity 10-13KBPD
Contract 4 (Ubon)Capacity 25-30 KBPD
Southwest Vietnam***Capacity 490 MMSCFD
(~80KBOED)

17
Investment Plan (excluding additional stakes in Bongkot)Disciplined spending on core assets for future production growth
1,430 1,5651,051 1,165 1,048
684
22206
666906 887
802
1,162
1,332 1,2521,201 1,223
1,561
0
1,000
2,000
3,000
2017 2018 2019 2020 2021 2022
Unit : MMUSD
3,1032,969
3,272 3,158 3,047
5 Years (2018 – 2022)
2,592
OPEX
CAPEX(Producing projects****)
OPEX 6,569CAPEX 8,980TOTAL 15,549
CAPEX(Pre-sanction projects***)
Note: Excludes the related investment from the acquisition of additional 22.2222% stakes in Bongkot from Shell * Subject to FID timing *** Pre-sanction projects include Mozambique LNG, Contract 4 (Ubon), Algeria HBR and Southwest Vietnam** Expected project start-up in late 2021 **** Includes exploration and appraisal in all projects and head office CAPEX
Key Project Start-up*
Contract 4 (Ubon)Capacity 25-30 KBPD
Algeria HBR (Full phase)
Capacity 50KBPD
Mozambique LNGCapacity 12 MMTPA
(~300KBOED)
Algeria HBR (phase l)Capacity 10-13KBPD
Southwest Vietnam**Capacity 490 MMSCFD
(~80KBOED)

Financial Outlook Expect revenue growth and robust financial performance
18
Q1 2018 FY 2018
Note: * Excludes sales volume from the acquisition of additional stakes in Bongkot** Based on FY2018 Dubai oil price at 60 $/BBL
~6.2302
KBOED
~7030-31
AverageSales Volume* ~300
~6.0~30
USD/MMBTU
AverageGas Price**
USD/BOEUnit Cost
% of sales volumeEBITDA Margin

19
Key TakeawaysMaximizing value through solid growth platforms
Concrete plans for reserve accretion• Strive to win Bongkot and Erawan bidding• Series of M&A deals execution• Accelerate FID of key pre-development projects • Exploration expansion to prolific areas
Competitive cost base and strong margin• Competitive cost base in top quartile• Sustain ~70% EBITDA margin amid oil price volatility• $4.5 Bn cash on hand and solid capital structure with low gearing
Commitment to shareholders’ value creation• A consistent dividend-paying company with a track record of over 15 years
Well prepared for future challenges• Organizational transformation to cope with changing industry
landscape as well as to enhance operational efficiency• Gas-weighted portfolio in line with global energy trend• Diversification to LNG value chain with PTT• Explore new business opportunities

You can reach the Investor Relations team for more information and inquiry through the following channels:
http://www.pttep.com [email protected] +66 2 537 4000
Passion to ExploreFor a Sustainable Future
Thank you and Q&A

YE 2017 Financial Results
Safety and Sustainability
Thailand and Industry Updates
Key Project Highlights by Region
Project Details
Organization Structure
28-29
30-33
34
35-42
43-45
46
22-27
21
Supplementary information
Ratio and Formula 47
Reserves and Resources

Statement of Income 2017 2016 % YTD Q3 17 Q4 17 % QoQ Q4 16 % YoYTotal Revenues 4,523 4,339 4% 1,134 1,271 12% 1,089 17%Sales 4,281 4,190 2% 1,064 1,202 13% 1,038 16%Others 242 149 62% 70 69 (1%) 51 35%Sales Volume (BOED) 299,206 319,521* (6%) 298,139 313,054 5% 316,307 (1%)Sales Price (USD/BOE) 39.20 35.91 9% 38.78 41.74 8% 35.65 17%Total Expenses 3,929 3,987 (1%) 1,398 982 (30%) 1,122 (12%)Major Expenses:
Operating Expenses 625 582 7% 162 168 4% 167 1%Exploration Expenses 52 73 (29%) 9 23 >100% 12 92%DD&A 1,650 2,079 (21%) 413 436 6% 509 (14%)Impairment Loss on Assets 558 47 >100% 558 - (100%) 47 (100%)Income Tax Expense 180 285 (37%) 57 64 12% 133 (52%)(Gain)/Loss on FX (51) (12) (>100%) (23) (14) 39% 16 (>100%)
Net Income from Continuing Operations 594 352 69% (264) 289 >100% (33) >100%Profit (Loss) from Discontinued Operations - 20 (100%) - - - 17 (100%)Net Income 594 372 60% (264) 289 >100% (16) >100%Recurring Net Income 836 466 79% 218 240 10% 123 95%Non-Recurring** (242) (94) (>100% ) (482) 49 >100% (139) >100%
Unit : MMUSD
Note: * Sales volume includes discontinued operations** Includes Gain/(Loss) on FX, Deferred tax from Functional currency, Current Tax from FX Revaluation, Gain/(Loss) from Financial Instruments, Impairment loss on assets and etc.
Summary of 2017 Financial ResultsStrong core profits led by improved average selling price
22

Revenue Mix
Achieved target sales volume by successful production uplift plan PTTEP Sales Volume & Average Selling Price
0
100,000
200,000
300,000
Volume Mix
Sales Volume
2017Sales Volume &
Revenue By Product
Thailand & MTJDA
Other SEA
Rest of World
Liquid40%
Gas60%
Sales Price 2017 2016* Q3 17 Q4 17 Q4 16Gas ($/MMBTU) 5.59 5.60 5.72 5.75 5.15Liquid ($/BBL) 52.26 41.17 48.46 59.20 46.80Weighted Avg. ($/BOE) 39.20 35.91 38.78 41.74 35.65Avg. Dubai ($/BBL) 53.14 41.27 50.43 59.31 48.32Avg. HSFO ($/BBL)(High Sulphur Fuel Oil)
49.64 35.48 47.95 54.98 45.59
Note: * Includes discontinued operations until end of August 2016
BOED
230,504 240,872 227,244 245,741 238,842
55,371 58,815 55,823
52,568 62,499 13,331
19,834 15,072
14,745 14,966 299,206 319,521298,139 313,054 316,307
Gas70%
Liquid30%
23

-
10
20
30
40
13.94 12.67 13.4215.86 14.39
Upheld cost competitiveness and continual efficiency improvementOperating Performance
Unit Cost$/BOE
Cash CostUnit Cost
2017 2016* Q3 17 Q4 17 Q4 16DD&A 15.11 17.79 15.08 15.13 17.50Finance Cost 2.07 2.01 2.06 1.99 1.99Royalties 3.37 3.02 3.27 3.55 3.02G&A 2.30 1.93 1.87 3.68 3.22Exploration Expenses 0.48 0.63 0.31 0.80 0.41Operating Expenses 5.72 5.08 5.91 5.84 5.75Lifting Cost 4.19 4.18 4.19 4.39 4.63
Note: * Includes discontinued operations until end of August 2016The formulas for calculating ratios are provided in the supplementary section for your reference
29.05 30.46 28.5030.99 31.89
24

Delivered healthy EBITDA margin and core profitsFinancial Performance : Income Statement
Note: * Includes discontinued operations until end of August 2016The formulas for calculating ratios are provided in the supplementary section for your reference
2017 2016* Q3 17 Q4 17 Q4 16Sales and Revenue from pipeline transportation (MMUSD) 4,359 4,274 1,089 1,224 1,054EBITDA (MMUSD) 3,063 3,027 777 825 690Net Income (MMUSD) 594 372 (264) 289 (16)Recurring Net Income (MMUSD) 836 466 218 240 123Earning Per Share (USD) 0.13 0.08 (0.07) 0.07 (0.01)Key Financial Ratios
EBITDA Margin (%) 70 71 71 67 65Return on Equity (%) (LTM) 5 3 3 5 3Return on Capital Employed (%) (LTM) 5 3 3 5 3Return on Equity (%) (LTM, Recurring Net Income) 7 4 6 7 4Return on Capital Employed (%) (LTM, Recurring Net Income) 7 4 6 7 4
25

Strengthened balance sheet with net cash positionFinancial Performance : Balance Sheet
Note: * Cash & Cash Equivalents (Cash on hand) include Short-term Investments (Fixed deposit > 3 months)Net Debt = Total Debt less Cash & Cash Equivalents and Short-term Investments
** Includes discontinued operations until end of August 2016*** Excludes hybrid bonds
The formulas for calculating ratios are provided in the supplementary section for your reference
Credit Ratings : BBB+ (S&P), Baa1 (Moody’s), AAA (TRIS)Weighted Average Cost of Debt*** : 4.50%Average Loan Life*** : 7.15 years
2017 2016Total Assets (MMUSD) 19,220 18,891
- Cash & cash equivalents* (MMUSD) 4,468 4,022Total Liabilities (MMUSD) 7,703 7,505
- Interest bearing debt (MMUSD) 2,907 2,832Equity (MMUSD) 11,517 11,386Key Financial Ratios**
Total Debt to Equity (X) 0.25 0.25Net Debt* to Equity (X) (0.14) (0.10)Total Debt to Capital (X) 0.20 0.20Total Debt to EBITDA (X) 0.95 0.94EBITDA Interest Coverage (X) 23 22
26

Debt Maturity Profile
406 413
1,275
349
490
-
200
400
600
800
1,000
1,200
1,400
2018 2019 2020 2021 2022-2028 2029 2030-2041 2042
USD
Millio
ns
Note: Excludes Hybrid bondsUnit: USD Millions or equivalent after cross currency swap
27

0.10
0.0
0.5
1.0
2009 2010 2011 2012 2013 2014 2015 2016 2017
Industry Benchmark PTTEP
# of incidents per million man hours (Lost time injury incident frequency, LTIF)
Maintain high safety standard
Safety of PTTEP employees and contractors in every aspect of our operations is key to achieve the goal of
“Target Zero”
Safety SustainabilityAffirm our path to sustainable development
Member of the 2017 Dow Jones Sustainability Indices (DJSI) in the DJSI World Oil and Gas Upstream & Integrated Industry for its fourth consecutive year
Constituent of the FTSE4Good Emerging Index 2017 for a second consecutive year
“Excellence” level of recognition from the 2017 Corporate Governance Report of Thai Listed Companies, conducted by the Thai Institute of Directors (IOD) since 2001
Priority on Safety and SustainabilityTop quartile safety performance; Fourth consecutive year as a DJSI listed company
28

Sustainable developmentPursue long-term growth with social and environmental wellness
Exemplary social contributor Green driver to environment
Outstanding Sustainability Report Award 2016Thai Listed Companies Association
Certified Member Thailand’s Private Sector Collective Action Coalition Against
Corruption (CAC)
CG Asia Recognition AwardsCorporate Governance Asia Magazine
Platinum Award for SIOLA Project: Best Community Program
the 9th Annual Global CSR Summit 2017
Bronze Stevie Award for SIOLA and Crab Hatchery Learning Center Project:
The Asia-Pacific Stevie Awards Program
Water A List Award Carbon Disclosure Project (CDP)
2017 LESS Award Letter of RecognitionThailand Greenhouse Gas Management Organization
Thailand Occupational Safety and Health Awardsthe Ministry of Labour
2017 DJSI Listed CompanyPTTEP has been selected as a member of the 2017 Dow Jones Sustainability Indices (DJSI) in the DJSI
World Oil and Gas Upstream & Integrated Industry for its fourth consecutive year.
PTTEP becomes a constituent of the FTSE4Good Emerging Index 2017 for a second consecutive year
FTSE4Good Emerging Index 2017
Proven business integrity
29

30
Thailand UpdatesDomestic gas volume suppressed by LNG import; Uncertainty on Thai Baht remains
27
29
31
33
35
37
32.68
Consensus on the exchange rate mostly depends on o Potential for inflation in the U.S.o Continued uncertainty on the
implementation of the U.S. Tax Reform, monetary policies of major global economies such as Europe
o Increasing geopolitical risks
Domestic
Domestic
Domestic
Myanmar
Myanmar
Myanmar
LNG
LNG
LNG
0 1,000 2,000 3,000 4,000 5,000
FY 20
15FY
2016
FY 20
17
Source: Bank of Thailand, Bloomberg
MMSCFD
Thailand Energy Overview
Electricity
Electricity
Electricity
Industry
Industry
Industry
GSP
GSP
GSP
NGV
NGV
NGV
0 1,000 2,000 3,000 4,000 5,000
FY 20
15FY
2016
FY 20
17
MMSCFDNatural Gas Consumption
GWH
Natural Gas Supply
Electricity Generation
o Slight decline in domestic production and Myanmar piped gas imports while domestic demand remained flat
o Domestic volumes were pressured by low nomination due to growth in LNG import
Exchange Rate Movement (THB/USD)
Q1 Q2 Q3 Q42018
Q1 Q2 Q3 Q42017
33.8(Highest)
(Lowest)29.7
(Average)31.7
35.83
34.45
33.98
33.37
Source: EPPO
67%
63%
60%
2%
2%
2%
18%
19%
18%
8%
10%
12%
5%
6%
7%
0% 50% 100%
FY20
15FY
2016
FY20
17
Natural Gas Hydro Electricity Coal & LigniteImported Renewable Energy
Forecast based on Bloomberg Consensus as of 15 February 2018

Thailand’s Energy Value ChainPTTEP contributes almost 1/3 of Thailand’s petroleum production
Source: Energy Policy and Planning Office (EPPO) and Department of Mineral Fuels (DMF)
Thailand’s Oil and Gas Demand MidstreamThailand Petroleum Production 2017
8%
PTTEP29%
Others71%
% by Petroleum Type and Area
% Production by Company
Transmission PipelinesGas Separation Plants
Gas: operated by PTT
Refineries
Oil: PTT participates through subsidiaries
Petrochemicals Oil and gas marketing
by Type by Area
Liquid 30%
Gas 70% Offshore
93%
Onshore 7%Crude Oil & Condensate
Natural Gas
Imports~ 79%
Domestic~ 21%
Imports ~ 28%
Domestic~ 72%
~ 1.1m BOE/D
~ 0.9m BOE/D
Downstream
31

Thailand’s Oil and Gas BalanceJanuary – December 2017
SUPP
LYPR
ODUC
TION
SALE
S
Oil Balance Natural Gas Balance
Import (81%)973 KBD
Indigenous (19%)229 KBD
PTT’s Associated Refineries 770 KBD (TOP, PTTGC, IRPC)
Other Refineries 462 KBD (SPRC, ESSO, BCP)
Crude/Condensate
907 KBDCrude/Condensate195 KBD
ImportedRefined
PetroleumProducts
66 KBD
CrudeExport34 KBD
Export238 KBD
Domestic934 KBD **
RefinedProducts
1,113 KBD *RefinedProducts204 KBD
Source: PTITRemark: * Refined product from refineries = 1,004 KBD, including domestic supply of LPG from GSPs and Petrochemical Plants = 109 KBD
** Not included InventoryMMSCFD @ Heating Value 1,000 Btu/ft3
PTTEP29%
Others71%
Gulf of Thailand (69%) Onshore (2%) Import (29%)Onshore (2%)
Myanmar62%
LNG38%
3,244MMSCFD
Bypass Gas 575 MMSCFD
98MMSCFD
Power (58%)
Industry (15%)
NGV (6%)
PetrochemicalFeedstock
(14%)
Industry Household
Transportation(7%)
EthanePropaneLPGNGL
LPGNGL
996 MMSCFD(21%)
1,378MMSCFD
Methane1,673 MMSCFD
Maintains stability supply through adequate refining capacity Main driver of the Thailand economy
Total Refining Capacity in Thailand1,097 KBD 6 Gas Separation Plants
Total Capacity 2,860 MMSCFD@ Actual Heat
32

LNG UpdatesAbundant supply with an expectation to rebalance by 2023
Supply
-20
0
20
40
60
2017 2018 2019 2020 2021 2022 2023 2024 2025
China India Taiwan South Korea Japan
0100200300400500600700
2000 2005 2010 2015 2020 2025 2030 2035
mmtpa
Global LNG SituationGlobal LNG demand VS supply (2000-2035)
• The Asian Markets forecasts to be a key driver for future LNG demand• While LNG demand from Japan will decline due to renewable growth, China,
Taiwan and South Korea accounts for the bulk of incremental demand, mainly driven by the Government policy to switch from coal and nuclear power
• Market expects supply grow rapidly by over 40% from 2016 base to 2020 mainly from start-up of under construction projects in US, Russia and Australia
• Oversupply condition should pressure LNG spot price until early 2020s and cause the delay of new project sanction
New supply required by post-2023
Source: Woodmac (September 2017) and LNG demand growth from FGE (August 2017)
Key Determinants for Proposed LNG Projects to Reach FID Proximity to Asian
marketsCompetitive Facility Development Costs Feed Gas Sourcing Secure Markets with
termed contracts• Competitive shipping cost and
duration• Priority on expansion of brownfield
projects but opportunities are limited. • Advantaged greenfield needs
competitive cost and scalability
• Adequacy and low feed gas cost throughout the project life
• Quick to secure markets • Flexibility to cater for buyer’s need in
price and non-price factors
Operational
Under Construction
Probable Development
Global Demand
Demand
Established Asian Markets New Asian Marketsmmtmmt
LNG demand growth (base year 2016)
-20
0
20
40
60
2017 2018 2019 2020 2021 2022 2023 2024 2025
Thailand Malaysia Indonesia Singapore PakistanBangladesh Vietnam Australia Hongkong Philipines
33

Reserves and ResourcesMaintained reserve life with majority of reserves base in SEA
* Based on total production of natural gas, condensate, and crude oil (including LPG) of 347 KBOED for the year ended December 31, 2017
738 695 631457 404 400
3,844 3,901 3,824
0
1,000
2,000
3,000
4,000
5,000
6,000
2015 2016 2017
MMBOE
5,0005,093
Reserves / Resource Life*
Proved (P1) Probable (P2) Contingent (2C)
5 Years8 Years
38 Years
2017 by Geography
Reserves(P1 + P2 + 2C)P1 P1 + P2
2017 by Product Type
Domestic International
Gas Liquid
Resources Base
37%63% 67%
50%25%
50%
6311,031
75%
33%26%
74%
25%75%
4,855
Reserves(P1 + P2 + 2C)P1 P1 + P2
Resources Base
5-Year Average Proved Reserves Replacement Ratio (RRR)2015 2016 20170.50x 0.57x 0.58x
4,855
6311,031
4,855
34

Diversified international portfolioWorldwide operations: 36 projects* in 10 countries
Piped Gas
Deepwater Gas(LNG)
Opportunities in an early phase:• Oil Sand project in Alberta • Deepwater exploration in Brazil
with prominent partners
North & South America
An area for growth, key projects include:• Producing: Algeria’s Bir Seba oil field has
started up with current flow rate of approximately 17 KBPD• Pre-development and Appraisal: Mozambique
LNG and Algeria’s Hassi Bir Rakaiz
Africa
Oil producing project • 11 KBPD of oil sales from
wholly-owned Montaraproject • Sizable undeveloped gas
resource in Timor Sea
Australasia
Thailand
Second heartland to PTTEP• 19% of total sales volume• Myanmar being most important with gas
production mostly supplied into Thailand• Other producing assets in Vietnam (oil)
and Indonesia (gas)
Southeast Asia
LNGOil
Notes: * Excludes 2 projects that are pending official withdrawal approval ** Information dated as of 31 December 2017
Oil sands PTTEP’s core production base• 77% of total sales volume • Key producing assets include
Bongkot, Arthit, Contract 4 and S1
Thailand62.1%
Australasia4.3%
America1.6%
Africa 14.7% SE Asia
17.3%
Total Assets USD 19.2 billion
Book Value of Assets** (by region)
Deepwater
35

ThailandStrong home base with legacy assets maintaining production plateau
Production / Ramp-up Projects
Arthit
Bongkot South S1
Vietnam 16-1
Bongkot (44.4445% interest)• Bongkot’s natural gas sales volume of 856 MMSCFD in 2017
• Average condensate sales volume was 26 KBPD in 2017
S1 (100% interest)• S1 is the largest onshore crude oil production field in Thailand
• Average crude oil sales volume was 26 KBPD in 2017
Arthit (80% interest)• Average sales volume in 2017 was 218 MMSCFD of natural gas and 9.8 KBPD of
condensates
Contract 4 (60% interest) • Acquired from Hess Corporation in 2014.
• The Contract 4 project had an average sales rate of 347 MMSCFD for natural gas and 16 KBPD for condensate in 2017
S1
Bongkot Arthit
Contract 4
Contract 4
36

Southeast Asia: MyanmarSignificant contribution to growth
• Participating in three producing gas fields which supply gas to both Thailand and Myanmar: Yadana, Yetagun, Zawtika
• Operate Zawtika project, brought online in March 2014 with current gas supply of 301 MMSCFD in 2017.
• Significant exploration acreage both onshore and offshore in the Moattama Basin
Myanmar
Yetagun
Yadana
Zawtika
MOGE 3
M3
M11
MD-7
Thailand
Note: WI – working interest
Producing Appraisal Exploration• Yadana
(25.5% WI) • Yetagun
(19.3% WI) • Zawtika
(80% WI)
•M3 (80% WI)
•MOGE 3 (75% WI) •M11
(100% WI)•MD-7
(50% WI)
Project Status
37

Southeast Asia: Vietnam and Indonesia Reinforcing regional exposure through strategic partnerships
Vietnam 16-1 (28.5% interest)• Average crude oil sales volume of 21 KBPD in 2017• Commissioned production platform in the H5 area to support
current production level
Production / Ramp-up Projects
Vietnam 16-1Natuna Sea A
Source : Premier Oil
Natuna Sea A (11.5% interest)• Average sales volume of natural gas was 221 MMSCFD in 2017
38

Source: Anadarko
Key Milestones to Final Investment Decision
Technical
Commercial
Regulatory
Financing
Progressing on HOA-SPA conversion; 1st SPA signing with EDF of 1.2 MMTPA
Certified reserves to support initial trainsAnnounced selection of contractor for
onshore LNG facilities construction
Received approval on marine concession Commenced the resettlement plan in Q4
2017
On-going negotiation for project financing
Onwards to initial phase of 12 MMTPA
Location and Cost Advantage Close proximity to shore High quality reservoirs Access to Asian markets
Substantial recoverable resources of 70+ tcf with scalable offshore development of more than 6 LNG trains
39
East Africa: MozambiquePotential to become one of the world’s largest emerging LNG supply hubs

Project Overview• Operates 100% interest of the Thornbury, Hangingstone and
South Leismer (THSL) areas (exploration and appraisal phase)
• Potential large resource base with over a billion barrel
• In Q3 2017, the Company revised the project’s development plan which involves delaying the project’s Final Investment Decision, to reflect results from the assessment of the industry and commercial feasibility studies
Hangingstone
Thornbury
South Leismer
Mariana Oil Sands Project
Source: Company data, BP Statistical Review of World Energy 2014
Approximately 96% of the reserves in Canada, the world’s 3rd largest oil reserves, is oil sands
Canada
Other liquid hydrocarbonOil sands~174 bn
barrels
40
America: Canada Oil SandsFlexibility to pursue long-term investment from the oil sands project

Source : The National Agency of Petroleum, Natural Gas and Biofuels, Brazil (the ANP)
BRAZIL
• Farm-in 25% from BG Group in 2014• Operated by Shell Brasil (65% interest)• Four offshore exploration blocks: BAR-M-215,
BAR-M-217, BAR-M-252 and BAR-M-254• Completed 3D seismic activities and is in the
process of assessing the petroleum potential
BM-ES-23 • Acquired 20% interest from Shell in Q3 2014
• Partnered with Petrobras (65%, operator) and INPEX (15%)
Barreirinhas AP1
BarreirinhasBasin
Espirito
SantoBasin
41
America: Brazil Deepwater Entry into high potential petroleum province at exploration phase

MLNG Train 9 – OverviewLocation Bintulu, Sarawak, Malaysia
Asset Liquefaction Train 9 Tank 7
Phase Commercial: Jan 2017
Capacity 3.6MTPA
Contract Life 20 years
Partners(subject to closing)
Petronas 80%JX Nippon 10%PTT Global LNG 10%
MLNG Dua (Train 4-6)Capacity 9.6MTPACOD May 1995
MLNG Satu (Train 1-3)Capacity 8.4MTPACOD Jan 1983
MLNG Tiga (Train 7-8)Capacity 7.7MTPACOD Mar 2003
MLNG Train 9Capacity 3.6MTPACOD Jan 2017
• Capture opportunity from increasing LNG demand as a supplement to Thailand gas production
• Venture into midstream LNG as a mean to secure LNG supply and growth of PTT and PTTEP, as well as capture value added along with LNG value chain
• Low risk and highly market secured opportunity - Highly experienced operator- Already commenced commercial production with
immediate revenue stream• In vicinity of future upstream opportunities in focus
area – offshore Sarawak
Investment Rationales
10% Investment in MLNG Train 9 by PTT Global LNG….….continue to look for more LNG opportunities globally
42
LNG Value Chain Investment : MLNG Train 9 First step into midstream LNG business in strategic area of focus

* Status: OP = PTTEP operatorship / JOC = PTTEP joint operatorship
** Sales volume stated at 100% basis.
*** DCQ = Daily Contractual Quantity
Project Status* PTTEP’s
Share
Partners
(as of 2017)
2017 Average Sales Volume **2018 Key Activities
Gas Oil and Other
Production Phase
Thailand and JDA
1 Arthit OP 80%Chevron
MOECO
16%
4%218 MMSCFD Condensate: 9.8 k BPD
Ensure gas deliverability level at DCQ****
Drill development wells
2 B6/27 OP 100% - - Prepare drilling plan
3 B8/32 & 9A 25%
Chevron
MOECO
KrisEnergy
PSTL
51.66%
16.71%
4.63%
2%
94 MMSCFD Crude: 25 k BPD Drill development wells
Perform waterflood activities
4 Bongkot OP 44.4445%TOTAL
Shell
33.3333%
22.2222%856 MMSCFD Condensate: 26 k BPD
Ensure gas deliverability level at DCQ****
Drill development wells
Install wellhead platforms
5
Contract 3
(Formerly Unocal
III)
5%Chevron
MOECO
71.25%
23.75%577 MMSCFD
Crude: 22 k BPD
Condensate: 21 k BPD
Drill exploration / appraisal / development wells
Install wellhead platforms
Perform waterflood activities
6Contract 4
(Formerly Pailin)60%
Chevron
MOECO
35%
5%347 MMSCFD Condensate: 16 k BPD
Ensure gas deliverability level at DCQ****
Drill development wells
Install wellhead platforms
Review development plan of Ubon field
7 E5 20% ExxonMobil 80% 9.1 MMSCFD -
8 G4/43 21.375%
Chevron
MOECO
PSTL
51%
21.25%
6.375%
2.2 MMSCFD Crude: 6.1 k BPD Drill development wells
Perform waterflood activities
9 G4/48 5%Chevron
MOECO
71.25%
23.75%5.4 MMSCFD Crude: 1.3 k BPD
10 L53/43 & L54/43 OP 100% - Crude: 627 BPD Drill exploration / appraisal / development wells
11 PTTEP1 OP 100% - Crude: 253 BPD Drill development wells
Perform waterflood activities
12 S1 OP 100% 21 MMSCFD Crude: 26 k BPD
Drill exploration / development wells
Enhance oil recovery program includes
waterflooding and artificial lift
13 Sinphuhorm OP 55%Apico
ExxonMobil
35%
10%78 MMSCFD Condensate: 250 BPD Drill development wells
14 MTJDA JOC 50% Petronas-Carigali 50% 263 MMSCFD Condensate: 7.0 k BPD Drill development wells
Install wellhead platforms
15 L22/43 OP 100% - Crude: 141 BPD Drill development wells
43
Project information 1/3Production phase: Thailand and JDA

* Status: OP = PTTEP operatorship / JOC = PTTEP joint operatorship
** Sales volume stated at 100% basis except for Algeria 433a & 416b
*** DCQ = Daily Contractual Quantity
Project Status* PTTEP’s
Share
Partners
(as of 2017)
2017 Average Sales Volume ** 2018 Key Activities
Gas Oil and Other
Production Phase
Overseas
16 Vietnam 9-2 JOC 25%PetroVietnam
SOCO
50%
25%12 MMSCFD Crude: 4.2 k BPD Maintain production operation
Perform reservoir management
17 Yadana 25.5%
TOTAL
Chevron
MOGE
31.24%
28.26%
15%741 MMSCFD - Ensure gas deliverability level at DCQ***
18 Yetagun 19.3178%
Petronas-Carigali
MOGE
Nippon Oil
PC Myanmar
(Hong Kong)
30.00140%
20.4541%
19.3178%
10.90878%
215 MMSCFDCondensate:
5.5 k BPD
Drill appraisal / development wells
Perform reservoir Management
19 Vietnam 16-1 JOC 28.5%
PetroVietnam
SOCO
OPECO
41%
28.5%
2%
2.0 MMSCFD Crude: 21 k BPD Drill development wells
Maintain production operation
20
PTTEP
Australasia
(PTTEP AA)
OP
90%-100%
(varied by
permits)
- Crude: 11 k BPD Maintain production operation
21 Natuna Sea A 11.5%
Premier Oil
KUFPEC
Petronas
Pertamina
28.67%
33.33%
15%
11.5%
221 MMSCFD Crude: 1.5 k BPD Maintain production operation
22
Zawtika
(M9 & a part of
M11)
OP 80%
Myanma Oil and
Gas Enterprise
(MOGE)
20%
301 MMSCFD - Maintain production rate
Drill development wells
Install wellhead platforms
23Algeria 433a &
416b (Bir Seba)JOC 35%
PetroVietnam
Sonatrach
40%
25% -Crude: 2.8 k BPD
(net entitlement) Maintain production operation
44
Project information 2/3Production phase: Overseas
Project Status* PTTEP’s
SharePartners
(as of 2017)
2018 Key Activities
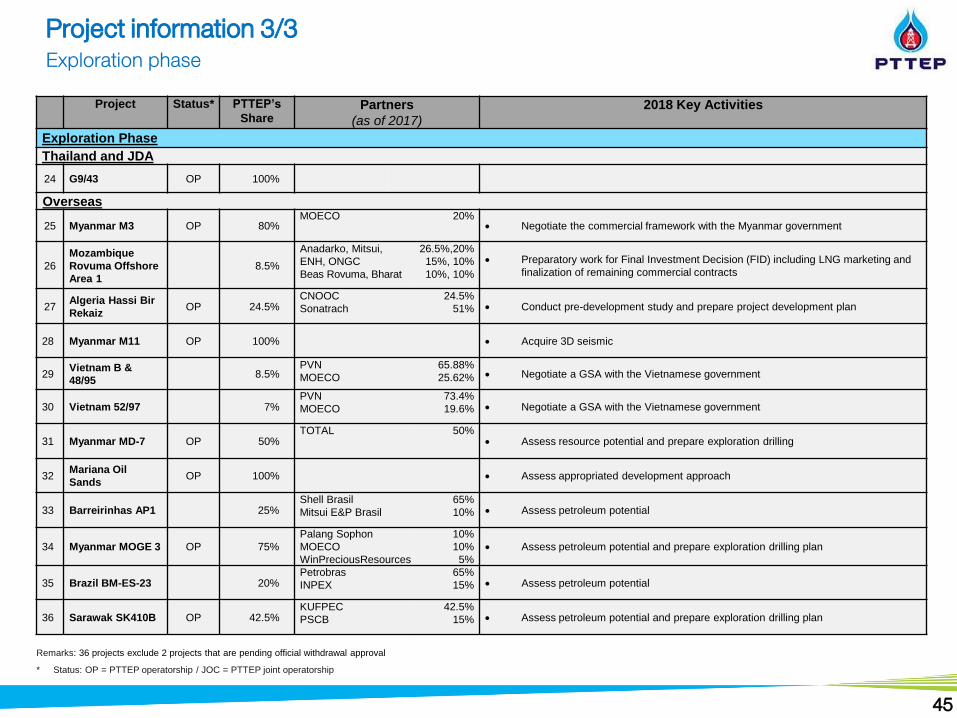
Exploration Phase
Thailand and JDA
24 G9/43 OP 100%
Overseas
25 Myanmar M3 OP 80% MOECO 20%
Negotiate the commercial framework with the Myanmar government
26
Mozambique
Rovuma Offshore
Area 1
8.5%
Anadarko, Mitsui,
ENH, ONGC
Beas Rovuma, Bharat
26.5%,20%
15%, 10%
10%, 10%
Preparatory work for Final Investment Decision (FID) including LNG marketing and
finalization of remaining commercial contracts
27Algeria Hassi Bir
RekaizOP 24.5%
CNOOC
Sonatrach
24.5%
51% Conduct pre-development study and prepare project development plan
28 Myanmar M11 OP 100% Acquire 3D seismic
29Vietnam B &
48/958.5%
PVN
MOECO
65.88%
25.62% Negotiate a GSA with the Vietnamese government
30 Vietnam 52/97 7%PVN
MOECO
73.4%
19.6% Negotiate a GSA with the Vietnamese government
31 Myanmar MD-7 OP 50%TOTAL 50%
Assess resource potential and prepare exploration drilling
32Mariana Oil
Sands OP 100% Assess appropriated development approach
33 Barreirinhas AP1 25%Shell Brasil
Mitsui E&P Brasil
65%
10% Assess petroleum potential
34 Myanmar MOGE 3 OP 75%
Palang Sophon
MOECO
WinPreciousResources
10%
10%
5%
Assess petroleum potential and prepare exploration drilling plan
35 Brazil BM-ES-23 20%Petrobras
INPEX
65%
15% Assess petroleum potential
36 Sarawak SK410B OP 42.5%KUFPEC
PSCB
42.5%
15% Assess petroleum potential and prepare exploration drilling plan
* Status: OP = PTTEP operatorship / JOC = PTTEP joint operatorship
Remarks: 36 projects exclude 2 projects that are pending official withdrawal approval
45
Project information 3/3Exploration phase

Nominating Committee
Remuneration Committee
Risk Management Committee
Strategy and
Business
Development
Group
President, E&P
Geosciences
and
Exploration
Group
Human
Resources and
Business
Services
Group
Finance and
Accounting
Group
Engineering
and
Development
Group
Corporate
Affairs and
Assurance
Group
Internal Audit
Division
Board of Directors
Corporate Governance Committee
Audit Committee
Production
Asset
Group
Safety, Security, Health
and Environment Division
CEO
Operations
Support
Group
Business and
Organization
Transformation
Group
46
Organization structureEnsuring transparency, integrity and good corporate governance

Ratio FormulaLifting Cost ($/BOE) (Operating Exp. – Transportation Cost – Stock Variation – Other expenses not related to lifting) / Production VolumeCash Cost ($/BOE) (Operating Exp. + Exploration Exp. + G&A + Royalties + Finance Cost) / Sales VolumeUnit Cost ($/BOE) (Operating Exp. + Exploration Exp. + G&A + Royalties + Finance Cost + DD&A) / Sales VolumeReserves Replacement Ratio 5-Yr Additional Proved Reserves / 5-Yr Production VolumeReserves Life Index (Year) Proved Reserves / Production VolumeSuccess Ratio Number of wells with petroleum discovery / Total number of exploration and appraisal wellsSales Revenue Sales + Revenue from pipeline transportation EBITDA (Sales + Revenue from pipeline transportation) - (Operating expenses + Exploration expenses + Administrative expenses + Petroleum royalties and
remuneration + Management's remuneration)EBITDA Margin EBITDA / Sales RevenueReturn on Equity Trailing-12-month net income / Average shareholders' equity between the beginning and the end of the 12-month periodReturn on Capital Employed (Trailing-12-month net income + Trailing-12-month Interest Expenses & Amortization of Bond Issuing Cost) / (Average shareholders' equity and
average total debt between the beginning and the end of the 12-month period)Simple Effective Tax Rate Income tax expenses / Income before income taxesTotal debt Short-term loans from financial institution + Current portion of long-term debts + Bonds + Long-term loans from financial institutionNet debt Total debt – LiquidityDebt to Equity Total debt / Shareholders' equityNet Debt to Equity Net debt / Shareholders' equityTotal Debt to Capital Total debt / (Total debt + Shareholders' equity)Total Debt to EBITDA Total debt / Trailing-12-month EBITDANet Debt to EBITDA Net debt / Trailing-12-month EBITDAEBITDA Interest Coverage Ratio Trailing-12-month EBITDA / Trailing-12-month Interest Expenses & Amortization of Bond Issuing Cost
47
Supplementary Index : Ratio & Formula
Recommended