1 1
COMMUNITY COLLEGE BUDGET REPORT SUMMARY:
FY 2019-20
Mt. Hood CC

2
TABLE OF CONTENTS
INTRODUCTION
The Higher Education Coordinating Commission 3
Community College Funding and History 4
Community Colleges and Property Taxes 13
COMMUNITY COLLEGE CAPITAL 15
2019-21 Community College Capital Details 16

3
INTRODUCTION
The annual Community College Budget Report Summary (CCBRS) is a reference document containing
Legislatively Approved Budget (LAB) allocations of state appropriations. The CCBRS provides detailed
funding allocation information for Oregon’s 17 community colleges as well as discussions of the Community
College Support Fund (CCSF). Further detail on an institution’s revenues and spending can be found in the
Community College Financial Information System (CCFIS) located on the Commission’s website or directly
from the institutions.
This CCBRS only concerns state resources designated for Oregon’s seventeen community colleges, and does
not fully cover the budget of any other HECC division or sector, including student financial aid. The
allocations in this edition represent those as of October 2019 and will be updated in January 2020 when
property tax data is received.
THE HIGHER EDUCATION COORDINATING COMMISSION (HECC)
ORS 350.075(3)(E)(e) states that the HECC shall:
Each biennium, after receiving funding requests from the state’s community colleges and public universities as authorized
by law, recommend to the Governor a consolidated higher education agency request budget aligned with the strategic plan
described in paragraph (d) of this subsection, including appropriations for:
(i) Student access programs;
(ii) Public universities listed in ORS 352.002, including but not limited to education and general operations, statewide
public services and state-funded debt service;
(iii) Community colleges, including but not limited to education and general operations and state-funded debt service;
(iv) New facilities or programs;
(v) Capital improvements and deferred maintenance;
(vi) Special initiatives and investments; and
(vii) Any other program, duty or function a public university listed in ORS 352.002 is authorized to undertake.
Per ORS 341.290, community colleges may expend funds consistent with relevant law. The HECC does not
have authority to regulate specific expenditure choices or revenue budgeting by institutions. The HECC is,
however, charged through ORS 350.075(3)(f) with the responsibility to:
Adopt rules governing the distribution of appropriations from the Legislative Assembly to community colleges, public
universities listed in ORS 352.002 and student access programs. These rules must be based on allocation formulas
developed in consultation with the state’s community colleges and public universities, as appropriate.
The major allocation rule for the CCSF is OAR 589-002-0100 and -120. Additional relevant rules are OAR
589-002-0110 and -0130.

4
COMMUNITY COLLEGE FUNDING SUMMARY AND HISTORY
The CCSF is the state’s primary public support for Oregon’s 17 community colleges, comprising 37% of all
community college funding for Oregon’s community colleges in the 2017-18 fiscal year. In theory, the CCSF
has a relatively straightforward method of distributing funds. It is based largely on enrollment via fundable
FTEs as calculated on a three year rolling average. In practice, there are five main components that comprise
the CCSF allocation.
First are the “set asides”, these are four program areas where funds are taken “off the top” for specific
programs and are not distributed via the CCSF formula. They are:
Corrections - A program which allows prisoners to take community college courses. The state pays a
portion of this cost, and the overall allocation to this program increases at the same rate as the overall
CCSF (12.39% this biennium). This program is set at $2.26M for the current biennium.
Contracts Out of District (COD) - This program pays for a relatively small number of students from
portions of Oregon that are not in a community college district (such as Harney County) to take
classes offered by neighboring community college district. The cost of coursework is reimbursed to
the offering district. This program has been funded at $300,000 the past three biennia.
Distance Learning - This program funds efforts to increase distance learning at all 17 community
colleges. The funding level was set at 0.276% of the CCSF several biennia ago and now increases by
the same proportion as the overall CCSF (12.39%). This program is set at $1.84M for the current
biennium.
Strategic Fund - This program provides a fund for community colleges to request allocations to try
and implement unique programs and approaches. The funding level for this program is set by the
HECC in consultation with the Community College presidents. The HECC set this level at 0.75% of
the CCSF for this biennium, the same as the 2017-19 biennium. This results in a funding level of
$4.81M for the current biennium.
These four “set asides” total $9.2M for the current biennium, representing 1.4% of the $640.9M CCSF.
The proportional distribution of the
funds between the various elements of
the CCSF for the current biennium is
displayed at right and a historical
summary of this funding is included in
Table 1.
Amounts appropriated for state paid
debt service are included in the
historical summary. State paid debt is
issued on a limited basis for the
community colleges.
1.44% 5.69%
92.87%
CCSF 2019-21 Distribution
Set-Asides Base Payment CCSF Non-Base

5
Table 1: History of Biennial Appropriations to Community Colleges (In Thousands)
Biennium 2009-11 2011-13 2013-15 2015-17 2017-19 2019-21
CCSF $432,000 $395,500 $464,900 $550,000 $570,264 $640,927
Debt
Service
$7,974 $15,705 $16,635 $24,638 $26,800 $34,836
Total $439,974 $411,205 $481,535 $574,638 $597,064 $675,763
The remaining 98.6% of the CCSF is distributed via the formula, which as noted above is based entirely on
enrollment. Enrollment is defined as fundable FTE in the last three most recently completed academic years.
One fundable FTE is defined as 510 clock hours of instruction (which approximates 15 credits per term for
each of three terms in any given year) and only courses taught to residents of OR/WA/ID/NV/CA that are
physically taught in the state of Oregon count towards this total. Hobby or recreation courses are not
considered “fundable” for CCSF purposes.
An annual FTE audit is conducted every fall to determine which courses shall be considered “fundable” and
therefore counted in an institution’s annual FTE. This audit is conducted in concert with the HECC’s Office
of Research and Data and the HECC’s Community College and Workforce Development (CCWD) office.
Additional details on how FTEs are determined and how this audit process is conducted is available in the
HECC’s FTE Guidelines.
Reimbursable students include residents of Oregon, Idaho, Washington, Nevada and California taking courses
in the State of Oregon. This includes high school students attending community college in Oregon.
Reimbursable courses include career-technical education, lower-division collegiate, postsecondary remedial,
adult basic skills, adult high school diploma and health/safety/workforce development coursework.
The fundable FTE count is also subject to a “hold harmless” methodology that equalizes the clock hours
between those institutions that have 11-week quarters and those that have 12 for the fall term only. This
allows for all similar courses at institutions, regardless of whether they have the extra week of instruction, to be
equal in terms of fundable FTE for that term. All 17 community colleges utilize an 11-week term for the
winter and spring quarters (and an 8-week term for the summer), with Central Oregon, Columbia Gorge, Mt.
Hood, Portland and Oregon Coast Community Colleges utilizing a 12-week fall term. FTE is counted on a
three year rolling average, with 40% based on the most recent year and 30% on each of the two years prior.
Payments are made eight times each biennium, with five in the first year of biennium and three in the second.
In the first year of the biennium, payments are made in July (based on the prior biennium’s funding level),
August, October, January and April. In the second year, payments are made in August, October and January.
With the exception of the July payment, each of the payments is equal in size, although the relative
distributions to each community college differ.
The CCSF utilizes enrollment in three primary ways. First is the base payment, which ensures a minimum
level of funding to all institutions. The base payment provides funding for essential district operations for

6
fixed costs that do not alter based on enrollment. The base payment increases funding stability and
predictability for the colleges.
The base payments are made based on a flat rate per weighted,
reimbursable FTE up to 1,100 FTE per year and half that rate for
any FTE a college has below the 1,100 FTE level. A college size
factor is then used to ensure smaller institutions receive additional
funds in recognition that they lack economies of scale. An
institution’s FTE total falls into one of several bands that infer the
college size factor. The current college size factors are noted in the
table at left.
The flat dollar rate used to calculate the base payments is adjusted
annually for inflation. In the past, the inflationary factor applied had
been the Portland-CPI, but following the recent dissolution of that
measure, it is now the West Region CPI. The current college size
factors
A chart summarizing total community college enrollment by biennium is below. For planning purposes,
enrollment for 2019-21 is projected to be the same as the past biennium although decreasing enrollment is
expected.
After growing substantially since the great recession, enrollments have been falling for the past few years.
Falling enrollments can place pressure on tuition rates. For the community colleges, raising local property tax
assessments can offset some of the tuition pressure.
0
50,000
100,000
150,000
200,000
250,000
CC FTE Enrollment
If FTE is:
College Size Factor Used in Base Calculation
0-750 1.3513
751-1,250 1.2784
1,251-1,750 1.2062
1,751-2,250 1.1347
2,251-2,750 1.0641
2,751-3,250 1.0108
3,251-3,750 1.0081
3,751-4,250 1.0054
4,251-4,999 1.0027
5,000 and over 1.0000
7
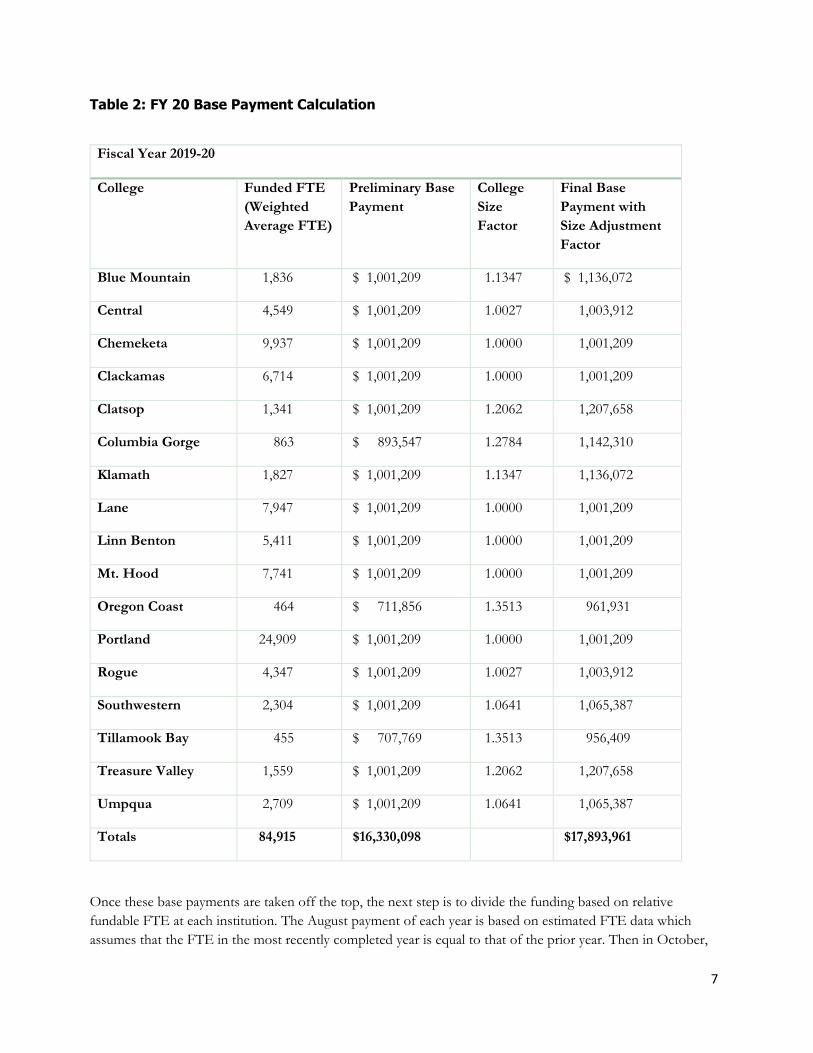
Table 2: FY 20 Base Payment Calculation
Fiscal Year 2019-20
College Funded FTE
(Weighted
Average FTE)
Preliminary Base
Payment
College
Size
Factor
Final Base
Payment with
Size Adjustment
Factor
Blue Mountain 1,836 $ 1,001,209 1.1347 $ 1,136,072
Central 4,549 $ 1,001,209 1.0027 1,003,912
Chemeketa 9,937 $ 1,001,209 1.0000 1,001,209
Clackamas 6,714 $ 1,001,209 1.0000 1,001,209
Clatsop 1,341 $ 1,001,209 1.2062 1,207,658
Columbia Gorge 863 $ 893,547 1.2784 1,142,310
Klamath 1,827 $ 1,001,209 1.1347 1,136,072
Lane 7,947 $ 1,001,209 1.0000 1,001,209
Linn Benton 5,411 $ 1,001,209 1.0000 1,001,209
Mt. Hood 7,741 $ 1,001,209 1.0000 1,001,209
Oregon Coast 464 $ 711,856 1.3513 961,931
Portland 24,909 $ 1,001,209 1.0000 1,001,209
Rogue 4,347 $ 1,001,209 1.0027 1,003,912
Southwestern 2,304 $ 1,001,209 1.0641 1,065,387
Tillamook Bay 455 $ 707,769 1.3513 956,409
Treasure Valley 1,559 $ 1,001,209 1.2062 1,207,658
Umpqua 2,709 $ 1,001,209 1.0641 1,065,387
Totals 84,915 $16,330,098 $17,893,961
Once these base payments are taken off the top, the next step is to divide the funding based on relative
fundable FTE at each institution. The August payment of each year is based on estimated FTE data which
assumes that the FTE in the most recently completed year is equal to that of the prior year. Then in October,

8
final FTE data is incorporated into the model and the forthcoming payments are adjusted to reflect any
relative changes. For example, the final 2017-18 academic year FTE data showed a relative increase at Mt.
Hood Community College and a relative decrease at Lane Community College, which resulted in slight
adjustments to future payments.
The other adjustment that is made every year is based on property tax assessments in each district, which are
incorporated into the January payment. Property taxes are combined with CCSF calculations to produce a
measure of the Total Public Resources (TPR) per FTE for each institution. OAR 589-002-0120(c)(C)(ii) states
that the TPR may not decrease more than 5% year over year for any one college, a form of a “stop-loss”
mechanism. If that occurs, due to a substantial change in tax assessments for any one institution, their state
funding per FTE may change to meet this requirement.
A chart of the TPR and the breakdown between property taxes and CCSF for the current fiscal year is
displayed below. These values are currently based on projected property tax assessments and will change as the
actual property tax assessments are included in the calculations.
Table 3: FY 20 TPR Breakdown (Estimated)
College TPR per FTE
Taxes per FTE
% of TPR CCSF per FTE
% of TPR
Blue Mountain
$6,446 $3,412 52.93% $3,034 47.07%
Central $6,048 $4,141 68.46% $1,907 31.54%
Chemeketa $5,928 $2,387 40.27% $3,541 59.73%
Clackamas $5,977 $3,126 52.30% $2,851 47.70%
Clatsop $6,728 $3,660 54.39% $3,068 45.61%
Columbia Gorge
$7,151 $1,495 20.91% $5,655 79.09%
Klamath $6,449 $1,249 19.36% $5,201 80.64%
Lane $5,954 $2,766 46.46% $3,188 53.54%
Linn Benton $6,013 $1,676 27.88% $4,336 72.12%
Mt. Hood $5,957 $1,791 30.07% $4,166 69.93%
Oregon Coast $7,900 $2,953 37.38% $4,947 62.62%
Portland $5,868 $1,529 26.07% $4,338 73.93%
Rogue $6,059 $3,474 57.34% $2,585 42.66%
Southwestern $6,290 $2,719 43.22% $3,571 56.78%
Tillamook Bay $7,929 $3,009 37.95% $4,920 62.05%
Treasure Valley
$6,602 $1,651 25.01% $4,951 74.99%
Umpqua $6,221 $1,501 24.13% $4,720 75.87%
Total $6,038 $2,262 37.46% $3,777 62.54%
There is also an additional adjustment made in some years due to projected unexpended funds in the CCSF
set-asides. If there are such funds, they are distributed at the same relative percentages each community

9
college received over the year in question. Any such adjustments, often referred to as “reconciliation
payments”, are made in the current biennium.
Growth Management
The CCSF includes two components meant to limit the growth of FTE at any one institution relative to
others. The first is the HECC’s “biennial growth management component.” According to OAR 589-002-
0120 6(c)(C)(ii):
(C) The state board has authority, on a biennial basis to, set the “quality growth factor” that may increase or decrease
the number of FTE that will be counted for funding purposes above or below the Biennial Growth Management
Component. The state board will consider the following principles as guidelines for setting the “quality growth factor”:
(i) Balance the desire to support growth beyond that which is funded through the funding formula distribution model with
the desire to enhance quality by increasing the level of funding provided on a per-student FTE basis.
(ii) The TPR per FTE should not erode by more than 5% on an annual basis.
(iii) Where current TPR per FTE is determined to be insufficient to support the “quality of education” desired, a growth
factor could be established that would increase the TPR per FTE.
(iv) If revenue is significantly reduced during a biennium, the Board may reduce the “quality growth factor.
This allows the HECC to, in effect, adjust the value of each FTE in order to maintain stable funding for each
institution. The HECC has maintained this component at 0.0% in the current biennium, meaning that it is
not adjusting the value of each FTE.
The second such mechanism is the “Growth Management Component” (GMC) which is intended to ensure
that substantial increases in FTE at any institution with more than 1,100 FTE (every community college except
Columbia Gorge, Oregon Coast and Tillamook Bay) will not erode the funding for other institutions. As a
general rule, if any institution with more than 1,100 FTE sees an increase in FTE of 5% or more higher than
the overall change in FTE, it may be subject to the GMC. Institutions that exceed the relevant cap have their
FTE reduced for formula purposes. The GMC has not been utilized since 2015-16 (where it reduced Klamath
CC’s funded FTE by 93) and is not likely to impact funding in the near future due to flat or declining
enrollment at most community colleges.
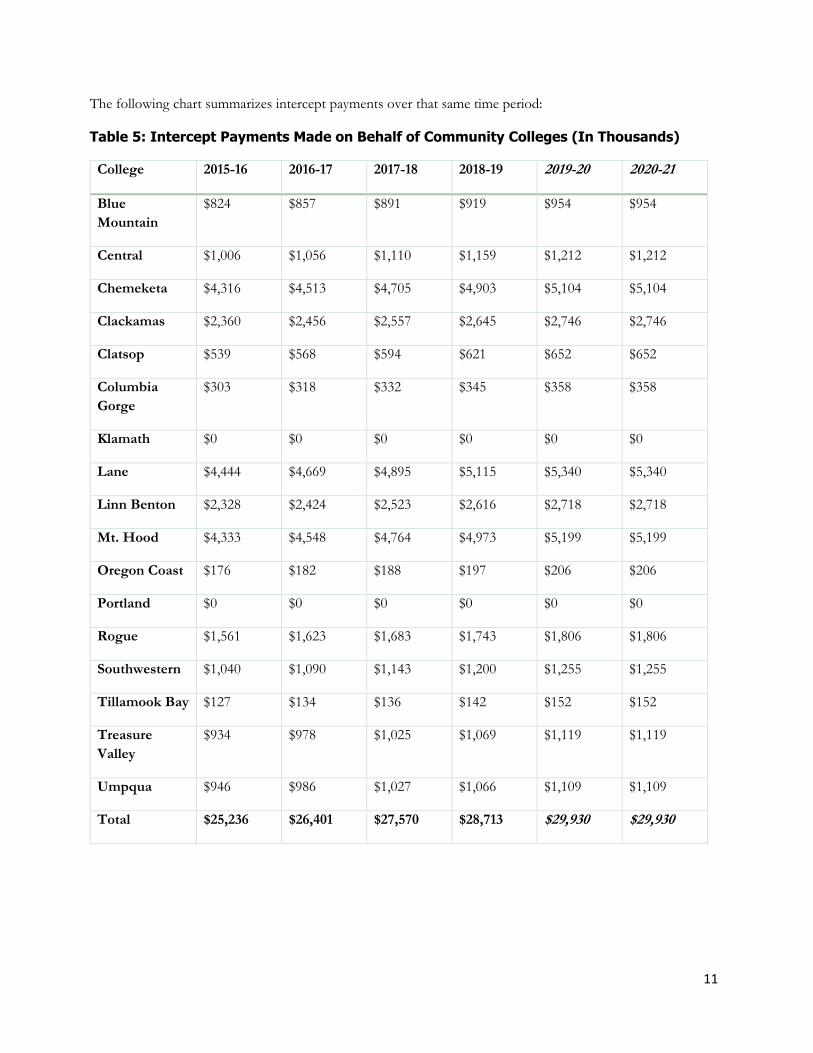
Intercept Payments
Additionally, although not subject to the formula, CCSF distributions in August, October and January of every
year also include “intercept payments”, which are payments made related to debt service for pension
obligation bonds issued on behalf of 15 of the 17 community colleges (all except Klamath and Portland) from
2003-05. Pursuant to details provided by Wells Fargo, which manages the bonds, a portion of each of these
three distributions is “intercepted” and sent directly to Wells Fargo for each of these three payment periods
per year. These payments total $29.9M in the current fiscal year.
Timber Tax Revenue
Community colleges additionally receive a small amount of timber tax funds (around $50,000-$80,000 a
biennium) distributed on an annual basis each May. These funds are distributed in equal shares to all 17

10
community colleges. These timber taxes, combined with the CCSF, are the primary source of state level funds
for community colleges.
A summary of the historical funding to each institution is below (estimated years in italics):
Table 4: CCSF Appropriations to Community Colleges (In Thousands)
College 2015-16 2016-17 2017-18 2018-19 2019-20 2020-21
Blue
Mountain
$5,223 $4,818 $5,172 $4,841 $5,571 $5,176
Central $9,391 $9,321 $9,073 $7,814 $8,677 $7,696
Chemeketa $31,066 $31,685 $32,087 $31,253 $35,189 $35,152
Clackamas $14,649 $14,279 $15,738 $16,039 $19,141 $18,645
Clatsop $2,231 $2,364 $2,620 $3,183 $4,115 $4,188
Columbia
Gorge
$4,277 $4,138 $4,241 $4,278 $4,883 $5,024
Klamath $5,951 $6,648 $7,424 $8,112 $9,504 $9,944
Lane $31,377 $27,230 $24,462 $22,479 $25,333 $25,033
Linn Benton $19,433 $19,291 $20,335 $21,017 $23,462 $23,552
Mt. Hood $27,719 $27,058 $27,884 $28,175 $32,245 $32,444
Oregon Coast $1,732 $1,788 $1,838 $1,986 $2,297 $2,396
Portland $84,634 $89,344 $94,344 $95,914 $108,067 $108,993
Rogue $9,763 $9,457 $9,420 $9,228 $11,234 $11,124
Southwestern $7,331 $7,468 $7,645 $7,635 $8,230 $8,015
Tillamook Bay $1,333 $1,429 $1,613 $1,792 $2,239 $2,419
Treasure
Valley
$7,321 $7,083 $6,981 $6,933 $7,720 $7,925
Umpqua $10,469 $10,499 $11,160 $11,358 $12,786 $12,967
Total $273,901 $273,901 $282,038 $282,038 $320,693 $320,693
11
The following chart summarizes intercept payments over that same time period:
Table 5: Intercept Payments Made on Behalf of Community Colleges (In Thousands)
College 2015-16 2016-17 2017-18 2018-19 2019-20 2020-21
Blue
Mountain
$824 $857 $891 $919 $954 $954
Central $1,006 $1,056 $1,110 $1,159 $1,212 $1,212
Chemeketa $4,316 $4,513 $4,705 $4,903 $5,104 $5,104
Clackamas $2,360 $2,456 $2,557 $2,645 $2,746 $2,746
Clatsop $539 $568 $594 $621 $652 $652
Columbia
Gorge
$303 $318 $332 $345 $358 $358
Klamath $0 $0 $0 $0 $0 $0
Lane $4,444 $4,669 $4,895 $5,115 $5,340 $5,340
Linn Benton $2,328 $2,424 $2,523 $2,616 $2,718 $2,718
Mt. Hood $4,333 $4,548 $4,764 $4,973 $5,199 $5,199
Oregon Coast $176 $182 $188 $197 $206 $206
Portland $0 $0 $0 $0 $0 $0
Rogue $1,561 $1,623 $1,683 $1,743 $1,806 $1,806
Southwestern $1,040 $1,090 $1,143 $1,200 $1,255 $1,255
Tillamook Bay $127 $134 $136 $142 $152 $152
Treasure
Valley
$934 $978 $1,025 $1,069 $1,119 $1,119
Umpqua $946 $986 $1,027 $1,066 $1,109 $1,109
Total $25,236 $26,401 $27,570 $28,713 $29,930 $29,930

12
Below you can see the funding per FTE adjusted for inflation.
COMMUNITY COLLEGES AND PROPERTY TAXES
A key portion of funding for Oregon’s 17 community colleges is local property tax revenue. In the 2017-18
academic year, property taxes totaled $169.8M, or 21.6% of community college revenues. Property taxes are
considered both in the distribution of the CCSF and in the setting of the biennial current service level (CSL).
For example, in the most current biennium, the CSL was decreased due to an expected increase in property tax
revenues.
Oregon’s property tax system is not, however, straightforward. This is due to three ballot measures passed in
the 1990s (Measures 5, 47 and 50) which amended Oregon’s constitution relating to property taxes. Measure
5, passed in 1990 capped property taxes at a rate of $5 per $1,000 in assessed value for schools and $10 per
$1,000 in assessed value for general government. This resulted in what is known as “compression”, where
property tax rates were reduced to comply with these limits.
Measures 47/50, passed in 1996 and 1997, capped the growth of “assessed value” of property at 3% per year
above 90% of the “market value” of property in the 1995-96 tax year, with some exceptions, such as for new
construction and substantial remodeling of existing homes. These two measures combined to create
“permanent rates” which are rate limits based on the rates prior to Measures 5/47/50.
Voters can elect to exceed these rates for two reasons. First, a local option levy may be proposed which
increases the base rate for any property tax to fund operations, most commonly for schools or public safety
efforts. These levies must be approved by the voters every five years. Second, voters may elect to increase
property taxes to bond for capital projects, a common method by which community colleges, for example,
meet the constitutionally required match for XI-G bonds. Bond levies are not subject to compression or
limitation under measures 5/47/50.
Every year each community college submits its assessed property taxes it receives from counties within its
district to the HECC for inclusion in the CCSF. It is important to note that these are “assessed taxes” and do
not account for any discounts (such as the 3% discount should taxes be paid in full by the end of October),
$0
$500
$1,000
$1,500
$2,000
$2,500
$3,000
$3,500
$4,000
Inflation Adjusted Funding per FTE

13
nor does it account for the inevitable proportion of taxes (1-3% in many cases) that are not collected for
various reasons.
The chart below summarizes property taxes (and estimated property taxes for the current biennium) for each
community college:
Table 6: Property Taxes for Community Colleges (In Thousands)
College 2015-16 2016-17 2017-18 2018-19 2019-20 2020-21
Blue
Mountain
$5,219 $5,522 $5,633 $5,940 $6,265 $6,606
Central $15,035 $15,801 $16,700 $17,737 $18,838 $20,007
Chemeketa $20,016 $20,898 $21,752 $22,715 $23,721 $24,771
Clackamas $17,382 $18,266 $19,200 $20,074 $20,989 $21,945
Clatsop $4,271 $4,407 $4,545 $4,723 $4,908 $5,100
Columbia
Gorge
$1,061 $1,109 $1,164 $1,226 $1,291 $1,360
Klamath $2,076 $2,115 $2,199 $2,240 $2,282 $2,325
Lane $18,573 $19,173 $20,052 $20,995 $21,982 $23,016
Linn Benton $7,567 $7,939 $8,331 $8,693 $9,070 $9,464
Mt. Hood $11,734 $12,241 $12,802 $13,323 $13,866 $14,432
Oregon Coast $1,182 $1,215 $1,272 $1,320 $1,371 $1,423
Portland $32,561 $33,407 $35,648 $36,853 $38,098 $39,386
Rogue $12,756 $13,269 $13,881 $14,478 $15,102 $15,752
Southwestern $5,507 $5,688 $5,915 $6,087 $6,265 $6,448
Tillamook Bay $1,163 $1,200 $1,245 $1,306 $1,370 $1,437
Treasure
Valley
$2,063 $2,286 $2,540 $2,557 $2,575 $2,592
Umpqua $3,500 $3,635 $3,738 $3,899 $4,067 $4,242
Total $161,666 $168,170 $176,617 $184,168 $192,059 $200,305

14
COMMUNITY COLLEGE CAPITAL
Community College capital projects are funded via Article XI-G Bonds up to a maximum of $8
million per project. Each community college may only have one state funded project at any one time.
XI-G Bonds require a dollar to dollar match. This match is most even derived from local bond levies,
lottery bonds, or private donations. However, other sources may be used for matches such as
economic development funds appropriated by the Federal Government. Since it can take a while for
these matches to be obtained, the Oregon Legislature regularly reauthorizes projects that have not yet
received their match.
Projects may exceed $16 million ($8M XI-G and $8 match) but any excess must be funded by non-
state bonding.
The project review process for community college capital construction is relatively straightforward. A basic
outline of how this process worked for the current biennia is described below, and this is representative of the
process in general:
Projects SubmittedMarch 2018
• Due diligence on potential projects were due and proposed projects were submitted.
Capital Construction WorkgroupApril 2018
• A Capital Construction workgroup consisting of representatives from community colleges and HECC staff blind graded the projects with the consultation of a capital construction workgroup
Final Recommendations to HECCMay 2018
• The Oregon Presidents Council finalized their recommendations
Proposed List Adopted by HECCJune 2018
• The proposed project list was adopted by the Commission for inclusion in the HECC’s Agency Request Budget (ARB).
GRB ReleasedDecember 2018
• The governor releases her Governor’s Request Budget (GRB), which includes her list of proposed community college capital projects based on the ARB.
Projects Considered for Funding2019 Session
• The Oregon Legislature considered and approved the projects and reauthorizations listed below as part of the 2019 Bond Authorization bill.

15
2019-21 COMMUNITY COLLEGE CAPITAL DETAILS
The LAB supports three new capital construction projects at Oregon’s community colleges, including the
Central Oregon CC Classroom Building Redmond Campus, Klamath CC Apprenticeship and Industrial
Trades Center, and the Treasure Valley CC Nursing-Allied Health Professions Center. It also reauthorizes
eight previously approved projects under the Article XI-G bond program. These projects also include $6.5M
in new lottery bond issuance for Blue Mountain CC. The investment totals $81.8M. Community Colleges are
expected to match $74.1M of that total.
Table 7: Oregon Community Colleges Capital Projects (Includes Cost of Issuance)
Institution Project XI-G (state
paid requiring
match)
Lottery Bonds Total
BMCC Facility for Agricultural Resource
Management
$6.6M $6.5M $13.1M
CCC Marine Science Center Renovation &
Expansion
$8.1M $8.1M
COCC
(new)
Classroom Building Redmond
Campus
$8.1M $8.1M
KCC (new) Apprenticeship and Industrial Trades
Center
$4.0M $4.0M
LCC Health Care Village Facility $8.1M $8.1M
MHCC Maywood Park Center $8.1M $8.1M
OCCC Workforce Education & Resiliency
Center
$8.1M $8.1M
PCC Health Technology Building
Renovation
$8.1M $8.1M
SOCC Sumner & Coaledo Halls Remodel $2.8M $2.8M
TVCC
(new)
Nursing-Allied Health Professions
Center
$5.0M $5.0M
UCC Industrial Technology Building $8.1M $8.1M
Total $75.3M $6.5M $81.8

16
Recommended