COMMON CHARACTERISTICS OF SUCCESSFUL SPECIAL EDUCATION REFERRALS: INITIAL REFERRALS RESULTING
IN SPECIAL EDUCATION PLACEMENT
by
Patricia G. Dykstra
A Research Paper
Submitted in Partial Fulfillment of the Requirements for the
Master of Science Degree With a Major in
School Counseling
Approved: 2 Semester Credits
______________________ Dr. Denise Zirkle, Advisor
The Graduate College University of Wisconsin-Stout
August, 2002

ii
The Graduate College
University of Wisconsin-Stout Menomonie, WI 54751
ABSTRACT
Dykstra Patricia G. (Writer) (Last Name) (First) (Initial) Common Characteristics of Successful Special Education Referrals: Initial (Title) Referrals Resulting in Special Education Placement School Counseling Dr. Denise Zirkle August/2002 26 (Graduate Major) (Research Advisor) (Month/Year) (No. of Pages) American Psychological Association (APA) Publication Manual
(Name of Style Manual Used in this Study)
Every year there is increasing pressure on school districts to provide more services to
their students with fewer funds. In order to maintain high quality programs school
districts need to assess current programs and provide the services through the most
effective means possible. The purpose of this study was to identify common
characteristics of initial referrals to Special Education, which result in placement to
Special Education. The research for this study focused specifically on five key areas.
The five key areas included: the criteria for qualifying for special education, the referral
process of special education, factors affecting special education placement, the funding of
special education, and the impact of the special education referral process on the stress of
teachers.

iii
Special education is defined as the “specially designed instruction, at no cost to
the parents, to meet the unique needs of a child with a disability (Federal Register, 1999,
pg. 12425). Special education plays an important role in the public education process.
With school districts facing impending budget cuts, schools are left with questions about
how to fund the school system. Further research indicated that not only are special
education enrollments rising; the special education costs per student also appear to be
rising (Parrish, 2001).
Another area of importance is the recruiting and retaining of quality teachers for
special education. With the increase in the number of special education referrals an
increasing pressure is placed on special educators. Research revealed special education
teachers are especially “at-risk” of stress and burnout and up to 10% of special educators
leave the teaching profession (Singer, 1993).
With pending budget cuts and teachers facing burnout it is increasing important to
provide efficient programs. This study identified the most common characteristics of
successful special education referrals within a small school district. The study revealed
that a majority of the successful referrals were males. Students referred for a Speech and
Language Disability or Emotional Disturbance were most likely to be placed into the
special education program. Finally the majority of successful referrals were Elementary
students referred by their teacher within the first quarter of the school year.
By identifying these common factors the school will have a good foundation for
evaluating the efficiency of the special education program. Furthermore the school will
be able to utilize their resources most effectively to ensure a high quality special
education program.

iv
ACKNOWLEDGEMENTS
I would like to thank my family and friends for all of their support while I have pursued
my educational dreams.
I would like to especially thank Dr. Denise Zirkle for her patience, understanding, and dedication. Your guidance and support has been invaluable.
Thank You.

v
TABLE OF CONTENTS
Introduction..........................................................Page 1 Statement of the Problem.....................................Page 2 Definition of Terms..............................................Page 3 Limitations of Study ............................................Page 4 Review of Literature ............................................Page 5 Methodology........................................................Page 14 Results..................................................................Page 16 Discussion............................................................Page 20 References............................................................Page 25 Figures..................................................................Page 28

Characteristics of Special Education 1
CHAPTER I
Introduction
Every year there is increasing pressure for school districts to provide more
services to their students with dwindling funds. In order to maintain high quality
programs, school districts are assessing current programs to ensure the services are being
provided as effectively as possible. Special education is a prime example of a program
mandated through laws, rules, and regulations to provide a wide array of services. Often
school districts struggle with a lack of funds to provide these services. Although federal
and state funds contribute to the special education program more pressure is being placed
on local districts to fund the special education program (Parrish, 2001). School districts
are struggling to provide a balance between providing comprehensive services while
maintaining cost effective programs. This study will assess the effectiveness of the
special education referral process of one school district.
There is a lot of research available regarding special education. For the purpose
of this study the research is focused specifically on the referral process and factors
regarding the referral process. The enactment of Public Law 94-142 in 1975 developed
the framework for the special education process. The referral process of special
education requires specific school personnel to provide “an appropriate evaluation” (P. L.
94-142). Educational resources and qualified personnel are increasingly valuable to
school districts, yet qualified personnel are increasingly difficult to recruit and retain,
especially in the field of special education (Miller, Brownell, & Smith, 1999). Ideally the
majority of a special educator’s time is spent in direct services to the students, yet “many

Characteristics of Special Education 2
special educators reported that increases in caseloads corresponded with simultaneous
increases in meetings and paperwork demands” (Russ, Chiang, Rylance, & Bongers,
2001, pg. 162). Although the assessment process of a special education referral is
necessary, if the referral does not result in a placement to the special education program
the assessment may take valuable time away from other students. It is unrealistic to
assume that each referral to the special education program will result in a placement to
special education, but by minimizing the unsuccessful referrals, valuable resources can be
utilized elsewhere. Furthermore by identifying common characteristics of successful
referrals to special education I will also be able to identify characteristics of unsuccessful
referrals. Both conclusions provide valuable information to the school district. By
identifying characteristics of successful and unsuccessful referrals the school district will
be able to assess the best way to increase successful referrals and decrease the
unsuccessful referrals. Additionally, the school district would be able to provide in-
service training and support to all teachers regarding the special education referral
process. Furthermore, I hope the results of this study will provide the school district with
the ability to provide effective programs while utilizing all personnel resources
efficiently. This can be accomplished by minimizing the assessments and paperwork of
unsuccessful referral, therefore allowing teachers to utilize their time in direct service to
students.
Statement of the Problem
The school district has been dissatisfied with the effectiveness of their current
referral process. Furthermore the number of unsuccessful referrals has been an area of
concern for the school district. The purpose of this study was to identify common
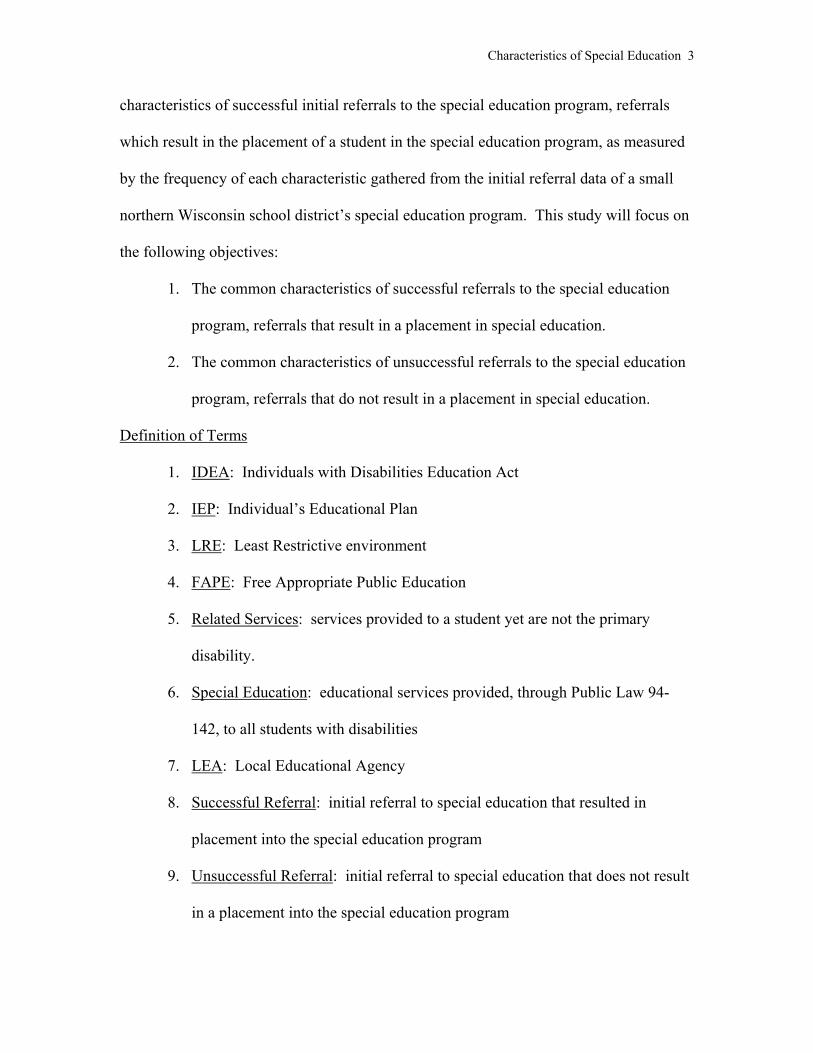
Characteristics of Special Education 3
characteristics of successful initial referrals to the special education program, referrals
which result in the placement of a student in the special education program, as measured
by the frequency of each characteristic gathered from the initial referral data of a small
northern Wisconsin school district’s special education program. This study will focus on
the following objectives:
1. The common characteristics of successful referrals to the special education
program, referrals that result in a placement in special education.
2. The common characteristics of unsuccessful referrals to the special education
program, referrals that do not result in a placement in special education.
Definition of Terms
1. IDEA: Individuals with Disabilities Education Act
2. IEP: Individual’s Educational Plan
3. LRE: Least Restrictive environment
4. FAPE: Free Appropriate Public Education
5. Related Services: services provided to a student yet are not the primary
disability.
6. Special Education: educational services provided, through Public Law 94-
142, to all students with disabilities
7. LEA: Local Educational Agency
8. Successful Referral: initial referral to special education that resulted in
placement into the special education program
9. Unsuccessful Referral: initial referral to special education that does not result
in a placement into the special education program

Characteristics of Special Education 4
10. Student Study Team (SST): team that considers cases individually and
prescribes prereferral interventions for the student
11. IEP Team: group of individuals involved in the evaluation and re-evaluations
of a student referred to special education
Limitations of the Study
1. The data analysis of this study included data from one school district and
conclusions can only be drawn for that school district.
2. Data was utilized from one school year and may not represent trends over
time.
3. The school is a small school in northern Wisconsin.
4. The school population consists largely of Caucasian students with few
minority students.
5. The school is located in a rural community.
6. A majority of the students come from families of low-income status.

Characteristics of Special Education 5
CHAPTER II
Review of Literature
In reviewing the literature regarding special education referrals, five key areas of
importance were noted. The five key areas include: the criteria for qualifying for special
education, the referral process of special education, factors affecting special education
placement, the funding of special education, and the impact of the special education
referral process on the stress of teachers.
Criteria for Qualifying for Special Education
In 1975 Public Law 94-142, the Education for All Handicapped Children Act,
mandated a free appropriate public education for all children with disabilities, ensured
due process rights, and mandated Individual Education Plans (IEPs) and Least Restrictive
Environments (LREs). In 1990 amendments were added to the Education for All
Handicapped Children Act and the law became known as IDEA, the Individuals with
Disabilities Education Act. Additional amendments to IDEA were made in 1997; this is
the current law that governs special education in the schools today. According to
Telzrow (1999), “the IDEA Amendments of 1997 introduced some of the most sweeping
changes in federal law since the enactment of Public Law 94-142 in 1975” (pg. 7). There
are six principles of the Individuals with Disabilities Education Act that provide the
foundation of the special education services. These principles are a free appropriate
public education (FAPE), an appropriate evaluation, an individualized education plan
(IEP), the least restrictive environment (LRE), parent and student participation in
decision-making, and procedural safeguards.

Characteristics of Special Education 6
According to IDEA (1997), when a child is referred to special education under
IDEA three procedures have to be followed in sequence:
1. The child has to be qualified as eligible for special education and related
services by meeting criteria for one of the sanctioned disability
categories.
2. A free appropriate public education (FAPE) must be provided for in the
formalized individual education plan (IEP).
3. The setting in which FAPE is to be accomplished is to be specified in
keeping with the principle of least restrictive environment (LRE).
The evaluation must be provided by a team of people, which must include at least one
teacher or specialist knowledgeable about each area of the child’s suspected disability.
The evaluation must be individualized and the child must be assessed in all areas of
suspected disability. Tests and evaluation materials must be provided and administered
in the child’s native language or mode of communication. Schools “qualify children as
special education eligible by essentially “matching” child characteristics to the criteria
specified in the state regulations in efforts to determine whether a child is eligible for
special education” (MacMillan, Gresham, Bocian, & Siperstein, 1997, pg. 2). In order to
qualify for special education the student must meet specific criteria for at least one of the
following thirteen categories “The thirteen categories of disabilities identified in the law
are: autism (A), specific learning disability (LD), speech or language impairments (SpL),
emotional disturbance (ED), traumatic brain injury (TBI), visual impairment (VI),
hearing impairment (HI), deafness (D), mental retardation (MR), deaf-blindness (D-B),
multiple disabilities (MD), orthopedic impairment (OI), and other health impairment

Characteristics of Special Education 7
(OHI)” (deBettencourt, 2002, pg. 17). If a child meets the criteria of one of these
categories, the team must also determine if the child is “in need of special education
services”. The referral can become a lengthy and time-consuming process. In his article,
Smith (2002) observed, “although much about IDEA has been good, it has evolved into a
bureaucratic nightmare for schools. The paperwork that is currently required has become
overwhelming, often to the point that its completion impedes the provision of appropriate
services to the student the law is intended to serve” (pg. 6). Although the referral process
is time-consuming there is no guarantee the child will qualify for special education.
“Every day, solitary teachers in general classrooms struggle without success to help
students who have been designated as ineligible for special education services because
they do not fit one or more of the abnormal classification criteria” (Audette & Algozzine,
1997, pg. 382). Nonetheless, schools are required to provide an appropriate evaluation to
all students referred to the special education program.
Special Education Referral Process
Any person can refer a child to the special education program within their school.
Furthermore, students attending private schools or students that are home schooled are
entitled to special education services. Although the referral may originate from a variety
of sources the most common sources of special education referrals are the general
education teachers, guidance counselors, and parents. Once a referral is made to the local
educational agency (LEA) the agency is responsible for notifying the child’s parents of
the referral and providing an appropriate evaluation. Schools often develop a referral
process individualized to their school district. “Before a child is referred for formal
evaluation, efforts are made to remedy the child’s learning and/or behavior problems in
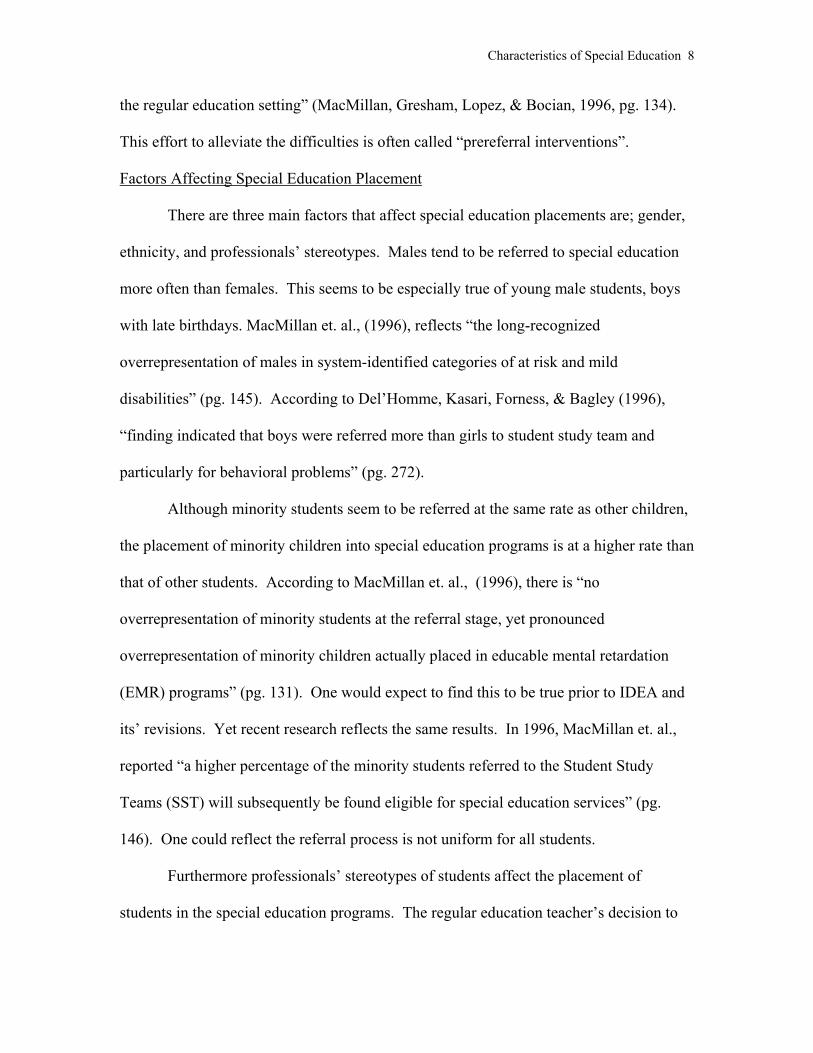
Characteristics of Special Education 8
the regular education setting” (MacMillan, Gresham, Lopez, & Bocian, 1996, pg. 134).
This effort to alleviate the difficulties is often called “prereferral interventions”.
Factors Affecting Special Education Placement
There are three main factors that affect special education placements are; gender,
ethnicity, and professionals’ stereotypes. Males tend to be referred to special education
more often than females. This seems to be especially true of young male students, boys
with late birthdays. MacMillan et. al., (1996), reflects “the long-recognized
overrepresentation of males in system-identified categories of at risk and mild
disabilities” (pg. 145). According to Del’Homme, Kasari, Forness, & Bagley (1996),
“finding indicated that boys were referred more than girls to student study team and
particularly for behavioral problems” (pg. 272).
Although minority students seem to be referred at the same rate as other children,
the placement of minority children into special education programs is at a higher rate than
that of other students. According to MacMillan et. al., (1996), there is “no
overrepresentation of minority students at the referral stage, yet pronounced
overrepresentation of minority children actually placed in educable mental retardation
(EMR) programs” (pg. 131). One would expect to find this to be true prior to IDEA and
its’ revisions. Yet recent research reflects the same results. In 1996, MacMillan et. al.,
reported “a higher percentage of the minority students referred to the Student Study
Teams (SST) will subsequently be found eligible for special education services” (pg.
146). One could reflect the referral process is not uniform for all students.
Furthermore professionals’ stereotypes of students affect the placement of
students in the special education programs. The regular education teacher’s decision to
Characteristics of Special Education 9
refer a child is the single most important decision that is made in the assignment of
children to learning disabilities programs (MacMillan et. al., 1996). Teachers may be
good predictors of their students in need or their perceptions of the student as having a
disability may carry through the evaluation process. Since a regular education teacher
must be involved as part of the IEP team, most often the referring regular education
teacher is involved in the process. According to Ysseldyke (2001), “the referral and
entitlement decisions were more heavily influenced by naturally occurring student
characteristics (gender, socioeconomic status, physical appearance, and the political
power or social influence of students’ parents) and the extent to which student behavior
bothered teachers, than they were based on the scores students earned on tests” (pg. 300).
Therefore the perception of the professionals involved in the team plays a large role in
the placement of a student to special education. The stereotypes of students held by
professionals, whether it is a student can achieve success or a student has a disability,
affects the students’ outcomes (Ysseldyke, 2001).
Although other factors affect student placement into a special education program,
these three factors play a key role in the placement of a student to a special education
program following a referral, therefore they are the important factors in this study.
Education and Budgets
Funding public schools is a very complex process that involves federal aid, state
revenues, and local property taxes. Over the years, Wisconsin schools have struggled to
balance the budget while maintaining quality programs. Along with the past year, the up-
coming years of Wisconsin school budgeting promises to be a difficult, lengthy process.
Threats of program cuts and teacher lay-offs are common school board dilemmas. The

Characteristics of Special Education 10
State Superintendent of Public Instruction, Elizabeth Burmaster, echoed this dilemma by
stating, “Even before the ink dried on the 2001-2003 biennial budget signed into law on
August 30, 2001, questions regarding how we fund our PK-12 public school system
persisted” (Wisconsin Department of Public Instruction, 2002, pg. 1). Special education
costs have been on the rise due to the increase of the number of students in special
education and the increased cost of special education (Parrish, 2001). According to the
National Center for Education Statistics, 1997, the number of students participating in
special education has increase by 47% between 1977 and 1995. Although the large
increase of students placed in special education during this time is often attributed to the
increased accessibility of special education and the revisions of IDEA, the number of
students placed in special education continues to rise. Parrish stated, “From 1988-89 to
1998-99, special education enrollments grew about twice as fast as those of all students
(33% versus 15% growth)” (pg. 7). Furthermore Parrish indicated that the special
education costs per student also appears to be rising. As I stated earlier, funding for
special education is provided through federal, state, and local funds. The federal funds
available for special education are not what were expected. “Congress has not lived up to
its commitment to fund up to 40% of the costs of educating students with disabilities”
(Smith, 2002, pg. 6). Furthermore the state share of special education funding decreased
(55% to 47%), and the burden on local funding sources increased (39% to 45%) (Parrish,
2001). Wisconsin’ Evaluation of Special Education Funding (1999) report cites rising
special education costs of nearly 37% between 1992-93 and 1997-98. With more
pressure on the local school system to provide funding for special education some
schools are reacting. “In California, a nearly $2 billion claim filed by school districts

Characteristics of Special Education 11
against the state for insufficiently funding special education was just settled” (Parrish,
2001, pg. 5). Other states are following suit. As the burden of funding for special
education is shifted to the local sources, in Wisconsin, the possibility of an increase in
local taxes to support the public schools seems to be a necessity. According to Burmaster
(2001), “the continuing affordability of maintaining two-thirds, the impact of revenue
caps, and the declining reimbursement rate of special education costs” the need for an
efficient referral process and delivery of services is a necessity (pg. 1).
Teacher Stress
As I previously described, special education teachers are intricately involved in
the referral and evaluation process of special education. The special education teacher
has a multi-faceted role including teaching special education students, case managing the
students on their case load, developing and following the IEP for each student, as well as
evaluating new special education referrals. The stress of general education teachers is
quite high and a concern for schools. Many schools have developed a teacher-mentoring
program to provide additional support to new teachers (Whitaker, 2000). Special
education teachers seem to be especially “at-risk” of stress and burnout. “Retaining
experienced and accomplished special education teachers continues to be on of the most
distressing issues our profession faces” (Embich, 2001, pg. 58). There is a growing
concern regarding the “critical staff shortages in special education” which has resulted in
“increased attention to the issues of recruitment and retention of qualified special
education teaching staff” (Cooley & Yovanoff, 1996, pg. 336). In 1993, Singer found
“10% of all special educators left teaching and revealed that the average special educator
abandoned education as a profession within 6 years of beginning teaching” (pg. #).

Characteristics of Special Education 12
Cooley & Yovanoff (1996) also noted that “work-related variables tend to be better
predictors of commitment and job satisfaction. . . examples include excessive paperwork
requirements, increasing caseloads, low salaries, lack of administrative support, role
conflict or ambiguity, challenging student behaviors, and lack of visible student progress”
(pg. 337-338). With the increase in the number of special education referrals an
increasing pressure is placed on special educators. The pressure to provide a multitude of
services in a demanding job with limited time available has resulted in less student
contact. “Eighty-seven percent of special educators reported that they did not have
enough time to spend with each individual student during the 1998-99 school year” (Russ
et. al., 2001, pg. 162). Thus finding ways to manage paperwork and work efficiently has
become increasingly important. According to Smith (2002), “the paperwork that is
currently required has become overwhelming, often to the point that its completion
impedes the provision of appropriate services to the students the law is intended to serve
and encourages special education teachers to leave the field” (pg. 6). It is increasingly
important that special education teachers are able to minimize time spent away from the
student and be available to serve the students. Stress due to poor job design is found
when the teacher’s belief about the job (i.e. working with students) is different from the
realities of the job (i.e. burdensome paperwork, extensive time spent in meetings, etc)
(Gersten, Keating, Yovanoff, & Harniss, 2001). The amount of time spent doing
paperwork and attending meeting often leads to a frustration of being unable to spend
time with the students. Thus referrals that do not result in a placement to special
education amplify the stress due to poor job design. “Teacher turnover has long been of
concern in both special education and general education because it represents instability

Characteristics of Special Education 13
in the teaching force and raises the prospect of shortages of qualified replacement
teachers” (Boe, Bobbitt, Cook, Whitener, & Weber 1997, pg. 390). With the increase in
accountability in the education field through the ESEA legislation, teacher stability and
regular teacher contact is of increased importance. Nichols & Sosnowsky, 2002,
suggested universities may consider designing a dual degree program in general and
special education. This may assist in preventing teacher turnover.
The laws surrounding special education provide a rigid framework which school
must provide services to all students with disabilities. The referral process is an
important piece in providing quality service to all students. It is important for schools to
develop an effective and efficient ways to refer students to their special education
program while providing a minimal disruption to the special education program itself.
Although there are factors affecting the placement of students in the special education
program it is important to provide a consistent program for all. By decreasing the stress
of teachers and providing an efficient referral process in which one can see results the
school will be able to provide a quality program through a cost effective process.

Characteristics of Special Education 14
CHAPTER III
Methodology
This study consisted of reviewing pre-existing data from initial referrals to the
special education program of a small northern Wisconsin school district. Furthermore the
data were assessed to determine the common characteristics of special education referrals
resulting in a placement to a special education program.
Procedure
Utilizing the information available on the Special Education referral form, the
researcher collected the data during the summer of 2002. The cumulative data were from
all initial special education referrals from the 2001-2002 school year. Data were
separated into categories and common characteristics of successful referrals were
identified. Likewise, common characteristics of unsuccessful referrals were identified.
The characteristics included in the data analysis were:
• Gender
• Type of the Referral, i.e. Speech and Language disability, Learning disability, etc
• Time of the referral (school year quarter)
• Grade level of the student at time of the referral (Elementary, Middle, or High)
• Source of the referral
Each initial referral was reviewed and tally marks were used to denote which
characteristics the referral contained.
Methodological Limitations
1. The data analysis included data from one school district and conclusions can only
be drawn for that school district.

Characteristics of Special Education 15
2. Data was utilized from one school year and may not represent trends over time.
3. The school population largely consists of Caucasian students with few minority
students.
4. A majority of the students live in families of low-income status.

Characteristics of Special Education 16
CHAPTER IV
Results
Descriptive Statistics
The data utilized for this study was collected via the Special Education referral
form of one small district in northern Wisconsin. The majority of the students in the
district were Caucasian with few minority students. Due to the low number of minority
students, in an attempt to protect confidentiality, ethnicity or race was not reported as a
category. The school was located in a very rural area of northern Wisconsin and a
majority of students come from low-income families.
During the 2001-2002 school year there were 42 referrals made to the Special
Education program. Of the 42 referrals, 86% (36) were successful referrals, while 14%
(6) were not placed in the Special Education program. Regarding the total referrals, 71%
(30) were male and 29% (12) were female (see figure 1). The students who were referred
for Special Education were referred for a total of seven different disability areas. The
referrals consisted of 45% (19) for Speech and Language Disability (SpL); 10% (4) for
Severe Developmental Delay (SDD); 17% (7) for Emotional Disturbance (ED); 22% (9)
for Learning Disability (LD); 2% (1) for Traumatic Brain Injury (TBI); 2% (1) for Other
Health Impairment (OHI); 2% (1) for Hearing Impairment (HI) (see figure 2).
The majority of the referrals (71% or 30 students) were initiated for Elementary
students (see figure 3). Of these 30 students, 67% (20) were males and 33% (10) were
females. Students referred from the Middle School comprised 22% (9) of the total
referrals. Of the Middle School students, 89% (8) were males and 11% (1) were females.

Characteristics of Special Education 17
The High School referred only 3 students, 67% (2) were males and 33% (1) were
females.
Data Analysis
The data was analyzed by determining the frequency of each designated
characteristic of special education initial referrals. There were a total of 42 special
education referrals made during the 2001-2002 school year. Of the 42 referrals, 86% (36)
referrals were successful referrals and resulted in placement to the special education
program. Therefore, 14% (6) referrals were unsuccessful referrals and did not result in
placement to the special education program. The criteria were established into five main
areas. Each area was then broken into categories of characteristics. The five areas and
categories of characteristics were as follows:
• Gender: male or female
• Type of Referral: Speech & Language Disability, Severe Developmental Delay,
Emotional Disturbance, Learning Disability, Traumatic Brain Injury, Other
Health Impairment, or Hearing Impairment (students were not referred under the
other disability categories)
• Grade Level: Elementary, Middle School, or High School
• Source of Referral: Guidance Counselor, Teacher, Parent, or Other Provider
• Time of Referral: Quarter 1, 2, 3 or 4 (School year quarter)
More males than females comprised the successful referral group; 72% (26) were
male, while only 28% (10) of the successful referrals were female (see figure 1). This
reflects a fair representation of the total sample overall; 71% (30) of the total referrals to

Characteristics of Special Education 18
special education were males. Of the students that did not qualify for special education
67% (4) were male while 33% (2) were female.
Regarding the Type of Referral the most frequent characteristic was Speech and
Language Disability. Overall Speech and Language Disability was the most referred area
of disability. Of 42 total referrals, 19 (45%) of the referrals were for a Speech and
Language Disability. Of the successful referrals, 47% (17) were placed into the Speech
and Language program, while only 2 students (33%) did not qualify for the Speech and
Language program. All students referred for Emotional Disturbance were placed into the
special education program and they made up 19% (7) of the successful referrals. The
largest discrepancy of students placed versus not placed occurred in the Learning
Disabilities category. Students referred for a Learning Disability made up 17% (6) of the
successful referrals to special education, but the concerning factor is that students
referred for a learning disability made up 50% (3) of the students that did not qualify for
special education (see figure 2).
A large majority of the referrals, 71% (30 students) came from the Elementary level
grades. Of the students referred from the Elementary level 67% (24) of the students were
placed into the special education program. In this study, all students who did not qualify
for special education were from the Elementary level (100%) (see figure 3).
Teachers were the main source of referrals for special education (43%); although
parents often requested a referral as well (36%). These percentages were consistent with
both successful and unsuccessful referrals. Of the successful referrals 42% (15) were
from teachers while 36% (13) were from parents. Regarding the unsuccessful referrals;
50% (3) were from teachers and 33% (2) were from parents (see figure 4).

Characteristics of Special Education 19
The majority of the referrals occurred during the first quarter of the school year (45%
or 19 referrals). The quarter with the least amount of referrals was the fourth quarter with
only 10% (4) of the referrals occurring during this time. Of the successful special
education referrals, 42% (15) occurred during the first quarter while 67% (4) of the
unsuccessful referrals occurred during this time (see figure 5).
Summary Statement
This chapter focused on the presentation of the data collected from the referral
forms of students referred to special education. The research findings revealed of the 42
initial referrals 86% (36) were successful and 14% (6) were unsuccessful. Furthermore
more males were referred for special education than females. Likewise more males were
placed into the special education program than females. The majority of the special
education referrals were for a Speech and Language Disability. The referrals for
Emotional Disturbance were the most successful and resulted in all students referred for
Emotional Disturbance being placed in the special education program. The least
successful area of referral was a student referred for a Learning Disability. Although 17
% (6) of the successful referrals were referred for a Learning Disability, 50% (3) of the
unsuccessful referrals were referred for a Learning Disability.
Teachers made a majority of the initial referrals during the first quarter of the
school year. Furthermore a majority (71% or 30 students) of the referrals were for
students in the Elementary grades.

Characteristics of Special Education 20
CHAPTER V
Discussion
Introduction
This chapter will discuss the conclusions drawn from the data results and the
recommendations made from the conclusions.
Discussion
The school district evaluated for this study was concerned about the number of
referrals made to the Special Education program which did not result in placement to
Special Education (unsuccessful referrals). During the previous school year (2000-2001)
60% of the students referred for Special Education were placed into the Special
Education program (Special Education report for the school, 2001). This study revealed
that a majority of the referrals (86%) made to Special Education for the 2001-2002 school
year resulted in placement.
This study revealed that a majority of the referrals, as well as the placements to Special
Education, were male students. This is consistent with other research findings.
According to Wehmeyer and Schwartz (2001), in their study to examine the proportion of
males and females admitted to special education services, males accounted for two-thirds
of their total sample. Likewise MacMillan et. al., (1996), in there comparison of students
nominated for pre-referral interventions, found an overrepresentation of males among
students who are at risk for or who are found to have a disability.
Furthermore Del’Homme et. al., (1996), reflected “that boys were referred more
often than girls to student study teams and particularly for behavioral problems” (pg.
272). This study revealed that all of the students referred for Emotional Disturbance

Characteristics of Special Education 21
100% (7) were males. Although the research indicates that boys are referred for
behavioral problems more often than girls, this may be an area for additional research.
Are girls being over looked in the referral process? Another explanation could be that
due to the small sample size there were no girls with Emotional Disturbance in need of
identification.
According MacMillan, et. al. (1996), the regular education teacher’s decision to
refer a child is the single most important decision that is made in the assignment of
children with Learning Disability to special education programs. Furthermore
Ysselddyke (2001), stated that the “referral and entitlement decisions were more heavily
influenced by. . .extent to which student behavior bothered teachers” (pg. 300). The data
from this study indicates that of the 18 students referred by teachers to the Special
Education program, 83% (15) were placed in Special Education and 17% (3) were not.
Therefore the data is consistent with the research. Although 50% (3) of the “unsuccessful
referrals” were made by teachers, this information may be misleading. Since only 6
students were not placed in the Special Education program the small number will inflate
when converted to a percentage. Although 50% of the “unsuccessful referrals” were
made by teachers, it consisted of only 3 referrals made by teachers that did not result in
placement to the Special Education program.
Due to the pressure on schools to provide more of the Special Education funds
through local funding, schools are assessing the referral process to create efficient and
cost-effective referral processes (Parrish, 2001). Furthermore an efficient referral will
assist in the decrease of teacher stress and frustration. According to Cooley & Yavanoff
(1996), it is vital that schools work to recruit and retain qualified Special Education

Characteristics of Special Education 22
teaching staff. A large majority of Special Education staff cited they did not have time to
spend with individual students (Russ et. al., 2001). By establishing an efficient referral
process teachers will be able to minimize the time attending meetings and evaluations
and therefore will be able to spend more time with individual students.
This study provides the school with a foundation in which to assess the Special
Education programs efficiency and cost-effectiveness. By looking at the number of
referrals that result in placement to the Special Education program the school can assess
what facilitated these successful referrals. Furthermore by assessing the “unsuccessful
referrals” the school may look to areas of improvement to increase the efficiency and
effectiveness of the Special Education program. Additional teacher training regarding the
special education referral process and the criteria for qualifying a student for special
education may assist in decreasing the number of unsuccessful referrals. Likewise older/
more skilled teachers may be more likely to provide a successful referral.
Conclusions and Recommendations
The objectives of this study were to determine the common characteristics of
successful referrals to special education and the common characteristics of unsuccessful
referrals to special education. The most common characteristic of referrals to special
education was that a majority of the referrals were male. The research indicates males
are referred more often the females, although this may not be surprising the number of
males referred for special education were quite high (71%). This was consistent in both
successful and unsuccessful referrals, although the number of females in the unsuccessful
referrals was slightly higher (33%).

Characteristics of Special Education 23
Students referred for Emotional Disturbance (100%) or Speech and Language
Disability (89%) were most likely to be placed into the special education program. While
one-third (33%) of the students referred for a Learning Disability did not qualify for
special education.
A majority of the referrals were made of students in the Elementary grades and
their teachers made a majority of the referrals during the first quarter. Parents in this
study comprised a significant number of referrals (36%). This indicates that parents are
becoming more aware of and involved in the special education placement process.
Furthermore parents are reminded that “you (parents) are your child’s best advocate”
(Pierangelo & Jacoby, 1996, pg. 44).
This study gives the school a snapshot of a year of special education referrals. It
raises some interesting questions that the school district may wish to pursue in the future.
The questions that this district and others may want to explore further:
• Are there differential methods for identifying males versus females for special
education?
• What training opportunities should be made to increase understanding regarding
Learning Disabilities?
• What training opportunities should be made to increase understanding regarding
Speech and Language Disability?
• What developmental differences might account for the unsuccessful referrals at
the elementary level?
• What were the success rates of last year? Are they consistent?

Characteristics of Special Education 24
Although this study provides only a glimpse of the special education program, it
provides the school with a good foundation to start an evaluation of the special education
referral process.

Characteristics of Special Education 25
References
Audette, B. & Algozzine, B. (1997). Re-inventing government? Let’s re-invent special
education. Journal of Learning Disabilities, 30, 378-383.
Boe, E., Bobbitt, S., Cook, L., Whitener, S., & Weber, A., (1997). Why didst thou go?
Predictors of retention, transfer, and attrition of special and general education
teachers from a national perspective. Journal of Special Education, 30(4), 390-
411.
Cooley, E. & Yovanoff, P. (1996). Supporting professionals at-risk: Evaluating
interventions to reduce burnout and improve retention of special educators.
Exceptional Children, 62(4), 336-355.
D’Arienzo, R., Moracco, J., & Krajewski, R. (1982). Stress in teaching: A comparison of
perceived occupational stress factors between special education and regular
education teachers. Washington, D.C.: University Press of America, Inc.
deBettencourt, L. (2002). Understanding the differences between IDEA and section 504.
Teaching Exceptional Children, 34(3), 16-23.
Del’Homme, M., Kasari, C., Forness, S., & Bagley, R. (1996). Prereferral intervention
and students at-risk for emotional and behavioral disorders. Education and
Treatment of Children, 19, 272-285.
Embich, J. (2001). The relationship of secondary special education teachers’ roles and
factors that lead to professional burnout. Teacher Education and Special
Education, 24(1) 58-69.
Federal Register, (1999). Assistance to States for the education of children with
disabilities and the early intervention program for infants and toddlers with

Characteristics of Special Education 26
disabilities; Final regulations, Department of Education, 34 CFR Parts 300 and
303.
Gersten, R., Keating, T., Yovanoff, P., & Harniss, M. (2001). Working in special
education: Factors that enhance special educators’ intent to stay. Exceptional
Children, 67(4) 549-567.
MacMilan, D., Gresham, F., Bocian, K., & Siperstein, G. (1997). The role of assessment
in qualifying student as eligible for special education: What is and what’s
supposed to be. Focus on Exceptional Children, 30, 1-18.
MacMilan, D., Gresham, F., Lopez, M., & Bocian K. (1996). Comparison of student
nominated for prereferral interventions by ethnicity and gender. Journal of Special
Education, 30, 133-151.
Miller, M., Brownell, M., & Smith, S. (1999). Factors that predict teachers staying in,
leaving, or transferring from the special education classroom. Exceptional
Children, 65(2), 201-218.
Nichols, A. & Sosnowsky, F. (2002). Burnout among special education teachers in self-
contained cross-categorical classrooms. Teacher Education and Special
Education, 25(1), 71-86.
Parrish, T. (2001). Who’s paying the rising cost of special education? Journal of Special
Education Leadership, 14(1), 4-12.
Pierangelo, R & Jacoby, R. (1996). Parents’ complete special education guide: Tips,
techniques, and materials for helping your child succeed in school and life. New
York: Center for Applied Research in Education.

Characteristics of Special Education 27
Public Law 94-142 of 1997. The individuals with disabilities education act amendments
of 1997. Statue info..
Russ, S., Chiang, B., Rylance, B., & Bongers, J. (2001). Caseload in special education:
An intergration of research findings. Exceptional Children, 67(2), 161-172.
Smith, T. (2002). IDEA: Time for some changes. Principal Leadership, 2(8), 6-9.
Singer, J. (1993). Are special educators’ career paths special? Results from a 13-year
longitudinal study. Exceptional Children, 59, 262-279.
Telzrow, C. (1999). IDEA amendments of 1997: Promise or pitfall for special education
reform? Journal of School Psychology, 37(1), 7-28.
Wehmeyer, M. & Schwartz, M. (2001). Disproportionate representation of males in
special education services: Biology, behavior, or bias? Education and Treatment
of Children, 24(1), 28-45.
Whitaker, S. (2000). What do first-year special education teachers need? Teaching
Exceptional Children, 33(1), 28-37.
Wisconsin Department of Public Instruction. (2002). A report from the community
dialogues on investing in quality education 2002. Retrieved June 19, 2002 from
the World Wide Web: http:// www.dpi.state.wi.us/dpi/sprntdnt/dialogue.html.
Ysseldyke, J. (2001). Reflections on a research career: Generalizations from 25 years of
research on assessment and instructional decision making. Exceptional Children,
67(3), 295-309.

Figure 1
Gender
71%
29%
MalesFemales
• Percentage of males and females of the total number of referrals to special education
Gender
72%
28%
MalesFemales
• Percentage of males and females of the successful referrals to special education
Gender
67%
33%MalesFemales
• Percentage of males and females of the unsuccessful referrals to special education

Figure 2
Type of Referral
45%
10%17%
22%2%2%2%
SpLSDDEDLDTBIOHIHI
• Percentages of type of referral of the total referrals to special education
Type of Referral
47%
8%19%
17%3%3% 3%
SpLSDDEDLDTBIOHIHI
• Percentages of type of referral of the successful referrals to special education
Type of Referral
33%
17%0%
50%
0%0%0%SpLSDDEDLDTBIOHIHI
• Percentages of type of referral of the unsuccessful referrals to special education

Figure 3
Level of Student
71%
22%7%
ElemMSHS
• Percentage of the level of the students of the total referrals
Level of Student
67%
25%
8%
ElemMSHS
• Percentage of the level of the students of the successful referrals
Level of Student
100%
0%0%
ElemMSHS
• Percentage of the level of the students of the unsuccessful referrals

Figure 4
Source of Referral
7%
43%36%
14%CounselorTeacherParentOther
• Percentage of total referrals by source of the referral
Source of Referral
8%
42%36%
14%CounselorTeacherParentOther
• Percentage of successful referrals by source of the referral
Source of Referral
0%
50%33%
17%CounselorTeacherParentOther
• Percentage of unsuccessful referrals by source of the referral

Figure 5
School Quarter of Referral
45%
21%
24%
10%1st2nd3rd4th
• Percentage of total referrals by school year quarter
School Quarter of Referral
42%
25%
22%
11%1st2nd3rd4th
• Percentage of successful referrals by school year quarter
School Quarter of Referral
67%0%
33%0%
1st2nd3rd4th
• Percentage of unsuccessful referrals by school year quarter
Recommended