June 2021
Project Report No. 634
Combining agronomy, variety and chemistry to maintain
control of septoria tritici in wheat
Morgan C.1, Wright P.1 Blake J.1, Corkley, I.2, Knight S.3, and Burnett F.4
1 ADAS Rosemaund, Preston Wynne, Hereford, HR1 3PG.
2ADAS Wolverhampton, Titan 1 Offices, Coxwell Avenue, Wolverhampton, WV10 9RT. 3 NIAB, 93 Lawrence Weaver Road, Cambridge, CB3 0LE. 4 SRUC, Peter Wilson Building, West Mains Road, Edinburgh, EH9 3JG.
This is the final report of a 68-month project (21120007) that started in August 2015. The work was funded by BASF and a contract for £196,026 from AHDB.
While the Agriculture and Horticulture Development Board seeks to ensure that the information contained within this document is
accurate at the time of printing, no warranty is given in respect thereof and, to the maximum extent permitted by law, the Agriculture and
Horticulture Development Board accepts no liability for loss, damage or injury howsoever caused (including that caused by negligence)
or suffered directly or indirectly in relation to information and opinions contained in or omitted from this document.
Reference herein to trade names and proprietary products without stating that they are protected does not imply that they may be
regarded as unprotected and thus free for general use. No endorsement of named products is intended, nor is any criticism implied of
other alternative, but unnamed, products.
AHDB Cereals & Oilseeds is a part of the Agriculture and Horticulture Development Board (AHDB).


CONTENTS
1. ABSTRACT ....................................................................................................................... 1
2. INTRODUCTION ............................................................................................................... 2
3. MATERIALS AND METHODS .......................................................................................... 3
3.1. Field trials ............................................................................................................. 3
3.1.1. Site selection and establishment...................................................................... 3
3.1.2. Experiment design ........................................................................................... 4
3.1.3. Sowing date ..................................................................................................... 4
3.1.4. Seed rate ......................................................................................................... 5
3.1.5. Variety ............................................................................................................. 5
3.1.6. Fungicide treatments ....................................................................................... 6
3.1.7. Assessments ................................................................................................... 6
3.2. Weather data ......................................................................................................... 7
3.3. Data handling ........................................................................................................ 7
3.4. Analysis ................................................................................................................ 7
3.4.1. Individual site and season analysis .................................................................. 7
3.4.2. Combining results from different sites and seasons ......................................... 8
3.4.3. Effect of weather and severity on yield response to fungicide application ........ 8
3.4.4. Adjusting the resistance rating by sowing date ................................................ 9
4. RESULTS ........................................................................................................................ 11
4.1. Effect of weather and severity on yield response to fungicide application ... 11
4.2. Analysis by Season ............................................................................................ 18
4.2.1. 2016 season .................................................................................................. 18
4.2.2. 2017 season .................................................................................................. 25
4.2.3. 2018 season .................................................................................................. 33
4.2.4. 2019 season .................................................................................................. 40
4.2.5. 2020 season .................................................................................................. 46
4.3. Analysis across all sites and seasons .............................................................. 52
4.3.1. T2 + 2-3 weeks disease assessment ............................................................. 52
4.3.2. T2 + 6-8 weeks disease assessment ............................................................. 54

4.3.3. Yield .............................................................................................................. 56
4.3.4. Output............................................................................................................ 59
4.4. Analysis by disease pressure ........................................................................... 60
4.4.1. Low disease pressure sites ............................................................................ 63
4.4.2. Medium disease pressure sites ..................................................................... 68
4.4.3. High disease pressure ................................................................................... 73
4.5. Impact of seed rate ............................................................................................. 78
4.6. How does sowing date affect resistance ratings? ........................................... 80
5. DISCUSSION .................................................................................................................. 82
5.1. Site ...................................................................................................................... 82
5.2. Variety ................................................................................................................. 82
5.3. Fungicides and interactions with Variety ......................................................... 84
5.4. Sowing date ........................................................................................................ 85
5.5. Seed rate ............................................................................................................. 87
6. CONCLUSION ................................................................................................................. 88
7. REFERENCES ................................................................................................................ 89
8. APPENDIX ...................................................................................................................... 91
1
1. Abstract
Septoria leaf blotch (Zymoseptoria tritici) is one of the most damaging diseases on winter wheat in
the UK. It is estimated to cause annual yield losses worth between £110–£220m, despite fungicide
applications (Fones et al. 2015). The chemical control of this pathogen is becoming increasingly
difficult because of the loss of active ingredients, tighter legislation on pesticide use and the
development of fungicide resistance. As a result, the control of septoria can sometimes be poor,
despite a significant spend on fungicides. The use of cultural control measures, as part of an
integrated pest management (IPM) strategy, is important to maintain control of this disease.
This project investigated the impact of four factors on the severity of septoria and final yields:
sowing date, seed rate, variety and fungicide. The work involved 25 field trials, conducted across
five harvest years (2016–20). The project aimed to determine the value of agronomic factors and
establish the extent to which fungicide use can be adjusted when using cultural control strategies.
Earlier sowings consistently resulted in higher disease severity during the main yield-forming
period than later sowings. This is most likely due to crops being exposed to spores earlier in the
season. Variety and fungicide also had a significant effect on septoria severity, with a clear
interaction between the two. The yield response to fungicides was much smaller in more resistant
varieties, compared to susceptible varieties. Higher seed rates, and, therefore, thicker crops, can
lead to greater disease severity. However, the effect was small and inconsistent across trials.
It is concluded that growers should tailor their fungicide strategy to variety and sowing date to
better optimise the use of fungicides. By sowing varieties with stronger disease resistance later in
the autumn, there may be considerable scope to reduce the risk of a damaging septoria epidemic –
enabling the use of lower fungicide inputs. This report includes a measure of the extent to which
varietal susceptibility to septoria may be increased or decreased with earlier or later sowing,
respectively.
2
2. Introduction
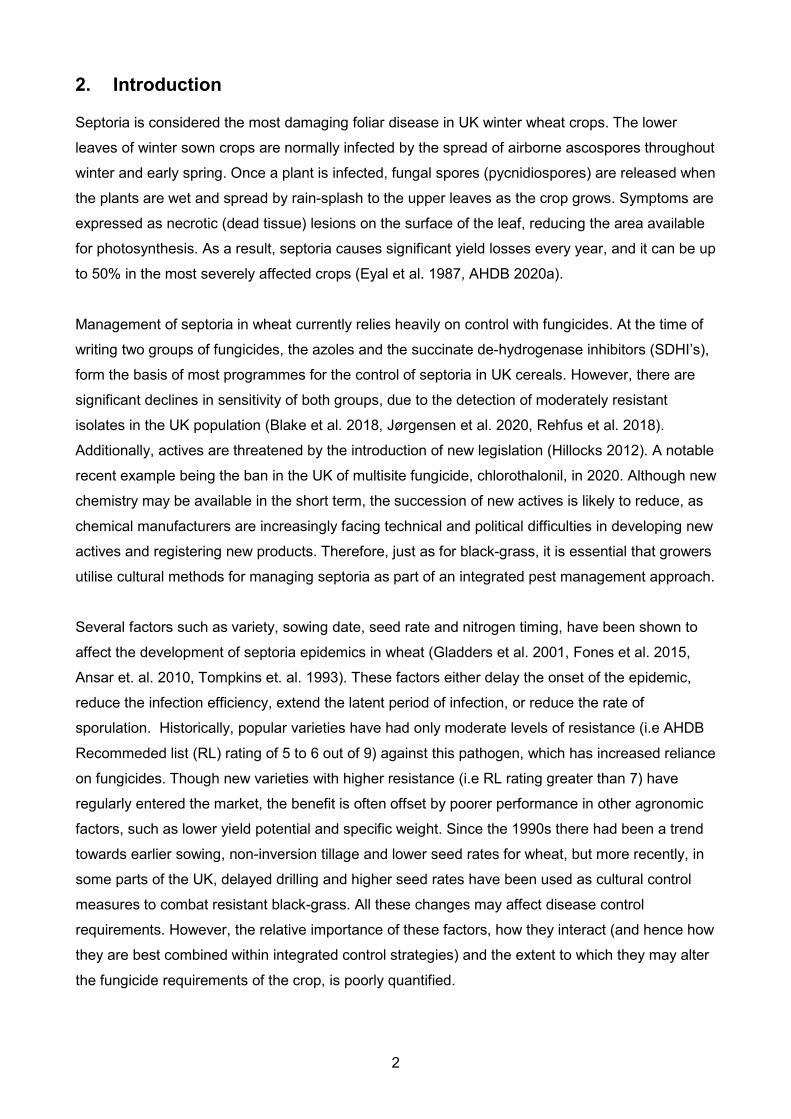
Septoria is considered the most damaging foliar disease in UK winter wheat crops. The lower
leaves of winter sown crops are normally infected by the spread of airborne ascospores throughout
winter and early spring. Once a plant is infected, fungal spores (pycnidiospores) are released when
the plants are wet and spread by rain-splash to the upper leaves as the crop grows. Symptoms are
expressed as necrotic (dead tissue) lesions on the surface of the leaf, reducing the area available
for photosynthesis. As a result, septoria causes significant yield losses every year, and it can be up
to 50% in the most severely affected crops (Eyal et al. 1987, AHDB 2020a).
Management of septoria in wheat currently relies heavily on control with fungicides. At the time of
writing two groups of fungicides, the azoles and the succinate de-hydrogenase inhibitors (SDHI’s),
form the basis of most programmes for the control of septoria in UK cereals. However, there are
significant declines in sensitivity of both groups, due to the detection of moderately resistant
isolates in the UK population (Blake et al. 2018, Jørgensen et al. 2020, Rehfus et al. 2018).
Additionally, actives are threatened by the introduction of new legislation (Hillocks 2012). A notable
recent example being the ban in the UK of multisite fungicide, chlorothalonil, in 2020. Although new
chemistry may be available in the short term, the succession of new actives is likely to reduce, as
chemical manufacturers are increasingly facing technical and political difficulties in developing new
actives and registering new products. Therefore, just as for black-grass, it is essential that growers
utilise cultural methods for managing septoria as part of an integrated pest management approach.
Several factors such as variety, sowing date, seed rate and nitrogen timing, have been shown to
affect the development of septoria epidemics in wheat (Gladders et al. 2001, Fones et al. 2015,
Ansar et. al. 2010, Tompkins et. al. 1993). These factors either delay the onset of the epidemic,
reduce the infection efficiency, extend the latent period of infection, or reduce the rate of
sporulation. Historically, popular varieties have had only moderate levels of resistance (i.e AHDB
Recommeded list (RL) rating of 5 to 6 out of 9) against this pathogen, which has increased reliance
on fungicides. Though new varieties with higher resistance (i.e RL rating greater than 7) have
regularly entered the market, the benefit is often offset by poorer performance in other agronomic
factors, such as lower yield potential and specific weight. Since the 1990s there had been a trend
towards earlier sowing, non-inversion tillage and lower seed rates for wheat, but more recently, in
some parts of the UK, delayed drilling and higher seed rates have been used as cultural control
measures to combat resistant black-grass. All these changes may affect disease control
requirements. However, the relative importance of these factors, how they interact (and hence how
they are best combined within integrated control strategies) and the extent to which they may alter
the fungicide requirements of the crop, is poorly quantified.

3
This report looks at the value of cultural control measures as part of an integrated disease
management programme, using data collected from 25 sites (UK and Ireland) across 5 growing
seasons (2016-2020). Sowing date, seed rate, and variety choice were investigated for their
potential to reduce the intensity of fungicide required, whilst minimising yield losses to septoria and
maximising financial return for growers. It aims to provide reassurance on the scenarios where
septoria risk is reduced and there is scope to reduce fungicide inputs.
3. Materials and methods
3.1. Field trials
3.1.1. Site selection and establishment
The experiments were conducted over five harvest years (2016 – 2020) across the UK and Ireland
to test how agronomy, variety and chemistry effect the control of septoria. These sites were chosen
to give a good range of high to low disease pressure in which to test the different agronomic
factors. For years 2016 – 2018, sowing date, seed rate, variety and fungicide programme were
varied at each site. Seed rate was not included for years 2019 and 2020 (Table 1).
Each of the trial sites had at least a one year break from cereals to minimise the risk of take-all
increasing variability across the trial plots or interfering with fungicide yield responses. The plot
size in each trial was a minimum of 20m2, and good farm practice was followed for all inputs (with
the exception of fungicides) to ensure, as far as possible, that the trials were not affected by factors
other than septoria pressure.
In 2019 and 2020 the site at ADAS Rosemaund was irrigated to increase disease pressure.
Irrigation was applied once a week from mid-May onwards, unless there were two rainfall events
with greater than 5mm in the prior week (under these circumstances supplementary irrigation was
considered unnecessary). At each irrigation event approximately 5mm of water was applied evenly
across all plots. All sites relied on natural disease infection.

4
Table 1: Trial site numbers, locations, harvest years and agronomic factors investigated
Agronomic Factors Investigated Site
Number Host Location
Harvest Year
Sowing Date
Seed Rate
Variety Fungicide Program
1 ADAS Rosemaund, Herefordshire 2016
2 ADAS Terrington, Norfolk 2016
3 NIAB Sutton Scotney, Hampshire 2016
4 SRUC East Saltoun, East Lothian 2016
5 Teagasc Carlow, Ireland 2016
6 UCD Lyons, Co. Kildare, Ireland 2016
7 ADAS Rosemaund, Herefordshire 2017
8 ADAS Terrington, Norfolk 2017
9 NIAB Sutton Scotney, Hampshire 2017
10 SRUC East Saltoun, East Lothian 2017
11 Teagasc Carlow, Ireland 2017
12 UCD Lyons, Co. Kildare, Ireland 2017
13 ADAS Rosemaund, Herefordshire 2018
14 ADAS Terrington, Norfolk 2018
15 NIAB Sutton Scotney, Hampshire 2018
16 SRUC East Saltoun, East Lothian 2018
17 Teagasc Carlow, Ireland 2018
18 UCD Lyons, Co. Kildare, Ireland 2018
19 ADAS Rosemaund, Herefordshire 2019
20 NIAB Sutton Scotney, Hampshire 2019
21 SRUC East Saltoun, East Lothian 2019
22 Teagasc Carlow, Ireland 2019
23 ADAS Rosemaund, Herefordshire 2020
24 NIAB Sutton Scotney, Hampshire 2020
25 SRUC East Saltoun, East Lothian 2020
3.1.2. Experiment design
A randomised, split plot design incorporating standard randomisation of treatments within each
replication was used. The different sowing dates were sown in split plots, and seed rate, variety
and fungicide randomised within. Sites 1 – 18 incorporated 48 treatments with three replications.
Sites 19 – 25 incorporated 24 treatments with three replications.
3.1.3. Sowing date
Two sowing windows were used, broadly referred to as ‘early’ and ‘late’, early sowing targeted mid-
September and late sowing mid-October. Due to unsuitable ground conditions at the target timing
at some sites in some years, actual sowing dates range for the ‘early’ from the 3rd September to

5
the 7th October, averaging the 22nd September, and 7th October to the 6th November, averaging 20th
October for the ‘late’.
3.1.4. Seed rate
For sites 1 – 18, two seed rates were used, broadly referred to as ‘high’ and ‘low’. Seed rates were
determined in order to establish a target plant population. As establishment is affected by time of
sowing, seed rates were calculated prior to sowing using the equation:
Seed rate (kg/ha) = (Target plant population (m2) x TGW (g)) / (Establishment (%))
The target plant populations used were:
• Low seed rate, early sown – 80 plants/m2
• High seed rate, early sown – 160 plants/m2
• Low seed rate, late sown – 160 plants/m2
• High seed rate, late sown – 240 plants/m2
3.1.5. Variety
Three varieties were sown at each site with differing susceptibilities to septoria. These are referred
to as ‘susceptible’, ‘moderately susceptible’ and ‘moderately resistant’. Varieties were chosen and
their resistance scores recorded based on the AHDB Recommended List that would have been
available to growers at the time of sowing (Table 2). For example, for the 2020 harvest season, the
2019/20 Recommended List was used. Varieties were also chosen for their good resistance to
other, non-target diseases. The varieties used were changed during the project to reflect choices
relevant to growers and the changing recommendations.
Table 2: Varieties used at each site and their resistance rating to septoria
Site Susceptible
Variety Septoria Rating
Intermediate Variety
Septoria Rating
Moderately Resistant Variety
Septoria Rating
UK 2016 Santiago 4.4 JB Diego 5.3 Revelation 6.4
Ireland 2016 Cordiale 4.8 JB Diego 5.3 Rockefellar *
UK 2017 Santiago 4.4 JB Diego 5.3 Revelation 6.3
Ireland 2017 Cordiale 4.8 JB Diego 5.3 Rockefellar *
UK 2018 Santiago 4.3 JB Diego 5.2 Revelation 6.4
Ireland 2018 Cordiale 4.8 JB Diego 5.2 Rockefellar *
UK 2019 Santiago 4.3 Hardwicke 5.8 Graham 6.9
Ireland 2019 JB Diego 5.3 Costello** 6.4 Bennington ** 6.4
UK 2020 Elation 4.3 Elicit 6.0 Firefly 7.0 * A resistance score was not available for this variety.
** These varieties were awarded the same resistance ratings to septoria in the AHDB Recommended List 2018-2019 (UK data). In the
equivalent recommended list from the Department of Agriculture, Food and the Marine (Ireland data), Costello has a resistance score of
5 and Bennington a score of 6.

6
3.1.6. Fungicide treatments
Four levels of fungicide input were tested. These were referred to as ‘low’, ‘medium’ and ‘high’
input programmes, with an untreated that received no fungicides for the control of septoria
(azoxystrobin was applied alone at T0 for the control of rusts for experimental purposes. Note that
use alone is not appropriate for commercial practice). Products were carefully selected so that
higher input programmes involved additions to the lower input strategies. This minimised the risk of
changes in product or mode of action activity from invalidating the results. Products used were
substituted, when necessary, to reflect changes in product efficacy and regulation (Table 3). Where
this occurred, due consideration was given to ensure new programmes would provide similar levels
of efficacy, and additive inclusions between low, medium and high programmes, compared to
preceding strategies.
Fungicides were applied using handheld plot spraying equipment, with 200 – 300 kpa of pressure
to produce a medium spray quality. Sprays were applied at a rate of 200 l/ha.
Table 3: Fungicide programmes, rate presented in l/ha. CTL = Chlorothalonil. Note that Amistar (Azoxystrobin) should
always be used in a mixture with another product when applied commercially.
Year Treatment T0
(GS30) T1
(GS32) T2
(GS39) T3
(GS61-65)
2016
to
2018
Untreated Amistar 0.5 Untreated Untreated Untreated
Low Amistar Opti 1.0 CTL 1.0 CTL 1.0 Folicur 0.75
Medium Amistar Opti 1.0 Brutus 1.5 + CTL 1.0 Brutus 2.25 + CTL 1.5 Folicur 0.75
High Amistar Opti 1.0 Brutus 1.5 + CTL 1.0 + Imtrex 1.0 Brutus 2.25 + CTL 1.5 + Imtrex 1.5 Folicur 0.75
2019
Untreated Amistar 0.5 Untreated Untreated Untreated
Low Amistar Opti 1.0 CTL 1.0 CTL 1.0 Folicur 0.75
Medium Amistar Opti 1.0 Brutus 1.5 + CTL 1.0 Brutus 2.25 + CTL 1.5 Folicur 0.75
High Amistar Opti 1.0 Brutus 1.5 + CTL 1.0 + Imtrex 1.5 Brutus 2.25 + CTL 1.5 + Imtrex 2.0 Folicur 0.75
2020
Untreated Amistar 0.5 Untreated Untreated Untreated
Low Amistar 0.5 Sunorg Pro 0.5 + Phoenix 1.0 Sunorg Pro 0.6 + Phoenix 1.0 Folicur 0.75 Medium Amistar 0.5 Librax 0.8 + Phoenix 1.0 Librax 1.0 + Phoenix 1.5 Folicur 0.75
High Amistar 0.5 Revystar XE 1.0 + Phoenix 1.0 Revystar XE 1.25 + Phoenix 1.5 Folicur 0.75
3.1.7. Assessments
Assessments of foliar disease and green leaf area Foliar disease and green leaf area assessments were carried out at T2 + 3-4 weeks and at T2 + 6-
8 weeks on all plots. Ten tillers were assessed per plot. Tillers were randomly selected and assessed
by estimating the percentage of green area and the percentage of each leaf affected by disease
(including any necrosis and chlorosis associated with the disease).

7
Lodging Plots were assessed for lodging prior to harvest. The percent area affected was recorded if lodging
was present.
Yield and grain quality All plots were harvested using a plot combine. Grain samples were taken to determine moisture
content and for specific weight assessment. Yields were calculated at 85% dry matter. Specific
weight of grain was measured for each plot and adjusted to 85% dry matter.
3.2. Weather data
Daily minimum and maximum air temperatures and total rainfall were recorded at each trial site.
3.3. Data handling
Disease, green leaf area, yield and grain quality data were collected manually or directly onto
portable computers. All data were transferred to Microsoft Excel worksheets after collection.
3.4. Analysis
3.4.1. Individual site and season analysis
In all trials, disease, yield, and grain quality were summarised by analysis of variance. Data were
examined and a small number of individual plot values excluded where justified. For example,
where another non-target disease was recorded at greater than 10% severity on that leaf layer,
septoria data was excluded. Yield and specific weight data were also excluded in plots where crop
establishment was poor creating variable data.
Each season, results from all sites were combined to provide an across site mean for disease,
yield and specific weight and analysed using analysis of variance. Site was included as a factor to
show whether the effect was consistent across all sites. So that disease pressure at each site
could be compared, the same leaf was analysed, leaf 3 for the first assessment and leaf 2 for the
second assessment. These leaf layers were chosen as in most cases they had sufficient levels of
disease to show treatment differences and had not yet senesced. This approach was taken in
preference to averaging across several leaf layers which tended to dilute both the disease
pressure and differences between treatments.

8
3.4.2. Combining results from different sites and seasons
An analysis across all sites and seasons was also completed, and sites were additionally analysed
in groups by disease pressure. When analysing sites across years the data from the high seed
rates was used for sites 1 to 18 to create a balanced design.
3.4.3. Effect of weather and severity on yield response to fungicide application
Several studies have shown a correlation between weather patterns and disease severity
(Pietravalle et al. 2003, te Beest et al. 2009, Gladders et al. 2001). To explain the level of disease
experienced at each site, a number of weather variables, that have been identified as important
factors in disease severity models, were investigated with this data set (Table 4). As rainfall during
the spring and summer is known to be a key driver of septoria severity, total monthly rainfall for the
months of March, April, May and June were also included. For each site, the weather data was
summarised for each of the weather windows and correlated with the back transformed, logit
average of disease severity on leaves 1 and 2 at T2 + 6-8 weeks for the early sown, untreated
susceptible variety.
The likely yield losses due to disease severity can be estimated (King et al. 1983, Cook et al. 1991,
Milne et al., 2007, van den Bosch et al. 2020). Therefore, disease forecasting based on weather
patterns could be used by growers as a guide to the yield response expected from fungicide
applications, if disease prediction is sufficiently accurate (te Beest et al. 2013). To understand if
sowing date (early/late) and cultivar type (high/medium/low disease resistance) affect the
relationship of weather patterns with the yield response from fungicide application, the maximum
yield response for each cultivar type and sowing date combination was calculated as the difference
in mean yield between untreated plots and plots treated with the highest fungicide input, and
correlated against each of several weather variables (Table 4). In addition, yield response to
fungicide treatment at each site block was correlated with septoria severity data from untreated
plots (average logit severity on the top two leaves 6-8 weeks after T2) for each cultivar type,
sowing date and fungicide rate combination. Sites/blocks missing untreated severity or yield data
were excluded from this analysis by necessity.
9
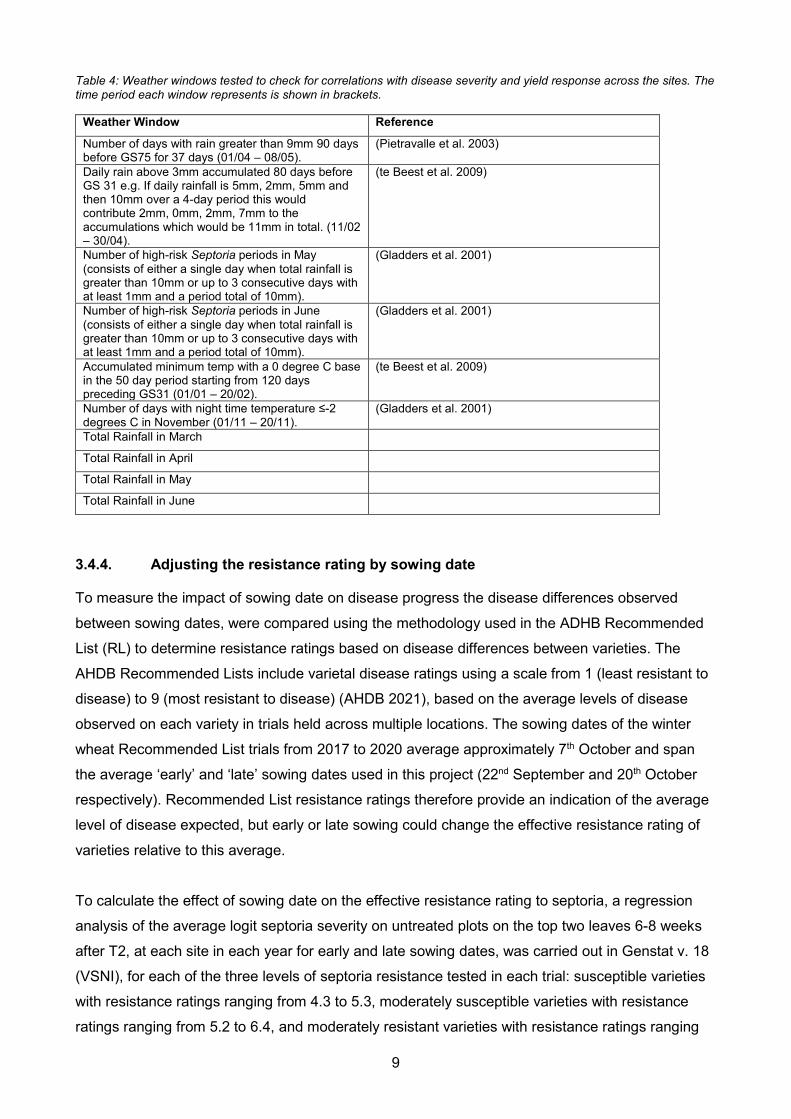
Table 4: Weather windows tested to check for correlations with disease severity and yield response across the sites. The time period each window represents is shown in brackets.
Weather Window Reference
Number of days with rain greater than 9mm 90 days before GS75 for 37 days (01/04 – 08/05).
(Pietravalle et al. 2003)
Daily rain above 3mm accumulated 80 days before GS 31 e.g. If daily rainfall is 5mm, 2mm, 5mm and then 10mm over a 4-day period this would contribute 2mm, 0mm, 2mm, 7mm to the accumulations which would be 11mm in total. (11/02 – 30/04).
(te Beest et al. 2009)
Number of high-risk Septoria periods in May (consists of either a single day when total rainfall is greater than 10mm or up to 3 consecutive days with at least 1mm and a period total of 10mm).
(Gladders et al. 2001)
Number of high-risk Septoria periods in June (consists of either a single day when total rainfall is greater than 10mm or up to 3 consecutive days with at least 1mm and a period total of 10mm).
(Gladders et al. 2001)
Accumulated minimum temp with a 0 degree C base in the 50 day period starting from 120 days preceding GS31 (01/01 – 20/02).
(te Beest et al. 2009)
Number of days with night time temperature ≤-2 degrees C in November (01/11 – 20/11).
(Gladders et al. 2001)
Total Rainfall in March
Total Rainfall in April
Total Rainfall in May
Total Rainfall in June
3.4.4. Adjusting the resistance rating by sowing date
To measure the impact of sowing date on disease progress the disease differences observed
between sowing dates, were compared using the methodology used in the ADHB Recommended
List (RL) to determine resistance ratings based on disease differences between varieties. The
AHDB Recommended Lists include varietal disease ratings using a scale from 1 (least resistant to
disease) to 9 (most resistant to disease) (AHDB 2021), based on the average levels of disease
observed on each variety in trials held across multiple locations. The sowing dates of the winter
wheat Recommended List trials from 2017 to 2020 average approximately 7th October and span
the average ‘early’ and ‘late’ sowing dates used in this project (22nd September and 20th October
respectively). Recommended List resistance ratings therefore provide an indication of the average
level of disease expected, but early or late sowing could change the effective resistance rating of
varieties relative to this average.
To calculate the effect of sowing date on the effective resistance rating to septoria, a regression
analysis of the average logit septoria severity on untreated plots on the top two leaves 6-8 weeks
after T2, at each site in each year for early and late sowing dates, was carried out in Genstat v. 18
(VSNI), for each of the three levels of septoria resistance tested in each trial: susceptible varieties
with resistance ratings ranging from 4.3 to 5.3, moderately susceptible varieties with resistance
ratings ranging from 5.2 to 6.4, and moderately resistant varieties with resistance ratings ranging

10
from 6 to 7 (the lower end of this range corresponding to trials that also used the lower end of the
range for moderately susceptible varieties). Data was excluded for any given variety at sites which
did not have reliable disease severity data for the early and late sowing dates, resulting in a total of
19 sites being included in this analysis. A statistical comparison of separate regression lines with
different slope and intercepts fitted for each level of resistance, parallel regression lines with the
same slope but different intercepts, and a single regression line for all three resistance levels was
carried out. In addition, the difference between average logit severity in early-sown and late-sown
crops was plotted against the numeric resistance rating value, to check if the average difference
varied with resistance rating.
To calculate adjusted septoria resistance ratings, it was assumed that the change in average logit
severity between early and late sown crops was distributed evenly over time, such that the logit
severity halfway between the values of logit severity for the early and late sown crops was
assumed to be comparable with the average values used to calculate the published resistance
ratings. For the observed range of early-sown logit severity values, the fitted regression equation
was used to calculate the corresponding average predicted logit severity for late-sown crops, and
the value mid-way between the early-sown and late-sown logit severity for comparison to
Recommended List resistance ratings. The logit severity values were back-transformed to severity
(%), then log-transformed using the formula y = log (severity + 1). The log severity was used to
calculate the adjusted resistance rating for early and late sown crops from the regression line
between log severity and AHDB resistance rating (Figure 1).

11
Figure 1: Example of method used to calculate adjusted septoria resistance ratings. The solid black line shows the rating line used to calculate the resistance rating based on the average log severity. For each given value of early-sown severity, the corresponding predicted values of late-sown and mid-way (original rating) were calculated, and the resistance rating corresponding to all three values predicted using the rating line.
4. Results
4.1. Effect of weather and severity on yield response to fungicide application
There were no significant correlations between any of the selected weather variables (Table 4) with
either disease severity or the yield response from fungicides for any of the sowing date and cultivar
combinations. This suggests there were not enough sites within this dataset that share a consistent
weather factor influencing disease levels.
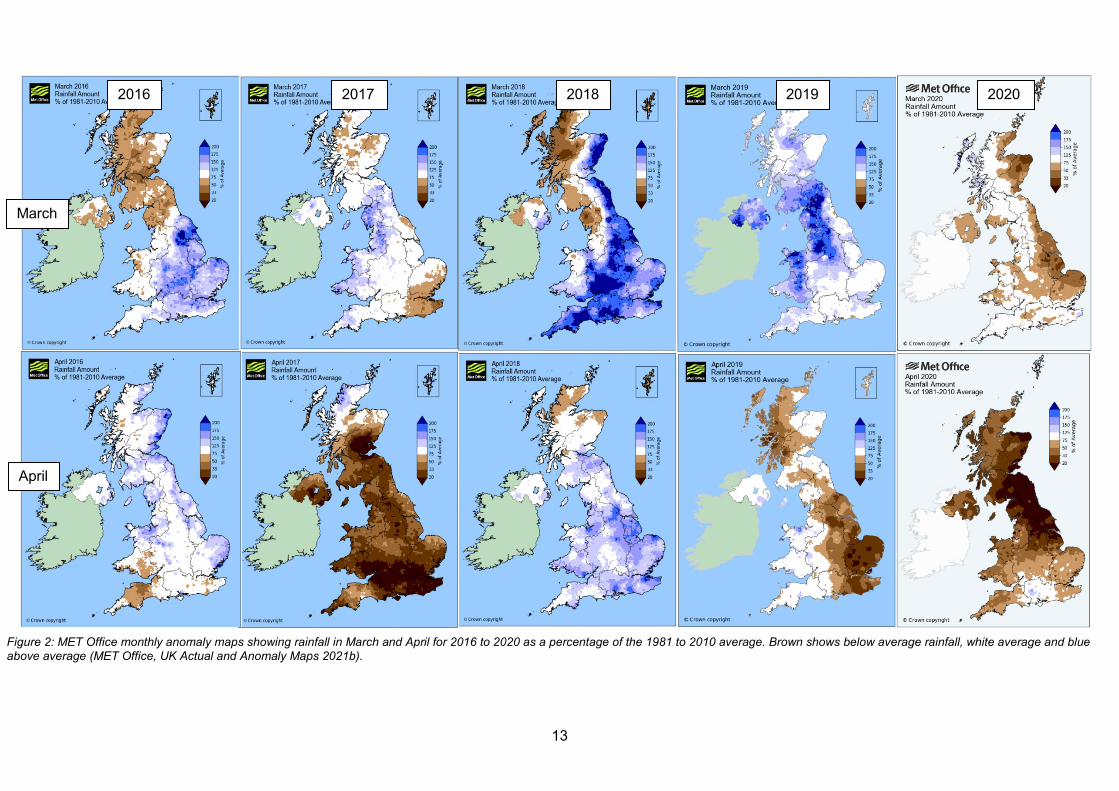
When looking at the rainfall patterns over the last 5 years this result is not surprising (Figure 2,
Figure 3). In March, the MET office anomaly maps show that there is some variation in the rainfall
across the 5 years, with 2018 being a particularly wet year and 2020 particularly dry. However,
rainfall in March may be too early to strongly influence final disease pressure. Rainfall in April also
showed some variation across seasons. However, 3 seasons (2017, 2019 and 2020) received

12
below average rainfall. 2016 was average and 2018 slightly higher than average. In May, all 5
seasons were very similar, receiving average or below average rainfall. May would be expected to
be the most influential month as rainfall during this period splashes septoria spores up the canopy
onto the top three, yield forming leaves. Rainfall in June shows the most variation, with above
average rainfall received in the South in 2016 and 2019, the North in 2017 and the west in 2020. In
comparison, 2018 was below average for most of the UK. However, rainfall in June can have a
limited impact on final disease levels as septoria spores take approximately 20 days from landing
on a leaf to producing symptoms. Therefore, any rainfall from mid-June onwards would not cause
symptoms until early July, by which time the crop is starting to senesce, especially on lighter land /
in England. Therefore, as May has been very similar over the course of this project our sites have
been influenced by either early rainfall in March and April or late rainfall in June and so there is no
common trend throughout.
There was weak correlation between septoria logit severity on untreated plots and fungicide yield
response (Figure 4, Figure 5, Figure 6). The correlation was stronger for early sown crops (R2
range 0.10 to 0.38) than late sown crops for which there was no correlation for most
fungicide/cultivar combinations (R2 range 0.01 to 0.20). For relatively susceptible and intermediate
cultivars, but not for resistant cultivars, the correlation for early sown crops between severity and
yield response was strongest for the high fungicide regime. The average yield response to
fungicides was higher for early sown crops than late sown crops.
13
2016 2019 2018 2017 2020
March
April
Figure 2: MET Office monthly anomaly maps showing rainfall in March and April for 2016 to 2020 as a percentage of the 1981 to 2010 average. Brown shows below average rainfall, white average and blue above average (MET Office, UK Actual and Anomaly Maps 2021b).

14
2016 2019 2018 2017 2020
May
June
Figure 3: MET Office monthly anomaly maps showing rainfall in May and June for 2016 to 2020 as a percentage of the 1981 to 2010 average. Brown shows below average rainfall, white average and blue above average (MET Office, UK Actual and Anomaly Maps 2021b).

15
Susceptible Varieties Fungicide Input High Medium Low
Sow
ing
Dat
e Ea
rly
Late
Figure 4: The correlation between septoria logit severity on untreated plots and fungicide yield response for each sowing date, fungicide combination in susceptible varieties.

16
Moderately Susceptible Varieties Fungicide Input High Medium Low
Sow
ing
Dat
e Ea
rly
Late
Figure 5: The correlation between septoria logit severity on untreated plots and fungicide yield response for each sowing date, fungicide combination in moderately susceptible varieties.

17
Moderately Resistant Varieties Fungicide Input High Medium Low
Sow
ing
Dat
e Ea
rly
Late
Figure 6: The correlation between septoria logit severity on untreated plots and fungicide yield response for each sowing date, fungicide combination in moderately resistant varieties.

18
4.2. Analysis by Season
Analysis of individual sites showed that seed rate was the least important factor affecting septoria
in this project. Seed rate effects were inconsistent across sites and seasons. Therefore, this
section will focus on the impact of sowing date, variety, and fungicide. The effects of seed rate are
discussed in section 4.5.
4.2.1. 2016 season
In 2016, rainfall was above average in March for the south of the UK, average for most of the UK in
April and May, and above average for the south of the UK in June (Figure 2, Figure 3).
T2 + 2-3 weeks disease assessment Of the 6 sites in 2016, site 3 had the highest disease pressure on leaf 3 at T2 + 2-3 weeks, with an
average septoria severity of 5.43% across all treatments. Site 4 had the lowest disease severity
with an average of 0.89%.
Table 5: Factors and interactions found to be statistically significant (P<0.05) by analysis of variance for septoria severity on leaf 3 at T2 + 2-3 weeks in 2016.
Factor P Value Site <.001
Variety <.001
Fungicide <.001
Site.Variety <.001
Site.Fungicide <.001
Sowing.Fungicide <.001
Variety.Fungicide <.001
Site.Sowing.Variety 0.005
Site.Sowing.Fungicide <.001
Site.Variety.Fungicide <.001
Site.Sowing.Variety.Fungicide <.001
In addition to site differences, variety and fungicide were also found to be significant factors
affecting septoria (Table 5). There were significant differences in disease pressure between each
variety group, reflecting disease resistance ratings with the highest disease severity being
observed in the most susceptible variety and the lowest in the most resistant (Table 6).
A significant interaction between variety and fungicide indicates that the response to fungicide
differed by variety (Table 5). This was partly due to varietal differences in disease severity in the
untreated. On average, there was no significant disease control benefit from applying more than a
medium input fungicide programme in the susceptible and moderately susceptible varieties. In the
moderately resistant varieties, there was no further benefit from applying more than a low input
programme (Table 6). However, it should be noted that the significant interaction between site,

19
variety and fungicide suggests that the relationship between variety and fungicide was not
consistent across sites, most likely due to the differences in the level of disease at each site
(Appendix 1).
Table 6: Average septoria severity (%) on leaf 3 at T2 + 2-3 weeks for the variety and fungicide interaction in 2016, across sites 1 to 6.
Fungicide Variety Untreated Low Medium High Average
Susceptible 8.45 3.73 1.74 1.13 3.76 Moderately Susceptible 5.96 2.56 1.26 1.43 2.80
Moderately Resistant 2.63 0.90 0.88 0.46 1.22
Average 5.68 2.4 1.3 1.01 Variety Fungicide Var.Fung. P Value <.001 <.001 <.001 LSD 0.469 0.541 0.937
The interaction between sowing date, variety and fungicide was not found to be statistically
significant, suggesting that the relationship between variety and fungicide was consistent across
sowing dates. However, it is clear that delaying sowing from mid-September to mid-October
reduced the level of disease in the untreated of each variety so that a susceptible variety sown in
mid-October was comparable to a moderately susceptible variety sown mid-September (Figure 7).
Figure 7: Average septoria severity (%) on leaf 3 at T2 + 2-3 weeks, for the interaction of sowing date, variety and fungicide in 2016 across sites 1 to 6. Error bars show the LSD for the interaction between variety and fungicide.
0
2
4
6
8
10
12
Susceptible ModeratelySusceptible
ModeratelyResistant
Susceptible ModeratelySusceptible
ModeratelyResistant
Mid September Sown Mid October Sown
% L
eaf a
rea
affe
cted
by
sept
oria
on
leaf
3
Untreated Low Medium High

20
T2 + 6-8 weeks disease assessment At T2 + 6 to 8 weeks, differences between sites were present with septoria severity at this time
ranging from 2.77% at site 2 to 22.71% at site 6.
Table 7: Factors and interactions found to be statistically significant (P<0.05) by analysis of variance for septoria severity on leaf 2 at T2 + 6-8 weeks in 2016.
Factor P Value Site <.001
Variety <.001
Fungicide <.001
Site.Variety <.001
Site.Fungicide <.001
Variety.Fungicide <.001
Site.Sowing.Variety 0.041
Sowing.Seed Rate.Variety <.001
Site.Sowing.Fungicide <.001
Site.Variety.Fungicide <.001
Site.Sowing.Seed Rate.Variety 0.014
Variety and fungicide were also found to be significant factors affecting septoria at this time (Table
7). The different varieties showed significant differences between each variety group, reflecting
disease resistance ratings as at the earlier assessment (Table 8).
The interaction between variety and fungicide was also found to be statistically significant (Table
7). These results indicate that, on average, there was a significant benefit in disease control from
applying the high input programme in the susceptible varieties, but that there was no significant
benefit in applying more than a medium input programme for the moderately susceptible varieties
and low input programme in the moderately resistant varieties (Table 8). However, as at the earlier
assessment a significant interaction between site, variety and fungicide suggests that the
relationship between variety and fungicide was not consistent across sites (Appendix 2). Table 8: Average septoria severity (%) on leaf 2 at T2 + 6-8 weeks for the variety and fungicide interaction in 2016, across sites 1 to 6.
Fungicide Variety Untreated Low Medium High Average
Susceptible 31.73 15.04 7.57 4.26 14.65 Moderately Susceptible 24.38 12.46 6.25 4.78 11.97
Moderately Resistant 12.56 4.52 2.90 3.07 5.76
Average 22.89 10.67 5.57 4.03 Variety Fungicide Var.Fung. P Value <.001 <.001 <.001 LSD 1.445 1.669 2.89

21
The interaction between sowing date, variety and fungicide was not found to be statistically
significant, suggesting in 2016 that the relationship between variety and fungicide was consistent
across sowing dates (Figure 8).
Figure 8: Average septoria severity (%) on leaf 2 at T2 + 6-8 weeks, for the interaction of sowing date, variety and fungicide in 2016, across sites 1 to 6. Error bars show the LSD for the interaction between variety and fungicide.
Yield The impact of strategies was evaluated on yield based on data from 4 sites. Sites varied
significantly with site 1 achieving the highest yield with an average of 10.34t/ha. Site 2 was the
lowest yielding with an average of only 5.06t/ha.
0
5
10
15
20
25
30
35
40
Susceptible ModeratelySusceptible
ModeratelyResistant
Susceptible ModeratelySusceptible
ModeratelyResistant
Mid September Sown Mid October Sown
% L
eaf a
rea
affe
cted
by
sept
oria
on
leaf
2
Untreated Low Medium High

22
Table 9: Factors and interactions found to be statistically significant (P<0.05) by analysis of variance for yield in 2016.
Factor P Value
Site <.001
Sowing <.001
Seed Rate <.001
Variety <.001
Fungicide <.001
Site.Seed Rate 0.025
Sowing.Seed Rate <.001
Site.Variety <.001
Site.Fungicide 0.01
Variety.Fungicide <.001
Site.Sowing.Variety <.001
Site.Seed Rate.Variety 0.003
Sowing.Seed Rate.Fungicide 0.039
Site.Variety.Fungicide <.001
Site.Sowing.Seed Rate.Fungicide <.001
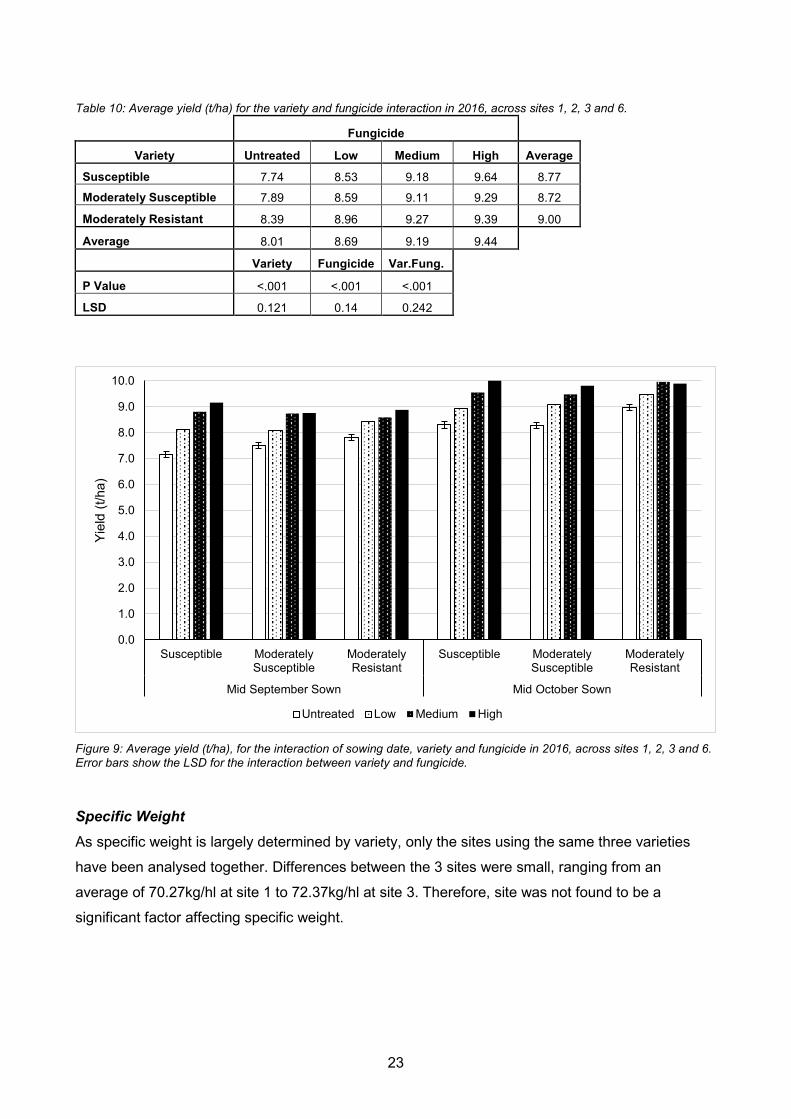
Sowing date, seed rate, variety and fungicide were also found to significantly affect yield when
considered on their own (Table 9). This is not surprising as sowing date, seed rate and variety can
all influence yield in the absence of disease. On average, the late sown treatments yielded
significantly higher than the early sown with 9.32t/ha compared to 8.34t/ha (Figure 9).
Furthermore, the higher seed rate treatments had a higher yield on average, with 9.00t/ha
compared to 8.66t/ha where lower seed rates had been implemented. When comparing the
different varieties, the susceptible and moderately susceptible group were statistically comparable,
whereas the moderately resistant group significantly increased yield compared to either of the
other two groups (Table 10).
The interaction between variety and fungicide was also found to be statistically significant (Table
9), suggesting that the response to fungicide differed by variety (Table 10). On average the high
input programme was optimal in the susceptible varieties, but there was no significant benefit in
applying more than a medium input programme for the moderately susceptible and moderately
resistant (Table 10). However, the interaction between site, variety and fungicide was also
statistically significant, suggesting that the relationship between variety and fungicide was not
consistent across sites (Appendix 3).
23
Table 10: Average yield (t/ha) for the variety and fungicide interaction in 2016, across sites 1, 2, 3 and 6.
Fungicide Variety Untreated Low Medium High Average
Susceptible 7.74 8.53 9.18 9.64 8.77 Moderately Susceptible 7.89 8.59 9.11 9.29 8.72
Moderately Resistant 8.39 8.96 9.27 9.39 9.00
Average 8.01 8.69 9.19 9.44 Variety Fungicide Var.Fung. P Value <.001 <.001 <.001 LSD 0.121 0.14 0.242
Figure 9: Average yield (t/ha), for the interaction of sowing date, variety and fungicide in 2016, across sites 1, 2, 3 and 6. Error bars show the LSD for the interaction between variety and fungicide.
Specific Weight As specific weight is largely determined by variety, only the sites using the same three varieties
have been analysed together. Differences between the 3 sites were small, ranging from an
average of 70.27kg/hl at site 1 to 72.37kg/hl at site 3. Therefore, site was not found to be a
significant factor affecting specific weight.
0.0
1.0
2.0
3.0
4.0
5.0
6.0
7.0
8.0
9.0
10.0
Susceptible ModeratelySusceptible
ModeratelyResistant
Susceptible ModeratelySusceptible
ModeratelyResistant
Mid September Sown Mid October Sown
Yiel
d (t/
ha)
Untreated Low Medium High

24
Table 11: Factors and interactions found to be statistically significant (P<0.05) by analysis of variance for specific weight in 2016.
Factor P Value Sowing <.001
Site.Sowing 0.006
Seed Rate <.001
Variety <.001
Fungicide <.001
Site.Variety <.001
Sowing.Variety <.001
Site.Fungicide <.001
Sowing.Fungicide 0.022
Variety.Fungicide <.001
Sowing.Seed Rate.Fungicide <.001
Site.Sowing.Seed Rate.Fungicide <.001
Sowing date, seed rate, variety and fungicide were all found to significantly affect specific weight
as a single factor (Table 11). This is not surprising as sowing date, seed rate and variety can all
influence specific weight in the absence of disease. On average, the late sowing had higher
specific weight (Figure 10) than the early with 72.31kg/hl compared to 70.43kg/hl. The high seed
rate had a slightly higher specific weight than the low seed rate with 71.58 kg/hl compared to
71.16kg/hl on average. When comparing the different varieties, all three were significantly different,
Santiago (susceptible) had the lowest value and JB Diego (moderately susceptible) the highest
(Table 12).
The interaction between variety and fungicide was also found to be statistically significant,
suggesting that the response to fungicide differed by variety (Table 11). For Santiago, there was no
significant benefit from applying more than a medium input programme. For JB Diego there was no
significant benefit from applying more than a low input programme. Whereas, for Revelation
(moderately resistant) there was no significant difference between the untreated and low input
programme, but the medium input programme significantly increased specific weight compared to
the untreated (Table 12). The interaction between site, variety and fungicide was not found to be
significant, therefore indicating that this relationship was consistent across sites.

25
Table 12: Average specific weight (kg/hl) for the variety and fungicide interaction in 2016 across sites 1 to 3.
Fungicide Variety Untreated Low Medium High Average
Santiago 67.30 69.75 70.68 71.09 69.71 JB Diego 72.12 73.18 73.60 73.32 73.05
Revelation 70.81 71.33 71.70 71.52 71.34
Average 70.08 71.42 71.99 71.98 Variety Fungicide Var.Fung. P Value <.001 <.001 <.001 LSD 0.300 0.347 0.601
Figure 10: Average specific weight, for the interaction of sowing date, variety and fungicide in 2016 across sites 1 to 3. Error bars show the LSD for the interaction between variety and fungicide.
4.2.2. 2017 season
In 2017, rainfall was about average for most of the UK in March and well below average in April. In
May, the North received below average rainfall whereas in the South it was closer to average. In
June, rainfall was above average in the North and about average in the South (Figure 2, Figure 3).
T2 + 2-3 weeks disease assessment At this early assessment timing, average septoria severity varied significantly, ranging from 2.27%
at site 9 to 8.44% at site 7.
0
10
20
30
40
50
60
70
80
Santiago JB Diego Revelation Santiago JB Diego Revelation
Mid September Sown Mid October Sown
Spec
ific
wei
ght (
kg/h
l)
Untreated Low Medium High

26
Table 13: Factors and interactions found to be statistically significant (P<0.05) by analysis of variance for septoria severity on leaf 3 at T2 + 2-3 weeks in 2017.
Factor P Value
Site <.001
Sowing <.001
Site.Sowing 0.028
Variety <.001
Fungicide <.001
Site.Seed Rate <.001
Site.Variety <.001
Site.Fungicide <.001
Sowing.Fungicide <.001
Variety.Fungicide <.001
Site.Sowing.Seed Rate 0.003
Site.Seed Rate.Variety <.001
Site.Sowing.Fungicide 0.031
Site.Seed Rate.Fungicide <.001
Site.Variety.Fungicide <.001
Site.Sowing.Seed Rate.Fungicide <.001
Site.Seed Rate.Variety.Fungicide <.001
Sowing.Seed Rate.Variety.Fungicide <.001
Site.Sowing.Seed Rate.Variety.Fungicide <.001
In addition to site differences, sowing date, variety and fungicide were also found to be significant
factors affecting septoria at this time (Table 13). Early sowings had greater septoria severity on leaf
3 (Figure 11) than the late sowings with an average of 6.27% and 3.54% respectively. When
comparing the different varieties, all three groups were significantly different with the highest
disease severity in the susceptible group and lowest in the moderately resistant (Table 14).
The interaction between variety and fungicide was also found to be statistically significant (Table
13). On average there was a significant benefit in disease control from applying up to a medium
input programme in the susceptible and moderately susceptible varieties, whereas for the
moderately resistant varieties there was no further benefit from applying more than a low input
programme (Table 14). However, as in 2016 the interaction between site, variety and fungicide
was also statistically significant suggesting that the relationship between variety and fungicide was
not consistent across sites (Appendix 4).

27
Table 14: Average septoria severity (%) on leaf 3 at T2 + 2-3 weeks for the variety and fungicide interaction in 2017, across sites, 7, 8, 9, 10 and 12.
Fungicide Variety Untreated Low Medium High Average
Susceptible 17.44 3.97 2.14 1.54 6.27 Moderately Susceptible 15.58 3.55 1.60 1.10 5.46
Moderately Resistant 8.40 1.58 1.13 0.84 2.99
Average 13.81 3.03 1.62 1.16 Variety Fungicide Var.Fung. P Value <.001 <.001 <.001 LSD 0.733 0.847 1.466
Figure 11: Average septoria severity (%) on leaf 3 at T2 + 2-3 weeks, for the interaction of sowing date, variety and fungicide in 2016, across sites, 7, 8, 9, 10 and 12. Error bars show the LSD for the interaction between variety and fungicide.
T2 + 6-8 weeks disease assessment As at the earlier assessment, significant site differences were evident at this time with average
septoria severity on leaf 2 ranging from 3.47% at site 9 to 16.03% at site 11.
0
5
10
15
20
25
Susceptible ModeratelySusceptible
ModeratelyResistant
Susceptible ModeratelySusceptible
ModeratelyResistant
Mid September Sown Mid October Sown
% L
eaf a
rea
affe
cted
by
sept
oria
on
leaf
3
Untreated Low Medium High

28
Table 15: Factors and interactions found to be statistically significant (P<0.05) by analysis of variance for septoria severity on leaf 2 at T2 + 6-8 weeks in 2017.
Factor P Value
Site <.001
Sowing 0.003
Variety <.001
Fungicide <.001
Site.Variety <.001
Seed Rate.Variety 0.042
Site.Fungicide <.001
Variety.Fungicide <.001
Sowing.Seed Rate.Variety <.001
Site.Sowing.Fungicide <.001
Site.Seed Rate.Fungicide 0.039
Site.Variety.Fungicide <.001
Sowing.Variety.Fungicide 0.038
Site.Sowing.Seed Rate.Fungicide 0.018
Site.Sowing.Variety.Fungicide <.001
Site.Seed Rate.Variety.Fungicide 0.045
Sowing.Seed Rate.Variety.Fungicide <.001
Sowing date, variety and fungicide were also found to be significant as a single factor (Table 15).
Early sowings had greater septoria severity than later sowings with an average of 10.77%
compared to 8.00%. When comparing the different varieties, the susceptible and moderately
susceptible groups were statistically comparable, whereas the resistant variety had significantly
less disease on average.
The interaction between variety and fungicide was also found to be significant, indicating that the
effect of fungicide varied by variety (Table 15). However, at this assessment, the relationship
between variety and fungicide was affected by sowing date. When comparing the untreated values,
there was no significant difference between sowing dates for the moderately susceptible variety
whereas, for the susceptible and moderately resistant groups there was a significant reduction in
disease when sown mid-October compared to mid-September. However, the response to fungicide
was consistent across both sowing dates, as there was no significant benefit in disease control
from applying more than a medium input strategy in the susceptible and moderately susceptible
varieties, whereas for the moderately resistant group there was no significant benefit from applying
more than a low input programme (Figure 12). The interaction between site, sowing date, variety
and fungicide was also statistically significant suggesting that the relationship between sowing
date, variety and fungicide was not consistent across sites (Appendix 5).

29
Figure 12: Average septoria severity (%) on leaf 2 at T2 + 6-8 weeks, for the interaction of sowing date, variety and fungicide in 2017, across sites 8, 9, 11 and 12. Error bars show the LSD for the interaction between sowing date, variety and fungicide.
Yield The highest yielding site in 2017 was site 12, achieving 11.48t/ha, whilst the lowest yielding was
site 8, with 8.31t/ha when averaged across all treatments.
Table 16: Factors and interactions found to be statistically significant (P<0.05) by analysis of variance for yield in 2017.
Factor P Value
Site <.001
Seed Rate <.001
Variety <.001
Fungicide <.001
Site.Seed Rate <.001
Sowing.Seed Rate <.001
Site.Variety <.001
Sowing.Variety <.001
Site.Fungicide <.001
Variety.Fungicide <.001
Site.Sowing.Seed Rate 0.001
Site.Sowing.Variety 0.002
Site.Seed Rate.Variety 0.032
Site .Sowing.Fungicide 0.005
Site.Variety.Fungicide <.001
Site.Sowing.Seed Rate.Fungicide <.001
Site.Sowing.Variety.Fungicide 0.005
0
5
10
15
20
25
30
35
Susceptible ModeratelySusceptible
ModeratelyResistant
Susceptible ModeratelySusceptible
ModeratelyResistant
Mid September Sown Mid October Sown
% L
eaf a
rea
affe
cted
by
sept
oria
on
leaf
2
Untreated Low Medium High

30
Seed rate, variety and fungicide were also found to be significant as a single factor (Table 16). On
average, the higher seed rate achieved higher yields with 10.13t/ha, compared to 9.82t/ha for the
lower seed rate. When comparing the three different varieties, the susceptible and moderately
susceptible groups achieved significantly higher yields than the moderately resistant (Table 17).
The interaction between variety and fungicide was also found to be significant (Table 16). On
average, there was no significant benefit in yield from applying more than a medium input
programme in the susceptible variety, or a low input programme in the moderately susceptible and
moderately resistant varieties (Table 17). However, a significant interaction between site, variety
and fungicide indicates that the relationship between variety and fungicide was not consistent
across sites (Appendix 6).
Table 17: Average yield (t/ha) for the variety and fungicide interaction in 2017, across sites 7 to 12.
Fungicide Variety Untreated Low Medium High Average
Susceptible 8.73 10.16 10.65 10.74 10.07
Moderately Susceptible 9.11 10.24 10.35 10.35 10.01
Moderately Resistant 9.18 9.99 10.10 10.12 9.85
Average 9.00 10.13 10.37 10.40 Variety Fungicide Var.Fung. P Value <.001 <.001 <.001 LSD 0.115 0.133 0.230
The interaction between sowing date, variety and fungicide was not found to be statistically
significant in 2017, as yield values were similar whether sown mid-September or mid-October
(Figure 13).

31
Figure 13: Average yield (t/ha), for the interaction of sowing date, variety and fungicide in 2017, across sites 7 to 12. Error bars show the LSD for the interaction between variety and fungicide.
Specific weight In 2017 there was a significant difference in the specific weight values achieved by each site. Of
the 4 sites included in this analysis, site 8 had the highest values with an average of 72.78kg/hl
and site 10 the lowest with 67.53kg/hl.
Table 18: Factors and interactions found to be statistically significant (P<0.05) by analysis of variance for specific weight in 2017.
Factor P Value
Site <.001
Variety <.001
Fungicide <.001
Site.Variety <.001
Sowing.Variety <.001
Site.Fungicide <.001
Sowing.Fungicide 0.03
Seed Rate.Fungicide 0.022
Variety.Fungicide <.001
Site.Sowing.Seed Rate 0.025
Site.Sowing.Variety 0.027
Site .Sowing.Fungicide 0.008
Site.Variety.Fungicide <.001
Site.Sowing.Variety.Fungicide 0.019
0
2
4
6
8
10
12
Susceptible ModeratelySusceptible
ModeratelyResistant
Susceptible ModeratelySusceptible
ModeratelyResistant
Mid September Sown Mid October Sown
Yiel
d (t/
ha)
Untreated Low Medium High

32
Variety and fungicide were also found to be significant as a single factor (Table 18). On average,
JB Diego achieved the highest specific weight, significantly higher than Santiago or Revelation
which were comparable (Table 19).
The interaction between variety and fungicide was also significant (Table 18). This is because for
Santiago there was a significant benefit of fungicides up to the medium input programme, whereas
for JB Diego and Revelation there was no further benefit from going above a low input programme
(Table 19). However, the interaction between site, variety and fungicide was also statistically
significant suggesting that this relationship was not consistent across sites (Appendix 7).
Table 19: Average specific weight (kg/hl) for the variety and fungicide interaction in 2017, across sites 7, 8, 9 and 10.
Fungicide Variety Untreated Low Medium High Average
Santiago 68.36 69.99 70.46 70.28 69.77 JB Diego 72.08 72.92 72.64 72.65 72.57
Revelation 69.14 69.74 69.96 69.79 69.66
Average 69.86 70.88 71.02 70.91 Variety Fungicide Var.Fung. P Value <.001 <.001 <.001 LSD 0.198 0.229 0.396
The interaction between sowing date, variety and fungicide was not significant suggesting that the
relationship between variety and fungicide was consistent across sowing dates (Figure 14).
Figure 14: Average specific weight, for the interaction of sowing date, variety and fungicide in 2017, across sites 7, 8, 9 and 10. Error bars show the LSD for the interaction between variety and fungicide.
0
10
20
30
40
50
60
70
80
Santiago JB Diego Revelation Santiago JB Diego Revelation
Mid September Sown Mid October Sown
Spec
ific
wei
ght (
kg/h
l)
Untreated Low Medium High

33
4.2.3. 2018 season
In 2018, rainfall was well above average for most of the UK in March and above average in April. In
May, rainfall was close to average in the South of the UK but below average in the North, whereas
in June rainfall was well below average across most of the UK (Figure 2, Figure 3).
T2 + 2-3 weeks disease assessment Disease pressure was highest at site 13 at this time with a severity of 18.21% when averaged
across all treatments, whereas site 14 had significantly less disease on leaf 3 with 1.77%.
Table 20: Factors and interactions found to be statistically significant (P<0.05) by analysis of variance for septoria severity on leaf 3 at T2 + 2-3 weeks in 2018.
Factor P Value Site <.001
Sowing <.001
Site.Sowing <.001
Seed Rate 0.001
Variety <.001
Fungicide <.001
Sowing.Seed Rate 0.035
Site.Variety <.001
Sowing.Variety <.001
Site.Fungicide <.001
Sowing.Fungicide <.001
Variety.Fungicide <.001
Site.Sowing.Variety <.001
Site .Sowing.Fungicide <.001
Site.Variety.Fungicide <.001
Site.Sowing.Variety.Fungicide <.001 Sowing date, seed rate, variety and fungicide were also found to be significant factors affecting
septoria severity on leaf 3 (Table 20). On average early sowings had greater septoria severity than
later sowings with 10.67% compared to 6.21%. Furthermore, the higher seed rates also had
greater septoria severity than lower seed rates with 9.04% compared to 7.84%. When comparing
the different varieties, there were significant differences in disease pressure between each group,
reflecting disease resistance ratings, with the highest disease severity in the susceptible group and
lowest in the moderately resistant (Table 21).
The interaction between variety and fungicide was also found to be statistically significant due to
differences in the level of disease in the untreated of each variety (Table 20). However, the
response to fungicide across all three variety groups was comparable as there was no significant
benefit from applying more than a low input fungicide programme at this time (Table 21). The

34
interaction between site, variety and fungicide was also statistically significant suggesting that the
relationship between variety and fungicide was not consistent across sites (Appendix 8).
Table 21: Average septoria severity (%) on leaf 3 at T2 + 2-3 weeks for the variety and fungicide interaction in 2018, across sites 13, 14, 15, 17 and 18.
Fungicide Variety Untreated Low Medium High Average
Susceptible 29.99 7.44 9.51 5.89 13.21 Moderately Susceptible 20.73 4.99 4.71 3.27 8.43
Moderately Resistant 8.95 2.25 2.22 1.34 3.69
Average 19.89 4.90 5.48 3.50 Variety Fungicide Var.Fung. P Value <.001 <.001 <.001 LSD 0.888 1.025 1.776
The interaction between sowing date, variety and fungicide was not found to be significant,
suggesting that the relationship between variety and fungicide was consistent across sowing dates.
However, it is clear that sowing in mid-October reduced the level of disease in the untreated of
each variety compared to sowing in mid-September. This meant that a susceptible variety sown in
mid-October was comparable to a moderately susceptible variety sown mid-September (Figure
15).
Figure 15: Average septoria severity (%) on leaf 3 at T2 + 2-3 weeks, for the interaction of sowing date, variety and fungicide in 2018, across sites 13, 14, 15, 17 and 18. Error bars show the LSD for the interaction between variety and fungicide.
0
5
10
15
20
25
30
35
40
Susceptible ModeratelySusceptible
ModeratelyResistant
Susceptible ModeratelySusceptible
ModeratelyResistant
Mid September Sown Mid October Sown
% L
eaf a
rea
affe
cted
by
sept
oria
on
leaf
3
Untreated Low Medium High

35
T2 + 6-8 weeks disease assessment Due to the dry conditions in May and June disease progress was slow in 2018 and therefore final
disease levels were relatively low compared to the other seasons. However, the site differences
seen earlier were still evident. The highest level of disease on leaf 2 was seen at site 15, with a
septoria severity value of 5.79% when average across all treatments. The lowest was at site 16,
with just 0.21%.
Table 22: Factors and interactions found to be statistically significant (P<0.05) by analysis of variance for septoria severity on leaf 2 at T2 + 6-8 weeks in 2018.
Factor P Value Site <.001
Sowing 0.015
Site.Sowing <.001
Seed Rate 0.002
Variety <.001
Fungicide <.001
Site.Seed Rate 0.016
Site.Variety <.001
Site.Fungicide <.001
Sowing.Fungicide 0.004
Seed Rate.Fungicide <.001
Variety.Fungicide <.001
Site.Sowing.Variety 0.002
Site.Seed Rate.Fungicide <.001
Site.Variety.Fungicide <.001
Sowing.Variety.Fungicide 0.041
Site.Sowing.Variety.Fungicide 0.003
Sowing date, seed rate, variety and fungicide were also found to be significant factors that affected
septoria severity (Table 22). At this time, on average, late sowing had slightly higher septoria
severity than early sowing with 3.80% and 3.27% respectively. This result differs from both the
earlier assessment in this year and from the effect of sowing date in previous seasons. This may
be due to an underestimation of disease in the early sowing due to early senescence following dry
conditions in May and June. The higher seed rate had greater septoria severity on average than
the low seed rate with 3.92% compared to 3.15%. When comparing the different varieties, all three
groups were significantly different and reflected their resistance ratings.
The interaction between variety and fungicide was found to be significant, suggesting that the
fungicide effect varied by variety. However, this relationship was affected by sowing date (Table
22). When comparing the levels of disease where no fungicides were applied (untreated), the
susceptible variety sown in mid-October had significantly less septoria than when sown mid-
September. Whereas the moderately susceptible and moderately resistant varieties showed no

36
significant difference by sowing date. Furthermore, for most varieties there was no significant
benefit from applying more than a low input fungicide programme whether sown mid-September or
mid-October. However, there was one exception, where the moderately susceptible group was
sown mid-October there was a significant benefit from applying up to a medium input strategy
(Figure 16). The interaction between site, sowing date, variety and fungicide was also statistically
significant suggesting that the relationship between sowing date, variety and fungicide was not
consistent across sites (Appendix 9).
Figure 16: Average septoria severity (%) on leaf 2 at T2 + 6-8 weeks, for the interaction of sowing date, variety and fungicide in 2018, across sites 14, 15, 16 and 18. Error bars show the LSD for the interaction between sowing date, variety and fungicide.
Yield Of the 5 sites analysed here, the highest yielding site was 18 with an average of 11.92t/ha, the
lowest yielding site was 16 with 8.93t/ha. Therefore, site was found to be a significant factor
affecting yields.
0
2
4
6
8
10
12
14
Susceptible ModeratelySusceptible
ModeratelyResistant
Susceptible ModeratelySusceptible
ModeratelyResistant
Mid September Sown Mid October Sown
% L
eaf a
rea
affe
cted
by
sept
oria
on
leaf
2
Untreated Low Medium High

37
Table 23: Factors and interactions found to be statistically significant (P<0.05) by analysis of variance for yield in 2018.
Factor P Value
Site <.001
Seed Rate <.001
Variety <.001
Fungicide <.001
Site.Seed Rate <.001
Site.Variety <.001
Sowing.Variety 0.001
Site.Fungicide <.001
Variety.Fungicide 0.016
Site.Sowing.Seed Rate 0.002
Site.Sowing.Variety 0.008
Site.Seed Rate.Fungicide <.001
Site.Variety.Fungicide <.001
Site.Seed Rate.Variety.Fungicide 0.003
Seed rate, variety and fungicide were also found to significantly affect yield as a single factor
(Table 23). On average, the higher seed rates achieved a higher yield with 10.65t/ha compared to
10.25t/ha where lower seed rates were implemented. When comparing the different varieties, all
three groups were significantly different, the susceptible group achieving the highest yield and
moderately susceptible the lowest (Table 24).
The interaction between variety and fungicide was also found to be statistically significant,
suggesting that the response to fungicide differed by variety (Table 23). On average, there was a
significant increase in yield from applying up to a medium input programme in the susceptible and
moderately susceptible varieties, whereas for the moderately resistant, there was no further benefit
from applying more than a low input fungicide programme (Table 24). However, the interaction
between site, variety and fungicide was also statistically significant suggesting that the relationship
between variety and fungicide was not consistent across sites (Appendix 10).
Table 24: Average yield (t/ha) for the variety and fungicide interaction in 2018, across sites 13, 14, 15, 16 and 18.
Fungicide Variety Untreated Low Medium High Average
Susceptible 10.02 10.58 10.99 10.98 10.64 Moderately Susceptible 9.67 10.29 10.61 10.52 10.27
Moderately Resistant 10.01 10.51 10.48 10.71 10.43
Average 9.90 10.46 10.69 10.74 Variety Fungicide Var.Fung. P Value <.001 <.001 0.016 LSD 0.11 0.127 0.22

38
The interaction between sowing date, variety and fungicide was not found to be statistically
significant in 2018, suggesting that the interaction between variety and fungicide was similar
across sowing dates (Figure 17).
Figure 17: Average yield (t/ha), for the interaction of sowing date, variety and fungicide in 2018, across sites 13, 14, 15, 16 and 18. Error bars show the LSD for the interaction between variety and fungicide.
Specific weight Significant differences in specific weight between sites were evident in 2018, with site 14 achieving
the highest specific weight with an average of 77.53kg/hl, and site 16 having the lowest values with
an average of 73.44kg/hl.
Table 25: Factors and interactions found to be statistically significant (P<0.05) by analysis of variance for specific weight in 2018.
Factor P Value
Site <.001
Variety <.001
Fungicide <.001
Site.Variety <.001
Sowing.Variety <.001
Site.Fungicide <.001
Variety.Fungicide <.001
Site.Sowing.Variety <.001
Site.Seed Rate.Variety 0.007
Site.Variety.Fungicide <.001
Sowing.Variety.Fungicide 0.02
0.0
2.0
4.0
6.0
8.0
10.0
12.0
Susceptible ModeratelySusceptible
ModeratelyResistant
Susceptible ModeratelySusceptible
ModeratelyResistant
Mid September Sown Mid October Sown
Yiel
d (t/
ha)
Untreated Low Medium High

39
Variety and fungicide were also found to significantly affect specific weight as a single factor (Table
25). When comparing the different varieties, all three varieties were significantly different. JB Diego
achieved the highest values and Santiago the lowest.
The interaction between variety and fungicide was found to be statistically significant (Table 25).
However, the interaction between sowing date, variety and fungicide was also significant,
suggesting that the relationship between variety and fungicide was affected by sowing date. This is
because when sown mid-September, specific weight significantly increased in Santiago between
the untreated and low input fungicide programme and low input and medium input programme, but
there was no further benefit from the high input programme. In JB Diego, there was no significant
difference between the untreated and low input programme, however the medium input
programme did significantly increase specific weight compared to the untreated. Whereas in
Revelation there was no significant differences between any of the fungicide inputs. When sown in
mid-October, for Santiago, there was no significant difference between the untreated and low input
programme, however, the medium input programme did significantly increase specific weight
compared to the untreated. However, for both JB Diego and Revelation there was no significant
differences between any of the fungicide inputs (Figure 18).
Figure 18: Average specific weight, for the interaction of sowing date, variety and fungicide in 2018, across sites 13, 14, 15 and 16. Error bars show the LSD for the interaction between sowing date, variety and fungicide.
0
10
20
30
40
50
60
70
80
Santiago JB Diego Revelation Santiago JB Diego Revelation
Mid September Sown Mid October Sown
Spec
ific
Wei
ght (
kg/h
l)
Untreated Low Medium High

40
4.2.4. 2019 season
In 2019, rainfall was above average in the North and about average in the south during March. In
April, for most areas of the UK rainfall was below average, whereas in May the south west received
below average rainfall, and the rest of the UK was close to average. In June rainfall was above
average, particularly in the Midlands (Figure 2, Figure 3).
T2 + 2-3 weeks disease assessment Significant differences in disease pressure were observed between sites at this time with septoria
on leaf 3 ranging from 0.28% at site 21 to 8.16% at site 19.
Table 26: Factors and interactions found to be statistically significant (P<0.05) by analysis of variance for septoria severity on leaf 3 at T2 + 2-3 weeks in 2019.
Factor P Value Site <.001
Sowing 0.013
Site.Sowing 0.013
Variety <.001
Fungicide <.001
Site.Variety <.001
Sowing.Variety <.001
Site.Fungicide <.001
Sowing.Fungicide <.001
Variety.Fungicide <.001
Site.Sowing.Variety <.001
Site.Sowing.Fungicide <.001
Site.Variety.Fungicide <.001
Sowing.Variety.Fungicide 0.03
Site.Sowing.Variety.Fungicide 0.046
Sowing date, variety and fungicide were also found to be significant factors affecting septoria
severity (Table 26). Early sowings had greater septoria severity than late sowings, with an average
(across all factors) of 6.35% compared to 2.09%. Each variety group had a significantly different
level of disease, reflecting their resistance ratings as the susceptible group had the highest severity
and moderately resistant group the lowest.
The effect of fungicide differed by variety however, the interaction between sowing date, variety
and fungicide was also significant, suggesting that the relationship between variety and fungicide
also differed by sowing date (Table 26). This was because when comparing the untreated values,
the susceptible and moderately susceptible varieties had significantly higher septoria severity when
sown mid-September compared to mid-October, whereas for the moderately resistant varieties
septoria severity was comparable across sowing dates. This meant that when sown mid-
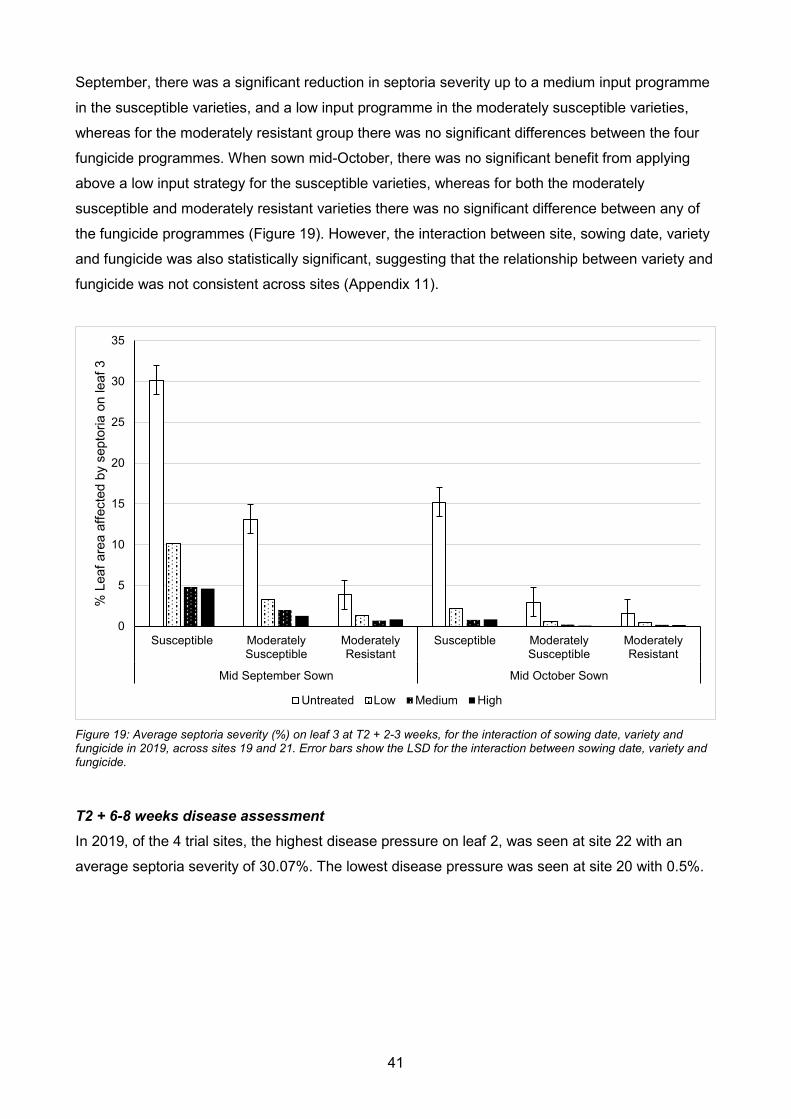
41
September, there was a significant reduction in septoria severity up to a medium input programme
in the susceptible varieties, and a low input programme in the moderately susceptible varieties,
whereas for the moderately resistant group there was no significant differences between the four
fungicide programmes. When sown mid-October, there was no significant benefit from applying
above a low input strategy for the susceptible varieties, whereas for both the moderately
susceptible and moderately resistant varieties there was no significant difference between any of
the fungicide programmes (Figure 19). However, the interaction between site, sowing date, variety
and fungicide was also statistically significant, suggesting that the relationship between variety and
fungicide was not consistent across sites (Appendix 11).
Figure 19: Average septoria severity (%) on leaf 3 at T2 + 2-3 weeks, for the interaction of sowing date, variety and fungicide in 2019, across sites 19 and 21. Error bars show the LSD for the interaction between sowing date, variety and fungicide.
T2 + 6-8 weeks disease assessment In 2019, of the 4 trial sites, the highest disease pressure on leaf 2, was seen at site 22 with an
average septoria severity of 30.07%. The lowest disease pressure was seen at site 20 with 0.5%.
0
5
10
15
20
25
30
35
Susceptible ModeratelySusceptible
ModeratelyResistant
Susceptible ModeratelySusceptible
ModeratelyResistant
Mid September Sown Mid October Sown
% L
eaf a
rea
affe
cted
by
sept
oria
on
leaf
3
Untreated Low Medium High

42
Table 27: Factors and interactions found to be statistically significant (P<0.05) by analysis of variance for septoria severity on leaf 2 at T2 + 6-8 weeks in 2019.
Factor P Value Site <.001
Sowing 0.003
Site.Sowing 0.003
Variety <.001
Fungicide <.001
Site.Variety <.001
Site.Fungicide <.001
Site.Sowing.Variety 0.04
Site.Sowing.Fungicide 0.01
Site.Variety.Fungicide 0.015
Site.Sowing.Variety.Fungicide 0.049
Sowing date, variety and fungicide were also found to be significant factors affecting septoria
severity (Table 27). On average, sowing early resulted in greater septoria severity than when
sowing late, with an average severity of 16.23% compared to 11.17%. When comparing the
different varieties, the susceptible group had significantly more disease than the moderately
susceptible and moderately resistant which were statistically comparable (Table 28).
At this assessment, the interaction between variety and fungicide, and sowing date, variety and
fungicide was not found to be significant. Therefore suggesting that, on this occasion, the response
to fungicide was the same across all varieties and sowing dates (Figure 20). On average, septoria
severity significantly decreased between the untreated and low input strategy and the low and
medium input strategy, but there was no further significant reduction from the high input strategy
(Table 28). However, the interaction between site and variety and site and fungicide was significant
suggesting that the response to variety and fungicide was not consistent across sites (Appendix
12).
Table 28: Average septoria severity (%) on leaf 2 at T2 + 6-8 weeks for the variety and fungicide interaction in 2019, across sites 19, 20, 21 and 22.
Fungicide Variety Untreated Low Medium High Average
Susceptible 33.99 22.00 10.24 7.83 18.52 Moderately Susceptible 26.43 13.71 4.98 3.49 12.15
Moderately Resistant 24.62 9.33 3.90 3.84 10.42
Average 28.35 15.01 6.37 5.05 Variety Fungicide Var.Fung. P Value <.001 <.001 0.142 LSD 2.077 2.398 4.153

43
Figure 20: Average septoria severity (%) on leaf 2 at T2 + 6-8 weeks, for the interaction of sowing date, variety and fungicide in 2019, across sites 19, 20, 21 and 22. Error bars show the LSD for fungicides.
Yield In 2019, yield varied by site ranging from 11.64t/ha (site 21) to 10.39t/ha (site 19).
Table 29: Factors and interactions found to be statistically significant (P<0.05) by analysis of variance for yield in 2019.
Factor P Value
Site <.001
Sowing <.001
Site.Sowing 0.002
Variety <.001
Fungicide <.001
Site.Variety <.001
Site.Fungicide <.001
Variety.Fungicide <.001
Site.Sowing.Variety <.001
Site.Sowing.Fungicide 0.009
Site.Variety.Fungicide <.001
Sowing date, variety and fungicide were also found to be significant factors affecting yield (Table
29). Later sowings achieved higher yields than early sowings (Figure 21) with an average of
10.94t/ha compared to 10.58t/ha. When comparing the different varieties, the moderately resistant
group achieved significantly higher yields than the susceptible and moderately susceptible, which
were statistically comparable (Table 30).
0
5
10
15
20
25
30
35
40
Susceptible ModeratelySusceptible
ModeratelyResistant
Susceptible ModeratelySusceptible
ModeratelyResistant
Mid September Sown Mid October Sown
% L
eaf a
rea
affe
cted
by
sept
oria
on
leaf
2
Untreated Low Medium High

44
The interaction between variety and fungicide was also significant, suggesting that the effect of
fungicide differed by variety (Table 29). For the susceptible varieties, yield significantly increased
up to a medium input fungicide programme. For the moderately susceptible group, yield
significantly increased between the untreated and low input programme, the low and medium input
programmes were statistically comparable, but yield did significantly increase between the low and
high input programme. However, for the moderately resistant varieties there was no significant
benefit from applying more than a low input programme (Table 30). The interaction between site,
variety and fungicide was also statistically significant suggesting that the relationship between
variety and fungicide was not consistent across sites (Appendix 13).
Table 30: Average yield (t/ha) for the variety and fungicide interaction in 2019, across sites 19, 20, 21 and 22.
Fungicide Variety Untreated Low Medium High Average
Susceptible 9.01 10.47 11.11 11.27 10.47 Moderately Susceptible 9.77 10.61 10.79 11.03 10.55
Moderately Resistant 10.51 11.4 11.66 11.51 11.27
Average 9.76 10.83 11.19 11.27 Variety Fungicide Var.Fung. P Value <.001 <.001 <.001 LSD 0.150 0.173 0.300
Figure 21: Average yield (t/ha), for the interaction of sowing date, variety and fungicide in 2019, across sites 19, 20, 21 and 22. Error bars show the LSD for the interaction between variety and fungicide.
0.0
2.0
4.0
6.0
8.0
10.0
12.0
Susceptible ModeratelySusceptible
ModeratelyResistant
Susceptible ModeratelySusceptible
ModeratelyResistant
Mid September Sown Mid October Sown
Yiel
d (t/
ha)
Untreated Low Medium High

45
Specific weight In 2019, of the 3 sites that used the same varieties, site 20 had the highest specific weight, with an
average of 74.73kg/hl, and site 21 the lowest with 70.28kg/hl.
Table 31: Factors and interactions found to be statistically significant (P<0.05) by analysis of variance for specific weight in 2019.
Factor P Value
Site <.001
Variety <.001
Fungicide <.001
Site.Variety <.001
Sowing.Variety 0.049
Site.Fungicide <.001
Variety.Fungicide <.001
Site.Sowing.Variety 0.003
Site.Variety.Fungicide 0.001
Variety and fungicide were also found to be significant factors affecting specific weight (Table 31).
When comparing the different varieties, there were significant differences in specific weight
between all three. Graham (moderately resistant) had the highest value and Santiago (susceptible)
the lowest (Table 32).
The interaction between variety and fungicide was also significant, suggesting that the effect of
fungicide differed by variety (Table 31). For both Santiago and Hardwick, specific weight
significantly increased in the low input fungicide programme compared to the untreated, but there
was no further benefit from the medium or high input programmes. Whereas for Graham, there
was no significant differences between any of the fungicide programmes (Table 32, Figure 22).
However, the interaction between site, variety and fungicide was also significant suggesting that
the relationship between variety and fungicide differed by site (Appendix 14).
Table 32: Average specific weight (kg/hl) for the variety and fungicide interaction in 2019, across sites 19, 20, and 21.
Fungicide Variety Untreated Low Medium High Average
Santiago 67.19 70.05 70.34 70.47 69.51 Hardwicke 71.55 72.72 72.96 73.15 72.59
Graham 73.38 73.44 73.93 73.46 73.55
Average 70.70 72.07 72.41 72.36 Variety Fungicide Var.Fung. P Value <.001 <.001 <.001
LSD 0.315 0.364 0.630

46
Figure 22: Average specific weight, for the interaction of sowing date, variety and fungicide in 2019, across sites 19, 20, and 21. Error bars show the LSD for the interaction between variety and fungicide.
4.2.5. 2020 season
In 2020, the field experiments endured some extreme meteorological conditions. High autumn
rainfall made establishing trials very difficult. The spring by contrast was very dry with below
average rainfall across most of the UK in March, April and May, limiting disease progress and in
some cases inducing drought. Rainfall in June was closer to average with above average rainfall
received in the west (Figure 2, Figure 3). As a result of the difficult drilling conditions, late sown
plots at site 23 weren’t drilled until the 23rd March and, consequently, only the KWS Firefly
vernalised. Therefore, as no late sown data could be collected, this site has been excluded from all
analysis.
T2 + 2-3 weeks disease assessment The disease pressure at each site was low in 2020, with the highest disease pressure seen at site
24, with an average septoria severity of 4.08% on leaf 3, compared to 0.49% at site 25.
0
10
20
30
40
50
60
70
80
Santiago Hardwick Graham Santiago Hardwick Graham
Mid September Sown Mid October Sown
Spec
ific
Wei
ght (
kg/h
l)
Untreated Low Medium High

47
Table 33: Factors and interactions found to be statistically significant (P<0.05) by analysis of variance for septoria severity on leaf 3 at T2 + 2-3 weeks in 2020.
Factor P Value
Site 0.012
Site.Sowing 0.029
Variety <.001
Fungicide <.001
Site.Variety 0.001
Sowing.Variety 0.008
Site.Fungicide <.001
Variety.Fungicide 0.008
Site.Sowing.Variety 0.023
Site.Sowing.Fungicide 0.029
Site.Variety.Fungicide 0.01
Sowing.Variety.Fungicide 0.004 In addition to site, variety and fungicide were also found to be significant factors affecting septoria
severity at this time (Table 33). The varietal differences reflected variety resistance ratings as the
susceptible group had the highest disease severity on average and the moderately resistant the
lowest.
The interaction between variety and fungicide indicated that the effect of fungicide differed by
variety, but this was also affected by sowing date, in a three-way interaction (Table 33). This was
because when comparing the untreated, the susceptible variety sown mid-September had
significantly higher septoria severity than any of the other untreated situations, whether sown in
mid-September or mid-October. This meant that in the susceptible variety sown mid-September,
there was a significant benefit in disease control from applying up to a medium input fungicide
programme. In both the moderately susceptible and moderately resistant varieties sown mid-
September, there was no significant differences between any of the fungicide programmes. When
the susceptible and moderately resistant variety were sown in mid-October, there were also no
significant differences between the fungicide programmes. However, in the moderately susceptible
variety sown mid-October, there was a significant difference between the untreated and high input
programme (Figure 23).

48
Figure 23: Average septoria severity (%) on leaf 3 at T2 + 2-3 weeks, for the interaction of sowing date, variety and fungicide in 2020, across sites 24 and 25. Error bars show the LSD for the interaction between sowing date, variety and fungicide.
T2 + 6-8 weeks disease assessment By T2 + 6-8 weeks, septoria severity had increased, severity differed by site averaging 22.34% on
leaf 2 at site 24, and 3.22% at site 25.
Table 34: Factors and interactions found to be statistically significant (P<0.05) by analysis of variance for septoria severity on leaf 2 at T2 + 6-8 weeks in 2020.
Factor P Value Site <.001
Sowing 0.017
Site.Sowing 0.039
Variety 0.029
Fungicide <.001
Site.Fungicide <.001
Sowing date, variety and fungicide were also found to be significant as a single factor (Table 34).
On average, the early sowing had higher septoria severity than the late sowing (Figure 24) with
15.44% compared to 10.12% severity on average. When comparing varieties, the susceptible
variety group had significantly higher septoria severity than the moderately resistant group (Table
35).
On this occasion there was no significant interactions between variety and fungicide. Therefore,
suggesting that the response to fungicides was the same across all three varieties. On average
each level of fungicide input achieved a significant reduction in septoria severity, from untreated to
0
2
4
6
8
10
12
14
16
Susceptible ModeratelySusceptible
ModeratelyResistant
Susceptible ModeratelySusceptible
ModeratelyResistant
Mid September Sown Mid October Sown
% L
eaf a
rea
affe
cted
by
sept
oria
on
leaf
3
Untreated Low Medium High

49
low, low to medium and medium to high (Table 35). However, the interaction between site and
fungicide was also significant, suggesting that this response was not consistent across sites
(Appendix 15).
Table 35: Average septoria severity (%) on leaf 2 at T2 + 6-8 weeks for the variety and fungicide interaction in 2020, across sites 24 and 25.
Fungicide Variety Untreated Low Medium High Average
Susceptible 30.01 13.33 10.75 4.29 14.60 Moderately Susceptible 23.28 15.63 10.08 4.83 13.46
Moderately Resistant 16.31 13.33 7.75 3.75 10.28
Average 23.20 14.10 9.53 4.29 Variety Fungicide Var.Fung. P Value 0.029 <.001 0.082 LSD 3.260 3.765 6.521
Figure 24: Average septoria severity (%) on leaf 2 at T2 + 6-8 weeks, for the interaction of sowing date, variety and fungicide in 2020, across sites 24 and 25. Error bars show the LSD for fungicide.
Yield The average yield achieved by each site in 2020 was very similar with 10.89t/ha at site 24 and
10.26t/ha at site 25.
0
5
10
15
20
25
30
35
40
Susceptible ModeratelySusceptible
ModeratelyResistant
Susceptible ModeratelySusceptible
ModeratelyResistant
Mid September Sown Mid October Sown
% L
eaf a
rea
affe
cted
by
sept
oria
on
leaf
2
Untreated Low Medium High

50
Table 36: Factors and interactions found to be statistically significant (P<0.05) by analysis of variance for yield in 2020.
Factor P Value Site.Sowing 0.01
Variety <.001
Fungicide <.001
Sowing.Variety <.001
Site.Sowing.Variety 0.045
Variety and fungicide were found to be significant factors affecting the yield results (Table 36).
When comparing the different varieties, on average the susceptible variety achieved the lowest
yield, significantly lower than the moderately susceptible and moderately resistant which were
comparable (Table 37).
The yield response to fungicides in 2020 was consistent across varieties. On average, yield
significantly increased between the untreated and low input programme, the low input and medium
input were comparable, but the high input programme provided a further benefit above that of the
medium input programme (Table 37).
Table 37: Average yield (t/ha) for the variety and fungicide interaction in 2020, across sites 24 and 25.
Fungicide Variety Untreated Low Medium High Average
Susceptible 9.64 10.44 10.57 10.90 10.39
Moderately Susceptible 9.70 10.84 10.89 11.20 10.66
Moderately Resistant 10.00 10.77 10.88 11.13 10.70
Average 9.78 10.68 10.78 11.08 Variety Fungicide Var.Fung. P Value <.001 <.001 0.663 LSD 0.164 0.189 0.328
The interaction between sowing date, variety and fungicide was not significant suggesting that the
response to fungicide was consistent across variety and sowing dates (Figure 25).

51
Figure 25: Average yield (t/ha), for the interaction of sowing date, variety and fungicide in 2020, across sites 24 and 25. Error bars show the LSD for fungicide.
Specific weight Specific weight differed by site, site 24 had the highest values with an average of 74.75kg/hl,
compared to 68.38kg/hl at site 25.
Table 38: Factors and interactions found to be statistically significant (P<0.05) by analysis of variance for specific weight in 2020.
Factor P Value Site 0.002
Site.Sowing 0.007
Site.Variety 0.048
In 2020 there was no significant differences in specific weight by sowing date, variety or fungicide
as differences between treatments were small, possibly due to the very dry conditions (Figure 26).
0
2
4
6
8
10
12
Susceptible ModeratelySusceptible
ModeratelyResistant
Susceptible ModeratelySusceptible
ModeratelyResistant
Mid September Sown Mid October Sown
Yiel
d (t/
ha)
Untreated Low Medium High
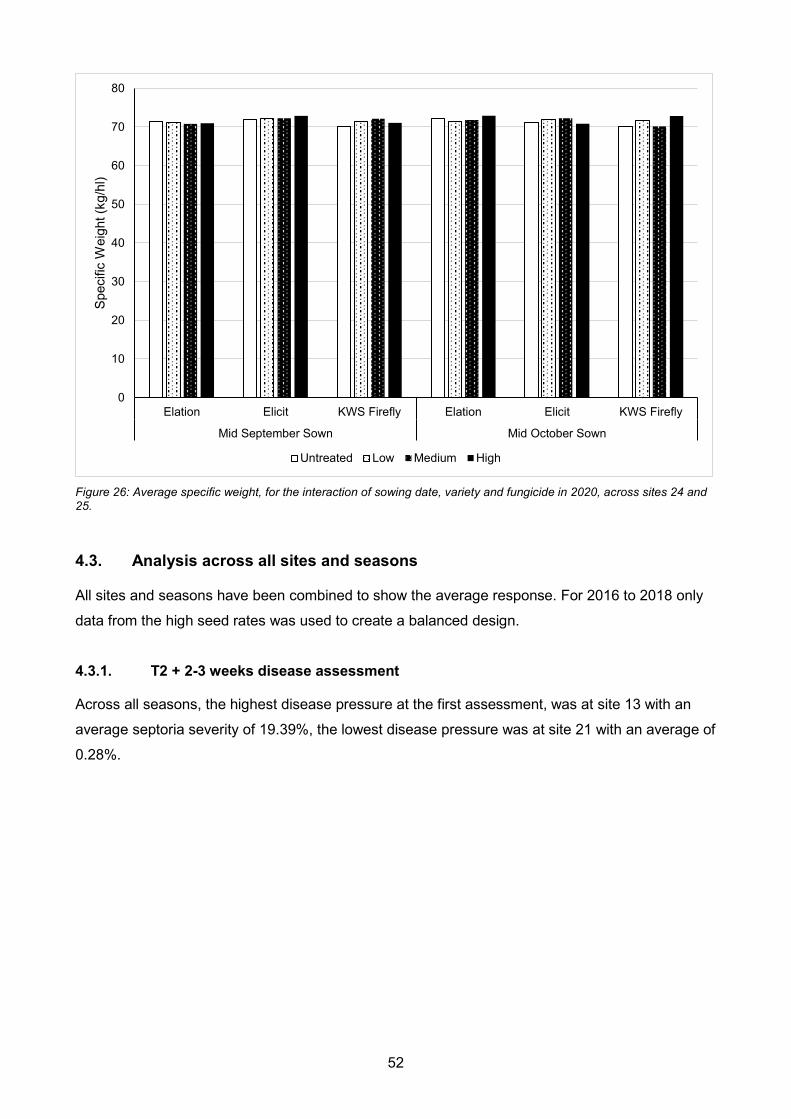
52
Figure 26: Average specific weight, for the interaction of sowing date, variety and fungicide in 2020, across sites 24 and 25.
4.3. Analysis across all sites and seasons
All sites and seasons have been combined to show the average response. For 2016 to 2018 only
data from the high seed rates was used to create a balanced design.
4.3.1. T2 + 2-3 weeks disease assessment
Across all seasons, the highest disease pressure at the first assessment, was at site 13 with an
average septoria severity of 19.39%, the lowest disease pressure was at site 21 with an average of
0.28%.
0
10
20
30
40
50
60
70
80
Elation Elicit KWS Firefly Elation Elicit KWS Firefly
Mid September Sown Mid October Sown
Spec
ific
Wei
ght (
kg/h
l)
Untreated Low Medium High

53
Table 39: Factors and interactions found to be statistically significant (P<0.05) by analysis of variance for septoria severity on leaf 3 at T2 + 2-3 weeks across all seasons.
Factor P Value Site <.001
Sowing <.001
Site.Sowing <.001
Variety <.001
Fungicide <.001
Site.Variety <.001
Sowing.Variety <.001
Site.Fungicide <.001
Sowing.Fungicide <.001
Variety.Fungicide <.001
Site.Sowing.Variety <.001
Site.Sowing.Fungicide <.001
Site.Variety.Fungicide <.001
Site.Sowing.Variety.Fungicide <.001
Sowing date, variety and fungicide were also found to be significant factors (Table 39). On average
early sowing had higher disease severity than late sowing (Figure 27) with an average of 6.33%
compared to 3.44%. When comparing the different varieties, each variety was significantly
different, and reflected the resistance ratings of the groups (Table 40).
The interaction between variety and fungicide was also found to be statistically significant,
suggesting that the response to fungicide varied by variety (Table 39). In the susceptible varieties,
there was a significant reduction in septoria severity from applying up to a high input programme.
However, for the moderately susceptible varieties the low and medium input programme performed
comparably, but there was a significant benefit from the high input programme compared to the
low. In the resistant varieties, there was no further benefit from applying more than a low input
programme (Table 40). The interaction between site, variety and fungicide indicated that the
relationship between variety and fungicide was not consistent across sites (Appendix 16).
Table 40: Average septoria severity (%) on leaf 3 at T2 + 2-3 weeks for the variety and fungicide interaction across sites 1 to 10, 12 to 15, 17 to 19, 21, 24 and 25.
Fungicide Variety Untreated Low Medium High Average Susceptible 17.19 5.19 4.10 2.63 7.28 Moderately Susceptible 12.27 3.25 2.44 1.74 4.92
Moderately Resistant 6.18 1.54 1.31 0.77 2.45
Average 11.88 3.33 2.61 1.71 Variety Fungicide Var.Fung. P Value <.001 <.001 <.001 LSD 0.504 0.582 1.009

54
The interaction between sowing date, variety and fungicide was not found to be significant,
suggesting that the relationship between variety and fungicide was consistent across sowing dates.
However, when sowing in mid-October, the level of disease in the untreated of each variety was
lower than when sown mid-September. As a result, a moderately susceptible variety sown mid-
October is comparable to a moderately resistant variety sown mid-September (Figure 27).
Figure 27: Average septoria severity (%) on leaf 3 at T2 + 2-3 weeks, for the interaction of sowing date, variety and fungicide across sites 1 to 10, 12 to 15, 17 to 19, 21, 24 and 25. Error bars show the LSD for the interaction between variety and fungicide.
4.3.2. T2 + 6-8 weeks disease assessment
Across all seasons, the highest disease pressure at the second assessment was at site 22, with an
average septoria severity of 30.07%, the lowest disease pressure was at site 16, with an average
of 0.19%.
0
5
10
15
20
25
Susceptible ModeratelySusceptible
ModeratelyResistant
Susceptible ModeratelySusceptible
ModeratelyResistant
Mid September Sown Mid October Sown
% L
eaf a
rea
affe
cted
by
sept
oria
on
leaf
3
Untreated Low Medium High

55
Table 41: Factors and interactions found to be statistically significant (P<0.05) by analysis of variance for Septoria severity on leaf 2 at T2 + 6-8 weeks across all seasons.
Factor P Value Site <.001
Sowing <.001
Site.Sowing <.001
Variety <.001
Fungicide <.001
Site.Variety <.001
Site.Fungicide <.001
Variety.Fungicide <.001
Site.Sowing.Variety <.001
Site.Sowing.Fungicide <.001
Site.Variety.Fungicide <.001
Sowing.Variety.Fungicide 0.006
Site.Sowing.Variety.Fungicide 0.002
Sowing date, variety and fungicide were also found to significantly affect septoria severity (Table
41). On average, early sowing had higher disease severity with an average of 10.95%, compared
to 8.72% when sown late. When comparing the different varieties, all three were significantly
different from one another, with disease severity increasing with varietal susceptibility.
The response to fungicide differed by variety. However, the interaction between sowing date,
variety and fungicide was also significant indicating that the relationship between variety and
fungicide varied by sowing date (Table 41). Comparisons of the untreated indicate both the
susceptible and moderately susceptible varieties showed no significant difference in septoria
severity across sowing dates. However, the level of disease in the moderately resistant varieties
did significantly decrease when sown mid-October compared to mid-September. When sown mid-
September there was a significant benefit in disease control up to a medium input fungicide
programme on the susceptible varieties, although the high input programme achieved a further
reduction compared to the medium, this difference wasn’t quite significant. For the moderately
susceptible varieties, there was a significant reduction in septoria severity up to a high input
programme. Whereas for the moderately resistant group, there was no further benefit from
applying more than a medium input programme. When sown mid-October, there was a significant
benefit on disease control from applying up to a high input programme in the susceptible variety
and medium input programme in the moderately susceptible variety. In the moderately resistant
variety, the difference between the low and medium input programmes wasn’t quite significant, but
there was a significant difference between the low and high input programmes (Figure 28).
However, the interaction between site, sowing date, variety, and fungicide was also significant,
indicating that this relationship varied by site (Appendix 17).

56
Figure 28: Average septoria severity on leaf 2 (%) at T2 + 6-8 weeks, for the interaction of sowing date, variety and fungicide across sites 1 to 6, 8, 9, 11, 12, 14 to 16, 18 to 22, 24 and 25. Error bars show the LSD for the interaction between sowing date, variety and fungicide.
4.3.3. Yield
Across all seasons, the highest yield was achieved at site 18 with an average of 12.20t/ha, and the
lowest was at site 2 with 5.18t/ha.
Table 42: Factors and interactions found to be statistically significant (P<0.05) by analysis of variance for yield across all seasons.
Factor P Value
Site <.001
Sowing 0.048
Site.Sowing 0.009
Variety <.001
Fungicide <.001
Site.Variety <.001
Sowing.Variety <.001
Site.Fungicide <.001
Variety.Fungicide <.001
Site.Sowing.Variety <.001
Site.Sowing.Fungicide <.001
Site.Variety.Fungicide <.001
In addition to site, sowing date, variety and fungicide were also found to be significant as a single
factor (Table 42). On average, late sowing achieved higher yields than early with 10.29t/ha
0
5
10
15
20
25
30
Susceptible ModeratelySusceptible
ModeratelyResistant
Susceptible ModeratelySusceptible
ModeratelyResistant
Mid September Sown Mid October Sown
% L
eaf a
rea
affe
cted
by
sept
oria
on
leaf
2
Untreated Low Medium High

57
compared to 10.12t/ha. When comparing the different varieties, the moderately resistant variety
achieved the highest yield when averaged across all fungicide treatments and sowing dates,
significantly higher than both the susceptible and moderately susceptible groups which were
comparable (Table 43).
The yield response to fungicide differed by variety (Table 42). In the susceptible variety there was
a benefit in yield from applying up to a high input fungicide programme, however the difference
between the medium and high input programmes wasn’t quite statistically significant. In the
moderately susceptible variety, there was a significant benefit in yield from applying up to a high
input programme, however in the moderately resistant variety there was no significant benefit
above the low input programme (Table 43). The interaction between site, variety and fungicide was
also significant, suggesting that the relationship between variety and fungicide differed by site
(Appendix 18).
Table 43: Average yield (t/ha) for the variety and fungicide interaction across all seasons.
Fungicide Variety Untreated Low Medium High Average Susceptible 9.10 10.17 10.69 10.81 10.19 Moderately Susceptible 9.32 10.20 10.42 10.58 10.13
Moderately Resistant 9.68 10.45 10.47 10.58 10.30
Average 9.37 10.27 10.53 10.66 Variety Fungicide Var.Fung. P Value <.001 <.001 <.001 LSD 0.073 0.085 0.146
The relationship between variety and fungicide was consistent across sowing dates (Figure 29).
However, when the data is considered as yield response compared to the untreated (Figure 30), it
is clear that the susceptible varieties sown mid-September achieved the largest yield response to
fungicides, and the moderately resistant varieties sown mid-October the smallest. Furthermore, the
difference between the medium and high input strategy for the susceptible and moderately
susceptible varieties is larger when sown mid-September compared to mid-October.

58
Figure 29: Average yield (t/ha), for the interaction of sowing date, variety and fungicide across sites 1 to 3, 6 to 16, 18 to 22, 24 and 25. Error bars show the LSD for the interaction between variety and fungicide.
Figure 30: Average yield response (t/ha), for the interaction of sowing date, variety and fungicide across sites 1 to 3, 6 to 16, 18 to 22, 24 and 25. Error bars show the LSD for the interaction between variety and fungicide.
0
2
4
6
8
10
12
Susceptible ModeratelySusceptible
ModeratelyResistant
Susceptible ModeratelySusceptible
ModeratelyResistant
Mid September Sown Mid October Sown
Yiel
d (t/
ha)
Untreated Low Medium High
0.0
0.2
0.4
0.6
0.8
1.0
1.2
1.4
1.6
1.8
2.0
Susceptible ModeratelySusceptible
ModeratelyResistant
Susceptible ModeratelySusceptible
ModeratelyResistant
Mid September Sown Mid October Sown
Yiel
d re
spon
se (t
/ha)
Low Medium High

59
4.3.4. Output
To summarise the results from an economic perspective, the average yield results have been
converted to output using a grain price of £165/t (Table 44). This indicates that, when left
untreated, output increases as you move from a susceptible variety to a moderately resistant
variety, as you would expect given the higher septoria resistance ratings. However, when treated
with a high input programme the differences between the three varieties are much smaller, ranging
from £1728/ha in the moderately susceptible variety to £1769/ha in the susceptible variety when
sown mid-September, and £1739/ha in the moderately resistant variety to £1800/ha in the
susceptible variety when sown mid-October. These differences in output between the different
variety groups under the high input programme are driven by the yield potential of the chosen
varieties. Santiago, which dominates the susceptible variety group, is a high yielding variety and
therefore the susceptible group has achieved the highest output in this project. But there are some
high yielding varieties with high resistance ratings against septoria, so this will not always be the
case.
When comparing the additional output each fungicide programme achieved above that of the
untreated (Table 45), it’s clear that applying a low input fungicide programme increased output in
all situations with an increase of at least £100/ha across all sowing dates and varieties, covering
the cost of a low input strategy. However, the additional output from the medium and high input
programmes varied substantially by variety. In the susceptible varieties an additional £100/ha was
achieved between a low and high input programme irrespective of sowing date. However, in the
moderately resistant group, the additional output from medium and high input programmes is very
small, with an increase of only £25 when sown mid-September and £18 when sown mid-October
between the low and high input programmes.
Margin over fungicide costs have not been calculated here, as it would be a misrepresentation of
the results. The total cost of each fungicide programme in this project does not accurately
represent the cost of a typical low, medium, and high input strategy. The low input programme was
based on chlorothalonil which was very cost effective but is no longer available. Therefore, the cost
now to growers of a low input programme to achieve an equivalent level of control will be higher.
Furthermore, as the programmes were designed to build incrementally and hence show what each
active adds to disease control and yield, the high input strategy will be more expensive, as an
azole and SDHI have been applied as two separate products instead of a formulated mix.

60
Table 44: Average output (£/ha) for each treatment, before accounting for the cost of fungicides, using data from across all sites and seasons.
Fungicide
Sowing Date Variety Untreated Low Medium High
Mid September Sown Susceptible 1473 1667 1739 1769
Moderately Susceptible 1521 1662 1685 1728 Moderately Resistant 1581 1728 1737 1752
Mid October Sown Susceptible 1530 1690 1790 1800 Moderately Susceptible 1554 1703 1752 1766
Moderately Resistant 1614 1721 1718 1739 Table 45: Additional output (£/ha) from the low, medium and high input fungicide programmes compared to the untreated, before accounting for the cost of fungicides, using data from across all sites and seasons.
Fungicide
Sowing Date Variety Low Medium High Mid September Sown Susceptible 193 266 295 Moderately Susceptible 140 163 206
Moderately Resistant 147 157 172 Mid October Sown Susceptible 160 261 271 Moderately Susceptible 149 198 211
Moderately Resistant 107 104 125
4.4. Analysis by disease pressure
Trial sites were divided into three groups representing low, medium and high disease pressure. To
categorise the sites, septoria severity data on leaf 1 at T2 + 6-8 weeks in the early sown,
untreated, moderately susceptible variety was used. Sites were classed as low pressure if the
severity on this leaf ranged from 0 to 5%, medium pressure, 6 to 15% and high, greater than 15% (
Table 46). Sites 7, 10 and 17 could not be classified as there was no reliable assessment data at
this timing. Site 23 was not included as there was no late sown data for this site.

61
Table 46: Total rainfall for the months of March to June at each trial site compared to the long term mean (LTM) for each region, and disease pressure group classification. For most sites the LTM uses data from the closest MET office weather station (MET Office, Historic Station Data 2021a), for the sites in Ireland, UCD and Teagasc provided the LTM from local weather stations. Values in bold are greater than the long term mean for that region.
Site Number Site Total Rainfall
in March Total Rainfall
in April Total Rainfall
in May Total Rainfall
in June Disease
pressure group
1 RM 2016 71.8 43.8 32.8 69.6 Medium
7 RM 2017 50.1 7.4 55.4 24.7 -
13 RM 2018 97.3 59.1 65.0 16.0 High
19 RM 2019 42.6 60.4 49.8 123.4 High
23 RM 2020 27.4 30.2 1.6 58.4 -
LTM 1991-2020 53.0 54.6 56.7 55.7
2 TT 2016 101.1 56.1 21.1 117.5 Low
8 TT 2017 36.7 13.8 79.5 80.4 Medium
14 TT 2018 61.6 67.8 38.7 5.5 Low LTM 1991-2020 32.9 37.6 43.2 49.3
3 NIAB 2016 34.6 39.4 43.2 31.2 High
9 NIAB 2017 33.5 7.1 41.6 20.3 Medium
15 NIAB 2018 44.2 43.2 32.3 0.8 Low
20 NIAB 2019 69.0 29.4 48.7 103.5 Low
24 NIAB 2020 44.0 47.0 3.8 42.2 High
LTM 1991-2020 42.9 48.1 56.7 50.2
4 SRUC 2016 31.0 71.0 27.0 60.0 Medium
10 SRUC 2017 36.6 11.6 20.6 145.8 -
16 SRUC 2018 48.0 61.9 19.9 99.2 Low
21 SRUC 2019 55.4 31.4 62.4 44.8 Low
25 SRUC 2020 49.0 1.2 34.2 76.2 Medium
LTM 1991-2020 46.3 43.3 50.2 62.8
5 Teagasc 2016 40.6 64.3 61.6 61.7 Low
11 Teagasc 2017 66.6 15.8 81.8 91.0 High
17 Teagasc 2018 98.1 73.0 24.3 5.2 -
22 Teagasc 2019 122.9 72.5 14.1 55.0 High
LTM 1991-2020 61.2 59.7 57.1 63.7
6 UCD 2016 38.7 59.7 62.6 111.3 High
12 UCD 2017 65.9 8.8 67.1 91.8 High
18 UCD 2018 69.1 76.1 16.8 18.5 Low
LTM 1991-2020 50.7 51.9 59.1 62.5
Average LTM 1991-2020 47.8 49.2 53.9 57.4

62
To directly compare rainfall across sites from different regions, an average of the long-term mean
(LTM) across all regions was calculated (Table 46). The total rainfall at each site from March to
June was then compared to the average LTM (Figure 31). This shows there was a good range of
weather conditions across the sites included in this project, with about 50% of sites being below
the average LTM and 50% above, generating different disease pressure scenarios. As expected,
the high-pressure sites tended to be among those with the most rainfall, although there are a few
exceptions.
However, as previously discussed, the rainfall in April, and May in particular, tended to be below or
close to average across all 5 years of this project. Across all 25 sites, rainfall in May ranged from
1.6mm to 81.8mm, whereas in June, rainfall ranged from 0.8mm to 145.8mm. When comparing the
total rainfall received at each site in April and May, key months for the spread of septoria within a
crop, with the average LTM for April and May, most sites were below average with only 5 sites
above (Figure 32).
Therefore, the disease pressure groups represent low, medium and high disease pressure within
the context of this project. However, this dataset is lacking sites with high April and May rainfall,
which may result in higher disease pressure than what was achieved within this project.
Figure 31: Total rainfall from March to June at each site compared to the average LTM. The black bars show the high-pressure sites.
-150
-100
-50
0
50
100
Tota
l rai
nfal
l fro
m M
arch
to J
une
com
pare
d to
th
e av
erag
e LT
M
Trial Site
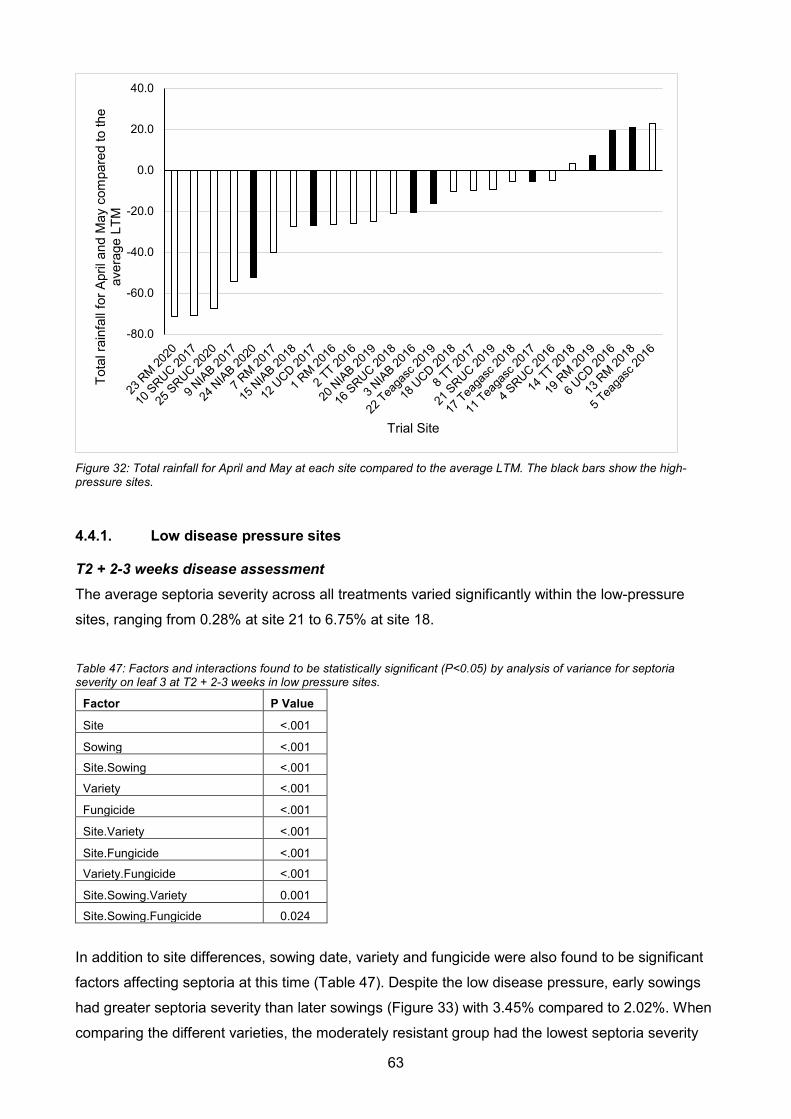
63
Figure 32: Total rainfall for April and May at each site compared to the average LTM. The black bars show the high-pressure sites.
4.4.1. Low disease pressure sites
T2 + 2-3 weeks disease assessment The average septoria severity across all treatments varied significantly within the low-pressure
sites, ranging from 0.28% at site 21 to 6.75% at site 18.
Table 47: Factors and interactions found to be statistically significant (P<0.05) by analysis of variance for septoria severity on leaf 3 at T2 + 2-3 weeks in low pressure sites.
Factor P Value
Site <.001
Sowing <.001
Site.Sowing <.001
Variety <.001
Fungicide <.001
Site.Variety <.001
Site.Fungicide <.001
Variety.Fungicide <.001
Site.Sowing.Variety 0.001
Site.Sowing.Fungicide 0.024
In addition to site differences, sowing date, variety and fungicide were also found to be significant
factors affecting septoria at this time (Table 47). Despite the low disease pressure, early sowings
had greater septoria severity than later sowings (Figure 33) with 3.45% compared to 2.02%. When
comparing the different varieties, the moderately resistant group had the lowest septoria severity
-80.0
-60.0
-40.0
-20.0
0.0
20.0
40.0To
tal r
ainf
all f
or A
pril
and
May
com
pare
d to
the
aver
age
LTM
Trial Site

64
on average, significantly lower than the susceptible and moderately susceptible varieties which
were statistically comparable (Table 48).
The interaction between variety and fungicide was also found to be significant (Table 47). For the
susceptible and moderately susceptible varieties, there was no significant benefit from applying
above a low input programme. However, in the moderately resistant group, the level of disease in
the untreated was very low, and therefore there was no significant differences between any of the
fungicide programmes (Table 48).
Table 48: Average septoria severity (%) on leaf 3 at T2 + 2-3 weeks for the variety and fungicide interaction in low pressure sites, 2, 5, 14, 15, 18 and 21.
Fungicide Variety Untreated Low Medium High Average Susceptible 7.90 2.56 1.40 1.54 3.35 Moderately Susceptible 6.40 2.97 1.77 2.63 3.44
Moderately Resistant 2.19 1.35 1.10 1.05 1.42
Average 5.49 2.30 1.42 1.74 Variety Fungicide Var.Fung. P Value <.001 <.001 <.001 LSD 0.623 0.719 1.246
Figure 33: Average septoria severity (%) on leaf 3 at T2 + 2-3 weeks, for the interaction of sowing date, variety and fungicide in low pressure sites, 2, 5, 14, 15, 18 and 21. Error bars show the LSD for the interaction between variety and fungicide.
0
5
10
15
20
25
30
35
40
45
50
Susceptible ModeratelySusceptible
ModeratelyResistant
Susceptible ModeratelySusceptible
ModeratelyResistant
Mid September Sown Mid October Sown
% L
eaf a
rea
affe
cted
by
sept
oria
on
leaf
3
Untreated Low Medium High

65
T2 + 6-8 weeks disease assessment Of the 8 sites in this group, average septoria severity across all treatments on leaf 2 at this time,
ranged from 0.19% at site 16 to 6.91% at site 15.
Table 49: Factors and interactions found to be statistically significant (P<0.05) by analysis of variance for septoria severity on leaf 2 at T2 + 6-8 weeks in low pressure sites.
Factor P Value
Site <.001
Sowing 0.043
Site.Sowing <.001
Variety <.001
Fungicide <.001
Site.Variety <.001
Site.Fungicide <.001
Variety.Fungicide <.001
Site.Sowing.Variety <.001
Site.Sowing.Fungicide <.001
Site.Variety.Fungicide <.001
Site.Sowing.Variety.Fungicide <.001
As well as site, sowing date, variety and fungicide were also found to be significant factors
affecting septoria at this time (Table 49). In this case, unlike the first assessment, the late sowings
had slightly higher septoria severities than early sowings (Figure 34) with an average of 3.40%
compared to 2.98% on leaf 2. When comparing the different varieties, on average all three groups
were significantly different, with the highest disease severity in the susceptible group and the
lowest in the moderately resistant (Table 50).
The interaction between variety and fungicide was also significant (Table 49). In the susceptible
varieties, the low input programme significantly reduced septoria severity compared to the
untreated, the low and medium input programmes were statistically comparable, but the high input
programme significantly reduced disease compared to the low. In comparison, there was no
significant benefit from applying more than a medium input programme in the moderately
susceptible varieties and low input programme for moderately resistant (Table 50). However, the
interaction between site, variety and fungicide was also significant (Appendix 19).

66
Table 50: Average septoria severity (%) on leaf 2 at T2 + 6-8 weeks for the variety and fungicide interaction in low pressure sites, 2, 5, 14, 15, 16, 18, 20 and 21.
Fungicide Variety Untreated Low Medium High Average Susceptible 12.66 2.76 1.94 1.20 4.64 Moderately Susceptible 7.45 2.93 1.26 1.48 3.28
Moderately Resistant 3.08 1.43 1.21 0.91 1.66
Average 7.73 2.37 1.47 1.20 Variety Fungicide Var.Fung. P Value <.001 <.001 <.001 LSD 0.491 0.567 0.983
Figure 34: Average septoria severity (%) on leaf 2 at T2 + 6-8 weeks, for the interaction of sowing date, variety and fungicide in low pressure sites, 2, 5, 14, 15, 16, 18, 20 and 21. Error bars show the LSD for the interaction between variety and fungicide.
Yield Yields in this low-pressure group ranged from 5.16t/ha at site 2 to 12.20t/ha at site 18.
0
10
20
30
40
50
60
Susceptible ModeratelySusceptible
ModeratelyResistant
Susceptible ModeratelySusceptible
ModeratelyResistant
Mid September Sown Mid October Sown
% L
eaf a
rea
affe
cted
by
sept
oria
on
leaf
2
Untreated Low Medium High
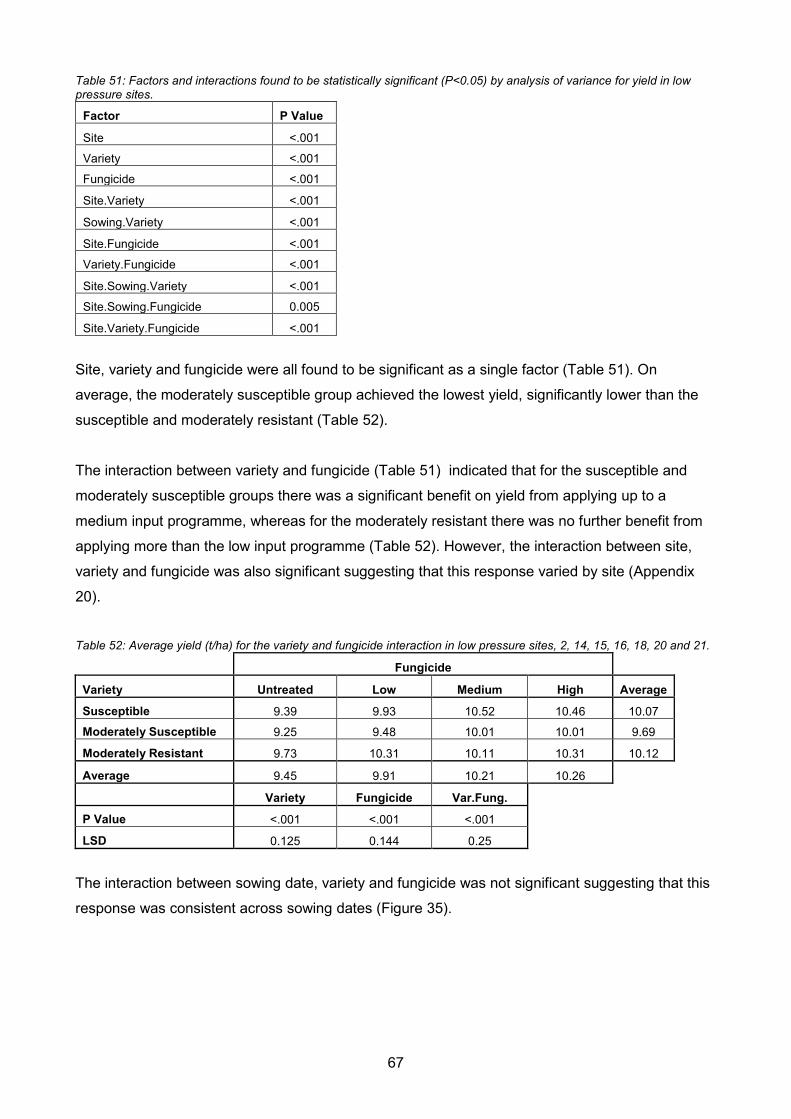
67
Table 51: Factors and interactions found to be statistically significant (P<0.05) by analysis of variance for yield in low pressure sites.
Factor P Value
Site <.001
Variety <.001
Fungicide <.001
Site.Variety <.001
Sowing.Variety <.001
Site.Fungicide <.001
Variety.Fungicide <.001
Site.Sowing.Variety <.001
Site.Sowing.Fungicide 0.005
Site.Variety.Fungicide <.001
Site, variety and fungicide were all found to be significant as a single factor (Table 51). On
average, the moderately susceptible group achieved the lowest yield, significantly lower than the
susceptible and moderately resistant (Table 52).
The interaction between variety and fungicide (Table 51) indicated that for the susceptible and
moderately susceptible groups there was a significant benefit on yield from applying up to a
medium input programme, whereas for the moderately resistant there was no further benefit from
applying more than the low input programme (Table 52). However, the interaction between site,
variety and fungicide was also significant suggesting that this response varied by site (Appendix
20).
Table 52: Average yield (t/ha) for the variety and fungicide interaction in low pressure sites, 2, 14, 15, 16, 18, 20 and 21.
Fungicide Variety Untreated Low Medium High Average Susceptible 9.39 9.93 10.52 10.46 10.07 Moderately Susceptible 9.25 9.48 10.01 10.01 9.69
Moderately Resistant 9.73 10.31 10.11 10.31 10.12
Average 9.45 9.91 10.21 10.26 Variety Fungicide Var.Fung. P Value <.001 <.001 <.001 LSD 0.125 0.144 0.25
The interaction between sowing date, variety and fungicide was not significant suggesting that this
response was consistent across sowing dates (Figure 35).

68
Figure 35: Average yield (t/ha), for the interaction of sowing date, variety and fungicide in low pressure sites, 2, 14, 15, 16, 18, 20 and 21. Error bars show the LSD for the interaction between variety and fungicide.
4.4.2. Medium disease pressure sites
T2 + 2-3 weeks disease assessment Average septoria severity on leaf 3 in the medium pressure sites ranged from an average of 0.49%
at site 25 to 4.90% at site 8.
Table 53: Factors and interactions found to be statistically significant (P<0.05) by analysis of variance for septoria severity on leaf 3 at T2 + 2-3 weeks in medium pressure sites.
Factor P Value
Site 0.001
Sowing <.001
Site.Sowing 0.004
Variety <.001
Fungicide <.001
Sowing.Variety 0.003
Site.Fungicide <.001
Sowing.Fungicide <.001
Site.Sowing.Fungicide <.001
As well as site, sowing date, variety and fungicide were all found to be significant factors affecting
septoria at this time (Table 53). Early sowings had higher disease severity than later sowings
(Figure 36) with an average of 3.63% compared to 0.92% on leaf 3. The susceptible varieties
0
2
4
6
8
10
12
Susceptible ModeratelySusceptible
ModeratelyResistant
Susceptible ModeratelySusceptible
ModeratelyResistant
Mid September Sown Mid October Sown
Yiel
d (t/
ha)
Untreated Low Medium High

69
group had the highest disease severity, significantly higher than the moderately susceptible and
moderately resistant groups (Table 54).
In this case the interaction between variety and fungicide was not significant, suggesting that the
response to fungicide was consistent across varieties. On average there was no significant benefit
from going above a medium input strategy. However, the interaction between site and fungicide
was significant, suggesting that this response was not consistent across sites (Appendix 21).
Table 54: Average septoria severity (%) on leaf 3 at T2 + 2-3 weeks for the variety and fungicide interaction in medium pressure sites, 1, 4, 8, 9 and 25.
Fungicide Variety Untreated Low Medium High Average Susceptible 7.45 2.01 1.18 1.16 2.95 Moderately Susceptible 5.84 1.57 0.71 0.58 2.17
Moderately Resistant 4.38 1.34 0.70 0.36 1.69
Average 5.89 1.64 0.86 0.70 Variety Fungicide Var.Fung. P Value <.001 <.001 0.123 LSD 0.651 0.752 1.302
Figure 36: Average septoria severity (%) on leaf 3 at T2 + 2-3 weeks, for the interaction of sowing date, variety and fungicide in medium pressure sites 1, 4, 8, 9 and 25. Error bars show the LSD for fungicide.
0
5
10
15
20
25
30
35
40
45
50
Susceptible ModeratelySusceptible
ModeratelyResistant
Susceptible ModeratelySusceptible
ModeratelyResistant
Mid September Sown Mid October Sown
% L
eaf a
rea
affe
cted
by
sept
oria
on
leaf
3
Untreated Low Medium High

70
T2 + 6-8 weeks disease assessment At T2 + 6-8 weeks, septoria severity within this group varied significantly from 3.22% on leaf 2 on
average at site 25 to 7.56% at site 4.
Table 55: Factors and interactions found to be statistically significant (P<0.05) by analysis of variance for septoria severity on leaf 2 at T2 + 6-8 weeks in medium pressure sites.
Factor P Value
Site <.001
Sowing <.001
Site.Sowing 0.016
Variety <.001
Fungicide <.001
Site.Variety <.001
Site.Fungicide <.001
Sowing.Fungicide 0.009
Variety.Fungicide <.001
Site.Sowing.Fungicide <.001
Site.Variety.Fungicide <.001
Sowing date, variety and fungicide were also found to be significant as single factors (Table 55).
On average the early sowing had higher septoria severity than the late sowing (Figure 37) with
6.32% compared to 3.55%. When comparing the different varieties, on average the susceptible
group had the highest disease severity, significantly higher than the moderately susceptible and
moderately resistant (Table 56).
The interaction between variety and fungicide was also significant (Table 55). For the susceptible
group the low input programme significantly reduced septoria severity compared to the untreated,
the low and medium input programmes were statistically comparable, but the high input
programme significantly reduced septoria compared to the low. Whereas for the moderately
susceptible and moderately resistant groups there was no significant benefit from going above a
low input programme (Table 56). However, the interaction between site, variety and fungicide was
also significant suggesting that the relationship between variety and fungicide was not consistent
by site (Appendix 22).

71
Table 56: Average septoria severity (%) on leaf 2 at T2 + 6-8 weeks for the variety and fungicide interaction in medium pressure sites, 1, 4, 8, 9 and 25.
Fungicide Variety Untreated Low Medium High Average Susceptible 18.13 3.65 2.04 1.49 6.33 Moderately Susceptible 13.85 2.45 1.63 1.13 4.76
Moderately Resistant 8.78 3.05 1.37 1.64 3.71
Average 13.59 3.05 1.68 1.42 Variety Fungicide Var.Fung. P Value <.001 <.001 <.001 LSD 1.078 1.244 2.155
When comparing variety, sowing date and fungicide effects (Figure 37), late sowings appeared to
consistently reduce septoria severity across all varieties and fungicide programmes. As a result,
the moderately susceptible variety sown mid-October was comparable to the moderately resistant
variety sown mid-September.
Figure 37: Average septoria severity (%) on leaf 2 at T2 + 6-8 weeks, for the interaction of sowing date, variety and fungicide in medium pressure sites, 1, 4, 8, 9 and 25. Error bars show the LSD for the interaction between variety and fungicide.
Yield Yields in this medium pressure group ranged from 8.36t/ha at site 8 to 10.51t/ha at site 1.
0
10
20
30
40
50
60
Susceptible ModeratelySusceptible
ModeratelyResistant
Susceptible ModeratelySusceptible
ModeratelyResistant
Mid September Sown Mid October Sown
% L
eaf a
rae
affe
cted
by
sept
oria
on
leaf
2
Untreated Low Medium High

72
Table 57: Factors and interactions found to be statistically significant (P<0.05) by analysis of variance for yield in medium pressure sites.
Factor P Value
Site 0.002
Site.Sowing 0.041
Variety <.001
Fungicide <.001
Site.Variety <.001
Site.Fungicide 0.032
Variety.Fungicide 0.032
Site.Sowing.Variety <.001
As well as site, variety and fungicide were also found to be significant as a single factor (Table 57).
When comparing the different varieties, the susceptible group achieved the highest yield on
average, significantly higher than the moderately susceptible and moderately resistant (Table 58).
There was a significant interaction between variety and fungicide (Table 57). On susceptible
varieties, the low and medium programmes were statistically comparable, but the high input
programme significantly increased yields compared to the low. For the moderately susceptible
varieties, the low and medium input programme were also comparable but the high input
programme significantly increased yields above that of the medium. Whereas for the moderately
resistant varieties there was no significant benefit from applying above a low input programme
(Table 58). In this instance sowing date was not a significant factor affecting yield (Figure 38).
Table 58: Average yield (t/ha) for the variety and fungicide interaction in medium pressure sites, 1, 8, 9 and 25.
Fungicide Variety Untreated Low Medium High Average Susceptible 9.07 10.30 10.51 10.77 10.16 Moderately Susceptible 8.99 9.95 9.88 10.31 9.78
Moderately Resistant 9.10 9.77 10.00 9.94 9.70
Average 9.06 10.01 10.13 10.34 Variety Fungicide Var.Fung. P Value <.001 <.001 0.032 LSD 0.182 0.21 0.364

73
Figure 38: Average yield (t/ha), for the interaction of sowing date, variety and fungicide in medium pressure sites, 1, 8, 9 and 25. Error bars show the LSD for the interaction between variety and fungicide.
4.4.3. High disease pressure
T2 + 2-3 weeks disease assessment Average septoria severity in the high-pressure group ranged from 4.08% at site 24, to 19.39% at
site 13.
Table 59: Factors and interactions found to be statistically significant (P<0.05) by analysis of variance for septoria severity on leaf 3 at T2 + 2-3 weeks in high pressure sites.
Factor P Value
Site <.001
Sowing <.001
Site.Sowing <.001
Variety <.001
Fungicide <.001
Site.Variety <.001
Sowing.Variety <.001
Site.Fungicide <.001
Sowing.Fungicide <.001
Variety.Fungicide <.001
Site.Sowing.Variety <.001
Site.Sowing.Fungicide <.001
Site.Variety.Fungicide <.001
Site.Sowing.Variety.Fungicide <.001
0
2
4
6
8
10
12
Susceptible ModeratelySusceptible
ModeratelyResistant
Susceptible ModeratelySusceptible
ModeratelyResistant
Mid September Sown Mid October Sown
Yiel
d (t/
ha)
Untreated Low Medium High

74
Site, sowing date, variety and fungicide were all found to be significant as single factors (Table 59).
On average, early sowing had higher disease severity than late sowing with 10.87% compared to
4.79%. When comparing the different varieties, under high disease pressure, each group was
found to be significantly different, with the highest disease severity in the susceptible group and the
lowest in the moderately resistant (Table 60).
There was a significant interaction between variety and fungicide (Table 59). In both the
susceptible and moderately susceptible groups, the low input programme significantly reduced
septoria severity compared to the untreated, the low and medium inputs were comparable, but the
high input programme significantly reduced septoria compared to the medium. Whereas in the
moderately resistant varieties there was no significant benefit from going above a low input
programme (Table 60). However, the interaction between site, variety and fungicide was also
significant suggesting that this relationship varied by site (Appendix 23).
Table 60: Average septoria severity (%) on leaf 3 at T2 + 2-3 weeks for the variety and fungicide interaction in high pressure sites, 3, 6, 12, 13, 19 and 24.
Fungicide Variety Untreated Low Medium High Average Susceptible 31.14 9.71 9.67 4.95 13.87 Moderately Susceptible 14.47 4.31 4.88 2.29 6.49
Moderately Resistant 7.59 1.64 2.32 1.05 3.15
Average 17.73 5.22 5.62 2.77 Variety Fungicide Var.Fung. P Value <.001 <.001 <.001 LSD 1.073 1.238 2.145
The interaction between sowing date, variety and fungicide was not significant in this case.
However, it is clear that sowing in mid-October reduced septoria severity in the untreated of each
variety compared to when sown mid-September. As a result, a susceptible variety sown mid-
October was comparable to a moderately susceptible variety sown mid-September (Figure 39).

75
Figure 39: Average septoria severity (%) on leaf 3 at T2 + 2-3 weeks, for the interaction of sowing date, variety and fungicide in high pressure sites, 3, 6, 12, 13, 19 and 24. Error bars show the LSD for the interaction between variety and fungicide.
T2 + 6-8 weeks disease assessment Average septoria severity at this time on leaf 2 varied significantly from 12.74% on average at site
12, to 30.07% at site 22.
Table 61: Factors and interactions found to be statistically significant (P<0.05) by analysis of variance for septoria severity on leaf 2 at T2 + 6-8 weeks in high pressures sites.
Factor P Value
Site <.001
Sowing <.001
Site.Sowing 0.002
Variety <.001
Fungicide <.001
Site.Variety <.001
Site.Fungicide <.001
Variety.Fungicide <.001
Site.Sowing.Variety 0.003
Site.Sowing.Fungicide 0.009
Site.Variety.Fungicide <.001
Sowing.Variety.Fungicide 0.001
Sowing, variety and fungicide were also found to be significant factors affecting septoria severity at
this time (Table 61). On average, early sowing had higher disease severity than late sowing with
0
5
10
15
20
25
30
35
40
45
Susceptible ModeratelySusceptible
ModeratelyResistant
Susceptible ModeratelySusceptible
ModeratelyResistant
Mid September Sown Mid October Sown
% L
eaf a
rea
affe
cted
by
sept
oria
on
leaf
3
Untreated Low Medium High
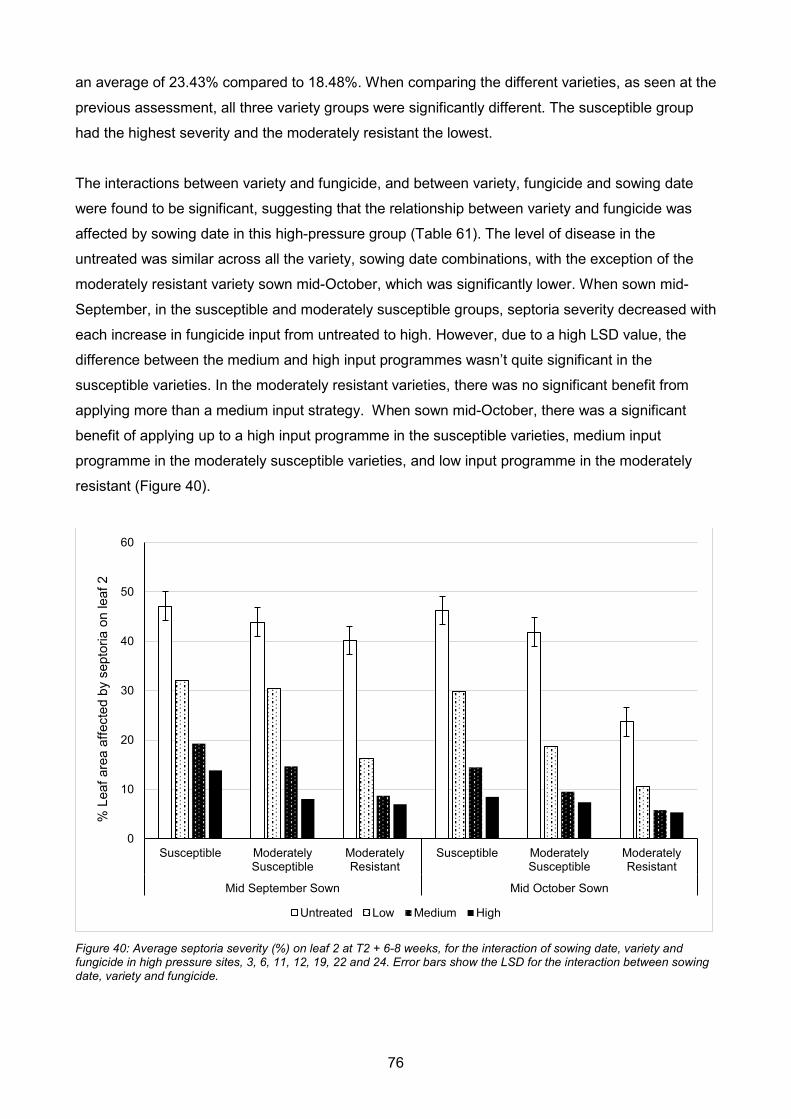
76
an average of 23.43% compared to 18.48%. When comparing the different varieties, as seen at the
previous assessment, all three variety groups were significantly different. The susceptible group
had the highest severity and the moderately resistant the lowest.
The interactions between variety and fungicide, and between variety, fungicide and sowing date
were found to be significant, suggesting that the relationship between variety and fungicide was
affected by sowing date in this high-pressure group (Table 61). The level of disease in the
untreated was similar across all the variety, sowing date combinations, with the exception of the
moderately resistant variety sown mid-October, which was significantly lower. When sown mid-
September, in the susceptible and moderately susceptible groups, septoria severity decreased with
each increase in fungicide input from untreated to high. However, due to a high LSD value, the
difference between the medium and high input programmes wasn’t quite significant in the
susceptible varieties. In the moderately resistant varieties, there was no significant benefit from
applying more than a medium input strategy. When sown mid-October, there was a significant
benefit of applying up to a high input programme in the susceptible varieties, medium input
programme in the moderately susceptible varieties, and low input programme in the moderately
resistant (Figure 40).
Figure 40: Average septoria severity (%) on leaf 2 at T2 + 6-8 weeks, for the interaction of sowing date, variety and fungicide in high pressure sites, 3, 6, 11, 12, 19, 22 and 24. Error bars show the LSD for the interaction between sowing date, variety and fungicide.
0
10
20
30
40
50
60
Susceptible ModeratelySusceptible
ModeratelyResistant
Susceptible ModeratelySusceptible
ModeratelyResistant
Mid September Sown Mid October Sown
% L
eaf a
rea
affe
cted
by
sept
oria
on
leaf
2
Untreated Low Medium High

77
Yield Of the 8 sites included in this high-pressure group, site 3 had the lowest yield with 9.89t/ha and site
12 the highest with 11.76t/ha.
Table 62: Factors and interactions found to be statistically significant (P<0.05) by analysis of variance for yield in high pressure sites.
Factor P Value
Site <.001
Sowing 0.004
Site.Sowing 0.008
Variety <.001
Fungicide <.001
Site.Variety <.001
Site.Fungicide <.001
Variety.Fungicide <.001
Site.Sowing.Variety <.001
Site.Variety.Fungicide <.001
Site, sowing date, variety and fungicide were all found to be significant factors affecting yield
(Table 62). On average, later sowing produced higher yields (Figure 41) with an average of
10.77t/ha, compared to 10.41t/ha when sown early. When comparing the different varieties, all
three were significantly different with the highest yield achieved by the moderately resistant group
and the lowest the susceptible (Table 63).
The interaction between variety and fungicide was also significant (Table 62). For the susceptible
group, yield increased with each increase in fungicide input from untreated to high, however the
difference between the medium and high input programmes wasn’t quite statistically significant. In
the moderately susceptible group, the low and medium input programmes were statistically
comparable but the high input programme significantly increased yield compared to the low.
Whereas in the moderately resistant variety there was no significant benefit from applying more
than a low input programme (Table 63). However, the interaction between site, variety and
fungicide was also significant, suggesting that this relationship varied by site (Appendix 24).

78
Table 63: Average yield (t/ha) for the variety and fungicide interaction in high pressures sites, 3, 6, 11, 12, 13, 19, 22 and 24.
Fungicide Variety Untreated Low Medium High Average Susceptible 8.82 10.19 10.86 11.10 10.24 Moderately Susceptible 9.51 10.84 11.06 11.26 10.67
Moderately Resistant 10.06 11.03 11.16 11.22 10.87
Average 9.46 10.69 11.03 11.19 Variety Fungicide Var.Fung. P Value <.001 <.001 <.001 LSD 0.119 0.138 0.238
Figure 41: Average yield (t/ha), for the interaction of sowing date, variety and fungicide in high pressure sites, 3, 6, 11, 12, 13, 19, 22 and 24. Error bars show the LSD for the interaction between variety and fungicide.
4.5. Impact of seed rate
Seed rate was included as a factor in trials completed between 2016 and 2018. All trials within this
period were analysed together to summarise the effect of seed rate on septoria.
0
2
4
6
8
10
12
Susceptible ModeratelySusceptible
ModeratelyResistant
Susceptible ModeratelySusceptible
ModeratelyResistant
Mid September Sown Mid October Sown
Yiel
d (t/
ha)
Untreated Low Medium High

79
Table 64: Factors and interactions containing seed rate, found to be statistically significant (P<0.05) by analysis of variance for septoria severity on leaf 3 at T2 + 2-3 weeks across sites from 2016 to 2018.
Factor P Value
Seed Rate 0.036
Site.Seed Rate <.001
Site.Sowing.Seed Rate 0.018
Site.Seed Rate.Variety 0.015
Site.Seed Rate.Fungicide <.001
Site.Sowing.Seed Rate.Fungicide 0.009
Sowing.Seed Rate.Variety.Fungicide 0.032
At T2 + 2-3 weeks, seed rate was found to be significant as a single factor (Table 64). On average
the high seed rate had greater septoria severity than the lower seed rate with 5.30% compared to
4.95%. However, the interaction between site and seed rate was also significant suggesting that
this response varied by site (Appendix 25).
Table 65: Factors and interactions containing seed rate, found to be statistically significant (P<0.05) by analysis of variance for septoria severity on leaf 2 at T2 + 6-8 weeks across sites from 2016 to 2018.
Factor P Value Site.Seed Rate.Fungicide 0.011
Site.Sowing.Seed Rate.Variety <.001
By T2 + 6-8 weeks there were no significant differences between seed rates with an average
septoria severity of 8.32% for the high, compared to 8.27% for the low. Furthermore, there were
very few significant interactions with seed rate at this time (Table 65).
Table 66: Factors and interactions containing seed rate, found to be statistically significant (P<0.05) by analysis of variance for yield across sites from 2016 to 2018.
Factor P Value
Seed Rate <.001
Site.Seed Rate <.001
Sowing.Seed Rate <.001
Site.Sowing.Seed Rate <.001
Site.Seed Rate.Variety 0.011
Site.Seed Rate.Fungicide 0.008
Site.Sowing.Seed Rate.Fungicide <.001
Site.Seed Rate.Variety.Fungicide 0.003
Sowing.Seed Rate.Variety.Fungicide 0.007
Seed rate was found to be a significant factor affecting yield, with an average of 10.01t/ha for the
high seed rate and 9.65t/ha for the low (Table 66). However, once again the interaction between
site and seed rate was significant suggesting that this relationship was not consistent across all
sites (Appendix 26). This could suggest that the plant population in the low seed rate treatments
was sub optimal for yield. The interaction between sowing date and seed rate was also found to be

80
significant. This is not surprising as both factors can influence yield in the absence of disease. On
average, both sowing dates in the high seed rate, and the low seed rate sown late were statistically
comparable. All had significantly higher yields than the low seed rate sown early (Table 67). The
low seed rate in the late sowing and the high seed rate in the early sowing were both targeting 160
plants/m2, whereas the early sown low seed rate was targeting 80 plants/m2. Therefore, this data
suggests that the low seed rate used in this project for the early sowing was sub-optimal for yield.
However, the interaction between site, sowing date and seed rate was also significant suggesting
that this response was not consistent across sites (Appendix 27).
Table 67: Average yield (t/ha) for the interaction between sowing date and seed rate across all sites from 2016 to 2018, , excluding 4, 5 and 17.
Sowing High Seed Rate Low Seed Rate
Early 9.94 9.43
Late 10.08 9.88
P value <.001 LSD 0.226
4.6. How does sowing date affect resistance ratings?
Within this data, there was no correlation between the difference between average early sown and
late sown logit severity values and variety resistance ratings. There were also no significant
differences between the slope or intercepts of the fitted regression lines of early and late sown logit
severity values for the three different resistance groups. Therefore, a common regression line was
fitted to all of the data (Figure 42). The regression line shows that severity was lower on average in
late sown crops than early sown crops, when comparing crops sown at the same site in the same
year.

81
Figure 42: Regression line between average early-sown logit severity and late-sown logit severity.
The predicted effective septoria resistance ratings for early (average of 22nd September) and late
(average of 20th October) sown crops corresponding to each value of the Recommended List
resistance ratings (based on an average sowing date of 7th October) are shown in Figure 43.
Compared to the Recommended List ratings, on average early sowing decreased the effective
rating by approximately 0.6, whereas late sowing increased the effective rating by approximately
0.6, for the range of varietal resistance ratings tested in this project.
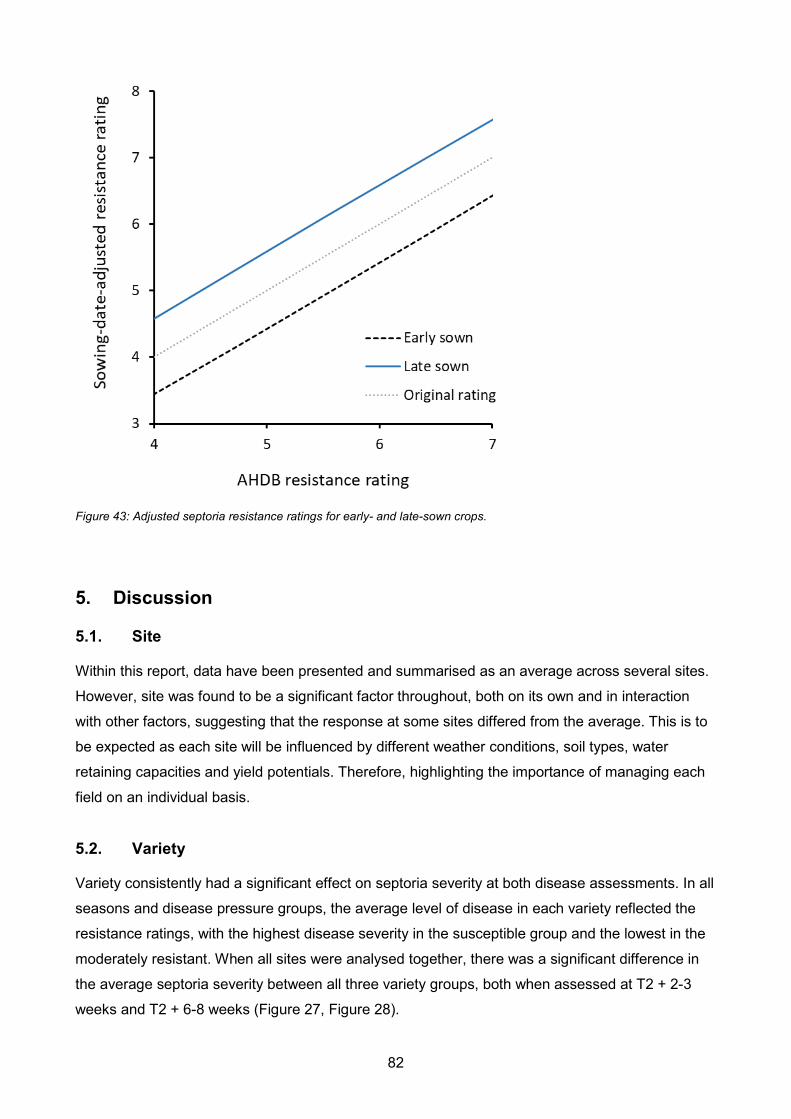
82
Figure 43: Adjusted septoria resistance ratings for early- and late-sown crops.
5. Discussion
5.1. Site
Within this report, data have been presented and summarised as an average across several sites.
However, site was found to be a significant factor throughout, both on its own and in interaction
with other factors, suggesting that the response at some sites differed from the average. This is to
be expected as each site will be influenced by different weather conditions, soil types, water
retaining capacities and yield potentials. Therefore, highlighting the importance of managing each
field on an individual basis.
5.2. Variety
Variety consistently had a significant effect on septoria severity at both disease assessments. In all
seasons and disease pressure groups, the average level of disease in each variety reflected the
resistance ratings, with the highest disease severity in the susceptible group and the lowest in the
moderately resistant. When all sites were analysed together, there was a significant difference in
the average septoria severity between all three variety groups, both when assessed at T2 + 2-3
weeks and T2 + 6-8 weeks (Figure 27, Figure 28).

83
Variety was also found to significantly affect yield in all seasons and disease pressure groups. The
highest yielding group in each season was driven by both disease and inherent differences in the
yield potential of each variety. As disease pressure varied by season, and the varieties used
changed over the course of the project, the highest yielding group differed. When averaged across
all sowing dates and fungicide programmes, in 2016 (Table 10), 2019 (Table 30) and 2020 (Table
37), the moderately resistant variety group achieved the highest yields, whereas in 2017 (Table 17)
and 2018 (Table 24), the susceptible group achieved the highest yields. This was because in 2016,
2019 and 2020, across the fungicide programmes yields were generally lower for the susceptible
group than the moderately resistant. In 2017 and 2018 the susceptible group had the highest
treated yields, resulting in a higher yield than moderately resistant varieties on average. The
susceptible and moderately resistant varieties in trials between 2016 to 2018 were pre-dominantly
represented by Santiago and Revelation. Santiago had higher treated yields in 2017 and 2018
because Santiago was a higher yielding variety, with a difference of 5% compared to Revelation in
2017 RL trials and 4% in 2018 (AHDB, 2020b). The results in 2016 were influenced by high
disease pressure in Ireland resulting in lower yields for the susceptible variety, Cordiale, and
therefore a lower yield on average than the moderately resistant varieties.
The effect of variety on septoria severity has been widely reported. Gladders et al. 2001, found that
the use of more resistant varieties reduced the severity of septoria, with very few crops exceeding
the 5% severity threshold, where varieties with a resistance rating of 7 were grown. Analysis of the
weather factors that influence septoria showed that all varieties were influenced by similar weather
factors, however, rainfall appeared to be more important for resistant varieties, than those that
were intermediate. Therefore, suggesting that more rain is required in resistant varieties to
generate a damaging epidemic (te Beest et al. 2009). This will in part be due to resistance genes
which affect the development of the pathogen within the plant (Brown et al. 2015). But may also be
due to differences in the canopy architecture enabling disease escape (Lovell et al. 2004).
In this project, the use of susceptible varieties resulted in greater yield loss than resistant varieties,
a finding supported by Said et al. (2016) and observed in the AHDB Recommended List (AHDB
2021). When all sites were analysed together, the susceptible group had the lowest yield when left
untreated, followed by the moderately susceptible, and the moderately resistant achieved the
highest yield when averaged across sowing date. As a result, the response to the high input
fungicide programme was highest in the susceptible varieties with an average increase of 1.71t/ha,
and lowest in the moderately resistant with an increase of 0.90t/ha (Figure 30).

84
Variety is undoubtably an important factor for the control of septoria. The use of more resistant
varieties reduces the risk of a damaging epidemic and substantial yield loss. As such, variety
choice should be utilised as a risk management strategy.
5.3. Fungicides and interactions with Variety
As with variety, fungicide was consistently found to have a significant effect on disease control and
yield. The use of fungicides significantly reduced disease levels and increased yields in all seasons
and disease pressure groups, showing the value of fungicides for control of septoria. However, the
differences between the different fungicide programmes varied by variety, season and disease
pressure. For the susceptible varieties, there was a significant benefit in yield from applying up to a
medium input strategy in 2017 (Table 17), 2018 (Table 24) and 2019 (Table 30) and a high input
strategy in 2016 (Table 10) and 2020 (Table 37). For the moderately susceptible varieties there
was a significant benefit in yield from applying up to a low input strategy in 2017, medium input
strategy in 2016 and 2018 and a high input strategy in 2019 and 2020. Whereas for the moderately
resistant group there was a significant benefit in yield from applying up to a low input strategy in
2017, 2018 and 2019, medium in 2016 and high in 2020. It was noted that in 2020, there was a
bigger difference between the medium and high input strategies, which could be due in part to the
inclusion of new chemistry, Revystar XE (fluxapyroxad and mefentrifluconazole), in the high input
programme. Furthermore, the moderately resistant variety in 2020 was Firefly (rated 7 out of 9 on
th AHDB recommended list). This variety performed poorly overall in these trials and in the AHDB
RL in 2020 conditions, with a reduction of 6% in the untreated yield compared to the 5 year mean
in RL trials (AHDB, 2020b). It is thought this may have been due to climatic conditions that didn’t
suit this variety, or the possible presence of yellow or brown rust. Both were reported in some
crops of Firefly in 2020. Although not recorded here it is possible that yellow rust early in the
spring, or brown rust at the end of the season, may have negatively affected Firefly in these trials.
This would explain the requirement for a high input programme in moderately resistant varieties for
this season alone. On average, across all sites and seasons, there was a yield benefit from
applying up to a high input programme in the susceptible and moderately susceptible varieties, and
low input programme in the moderately resistant (Table 43). The effect of fungicide on specific
weight tended to be smaller than the effect on yield with a reduction in specific weight where
septoria was not adequately controlled (Table 19). This suggests that for susceptible varieties a
medium to high input programme is often required, whereas in more resistant varieties (rated 6 and
above) a low to medium input strategy is usually more appropriate.
When yield is converted to output, it is clear that the increase in output from fungicides is much
less in more resistant varieties (Table 45). As such it may be easy to overspend when accounting
for the cost of fungicide applications, which could reduce margins. A similar study that looked at
optimum fungicide dose for margin, in moderate to high pressure situations in Ireland, found that

85
two applications at half rate of either azole only or azole + SDHI, resulted in a higher margin in
varieties with a resistance rating of 8 than where the full rate was applied in varieties rated 5 and 7
(Lynch et al. 2017). It has also been shown that there is potential for the cost of control of
diseases to be almost halved if resistant varieties are chosen (Jørgensen et al. 2014). This
suggests that tailoring of fungicide inputs to the variety can be of economic benefit.
Fungicides have been relied on for control of septoria. However, this had led to resistance
development in all single-site modes of action. Since 1970, when systemic fungicides were
introduced, the incidence of resistance has increased, and the time taken for resistance to emerge
has decreased. In some cases, resistance has been detected within two years of a product being
brought to the market (Brent and Hollomon, 2007). At the time of writing, the two most effective
and widely used modes of action against septoria, azoles and SHDIs, are decreasing in efficacy.
Studies investigating the efficacy of epoxiconazole and prothioconazole, concluded that the effect
of these actives on septoria has become more variable, and efficacy has declined over the last
decade (Blake et al. 2018, Jørgensen et al. 2020). Furthermore, isolates that result in a moderate
loss of sensitivity to SDHIs (C-W80S, C-N86S and C-T79N) have been detected in the UK, as has
C-H152R isolate which has a stronger impact on SDHI sensitivity (Rehfus et al. 2018). Therefore,
the effective life of existing and new chemistry must be protected through the use of resistance
management strategies. The Fungicide Resistance Action Group UK (FRAG-UK, 2021) guidance
supports the use of reduced rates and mixtures in reducing selection pressure for resistance and
stewarding products based on field and modelling data (Hobbelen et al. 2014).
Furthermore, the move to more stringent registration criteria, which includes consideration on the
risks products pose to human health, has resulted in the withdrawal of a number of active
ingredients including chlorothalonil and epoxiconazole (Hillocks 2012). Therefore, as the number of
available actives decreases, and those that are available are at risk of resistance development,
even with the addition of new chemistry, it is vital that growers adopt an Integrated Pest
Management (IPM) approach to disease control. Reducing reliance on pesticides through the use
of cultural control measures (variety and sowing date).
5.4. Sowing date
Sowing date was frequently observed as a significant factor affecting septoria severity in this
project. This effect was clearest at the first disease assessment, where in each season, early
sowing consistently increased septoria severity, compared to late sowing. The impact of sowing
date could still be found at the second disease assessment, on average early sowing had higher
septoria severity than late sowing in 3 of the 5 seasons (2017, 2019 and 2020). In 2016 and 2018,
the differences were negligible (Figure 8, Figure 16). Furthermore, when the sites were analysed
by disease pressure, the differences between early and late sowings appeared to be greater under

86
higher disease pressure situations. At the first assessment, disease severity increased
incrementally in the early sown, compared to the late, for the low, medium and high disease
pressure site groups respectively (Figure 33, Figure 36, Figure 39). At the second assessment,
disease pressure was marginally higher in the late sowings for the low disease pressure group
(Figure 34), whereas in the medium and high disease pressure groups disease severity was
significantly higher in the early sowings (Figure 37, Figure 40).
Sowing date was found to significantly affect yield in 2016, 2019 and in the high disease pressure
group. In all three cases, later sowings had higher yields than the early (Figure 9, Figure 21, Figure
41). Sowing date was only found to significantly affect specific weight in 2016, where on average,
the late sowings had higher specific weight than the early (Figure 10). However, this response in
yield and specific weight could be, in part, due to conditions being more favourable during grain
filling for the later sown crops.
These results are supported by the survey of diseases in treated winter wheat crops in England
and Wales from 1976 to 1988, which found higher disease levels in the earlier sown crops in 1979,
1987 and 1988. However, in 1981 and 1985 the disease was more severe in later sown crops
(Polley et. al. 1991). When summarising the survey data from 1985 to 1996, it was reported that
there was a substantial reduction in the number of crops which exceeded the 5% severity threshold
when delaying sowing. Crops sown in November rarely exceeded the threshold, and the risk of
disease was reduced by sowing in October rather than September (Gladders et al. 2001). This is
because seedlings from crops sown in early autumn will emerge earlier than later sown crops,
while temperatures are higher, and therefore more conducive to the establishment of septoria
(Fones et al. 2015, Meynard et al. 2003). As a result, the start of the epidemic is earlier in early
sown crops, resulting in higher levels of disease.
In this project, early sowing (average date of 22nd September) was predicted to decrease the
effective varietal septoria resistance rating by 0.6 compared to the average represented by the
Recommended List ratings (average sowing date of 7th October), whereas late sowing (average
date 20th October) was predicted to increase the effective resistance rating by 0.6, for the range of
varietal resistance ratings tested in this project (Figure 43). Therefore, suggesting that delaying
drilling by 4 weeks from the 22nd September to 20th October reduced the resistance rating of a
variety by approximately 1.2. This analysis provides an estimate of the effect of early or late sowing
on septoria disease risk on a scale that is familiar to growers and can be used to support variety
selection and management decisions.
This work indicates that sowing date is an important factor that should be considered in control of
septoria. Whilst chemistry is available for the control of this disease, this may be unlikely to govern

87
growers’ decisions, as later sowings are at increased risk of adverse weather conditions, creating
inappropriate sowing conditions that can prevent winter sown crops from being planted at all.
However, many factors govern sowing date, winter wheat crops are sown from late August to early
March in some instances, the knowledge that later sowings may require less fungicide than early
sowings should allow growers to adjust their programmes to good effect. Additionally, when sowing
several varieties of different resistance ratings, it would be advantageous to drill the most resistant
varieties first, and leave the most susceptible to last, where all other agronomic factors are equal.
5.5. Seed rate
Higher seed rates were associated with higher levels of disease at some sites and in some
seasons (particularly 2018) however the effects tended to be small and often inconsistent. At the
first assessment (T2 + 2-3 weeks), seed rate was only found to be a significant factor in 2018
(Table 20). Here the higher seed rate appeared to slightly increase septoria severity compared to
the low, with 9.04% compared to 7.84% respectively. Therefore, when all sites were analysed
together from 2016 to 2018, seed rate was found to be significant (Table 64). At the second
assessment (T2 + 6-8 weeks), seed rate was also only a significant factor in 2018, with higher
septoria severity, where higher seed rates were used (Table 22). However, the difference between
seed rates were even smaller with 3.15% in the low compared to 3.92% in the high, and therefore
when all sites were analysed together, seed rate was not found to be significant. It is possible that
the effect of seed rate was more visible in 2018 due to high rainfall during March and April,
promoting the development of septoria early in the season, before tiller death. At this stage, the
difference in the number of shoots/m2 between the different seed rates may have been more
influential. Tillers die between stem extension and flowering with higher losses in crops with more
shoots, therefore reducing the difference in shoots/m2 between high and low seed rates.
Seed rate was found to significantly increase yields in all three seasons where seed rate was
investigated (2016, 2017 and 2018) (Table 9, Table 16, Table 23) and was also significant when all
sites were analysed together (Table 66). Drilling at lower seed rates can increase the risk of poor
crop establishment, particularly in wet seasons or locations with high slug counts where
establishment is reduced. It is considered the low seed rates used in this project in some cases
may have resulted in sub-optimal plant populations for yield. For specific weight, seed rate was
only significant in 2016 (Table 11), where the higher seed rate resulted in higher specific weight.
These effects on yield and specific weight are not surprising, as seed rate can influence yield and
grain quality in the absence of disease.
Changing the seed rate of a crop can alter the crop canopy microclimate. High seed rates have
been shown to reduce temperature and increase relative humidity, resulting in increased septoria
severity (Tompkins et. al. 1993). Other work has shown that disease increased progressively with

88
each increase in tiller density. However, significant differences in disease were only observed at
tiller densities well below optimal for crop yield (Ansar et. al. 2010). Crop density may have positive
and negative effects on the progress of the septoria epidemic. A more conducive canopy
microclimate may be partly countered by less splash dispersal and poorer movement of inoculum
in a denser canopy (Eyal 1981). Although increasing seed rate may increase septoria severity, it is
considered that this effect is small and inconsistent and as such, it is thought to be the least
important of the factors tested.
6. Conclusion
This project has shown that seed rate, sowing date, variety and fungicide can all affect septoria
severity in crops of winter wheat. In some cases, increased seed rates resulted in higher septoria
severity values by generating a more conducive microclimate for disease. However, this effect was
often small and inconsistent, and as such seed rate is thought to be the least important of the
factors tested. Sowing in mid-September often resulted in higher disease pressure than sowing in
mid-October, as early sown crops were exposed to septoria spores earlier in the season when
conditions are more favourable for disease establishment. Sowing date was found to be an
important factor that should be considered when establishing a crop and deciding on fungicide
inputs. For example, when sowing several varieties of different resistance ratings, the most
resistant varieties should be drilled first, and the most susceptible left to last, where all other
agronomic factors are equal. However, the most influential factors were variety and fungicide which
cannot be discussed in isolation, as the effect of fungicides varied by variety. The severity of
septoria was lower in varieties with greater resistance to this pathogen, and therefore the yield
response and increase in output from fungicides was also lower than in susceptible varieties,
presenting growers the opportunity to reduce their fungicide inputs in order to maximise margins.
As restrictions on fungicide use and development of resistance reduce the number of actives
available for use on septoria, growers should utilise all available tools using an IPM approach.
Management strategies for the control of this pathogen should start before the crop is drilled by
careful selection of variety, using the AHDB RL, and consideration of sowing date. Fungicide use
should be the last line of defence and should take into account both the variety and sowing date.
This project targeted Septoria at T1 and T2, with an overspray at T3. Rust risk was reduced with a
strobilurin spray at T0. The level of input targeting septoria was altered by changing the products
and rates used. However, the same can be achieved by reducing the number of applications. With
the development of more resistant varieties, it raises the question whether a two spray programme
or even a single fungicide application is more appropriate in some instances. Future work would
benefit from investigating the value of spray timings in resistant varieties to provide growers the
confidence to reduce inputs in this way.

89
7. References
AHDB, Cereals and Oilseeds. 2020a. “Encyclopaedia of cereal diseases.” AHDB Website.
Accessed March 1st, 2021. https://ahdb.org.uk/encyclopaedia-of-cereal-diseases. —. 2020b. “Recommended lists for cereals and oilseeds (RL) harvest results (archieve).” AHDB
Website. December 3. Accessed March 29, 2021. https://ahdb.org.uk/knowledge-
library/recommended-lists-for-cereals-and-oilseeds-rl-harvest-results-archive.
AHDB, Cereals and Oilseeds. 2021. “Recommended Lists for cereals and oilseeds (RL).” AHDB
Website. . Accessed February 26th, 2021. https://ahdb.org.uk/rl.
Ansar, M., Nasir Mahmood Cheema and Leitch, M. H. 2010. “Effect of agronomic practices on the
development of septoria leaf blotch and its subsequent effect on growth and yield
components of wheat.” Journal of Botany 43(3). 2125-2138.
Blake, J. J., Gosling, P., Fraaije, B. A., Burnett, F. J., Knight, S. M., Kildea, S. and Paveley, N. D.
2018. “Changes in field dose–response curves for demethylation inhibitor (DMI) and
quinone outside inhibitor (QoI) fungicides against Zymoseptoria tritici, related to laboratory
sensitivity phenotyping and genotyping assays.” Pest Management Science 74. 302-313.
Brent, K. J. and Hollomon, D. W. 2007. “Fungicide resistance in crop pathogens: How can it be
managed?” In FRAC Monograph No.1 (second revised edition), 1-56. Brussels: FRAC.
Brown, J. K. M., Chartrain, L., Lasserre-Zuber, P. and Saintenac C. 2015. “Genetics of resistance
to Zymoseptoria tritici and applications to wheat breeding.” Fungal Genetics and Biology
79. 33-41.
Eyal, Z. 1981. “Integrated control of septoria diseases of wheat.” Plant disease 65. 763-768.
Eyal, Z., Scharen, A. L., Prescott, J. M., van Ginkel, M. 1987. The septoria diseases of wheat:
Concepts and methods of disease management. Mexico, D.F.: CIMMYT.
Fones, H. and Gurr, S. 2015. “The impact of Septoria tritici blotch disease on wheat: An EU
perspective.” Fungal Genetics and Biology 79. 3-7.
FRAC. 2021. FRAC mode of action groups for recommendations. Accessed February 27th, 2021.
https://www.frac.info/fungicide-resistance-management/by-frac-mode-of-action-group.
FRAG-UK. 2021. The Fungicide Resistance Action Group (FRAG-UK). Accessed March 29, 2021.
https://ahdb.org.uk/knowledge-library/frag.
Gladders, P., Paveley, N. D., Barrie, I. A., Hardwick, N. V., Hims, M. J., Langton S. and Taylor, M.
C. 2001. “Agronomic and meteorological factors affecting the severity of leaf blotch caused
by Mycosphaerella graminicola in commercial wheat crops in England.” Annals of Applied
Biology 138. 301-311.
Hillocks, R. J. 2012. “Farming with fewer pesticides: EU pesticide review and resulting challenges
for UK agriculture.” Crop Protection 31. 85-93.
Hobbelen, P. H. F, Paveley, N. D. and van den Bosch, F. 2014. “The emergence of resistance to
fungicides.” PLoS ONE 9(3): e91910. doi:10.1371/journal.pone.0091910.

90
Jørgensen, L. N., Hovmøller, M. S., Hansen, J. G., Lassen, P., Clark, B., Bayles, R., Rodemann,
B., Flath, K., Jahn, M., Goral, T., Jerzy Czembor, J., Cheyron, P., Maumene, C., De Pope,
C., Ban, R., Nielsen, G. C., and Berg, G. 2014. “IPM strategies and their dilemmas
including an introduction to www.eurowheat.org.” Journal of Intergrative Agriculture 13(2).
265-281.
Jørgensen, L.N., Matzen, N., Heick, T.M., Havis, N., Holdgate, S., Clark, B., Blake, J., Glazek, M.,
Korbas, M., Danielewicz, J., Maumene, C. et al. 2020. “Decreasing azole sensitivity of Z.
tritici in Europe contributes to reduced and varying field efficacy.” Journal of Plant Diseases
and Protection. 1-15.
Lovell, D. J., Parker, S. R., Hunter, T., Welham, S. J. and Nichols, A. R. 2004. “Position of
inoculum in the canopy affects the risk of septoria tritici blotch epidemics in winter wheat.”
Plant Pathology 53. 11-21.
Lynch, J.P., Glynn, E., Kildea, S., and Spink, J. 2017. “Yield and optimum fungicide dose rates for
winter wheat (Triticum aestivum L.) varieties with contrasting ratings for resistance to
septoria tritici blotch.” Field Crops Research 204. 89-100.
MET Office. 2021a. Historic Station Data. Accessed 02 18, 2021.
https://www.metoffice.gov.uk/research/climate/maps-and-data/historic-station-data.
—. 2021b. UK Actual and Anomaly Maps. Accessed 02 18, 2021.
https://www.metoffice.gov.uk/research/climate/maps-and-data/uk-actual-and-anomaly-
maps.
Meynard, J., Doré, T. and Lucas, P. 2003. “Agronomic approach: cropping systems and plant
diseases.” Comptes Rendus Biologies 326(1). 37-46.
Pietravalle, S., Shaw, M. W., Parker, S. R. and van den Bosch, F. 2003. “Modeling of Relationships
between weather and Septoria tritici epidemics on Winter Wheat: A Critical Approach.”
Phytopathology Vol 93, No. 10 1329-1339.
Polley, R. W. and Thomas, M. R. 1991. “Surveys of diseases of winter wheat in England and
Wales, 1976 - 1988.” Annals of Applied Biology. 1-20.
Rehfus, A., Strobel, D., Bryson, R. and Stammler, G. 2018. “Mutations in sdh genes in field isolates
of Zymoseptoria tritici and impact on the sensitivity to various succinate dehydrogenase
inhibitors.” Plant Pathology 67. 175-180.
Said, A. and Hussien, T. 2016. “Effect of Septoria tritici blotch (Septoria tritici) on grain yield and
yield components of bread wheat.” Journal of Biology, Agriculture and Healthcare 6(17) 21-
28.
te Beest, D. E., Paveley, N. D., Shaw, M. W. and van den Bosch, F. 2013. “Accounting for the
economic risk caused by variation in disease severity in fungicide dose decisions,
exemplified for Mycosphaerella graminicola on winter wheat.” Phytopathology 103 (7). 666-
672.

91
te Beest, D. E., Shaw, M. W., Pietravalle, S. and van den Bosch, F. 2009. “A predictive model for
early-warning of septoria leaf blotch on winter wheat.” European Journal of Plant Pathology
124. 413-425.
Tompkins, D. K., Fowler, D. B. and Wright, A. T. 1993. “Influence of agronomic practices on
canopy microclimate and septoria develpment in no-till winter wheat produced in the
parkland region of Saskatchewan.” Canadian Journal of Plant Science 73. 331-344.
8. Appendix
Appendix 1: Average septoria severity (%) on leaf 3 at T2 + 2-3 weeks for the interaction between site, variety and fungicide in 2016. *Data which did not have a reliable score due to a lack of green leaf area.
Fungicide
Site Number Variety Untreated Low Medium High 1 Susceptible 8.41 1.77 1.88 0.73
Moderately Susceptible 4.47 1.21 0.71 0.65
Moderately Resistant 6.12 1.52 1.35 0.73
2 Susceptible * 1.66 0.44 0.95
Moderately Susceptible 5.72 5.11 1.39 1.59
Moderately Resistant 1.17 0.33 0.25 0.59
3 Susceptible 14.92 10.67 4.00 1.50 Moderately Susceptible 10.58 3.90 2.35 3.92
Moderately Resistant 5.42 3.08 3.42 1.42
4 Susceptible 5.08 0.21 0.26 0.28 Moderately Susceptible 3.71 0.04 0.01 0.00
Moderately Resistant 1.06 0.00 0.08 0.00
5 Susceptible 6.51 1.47 0.12 0.02 Moderately Susceptible 3.27 0.39 0.05 0.02
Moderately Resistant 0.38 0.03 0.03 0.00
6 Susceptible 12.77 6.60 3.77 3.31 Moderately Susceptible 8.00 4.71 3.06 2.40
Moderately Resistant 1.65 0.43 0.16 0.04
P Value <.001
LSD 2.489

92
Appendix 2: Average septoria severity (%) on leaf 2 at T2 + 6-8 weeks for the interaction between site, variety and fungicide in 2016. *Data which did not have a reliable score due to a lack of green leaf area.
Fungicide Site Number Variety Untreated Low Medium High
1 Susceptible 21.20 5.35 1.58 0.43 Moderately Susceptible 14.88 4.01 0.43 0.58
Moderately Resistant 11.68 4.29 0.82 0.23
2 Susceptible * 3.63 1.92 0.23
Moderately Susceptible 6.06 6.07 2.97 1.20
Moderately Resistant 2.75 0.83 0.50 0.25
3 Susceptible * 40.92 24.42 12.92 Moderately Susceptible * 16.46 13.04 17.17
Moderately Resistant 33.08 13.08 10.58 13.17
4 Susceptible 44.75 4.67 1.06 0.67 Moderately Susceptible 24.08 1.64 0.18 0.25
Moderately Resistant 13.00 0.60 0.12 0.13
5 Susceptible 42.84 4.22 1.76 0.30 Moderately Susceptible 18.38 2.02 1.09 0.18
Moderately Resistant 4.64 1.05 0.59 0.05
6 Susceptible 60.40 31.48 14.71 11.00 Moderately Susceptible 54.47 44.54 19.77 9.27
Moderately Resistant 10.23 7.24 4.79 4.60
P Value <.001
LSD 7.051 Appendix 3: Average yield (t/ha) for the interaction between site, variety and fungicide in 2016.
Fungicide
Site Number Variety Untreated Low Medium High 1 Susceptible 9.75 10.81 11.16 11.48
Moderately Susceptible 9.48 10.53 10.60 10.81
Moderately Resistant 9.33 9.57 10.36 10.22
2 Susceptible 4.15 3.97 5.16 5.38
Moderately Susceptible 4.35 4.69 5.36 5.47
Moderately Resistant 4.82 5.63 5.73 5.95
3 Susceptible 8.28 9.67 10.24 11.13 Moderately Susceptible 8.77 9.87 10.10 10.33
Moderately Resistant 8.66 9.28 9.74 9.99
6 Susceptible 8.76 9.67 10.15 10.58
Moderately Susceptible 8.97 9.27 10.38 10.53
Moderately Resistant 10.76 11.37 11.28 11.37
P Value <.001
LSD 1.006

93
Appendix 4: Average septoria severity (%) on leaf 3 at T2 + 2-3 weeks for the interaction between site, variety and fungicide in 2017. *Data which did not have a reliable score due to a lack of green leaf area.
Fungicide
Site Number Variety Untreated Low Medium High 7 Susceptible * 5.58 0.75 0.26
Moderately Susceptible 39.51 1.11 0.38 0.04
Moderately Resistant 20.56 1.12 0.33 0.10
8 Susceptible 16.50 4.54 2.92 1.92
Moderately Susceptible 10.13 5.00 2.08 1.08
Moderately Resistant 6.25 2.08 1.54 1.25
9 Susceptible 4.83 2.25 2.00 1.83 Moderately Susceptible 5.77 1.00 0.92 0.92
Moderately Resistant 3.92 1.92 1.42 0.42
10 Susceptible 12.49 2.18 0.33 0.37 Moderately Susceptible 10.50 6.17 0.19 0.21
Moderately Resistant 5.42 0.84 0.33 0.48
12 Susceptible 21.85 5.29 4.69 3.31 Moderately Susceptible 12.02 4.46 4.44 3.23
Moderately Resistant 5.85 1.96 2.04 1.96
P Value <.001
LSD 3.470

94
Appendix 5: Average septoria severity (%) on leaf 2 at T2 + 6-8 weeks for the interaction between site, sowing date, variety and fungicide in 2017. *Data which did not have a reliable score due to a lack of green leaf area.
Fungicide
Site Number Sowing Variety Untreated Low Medium High 8 Early Susceptible * 7.63 6.17 3.73
Moderately Susceptible * 6.70 6.89 4.89
Moderately Resistant 6.02 10.50 6.50 8.00
Late Susceptible * 6.76 3.17 0.92
Moderately Susceptible 10.05 3.67 2.01 0.67
Moderately Resistant 7.33 6.67 3.87 2.50
9 Early Susceptible * 5.21 4.39 3.83
Moderately Susceptible 20.58 5.67 2.67 1.50
Moderately Resistant 10.50 1.67 0.67 2.50
Late Susceptible 5.43 1.45 0.74 0.00
Moderately Susceptible 2.50 1.00 0.67 1.17
Moderately Resistant 2.50 0.33 0.00 0.00
11 Early Susceptible * 24.19 9.89 7.50
Moderately Susceptible * 18.31 6.30 6.98
Moderately Resistant 20.36 3.51 1.73 0.89
Late Susceptible * 14.13 4.05 2.80
Moderately Susceptible * 8.88 1.47 1.80
Moderately Resistant 14.42 1.48 0.30 0.45
12 Early Susceptible 49.67 10.21 7.21 5.62
Moderately Susceptible 33.71 9.17 6.25 5.42
Moderately Resistant 21.37 5.96 5.33 4.54
Late Susceptible 39.84 8.29 6.21 4.92
Moderately Susceptible 25.42 7.75 4.58 4.83
Moderately Resistant 15.17 6.58 4.46 4.37
P Value <.001
LSD 5.545
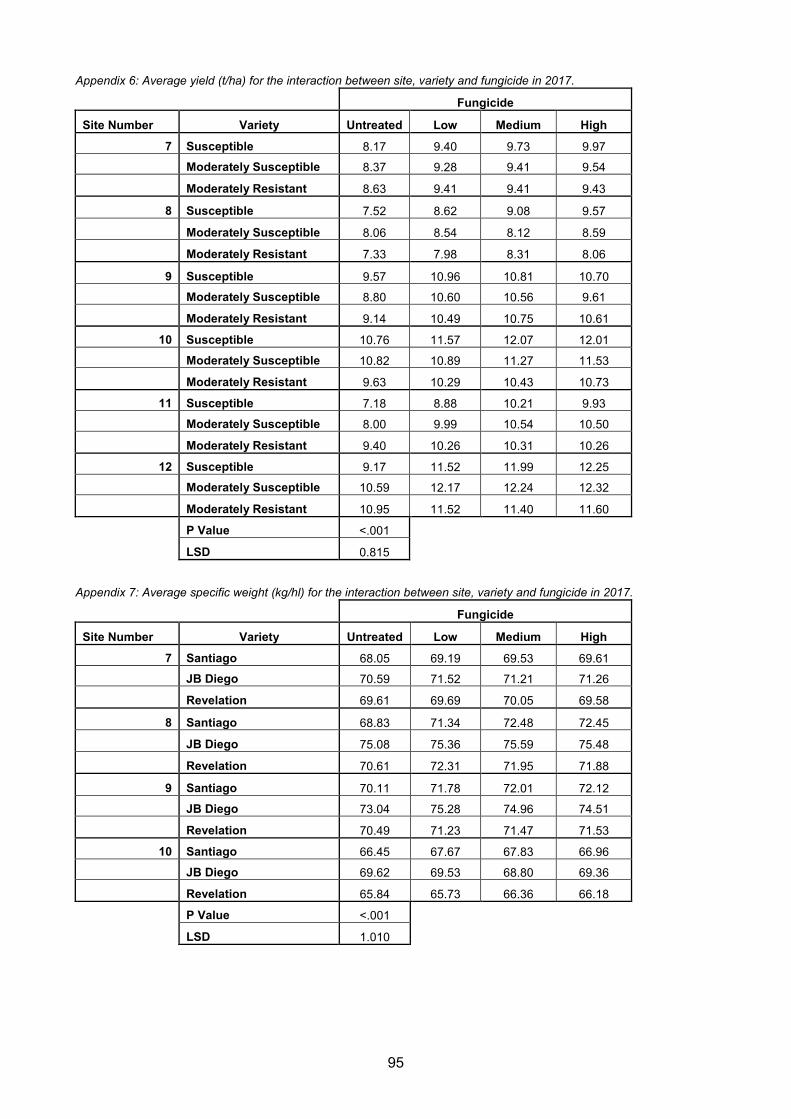
95
Appendix 6: Average yield (t/ha) for the interaction between site, variety and fungicide in 2017.
Fungicide
Site Number Variety Untreated Low Medium High 7 Susceptible 8.17 9.40 9.73 9.97
Moderately Susceptible 8.37 9.28 9.41 9.54
Moderately Resistant 8.63 9.41 9.41 9.43
8 Susceptible 7.52 8.62 9.08 9.57
Moderately Susceptible 8.06 8.54 8.12 8.59
Moderately Resistant 7.33 7.98 8.31 8.06
9 Susceptible 9.57 10.96 10.81 10.70 Moderately Susceptible 8.80 10.60 10.56 9.61
Moderately Resistant 9.14 10.49 10.75 10.61
10 Susceptible 10.76 11.57 12.07 12.01
Moderately Susceptible 10.82 10.89 11.27 11.53
Moderately Resistant 9.63 10.29 10.43 10.73
11 Susceptible 7.18 8.88 10.21 9.93
Moderately Susceptible 8.00 9.99 10.54 10.50
Moderately Resistant 9.40 10.26 10.31 10.26
12 Susceptible 9.17 11.52 11.99 12.25 Moderately Susceptible 10.59 12.17 12.24 12.32
Moderately Resistant 10.95 11.52 11.40 11.60
P Value <.001
LSD 0.815 Appendix 7: Average specific weight (kg/hl) for the interaction between site, variety and fungicide in 2017.
Fungicide
Site Number Variety Untreated Low Medium High 7 Santiago 68.05 69.19 69.53 69.61
JB Diego 70.59 71.52 71.21 71.26
Revelation 69.61 69.69 70.05 69.58
8 Santiago 68.83 71.34 72.48 72.45
JB Diego 75.08 75.36 75.59 75.48
Revelation 70.61 72.31 71.95 71.88
9 Santiago 70.11 71.78 72.01 72.12
JB Diego 73.04 75.28 74.96 74.51
Revelation 70.49 71.23 71.47 71.53
10 Santiago 66.45 67.67 67.83 66.96
JB Diego 69.62 69.53 68.80 69.36
Revelation 65.84 65.73 66.36 66.18
P Value <.001
LSD 1.010

96
Appendix 8: Average septoria severity (%) on leaf 3 at T2 + 2-3 weeks for the interaction between site, variety and fungicide in 2018.
Fungicide
Site Number Variety Untreated Low Medium High 13 Susceptible 73.23 12.31 31.55 13.09
Moderately Susceptible 38.05 4.64 11.36 3.84
Moderately Resistant 21.31 2.7 4.89 1.51
14 Susceptible 6.83 1.21 0.27 0.47
Moderately Susceptible 4.25 2.92 0.20 0.14
Moderately Resistant 2.79 0.48 0.68 0.96
15 Susceptible 9.11 2.68 3.00 3.08 Moderately Susceptible 5.10 3.08 3.51 4.08
Moderately Resistant 2.92 3.55 3.83 2.93
17 Susceptible 44.05 13.83 7.36 6.99 Moderately Susceptible 38.80 6.83 2.96 1.47
Moderately Resistant 13.29 2.10 0.00 0.00
18 Susceptible 16.73 7.17 5.35 5.81 Moderately Susceptible 17.44 7.50 5.52 6.83
Moderately Resistant 4.44 2.42 1.77 1.83
P Value <.001
LSD 5.115
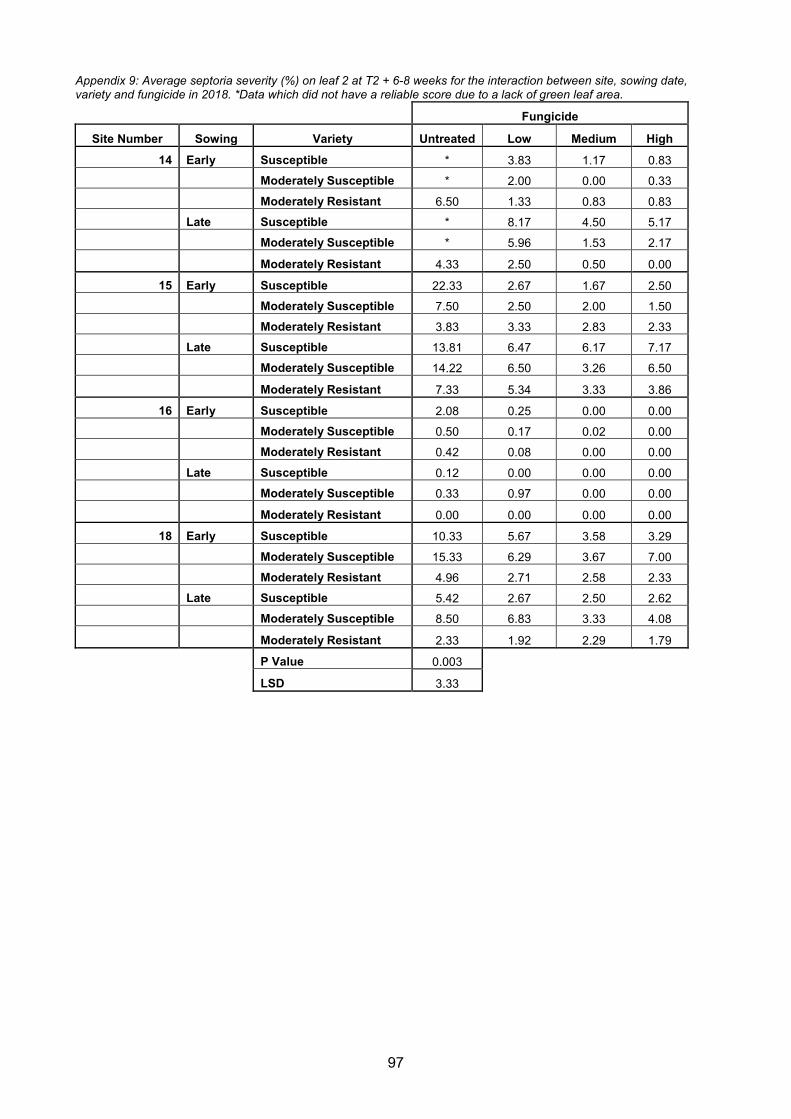
97
Appendix 9: Average septoria severity (%) on leaf 2 at T2 + 6-8 weeks for the interaction between site, sowing date, variety and fungicide in 2018. *Data which did not have a reliable score due to a lack of green leaf area.
Fungicide
Site Number Sowing Variety Untreated Low Medium High 14 Early Susceptible * 3.83 1.17 0.83
Moderately Susceptible * 2.00 0.00 0.33
Moderately Resistant 6.50 1.33 0.83 0.83 Late Susceptible * 8.17 4.50 5.17 Moderately Susceptible * 5.96 1.53 2.17
Moderately Resistant 4.33 2.50 0.50 0.00
15 Early Susceptible 22.33 2.67 1.67 2.50 Moderately Susceptible 7.50 2.50 2.00 1.50 Moderately Resistant 3.83 3.33 2.83 2.33 Late Susceptible 13.81 6.47 6.17 7.17 Moderately Susceptible 14.22 6.50 3.26 6.50
Moderately Resistant 7.33 5.34 3.33 3.86
16 Early Susceptible 2.08 0.25 0.00 0.00 Moderately Susceptible 0.50 0.17 0.02 0.00 Moderately Resistant 0.42 0.08 0.00 0.00
Late Susceptible 0.12 0.00 0.00 0.00 Moderately Susceptible 0.33 0.97 0.00 0.00
Moderately Resistant 0.00 0.00 0.00 0.00
18 Early Susceptible 10.33 5.67 3.58 3.29
Moderately Susceptible 15.33 6.29 3.67 7.00 Moderately Resistant 4.96 2.71 2.58 2.33 Late Susceptible 5.42 2.67 2.50 2.62 Moderately Susceptible 8.50 6.83 3.33 4.08
Moderately Resistant 2.33 1.92 2.29 1.79
P Value 0.003
LSD 3.33

98
Appendix 10: Average yield (t/ha) for the interaction between site, variety and fungicide in 2018.
Fungicide
Site Number Variety Untreated Low Medium High 13 Susceptible 9.89 11.29 11.05 11.59
Moderately Susceptible 10.05 10.81 10.83 10.93
Moderately Resistant 9.95 10.64 10.69 10.84
14 Susceptible 8.93 9.52 10.18 10.12
Moderately Susceptible 9.24 8.81 9.57 9.68
Moderately Resistant 9.66 9.97 10.08 10.03
15 Susceptible 11.49 11.74 12.35 11.97 Moderately Susceptible 10.02 10.55 10.94 10.49
Moderately Resistant 10.36 10.80 10.83 10.83
16 Susceptible 8.86 8.97 9.12 9.13
Moderately Susceptible 8.76 8.79 8.97 9.05
Moderately Resistant 8.54 8.83 8.92 9.18
18 Susceptible 10.91 11.37 12.27 12.12
Moderately Susceptible 10.28 12.50 12.72 12.46
Moderately Resistant 11.56 12.31 11.86 12.65
P Value <.001
LSD 0.554 Appendix 11: Average septoria severity (%) on leaf 3 at T2 + 2-3 weeks for the interaction between site, sowing date, variety and fungicide in 2019.
Fungicide
Site Number Sowing Variety Untreated Low Medium High 19 Early Susceptible 57.50 20.03 9.53 9.23
Moderately Susceptible 26.20 6.67 4.00 2.53
Moderately Resistant 7.40 2.50 1.37 1.67
Late Susceptible 28.93 3.33 1.47 1.33
Moderately Susceptible 5.90 1.23 0.40 0.17
Moderately Resistant 3.03 0.80 0.33 0.30
21 Early Susceptible 2.83 0.33 0.07 0.00
Moderately Susceptible 0.07 0.00 0.00 0.00
Moderately Resistant 0.33 0.17 0.00 0.00
Late Susceptible 1.50 1.00 0.07 0.33
Moderately Susceptible 0.00 0.00 0.00 0.00
Moderately Resistant 0.00 0.00 0.00 0.00
P Value 0.046
LSD 4.604

99
Appendix 12: Average septoria severity (%) on leaf 2 at T2 + 6-8 weeks for the interaction between site, variety and fungicide in 2019.
Fungicide
Site Number Variety Untreated Low Medium High 19 Susceptible 63.08 43.77 22.68 17.37
Moderately Susceptible 57.30 19.78 6.73 3.83
Moderately Resistant 35.92 8.27 2.50 2.58
20 Susceptible 3.67 0.00 0.00 0.00
Moderately Susceptible 1.67 0.50 0.00 0.00
Moderately Resistant 0.00 0.00 0.17 0.00
21 Susceptible 4.83 0.78 0.17 0.00 Moderately Susceptible 0.65 0.12 0.00 0.05
Moderately Resistant 0.20 0.00 0.00 0.00
22 Susceptible 64.39 43.47 18.10 13.94 Moderately Susceptible 46.12 34.44 13.17 10.07
Moderately Resistant 62.37 29.04 12.95 12.79
P Value 0.015
LSD 9.200 Appendix 13: Average yield (t/ha), for the interaction of site, variety and fungicide in 2019.
Fungicide
Site Number Variety Untreated Low Medium High 19 Susceptible 6.12 8.66 10.41 10.65
Moderately Susceptible 8.25 10.48 11.11 11.69
Moderately Resistant 10.43 12.03 12.46 12.45
20 Susceptible 10.11 11.19 11.44 11.69
Moderately Susceptible 9.79 9.31 9.91 10.36
Moderately Resistant 10.24 10.31 10.45 10.93
21 Susceptible 10.00 11.31 11.68 11.74 Moderately Susceptible 11.41 11.85 11.84 11.34
Moderately Resistant 11.93 12.47 12.37 11.71
22 Susceptible 9.81 10.72 10.92 11.00 Moderately Susceptible 9.63 10.81 10.29 10.71
Moderately Resistant 9.45 10.79 11.37 10.93
P Value <.001
LSD 0.689

100
Appendix 14: Average specific weight (kg/hl) for the interaction between site, variety and fungicide in 2019.
Fungicide
Site Number Variety Untreated Low Medium High 19 Santiago 62.72 67.83 69.59 69.93
Hardwicke 68.00 71.24 72.36 73.05
Graham 72.53 72.89 73.98 73.58
20 Santiago 72.66 73.77 73.87 73.48
Hardwicke 74.93 74.93 75.09 75.32
Graham 75.61 75.59 76.10 75.45
21 Santiago 66.18 68.55 67.55 68.01 Hardwicke 71.71 71.99 71.44 71.08
Graham 72.00 71.82 71.70 71.34
P Value 0.001
LSD 1.212 Appendix 15: Average septoria severity (%) on leaf 2 at T2 + 6-8 weeks for the interaction between site and fungicide in 2020.
Fungicide
Site Number Untreated Low Medium High
24 36.76 26.61 17.56 8.44
25 9.64 1.58 1.5 0.14
P Value <.001 LSD 4.697
Appendix 16: Average septoria severity (%) on leaf 3 at T2 + 2-3 weeks for the interaction between site, variety and fungicide across all sites. *Data which did not have a reliable score due to a lack of green leaf area.
Fungicide
Site Number Variety Untreated Low Medium High 1 Susceptible 7.40 1.77 1.12 0.80
Moderately Susceptible 4.43 1.37 0.87 0.47
Moderately Resistant 6.40 1.45 1.42 0.78
2 Susceptible * 0.87 0.00 0.00
Moderately Susceptible 7.77 2.99 1.04 2.94
Moderately Resistant 0.67 0.58 0.17 0.83
3 Susceptible 14.67 11.33 4.83 1.33
Moderately Susceptible 6.17 2.83 3.58 2.00
Moderately Resistant 4.83 1.83 2.83 1.50
4 Susceptible 5.75 0.22 0.28 0.23
Moderately Susceptible 3.50 0.05 0.02 0.00
Moderately Resistant 0.83 0.00 0.00 0.00
5 Susceptible 7.14 1.95 0.15 0.03
Moderately Susceptible 2.92 0.35 0.07 0.03
Moderately Resistant 0.37 0.00 0.07 0.00
6 Susceptible 13.71 7.62 4.00 3.37
Moderately Susceptible 7.91 5.33 2.83 2.83
Moderately Resistant 1.88 0.43 0.30 0.00

101
7 Susceptible * 4.31 0.49 0.14
Moderately Susceptible 36.16 0.20 0.21 0.04
Moderately Resistant 19.50 1.22 0.42 0.09
8 Susceptible 17.83 4.58 1.67 2.17
Moderately Susceptible 12.50 4.67 1.33 1.17
Moderately Resistant 8.83 2.50 0.75 0.83
9 Susceptible 5.17 2.67 2.83 2.33
Moderately Susceptible 6.92 1.00 1.00 1.17
Moderately Resistant 5.33 2.50 1.33 0.17
10 Susceptible 12.46 2.50 0.57 0.12
Moderately Susceptible 13.47 7.42 0.20 0.08
Moderately Resistant 5.67 1.50 0.13 0.03
12 Susceptible 27.12 5.25 5.46 3.79
Moderately Susceptible 10.00 4.33 4.92 3.58
Moderately Resistant 6.21 1.92 2.08 1.71
13 Susceptible 73.26 15.01 35.20 14.94
Moderately Susceptible 40.84 5.21 11.43 2.80
Moderately Resistant 24.07 2.82 5.67 1.47
14 Susceptible 7.83 1.00 0.42 0.37
Moderately Susceptible 5.83 3.17 0.28 0.00
Moderately Resistant 4.25 0.75 0.87 0.42
15 Susceptible 10.76 2.76 3.50 3.17
Moderately Susceptible 5.83 3.17 4.11 4.50
Moderately Resistant 2.33 4.19 3.83 3.36
17 Susceptible 43.52 14.23 9.88 8.51
Moderately Susceptible 40.55 5.81 4.95 2.45
Moderately Resistant 17.87 3.46 1.65 0.89
18 Susceptible 14.87 7.25 4.25 5.33
Moderately Susceptible 16.92 8.17 5.04 8.04
Moderately Resistant 5.33 2.50 1.67 1.67
19 Susceptible 43.22 11.68 5.50 5.28
Moderately Susceptible 16.05 3.95 2.20 1.35
Moderately Resistant 5.22 1.65 0.85 0.98
21 Susceptible 2.17 0.67 0.07 0.17
Moderately Susceptible 0.03 0.00 0.00 0.00
Moderately Resistant 0.17 0.08 0.00 0.00
24 Susceptible 14.83 7.33 3.00 1.00
Moderately Susceptible 5.83 4.17 4.33 1.17
Moderately Resistant 3.33 1.17 2.17 0.67
25 Susceptible 1.08 0.83 0.00 0.25
Moderately Susceptible 1.83 0.75 0.33 0.08
Moderately Resistant 0.50 0.25 0.00 0.00
P Value <.001
LSD 4.799
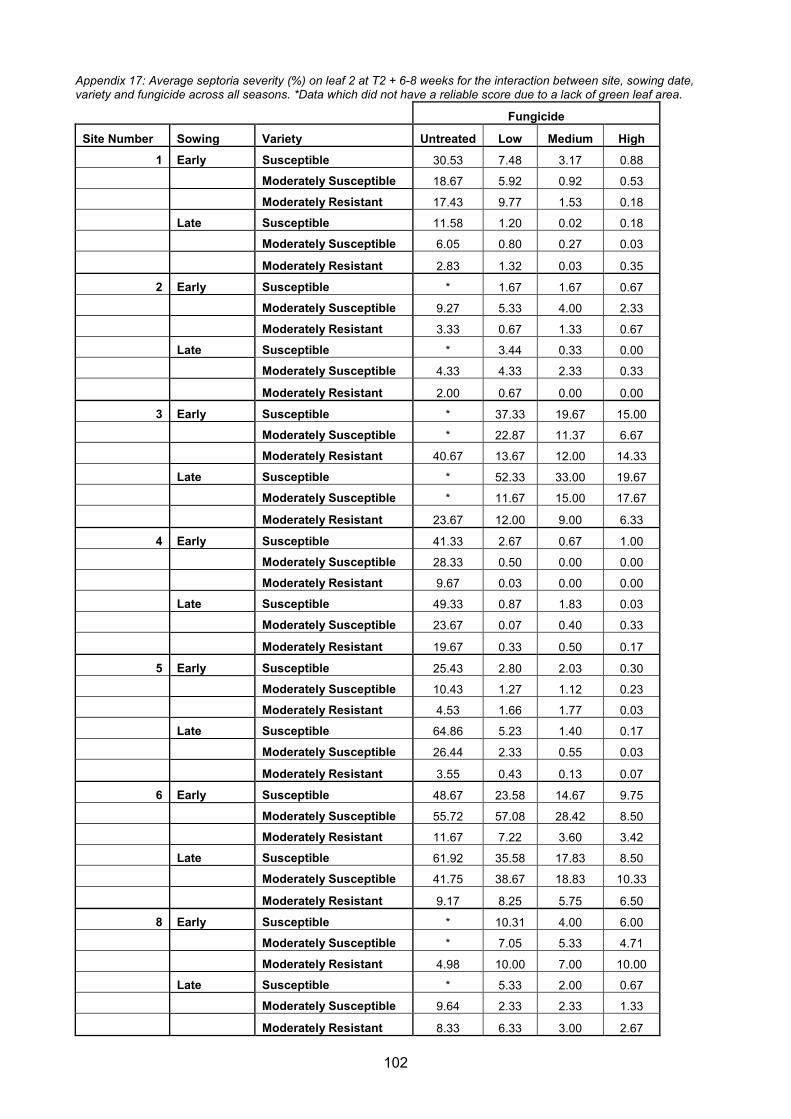
102
Appendix 17: Average septoria severity (%) on leaf 2 at T2 + 6-8 weeks for the interaction between site, sowing date, variety and fungicide across all seasons. *Data which did not have a reliable score due to a lack of green leaf area.
Fungicide
Site Number Sowing Variety Untreated Low Medium High 1 Early Susceptible 30.53 7.48 3.17 0.88
Moderately Susceptible 18.67 5.92 0.92 0.53
Moderately Resistant 17.43 9.77 1.53 0.18
Late Susceptible 11.58 1.20 0.02 0.18
Moderately Susceptible 6.05 0.80 0.27 0.03
Moderately Resistant 2.83 1.32 0.03 0.35
2 Early Susceptible * 1.67 1.67 0.67
Moderately Susceptible 9.27 5.33 4.00 2.33
Moderately Resistant 3.33 0.67 1.33 0.67
Late Susceptible * 3.44 0.33 0.00
Moderately Susceptible 4.33 4.33 2.33 0.33
Moderately Resistant 2.00 0.67 0.00 0.00
3 Early Susceptible * 37.33 19.67 15.00
Moderately Susceptible * 22.87 11.37 6.67
Moderately Resistant 40.67 13.67 12.00 14.33
Late Susceptible * 52.33 33.00 19.67
Moderately Susceptible * 11.67 15.00 17.67
Moderately Resistant 23.67 12.00 9.00 6.33
4 Early Susceptible 41.33 2.67 0.67 1.00
Moderately Susceptible 28.33 0.50 0.00 0.00
Moderately Resistant 9.67 0.03 0.00 0.00
Late Susceptible 49.33 0.87 1.83 0.03
Moderately Susceptible 23.67 0.07 0.40 0.33
Moderately Resistant 19.67 0.33 0.50 0.17
5 Early Susceptible 25.43 2.80 2.03 0.30
Moderately Susceptible 10.43 1.27 1.12 0.23
Moderately Resistant 4.53 1.66 1.77 0.03
Late Susceptible 64.86 5.23 1.40 0.17
Moderately Susceptible 26.44 2.33 0.55 0.03
Moderately Resistant 3.55 0.43 0.13 0.07
6 Early Susceptible 48.67 23.58 14.67 9.75
Moderately Susceptible 55.72 57.08 28.42 8.50
Moderately Resistant 11.67 7.22 3.60 3.42
Late Susceptible 61.92 35.58 17.83 8.50
Moderately Susceptible 41.75 38.67 18.83 10.33
Moderately Resistant 9.17 8.25 5.75 6.50
8 Early Susceptible * 10.31 4.00 6.00
Moderately Susceptible * 7.05 5.33 4.71
Moderately Resistant 4.98 10.00 7.00 10.00
Late Susceptible * 5.33 2.00 0.67
Moderately Susceptible 9.64 2.33 2.33 1.33
Moderately Resistant 8.33 6.33 3.00 2.67

103
9 Early Susceptible 14.33 4.67 4.33 5.67
Moderately Susceptible 15.48 2.67 2.67 2.33
Moderately Resistant 16.67 1.00 0.00 3.00
Late Susceptible 1.67 0.67 0.67 0.00
Moderately Susceptible 1.67 0.00 0.67 1.67
Moderately Resistant 2.33 0.67 0.00 0.00
11 Early Susceptible * 26.17 12.55 8.37
Moderately Susceptible * 18.46 5.44 6.08
Moderately Resistant 24.24 3.95 0.64 0.48
Late Susceptible * 12.59 4.52 4.23
Moderately Susceptible * 9.91 1.04 1.59
Moderately Resistant 15.83 1.40 0.27 0.79
12 Early Susceptible 51.33 10.08 6.75 6.17
Moderately Susceptible 33.00 10.50 7.58 5.25
Moderately Resistant 26.83 6.08 5.42 4.75
Late Susceptible 33.00 10.17 6.42 5.33
Moderately Susceptible 26.17 8.00 4.92 5.08
Moderately Resistant 16.67 7.50 4.58 4.08
14 Early Susceptible * 5.00 1.67 0.67
Moderately Susceptible * 2.33 0.00 0.67
Moderately Resistant 9.00 2.67 0.67 1.00
Late Susceptible * 8.67 5.00 6.33
Moderately Susceptible * 1.02 1.08 4.20
Moderately Resistant 3.67 2.00 0.67 0.00
15 Early Susceptible 33.33 3.67 2.00 2.00
Moderately Susceptible 9.33 3.00 2.67 1.33
Moderately Resistant 4.67 3.33 3.33 2.67
Late Susceptible 16.34 4.84 10.00 4.00
Moderately Susceptible 18.33 7.33 4.14 3.33
Moderately Resistant 9.00 7.64 4.33 5.14
16 Early Susceptible 2.33 0.33 0.00 0.00
Moderately Susceptible 0.67 0.33 0.00 0.00
Moderately Resistant 0.83 0.00 0.00 0.00
Late Susceptible 0.17 0.00 0.00 0.00
Moderately Susceptible 0.00 0.00 0.00 0.00
Moderately Resistant 0.00 0.00 0.00 0.00
18 Early Susceptible 9.67 6.00 2.33 2.67
Moderately Susceptible 15.08 7.50 2.17 8.33
Moderately Resistant 5.25 1.83 3.75 2.33
Late Susceptible 4.67 3.17 2.83 1.92
Moderately Susceptible 9.92 7.67 1.92 4.75
Moderately Resistant 3.08 2.00 3.00 2.58
19 Early Susceptible 66.33 59.17 39.00 30.53
Moderately Susceptible 62.83 36.73 11.67 6.40
Moderately Resistant 50.67 14.50 3.97 4.73

104
Late Susceptible 59.83 28.37 6.37 4.20
Moderately Susceptible 51.77 2.83 1.80 1.27
Moderately Resistant 21.17 2.03 1.03 0.43
20 Early Susceptible 7.00 0.00 0.00 0.00
Moderately Susceptible 3.00 0.67 0.00 0.00
Moderately Resistant 0.00 0.00 0.33 0.00
Late Susceptible 0.33 0.00 0.00 0.00
Moderately Susceptible 0.33 0.33 0.00 0.00
Moderately Resistant 0.00 0.00 0.00 0.00
21 Early Susceptible 5.67 1.17 0.17 0.00
Moderately Susceptible 0.47 0.00 0.00 0.03
Moderately Resistant 0.40 0.00 0.00 0.00
Late Susceptible 4.00 0.40 0.17 0.00
Moderately Susceptible 0.83 0.23 0.00 0.07
Moderately Resistant 0.00 0.00 0.00 0.00
22 Early Susceptible 68.40 37.62 17.38 15.48
Moderately Susceptible 49.00 26.72 13.04 11.85
Moderately Resistant 75.33 32.09 15.28 11.30
Late Susceptible 60.38 49.32 18.83 12.40
Moderately Susceptible 43.24 42.15 13.30 8.29
Moderately Resistant 49.42 26.00 10.61 14.29
24 Early Susceptible 52.37 30.00 25.00 11.67
Moderately Susceptible 33.79 40.00 25.00 11.67
Moderately Resistant 40.61 35.67 20.00 10.00
Late Susceptible 43.33 20.00 14.33 5.00
Moderately Susceptible 31.67 17.33 11.67 7.33
Moderately Resistant 29.83 16.67 9.33 5.00
25 Early Susceptible 16.00 0.83 2.00 0.00
Moderately Susceptible 15.67 3.50 2.17 0.17
Moderately Resistant 4.17 0.50 0.83 0.00
Late Susceptible 8.33 2.50 1.67 0.50
Moderately Susceptible 12.00 1.67 1.50 0.17
Moderately Resistant 1.67 0.50 0.83 0.00
P Value 0.002
LSD 9.963

105
Appendix 18: Average yield (t/ha) for the interaction between site, variety and fungicide across seasons.
Fungicide
Site Number Variety Untreated Low Medium High 1 Susceptible 9.96 10.88 11.51 11.98
Moderately Susceptible 9.61 10.47 10.74 11.05
Moderately Resistant 9.79 9.86 10.12 10.21
2 Susceptible 4.52 3.87 5.61 5.31
Moderately Susceptible 4.71 4.72 5.50 5.55
Moderately Resistant 4.99 5.74 5.70 5.98
3 Susceptible 8.42 9.73 10.39 11.30
Moderately Susceptible 9.06 10.16 10.43 10.53
Moderately Resistant 9.03 9.55 9.93 10.17
6 Susceptible 9.23 10.07 10.38 10.89
Moderately Susceptible 9.49 9.80 10.52 11.00
Moderately Resistant 10.82 11.17 11.29 11.17
7 Susceptible 8.20 9.80 10.04 10.22
Moderately Susceptible 8.64 9.58 9.44 9.28
Moderately Resistant 8.90 9.55 9.51 9.66
8 Susceptible 7.57 8.85 9.33 9.43
Moderately Susceptible 8.00 8.16 7.66 8.91
Moderately Resistant 7.67 8.28 8.45 8.05
9 Susceptible 9.53 11.16 10.89 10.80
Moderately Susceptible 8.96 10.80 10.74 10.20
Moderately Resistant 9.13 10.78 10.75 10.88
10 Susceptible 10.54 11.62 12.08 11.98
Moderately Susceptible 10.67 11.07 11.09 11.61
Moderately Resistant 9.46 10.32 10.37 10.85
11 Susceptible 7.52 8.69 10.51 10.10
Moderately Susceptible 8.19 10.66 11.02 10.89
Moderately Resistant 9.59 10.66 11.15 10.54
12 Susceptible 9.55 11.72 12.23 12.26
Moderately Susceptible 10.93 12.73 12.85 12.71
Moderately Resistant 10.94 11.98 11.20 12.00
13 Susceptible 9.84 11.36 11.20 11.66
Moderately Susceptible 10.26 10.87 10.94 11.20
Moderately Resistant 10.05 10.72 10.82 10.86
14 Susceptible 9.21 9.94 10.34 10.24
Moderately Susceptible 9.65 8.30 9.76 10.16
Moderately Resistant 10.00 10.25 10.30 9.83
15 Susceptible 11.66 12.44 12.46 12.61
Moderately Susceptible 10.00 11.28 10.86 11.09
Moderately Resistant 10.49 11.18 11.00 11.54
16 Susceptible 8.89 9.03 9.13 9.30
Moderately Susceptible 8.75 8.76 8.98 9.12
Moderately Resistant 8.92 8.93 9.04 9.14

106
18 Susceptible 11.19 11.58 12.88 12.13
Moderately Susceptible 10.37 12.63 13.31 12.46
Moderately Resistant 11.52 13.31 11.92 13.04
19 Susceptible 6.12 8.66 10.41 10.65
Moderately Susceptible 8.25 10.48 11.11 11.69
Moderately Resistant 10.43 12.03 12.46 12.45
20 Susceptible 10.11 11.19 11.44 11.69
Moderately Susceptible 9.79 9.31 9.91 10.36
Moderately Resistant 10.24 10.31 10.45 10.93
21 Susceptible 10.00 11.31 11.68 11.74
Moderately Susceptible 11.41 11.85 11.84 11.35
Moderately Resistant 11.93 12.47 12.37 11.71
22 Susceptible 9.81 10.72 10.92 11.00
Moderately Susceptible 9.63 10.81 10.29 10.71
Moderately Resistant 9.45 10.79 11.37 10.93
24 Susceptible 10.05 10.57 10.82 10.91
Moderately Susceptible 10.23 11.19 11.29 11.38
Moderately Resistant 10.18 11.36 11.10 11.64
25 Susceptible 9.23 10.31 10.32 10.88
Moderately Susceptible 9.17 10.49 10.48 11.02
Moderately Resistant 9.82 10.18 10.67 10.62
P Value <.001
LSD 0.848

107
Appendix 19: Average septoria severity (%) on leaf 2 at T2 + 6-8 weeks for the interaction between site, variety and fungicide in low pressure sites. *Data which did not have a reliable score due to a lack of green leaf area.
Fungicide
Site Number Variety Untreated Low Medium High 2 Susceptible * 1.42 1.76 0.55
Moderately Susceptible 6.80 4.83 3.17 1.33
Moderately Resistant 2.67 0.67 0.67 0.33
5 Susceptible 45.15 4.02 1.72 0.23
Moderately Susceptible 18.44 1.80 0.84 0.13
Moderately Resistant 4.04 1.05 0.95 0.05
14 Susceptible * 6.83 3.33 3.50
Moderately Susceptible * 3.24 0.65 1.48
Moderately Resistant 6.33 2.33 0.67 0.50
15 Susceptible 24.84 4.25 6.00 3.00
Moderately Susceptible 13.83 5.17 3.40 2.33
Moderately Resistant 6.83 5.49 3.83 3.90
16 Susceptible 1.25 0.17 0.00 0.00
Moderately Susceptible 0.33 0.17 0.00 0.00
Moderately Resistant 0.42 0.00 0.00 0.00
18 Susceptible 7.17 4.58 2.58 2.29
Moderately Susceptible 12.50 7.58 2.04 6.54
Moderately Resistant 4.17 1.92 3.38 2.46
20 Susceptible 3.67 0.00 0.00 0.00
Moderately Susceptible 1.67 0.50 0.00 0.00
Moderately Resistant 0.00 0.00 0.17 0.00
21 Susceptible 4.83 0.78 0.17 0.00
Moderately Susceptible 0.65 0.12 0.00 0.05
Moderately Resistant 0.20 0.00 0.00 0.00
P Value <.001
LSD 2.852
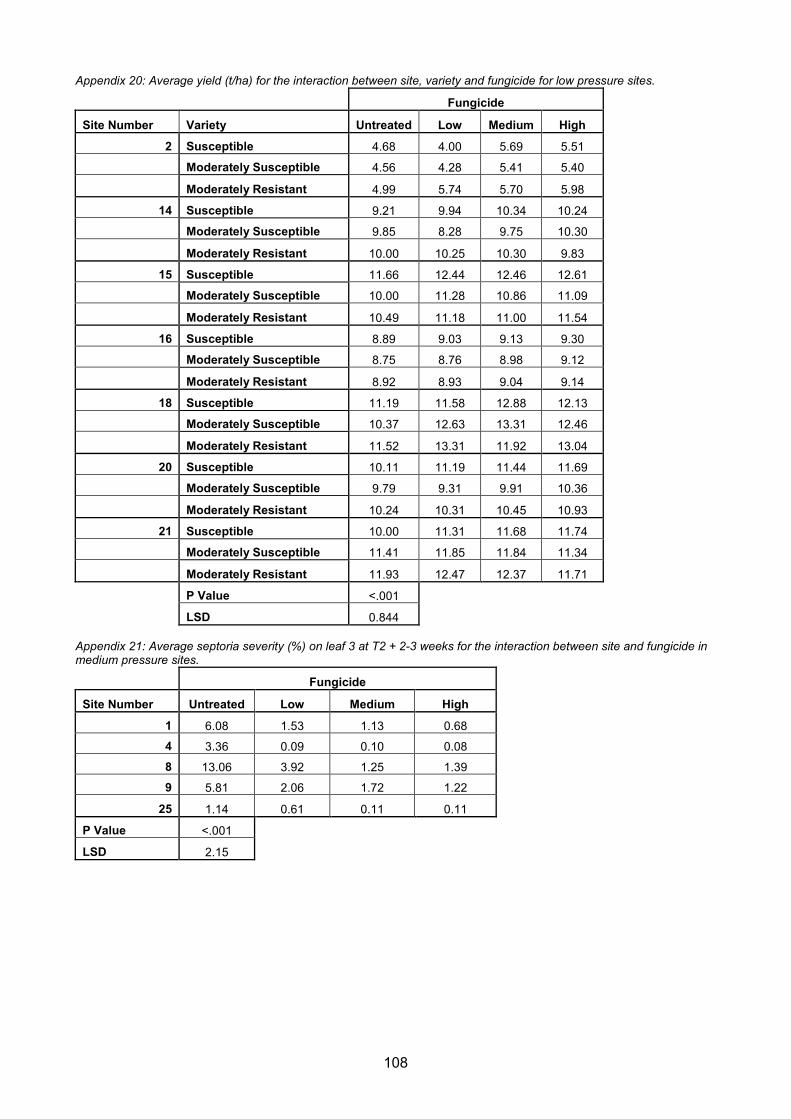
108
Appendix 20: Average yield (t/ha) for the interaction between site, variety and fungicide for low pressure sites.
Fungicide
Site Number Variety Untreated Low Medium High 2 Susceptible 4.68 4.00 5.69 5.51
Moderately Susceptible 4.56 4.28 5.41 5.40
Moderately Resistant 4.99 5.74 5.70 5.98
14 Susceptible 9.21 9.94 10.34 10.24
Moderately Susceptible 9.85 8.28 9.75 10.30
Moderately Resistant 10.00 10.25 10.30 9.83
15 Susceptible 11.66 12.44 12.46 12.61
Moderately Susceptible 10.00 11.28 10.86 11.09
Moderately Resistant 10.49 11.18 11.00 11.54
16 Susceptible 8.89 9.03 9.13 9.30
Moderately Susceptible 8.75 8.76 8.98 9.12
Moderately Resistant 8.92 8.93 9.04 9.14
18 Susceptible 11.19 11.58 12.88 12.13
Moderately Susceptible 10.37 12.63 13.31 12.46
Moderately Resistant 11.52 13.31 11.92 13.04
20 Susceptible 10.11 11.19 11.44 11.69
Moderately Susceptible 9.79 9.31 9.91 10.36
Moderately Resistant 10.24 10.31 10.45 10.93
21 Susceptible 10.00 11.31 11.68 11.74
Moderately Susceptible 11.41 11.85 11.84 11.34
Moderately Resistant 11.93 12.47 12.37 11.71
P Value <.001
LSD 0.844 Appendix 21: Average septoria severity (%) on leaf 3 at T2 + 2-3 weeks for the interaction between site and fungicide in medium pressure sites.
Fungicide
Site Number Untreated Low Medium High 1 6.08 1.53 1.13 0.68 4 3.36 0.09 0.10 0.08 8 13.06 3.92 1.25 1.39 9 5.81 2.06 1.72 1.22
25 1.14 0.61 0.11 0.11
P Value <.001 LSD 2.15

109
Appendix 22: Average septoria severity (%) on leaf 2 at T2 + 6-8 weeks for the interaction between site, variety and fungicide in medium pressure sites. *Data which did not have a reliable score due to a lack of green leaf area.
Fungicide
Site Number Variety Untreated Low Medium High 1 Susceptible 21.06 4.34 1.59 0.53
Moderately Susceptible 12.36 3.36 0.59 0.28
Moderately Resistant 10.13 5.54 0.78 0.27
4 Susceptible 45.33 1.77 1.25 0.52
Moderately Susceptible 26.00 0.28 0.20 0.17
Moderately Resistant 14.67 0.18 0.25 0.08
8 Susceptible * 7.82 3.00 3.33
Moderately Susceptible 8.50 4.67 3.83 3.02
Moderately Resistant 6.66 8.17 5.00 6.33
9 Susceptible 8.00 2.67 2.50 2.83
Moderately Susceptible 8.58 1.33 1.67 2.00
Moderately Resistant 9.50 0.83 0.00 1.50
25 Susceptible 12.17 1.67 1.83 0.25
Moderately Susceptible 13.83 2.58 1.83 0.17
Moderately Resistant 2.92 0.50 0.83 0.00
P Value <.001
LSD 4.811

110
Appendix 23: Average septoria severity (%) on leaf 3 at T2 + 2-3 weeks for the interaction between site, variety and fungicide in high pressure sites.
Fungicide
Site Number Variety Untreated Low Medium High 3 Susceptible 14.67 11.33 4.83 1.33
Moderately Susceptible 6.17 2.83 3.58 2.00
Moderately Resistant 4.83 1.83 2.83 1.50
6 Susceptible 13.71 7.62 4.00 3.37
Moderately Susceptible 7.91 5.33 2.83 2.83
Moderately Resistant 1.87 0.43 0.31 0.00
12 Susceptible 27.12 5.25 5.46 3.79
Moderately Susceptible 10.00 4.33 4.92 3.58
Moderately Resistant 6.21 1.92 2.08 1.71
13 Susceptible 73.26 15.01 35.20 14.94
Moderately Susceptible 40.84 5.21 11.43 2.80
Moderately Resistant 24.07 2.82 5.67 1.47
19 Susceptible 43.22 11.68 5.50 5.28
Moderately Susceptible 16.05 3.95 2.20 1.35
Moderately Resistant 5.22 1.65 0.85 0.98
24 Susceptible 14.83 7.33 3.00 1.00
Moderately Susceptible 5.83 4.17 4.33 1.17
Moderately Resistant 3.33 1.17 2.17 0.67
P Value <.001
LSD 5.456

111
Appendix 24: Average yield (t/ha) for the interaction between site, variety and fungicide in high pressure sites.
Fungicide
Site Number Variety Untreated Low Medium High 3 Susceptible 8.42 9.73 10.39 11.30
Moderately Susceptible 9.06 10.16 10.43 10.53
Moderately Resistant 9.03 9.55 9.93 10.17
6 Susceptible 9.23 10.07 10.38 10.89 Moderately Susceptible 9.49 9.80 10.52 11.00
Moderately Resistant 10.82 11.17 11.29 11.17
11 Susceptible 7.52 8.69 10.51 10.10 Moderately Susceptible 8.19 10.66 11.02 10.89
Moderately Resistant 9.59 10.66 11.15 10.54
12 Susceptible 9.55 11.72 12.23 12.26 Moderately Susceptible 10.93 12.73 12.85 12.71
Moderately Resistant 10.94 11.98 11.20 12.00
13 Susceptible 9.84 11.36 11.20 11.66 Moderately Susceptible 10.26 10.87 10.94 11.20
Moderately Resistant 10.05 10.72 10.82 10.86
19 Susceptible 6.12 8.66 10.41 10.65 Moderately Susceptible 8.25 10.48 11.11 11.69
Moderately Resistant 10.43 12.03 12.46 12.45
22 Susceptible 9.81 10.72 10.92 11.00
Moderately Susceptible 9.63 10.81 10.29 10.71
Moderately Resistant 9.45 10.79 11.37 10.93
24 Susceptible 10.05 10.57 10.82 10.91
Moderately Susceptible 10.23 11.19 11.29 11.38
Moderately Resistant 10.18 11.36 11.10 11.64
P Value <.001
LSD 0.755

112
Appendix 25: Average septoria severity (%) on leaf 3 at T2 + 2-3 weeks for the interaction between site and seed rate across all sites from 2016 to 2018.
Site Number High seed rate Low seed rate
1 2.36 2.57
2 1.93 1.35
3 4.77 6.09
4 0.91 0.88
5 1.09 0.96
6 4.15 3.67
7 6.84 10.05
8 4.90 4.31
9 2.68 1.85
10 3.64 2.94
12 6.36 5.49
13 19.39 17.02
14 2.10 1.44
15 4.26 3.55
17 12.71 10.04
18 6.75 7.05
P value <.001 LSD 2.366
Appendix 26: Average yield (t/ha) for the interaction between site and seed rate across all sites from 2016 to 2018.
Site Number High Seed Rate Low Seed Rate
1 10.52 10.17
2 5.18 5.09
3 9.89 9.45
6 10.50 10.01
7 9.40 9.06
8 8.36 8.27
9 10.38 10.09
10 10.94 11.02
11 9.96 9.28
12 11.76 11.19
13 10.82 10.61
14 9.83 9.45
15 11.38 10.59
16 9.00 8.86
18 12.20 11.64
P value <.001 LSD 0.615

113
Appendix 27: Average yield (t/ha) for the interaction between site, sowing date and seed rate across all sites from 2016 to 2018.
Early Sown Late Sown
Site Number High Seed Rate Low Seed Rate High Seed Rate Low Seed Rate
1 9.90 9.40 11.13 10.93
2 4.77 4.59 5.58 5.58
3 9.85 9.27 9.94 9.64
6 9.83 9.07 11.17 10.95
7 9.30 9.02 9.50 9.09
8 8.48 8.24 8.23 8.31
9 10.50 10.05 10.26 10.13
10 11.05 11.08 10.83 10.96
11 9.96 8.70 9.95 9.87
12 11.61 10.71 11.90 11.68
13 11.05 10.81 10.58 10.41
14 9.93 9.76 9.74 9.13
15 11.28 10.34 11.48 10.85
16 9.15 8.92 8.84 8.80
18 12.39 11.48 12.00 11.80
P value <.001 LSD 0.857
Recommended