Financial update
Markku Honkasalo, CFO
November 26, 2013
Agenda
Financial targets
Growth
Profitability
ROCE
Balance sheet and cash flow
Summary
1
2
3
4
5
6
Capital Markets Day 2013
Financial targets
Dividend
policy
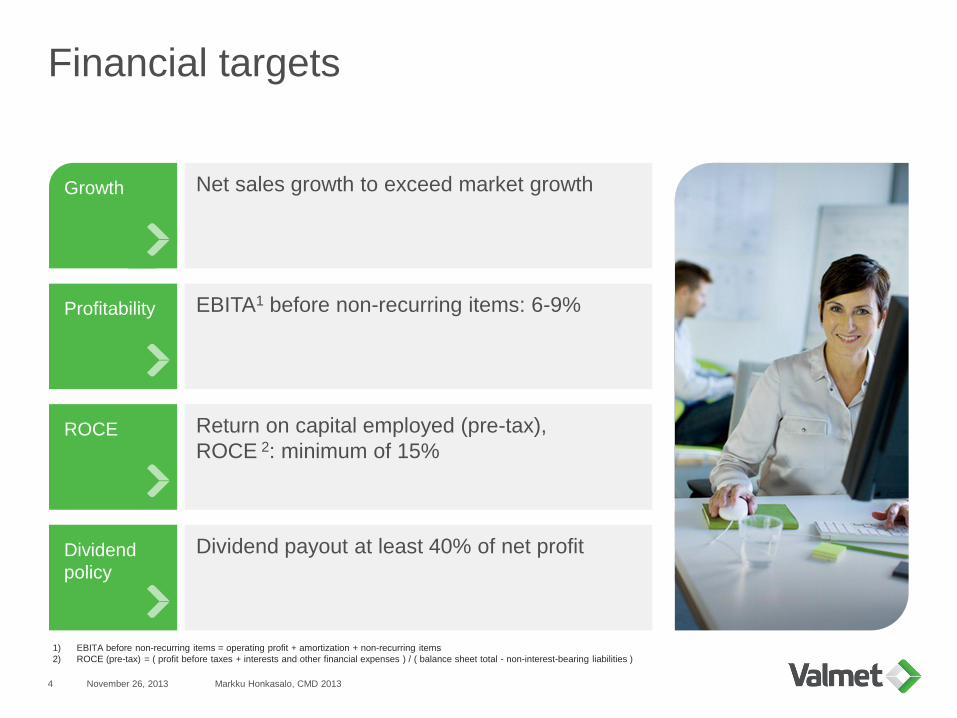
Financial targets
November 26, 2013 Markku Honkasalo, CMD 20134
Profitability
Growth
ROCE
Net sales growth to exceed market growth
EBITA1 before non-recurring items: 6-9%
Return on capital employed (pre-tax),
ROCE 2: minimum of 15%
Dividend payout at least 40% of net profit
1) EBITA before non-recurring items = operating profit + amortization + non-recurring items
2) ROCE (pre-tax) = ( profit before taxes + interests and other financial expenses ) / ( balance sheet total - non-interest-bearing liabilities )
Growth
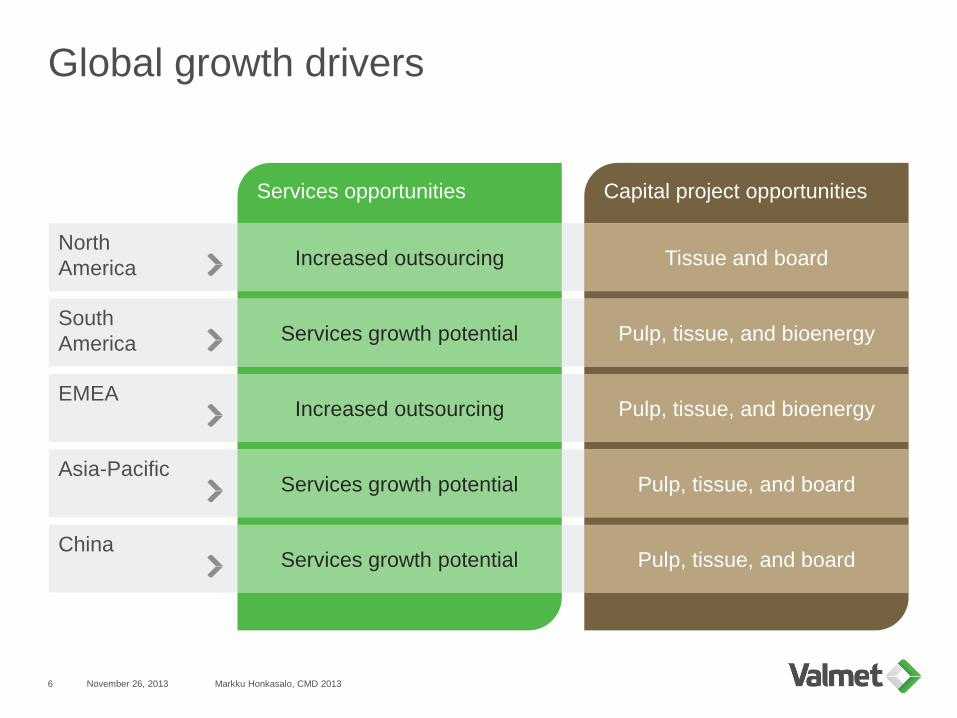
Capital project opportunities
Global growth drivers
November 26, 2013 Markku Honkasalo, CMD 20136
Services opportunities
China
Asia-Pacific
EMEA
South
America
North
AmericaIncreased outsourcing
Services growth potential
Increased outsourcing
Services growth potential
Services growth potential
Tissue and board
Pulp, tissue, and bioenergy
Pulp, tissue, and bioenergy
Pulp, tissue, and board
Pulp, tissue, and board

Growth drivers by business line
November 26, 2013 Markku Honkasalo, CMD 20137
• Customers are outsourcing non-core operations
• Capacity increases in China, South America, and Asia-Pacific
• Customer cost pressure and efficiency requirements are increasing demand for
process improvements and maintenance services
• Growth in paper, board, and tissue consumption, primarily in Asia
• Need for virgin wood pulp, as recycling rates cannot grow indefinetly
• Growth of energy consumption and demand for sustainable energy
• Modernization of aging plants
• Incentives and regulation
• Growth and rise of purchasing power and living standards in emerging markets
• Increase in world trade, growth of e-commerce
• Shift from plastic to renewable materials
• Conversions of paper machines into board machines
Services
Pulp and
Energy
Paper

Profitability
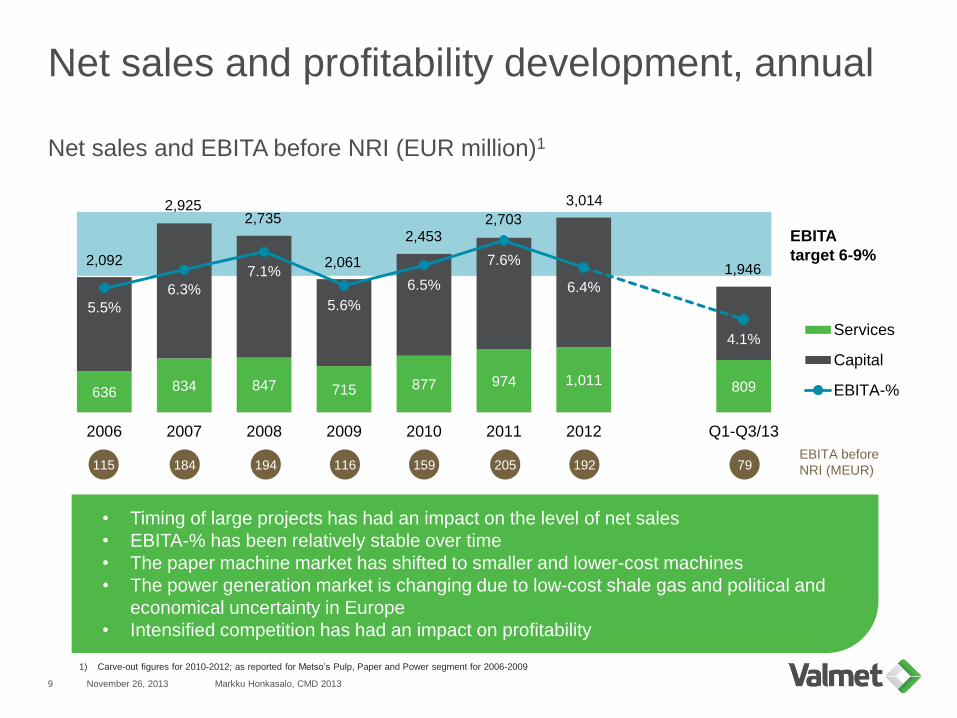
Net sales and profitability development, annual
November 26, 2013 Markku Honkasalo, CMD 20139
Net sales and EBITA before NRI (EUR million)1
1) Carve-out figures for 2010-2012; as reported for Metso’s Pulp, Paper and Power segment for 2006-2009
• Timing of large projects has had an impact on the level of net sales
• EBITA-% has been relatively stable over time
• The paper machine market has shifted to smaller and lower-cost machines
• The power generation market is changing due to low-cost shale gas and political and
economical uncertainty in Europe
• Intensified competition has had an impact on profitability
636 834 847 715 877 974 1,011 809
5.5%
6.3%
7.1%
5.6%
6.5%
7.6%
6.4%
5.3 %
4.1%
2006 2007 2008 2009 2010 2011 2012 Q1-Q3/13
Services
Capital
EBITA-%
2,092
2,9252,735
2,061
2,4532,703
3,014
1,946
115 184 194 116 159 205 192 79EBITA before
NRI (MEUR)
EBITA
target 6-9%

Profitability improvement program
EUR 100 million savings program
Announced in April, 2013
Capacity being adjusted
SG&A expense base is being reduced
Status of the program
Two major negotiation processes completed
– Total cost reduction: EUR 75 million
– Total headcount reduction: approximately 1,000
– Major impact in Jyväskylä, Järvenpää, Tampere,
Pori, and Örnsköldsvik
– All business lines, areas, and functions impacted
Additional negotiations announced on October 21
– Targeted cost reduction: EUR 25 million by the end
of 2014
– Targeted headcount reduction: 425
– Impact on Energy and Service
Savings schedule advanced: EUR 100 million impact
by the end of 2014
Impact of announced actions (EUR million)
November 26, 2013 Markku Honkasalo, CMD 201310
75
10025
Measuresundertaken
currently
MeasuresannouncedQ4/2013
by end of 2014
Total
100
~2/3
COGS
~1/3
SG&A
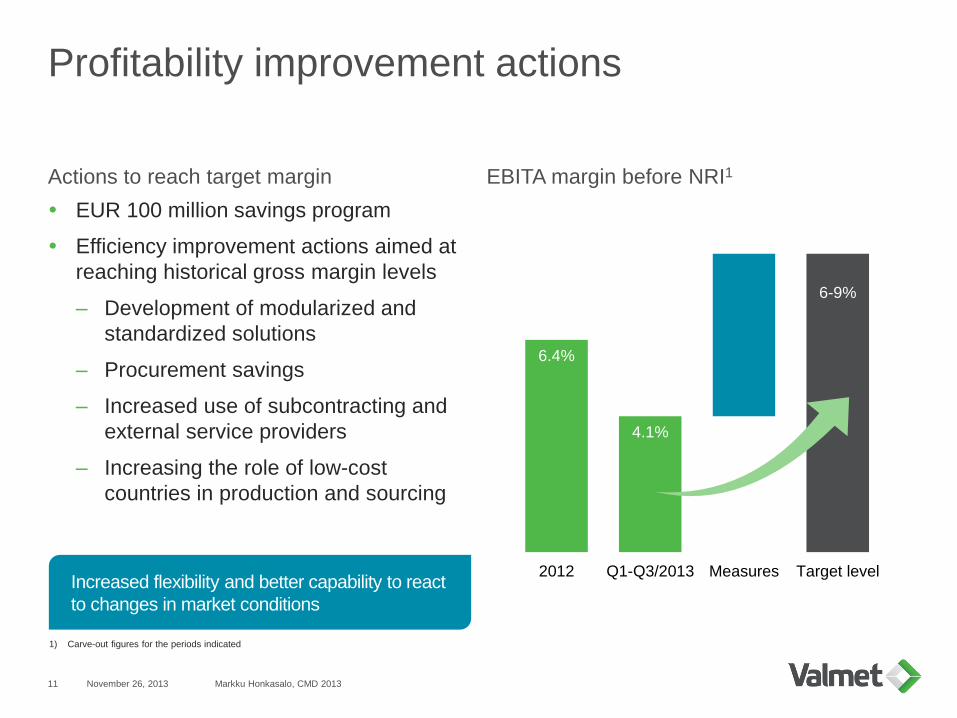
6.4%
4.1%
6-9%
2012 Q1-Q3/2013 Measures Target level
Profitability improvement actions
Actions to reach target margin
EUR 100 million savings program
Efficiency improvement actions aimed at
reaching historical gross margin levels
– Development of modularized and
standardized solutions
– Procurement savings
– Increased use of subcontracting and
external service providers
– Increasing the role of low-cost
countries in production and sourcing
EBITA margin before NRI1
November 26, 2013 Markku Honkasalo, CMD 201311
Increased flexibility and better capability to react
to changes in market conditions
1) Carve-out figures for the periods indicated
ROCE
0%
5%
10%
15%
20%
2010 2011 2012 Q3/2013
Carve-out ROCE (before taxes without NRI) Target
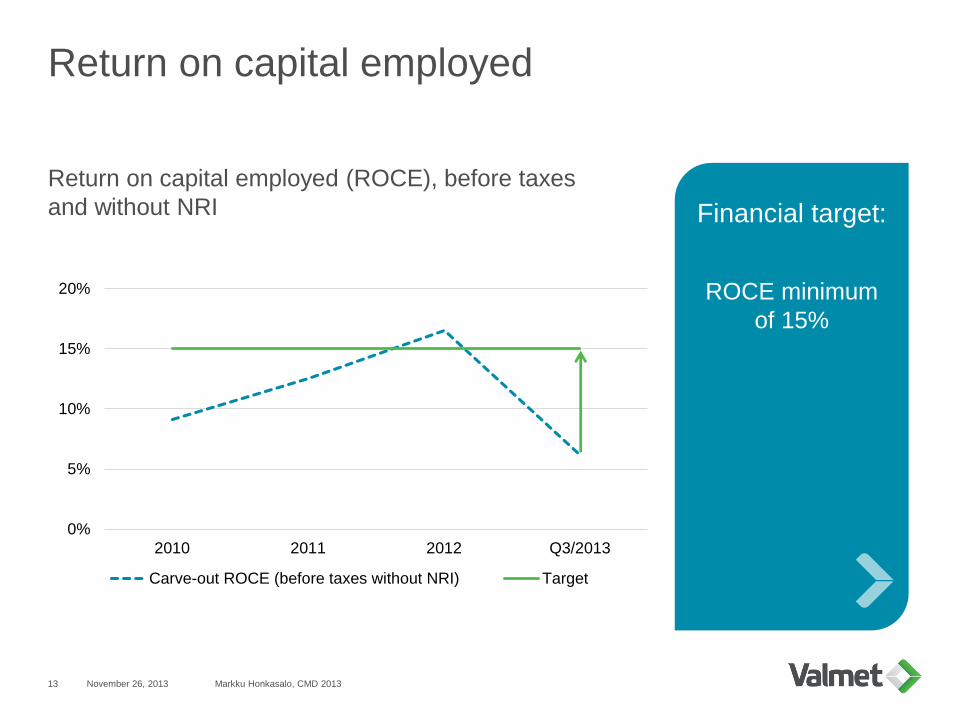
Return on capital employed
November 26, 2013 Markku Honkasalo, CMD 201313
Return on capital employed (ROCE), before taxes
and without NRI Financial target:
ROCE minimum
of 15%
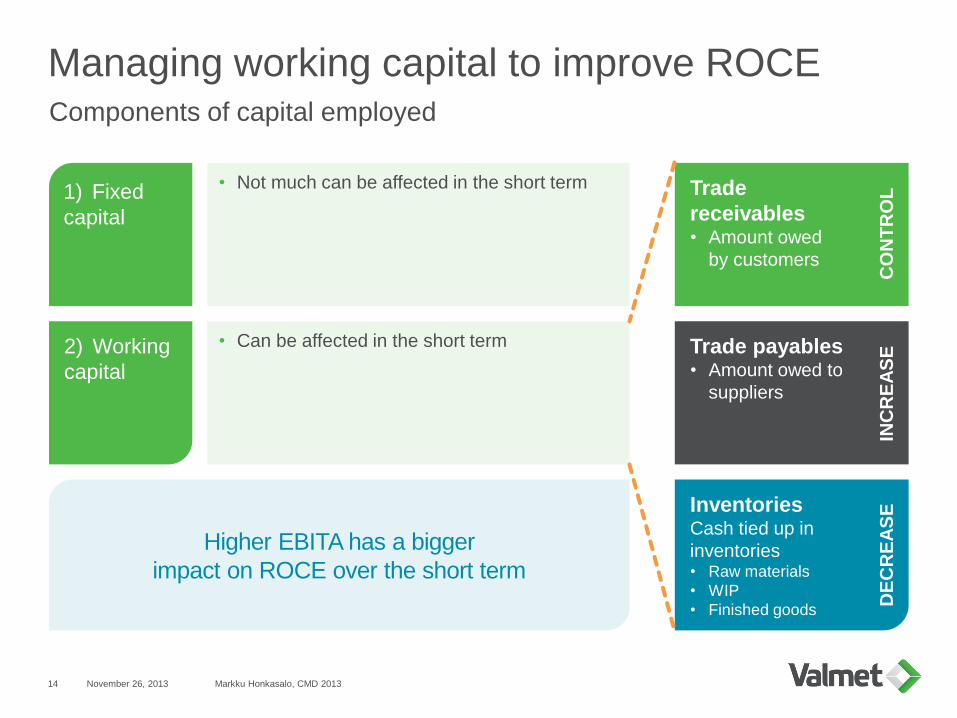
Managing working capital to improve ROCE
November 26, 2013 Markku Honkasalo, CMD 201314
Components of capital employed
Trade
receivables• Amount owed
by customers
Trade payables• Amount owed to
suppliers
InventoriesCash tied up in
inventories• Raw materials
• WIP
• Finished goods
1) Fixed
capital
2) Working
capital
Higher EBITA has a bigger
impact on ROCE over the short term
• Not much can be affected in the short term
• Can be affected in the short term
INC
RE
AS
EC
ON
TR
OL
DE
CR
EA
SE
Balance sheet and cash flow
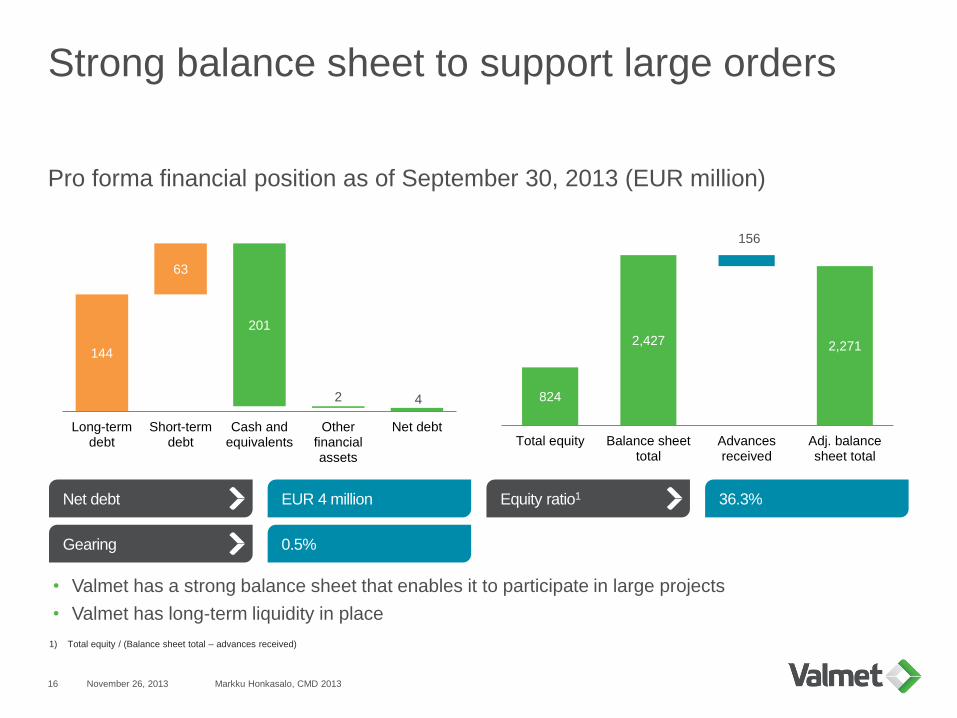
Strong balance sheet to support large orders
Pro forma financial position as of September 30, 2013 (EUR million)
November 26, 2013 Markku Honkasalo, CMD 201316
Net debt
Gearing
EUR 4 million
0.5%
Equity ratio1 36.3%
• Valmet has a strong balance sheet that enables it to participate in large projects
• Valmet has long-term liquidity in place
1) Total equity / (Balance sheet total – advances received)
144
4
63
201
2
Long-termdebt
Short-termdebt
Cash andequivalents
Otherfinancialassets
Net debt
824
2,427 2,271
156
Total equity Balance sheettotal
Advancesreceived
Adj. balancesheet total
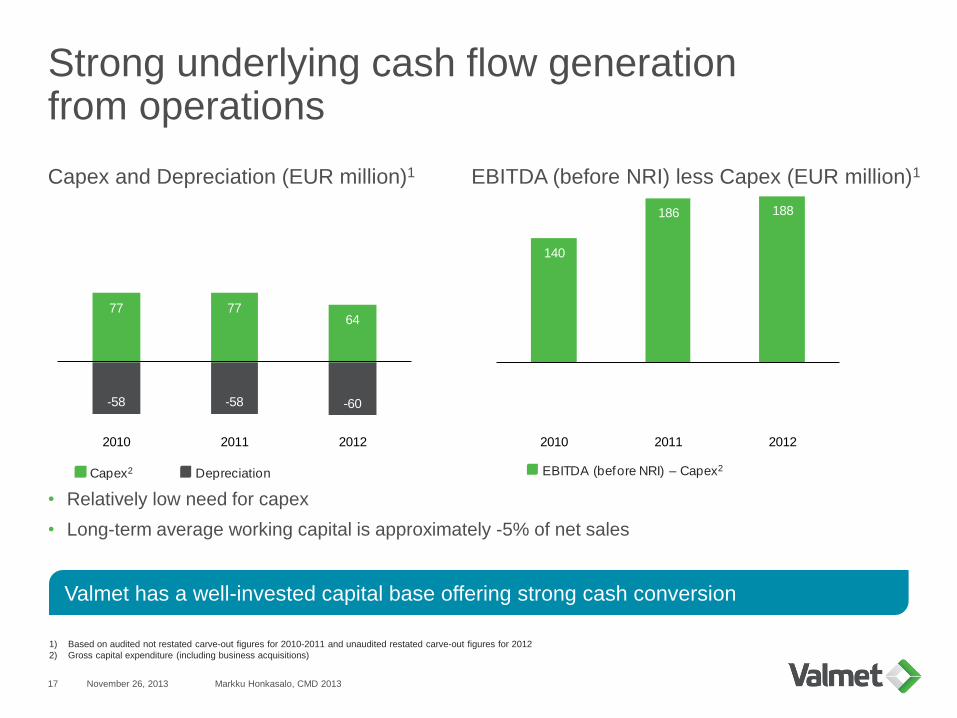
Strong underlying cash flow generationfrom operations
Capex and Depreciation (EUR million)1 EBITDA (before NRI) less Capex (EUR million)1
November 26, 2013 Markku Honkasalo, CMD 201317
• Relatively low need for capex
• Long-term average working capital is approximately -5% of net sales
1) Based on audited not restated carve-out figures for 2010-2011 and unaudited restated carve-out figures for 2012
2) Gross capital expenditure (including business acquisitions)
Valmet has a well-invested capital base offering strong cash conversion
77 7764
-58 -58 -60
2010 2011 2012
Capex2 Depreciation
140
186 188
2010 2011 2012
EBITDA (before NRI) – Capex2

Long-term liquidity in place
EUR 200 million syndicated
revolving credit facility
Maturity: 5 years from the demerger
date
International bank syndicate
EUR 52 million term loan
Maturity: 3 years
For refinancing of Metso’s loans or
other liabilities that relate
to Valmet
EUR 139 million EIB loan
• Amount outstanding of
two EIB loans:
– EUR 135 million loan entered into in
May 2004, and
– EUR 160 million loan entered into in
November 2008
USD 23 million NIB loan
• Amount outstanding of one loan:
– USD 85 million loan entered into in
December 2007
November 26, 2013 Markku Honkasalo, CMD 201318
New financing facilities Other borrowings

Valmet’s reporting policy
November 26, 2013 Markku Honkasalo, CMD 201319
Comparable
numbers will be
prepared for 2012,
2011, and 2010
Comparison
figures on carve-
out basis
Reported numbers
for business lines
and areas
Orders received
Net sales
Valmet will be one
reporting segment as
of January 1, 2014
One set of
consolidated
numbers
Summary

Summary – Key messages
November 26, 2013 Markku Honkasalo, CMD 201321
Further
improvement
needed in working
capital management
EBITA and ROCE
targets are
ambitious but
reachable
Focus on profitability
improvement and
efficiency
improvement actions

Recommended