Embed Size (px)
Citation preview
Investor Presentation
January 2015
Reliance Capital Limited
Slide 2
Disclaimer
THIS PRESENTATION (PRESENTATION) IS NOT AN OFFER TO SELL ANY SECURITIES OR A SOLICITATION TO BUY ANY SECURITIES OF RELIANCE CAPITAL LIMITED OR ITS
SUBSIDIARIES OR ITS ASSOCIATES (TOGETHER, THE “COMPANY”).
The material that follows is a Presentation of general background information about the Company’s activities as at the date of the Presentation. It is information given in summary form and
does not purport to be complete and it cannot be guaranteed that such information is true and accurate. This Presentation does not constitute a prospectus, offering circular or offering
memorandum or an offer, or a solicitation of any offer, to purchase or sell, any shares and should not be considered as a recommendation that any investor should subscribe for or purchase
any of the Company’s equity shares.
This Presentation includes statements that are, or may be deemed to be, “forward-looking statements”. These forward-looking statements can be identified by the use of forward-looking
terminology, including the terms “believes”, “estimates”, “anticipates”, “projects”, “expects”, “intends”, “may”, “will”, “seeks” or “should” or, in each case, their negative or other variations or
comparable terminology, or by discussions of strategy, plans, aims, objectives, goals, future events or intentions. These forward-looking statements include all matters that are not historical
facts. They appear in a number of places throughout this Presentation and include statements regarding the Company’s intentions, beliefs or current expectations concerning, amongst other
things, its results or operations, financial condition, liquidity, prospects, growth, strategies and the industry in which the Company operates.
By their nature, forward-looking statements involve risks and uncertainties because they relate to events and depend on circumstances that may or may not occur in the future. Forward-
looking statements are not guarantees of future performance including those relating to general business plans and strategy of the Company, its future outlook and growth prospects, and
future developments in its businesses and its competitive and regulatory environment. No representation, warranty or undertaking, express or implied, is made or assurance given that such
statements, views, projections or forecasts, if any, are correct or that the objectives of the Company will be achieved. The Company’s actual results of operations, financial condition and
liquidity, and the development of the business sector in which the Company operates, may differ materially from those suggested by the forward-looking statements contained in this
Presentation. In addition, even if the Company’s results of operations, financial condition and liquidity, and the development of the industry in which the Company operates, are consistent
with the forward-looking statements contained in this Presentation, those results or developments may not be indicative of results or developments in subsequent periods.
The Company, as such, makes no representation or warranty, express or implied, as to, and does not accept any responsibility or liability with respect to, the fairness, accuracy,
completeness or correctness of any information or opinions contained herein. The information contained in this Presentation, unless otherwise specified is only current as of the date of this
Presentation. The Company assumes no responsibility to publicly amend, modify or revise any forward looking statements, on the basis of any subsequent development, information or
events, or otherwise. Unless otherwise stated in this Presentation, the information contained herein is based on management information and estimates. The information contained herein is
subject to change without notice and past performance is not indicative of future results.
This document is just a Presentation and is not intended to be a “prospectus” or “offer document” (as defined or referred to, as the case may be, under the Companies Act, 2013). It is
clarified that this Presentation is not intended to be a document offering for subscription or sale of any securities or inviting offers from the Indian public (including any section thereof) or from
persons residing in any other jurisdiction including the United States for the subscription to or sale of any securities including the Company’s equity shares. No part of it should form the basis
of or be relied upon in connection with any investment decision or any contract or commitment to purchase or subscribe for any securities. None of the Company’s securities may be offered
or sold in the United States without registration under the U.S. Securities Act of 1933, as amended, except pursuant to an exemption from registration there from. This presentation is
confidential and may not be copied or disseminated, in whole or in part, and in any manner.
This document has not been and will not be reviewed or approved by a regulatory authority in India or by any stock exchange in India. This Presentation is meant to be received only by the
named recipient to whom it has been addressed. This document and its contents should not be forwarded or delivered or transmitted in any manner to any person other than its intended
recipient, and should not be reproduced in any manner whatsoever.
Slide 3
Overview - Strong Fundamentals
Slide 4
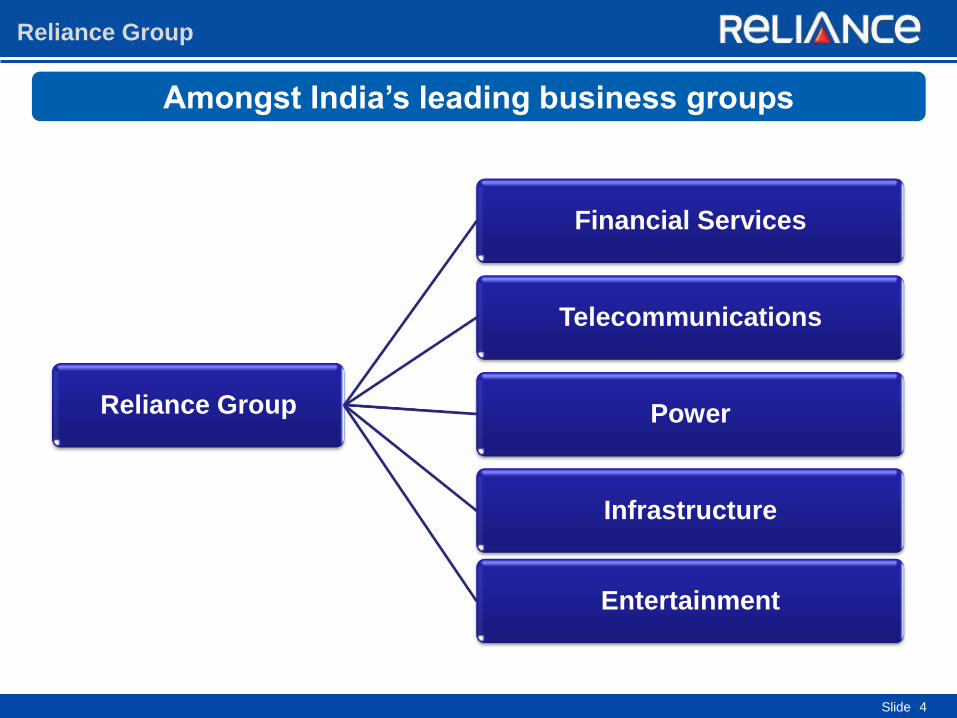
Reliance Group
Amongst India’s leading business groups
Reliance Group
Financial Services
Telecommunications
Power
Infrastructure
Entertainment
Slide 5
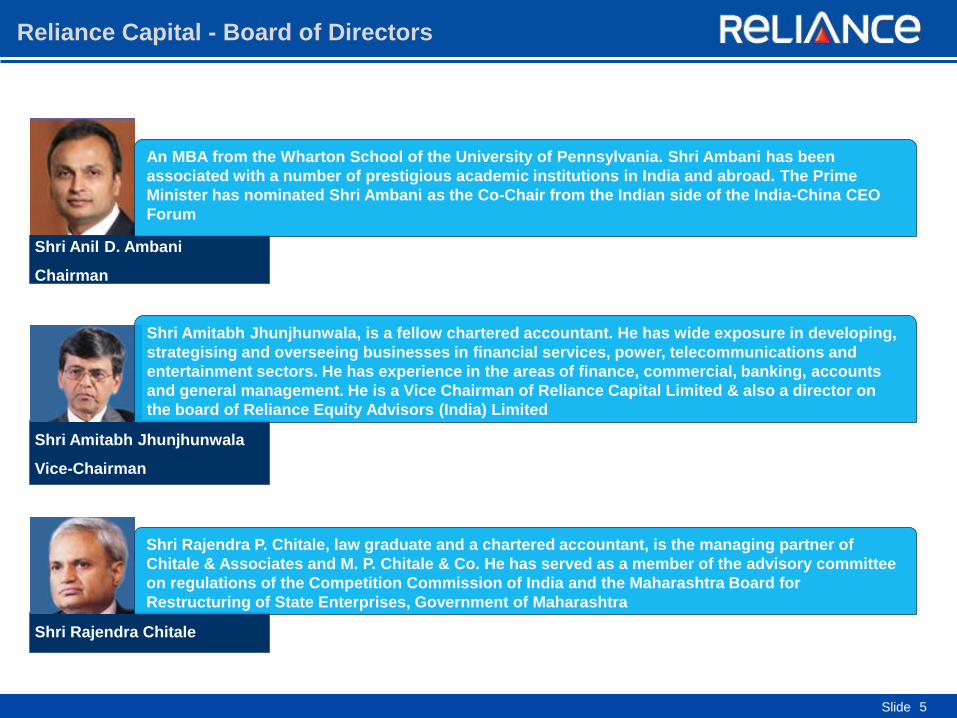
Reliance Capital - Board of Directors
Shri Anil D. Ambani
Chairman
An MBA from the Wharton School of the University of Pennsylvania. Shri Ambani has been
associated with a number of prestigious academic institutions in India and abroad. The Prime
Minister has nominated Shri Ambani as the Co-Chair from the Indian side of the India-China CEO
Forum
Shri Amitabh Jhunjhunwala
Vice-Chairman
Shri Amitabh Jhunjhunwala, is a fellow chartered accountant. He has wide exposure in developing,
strategising and overseeing businesses in financial services, power, telecommunications and
entertainment sectors. He has experience in the areas of finance, commercial, banking, accounts
and general management. He is a Vice Chairman of Reliance Capital Limited & also a director on
the board of Reliance Equity Advisors (India) Limited
Shri Rajendra Chitale
Shri Rajendra P. Chitale, law graduate and a chartered accountant, is the managing partner of
Chitale & Associates and M. P. Chitale & Co. He has served as a member of the advisory committee
on regulations of the Competition Commission of India and the Maharashtra Board for
Restructuring of State Enterprises, Government of Maharashtra
Slide 6
Reliance Capital - Board of Directors (contd.)
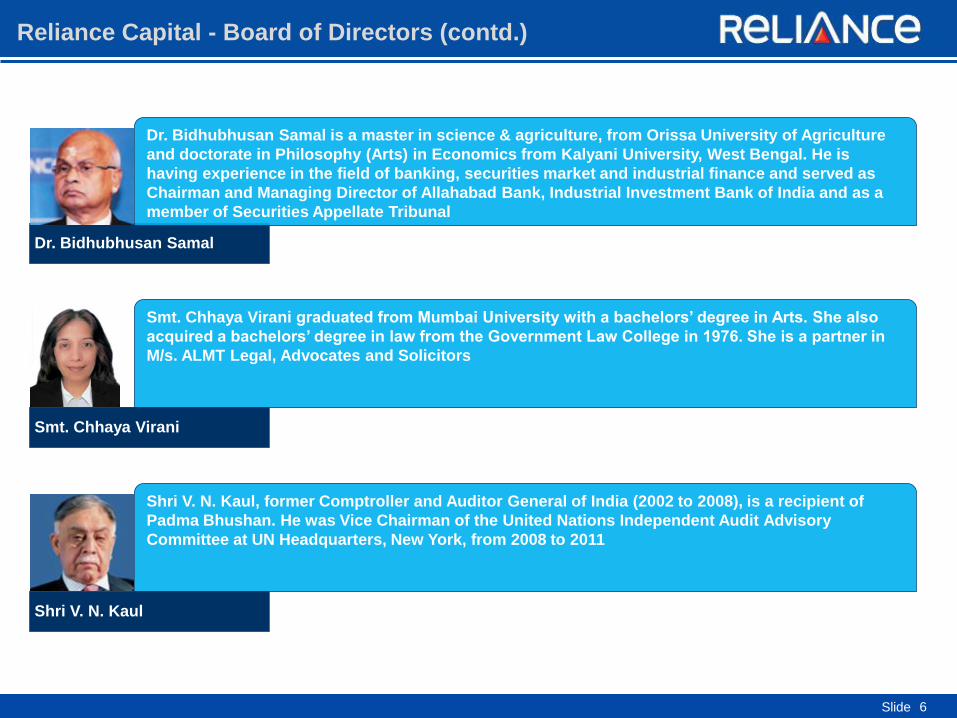
Dr. Bidhubhusan Samal
Dr. Bidhubhusan Samal is a master in science & agriculture, from Orissa University of Agriculture
and doctorate in Philosophy (Arts) in Economics from Kalyani University, West Bengal. He is
having experience in the field of banking, securities market and industrial finance and served as
Chairman and Managing Director of Allahabad Bank, Industrial Investment Bank of India and as a
member of Securities Appellate Tribunal
Smt. Chhaya Virani
Smt. Chhaya Virani graduated from Mumbai University with a bachelors’ degree in Arts. She also
acquired a bachelors’ degree in law from the Government Law College in 1976. She is a partner in
M/s. ALMT Legal, Advocates and Solicitors
Shri V. N. Kaul
Shri V. N. Kaul, former Comptroller and Auditor General of India (2002 to 2008), is a recipient of
Padma Bhushan. He was Vice Chairman of the United Nations Independent Audit Advisory
Committee at UN Headquarters, New York, from 2008 to 2011
Slide
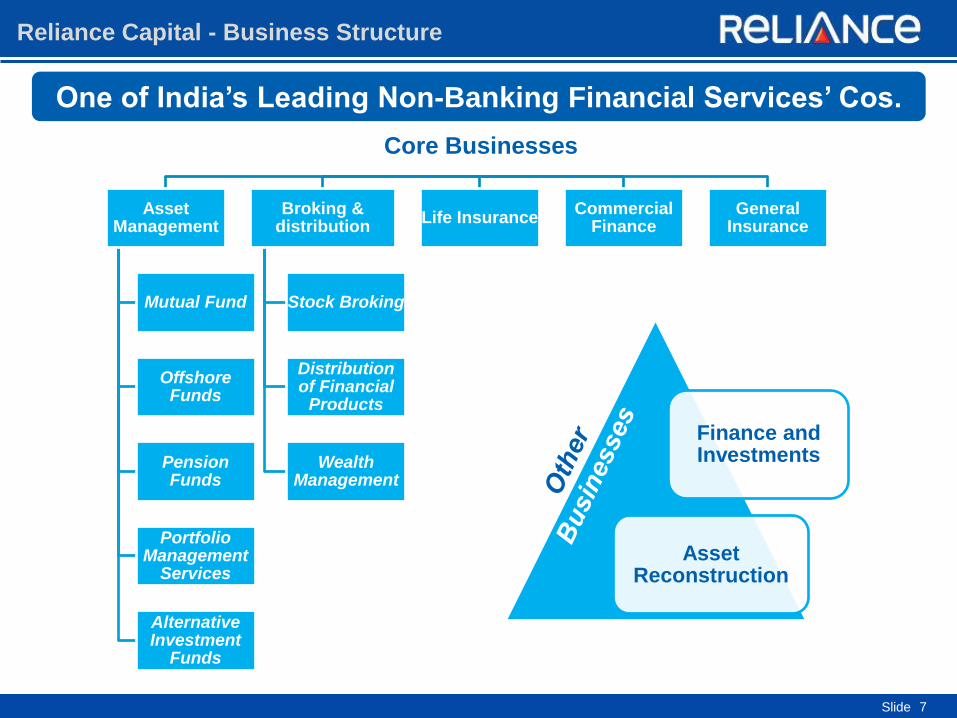
Core Businesses
Asset Management
Mutual Fund
Offshore Funds
Pension Funds
Portfolio Management
Services
Alternative Investment
Funds
Broking & distribution
Stock Broking
Distribution of Financial
Products
Wealth Management
Life Insurance Commercial
Finance General
Insurance
Finance and Investments
Asset Reconstruction
7
Reliance Capital - Business Structure
One of India’s Leading Non-Banking Financial Services’ Cos.
Slide 8
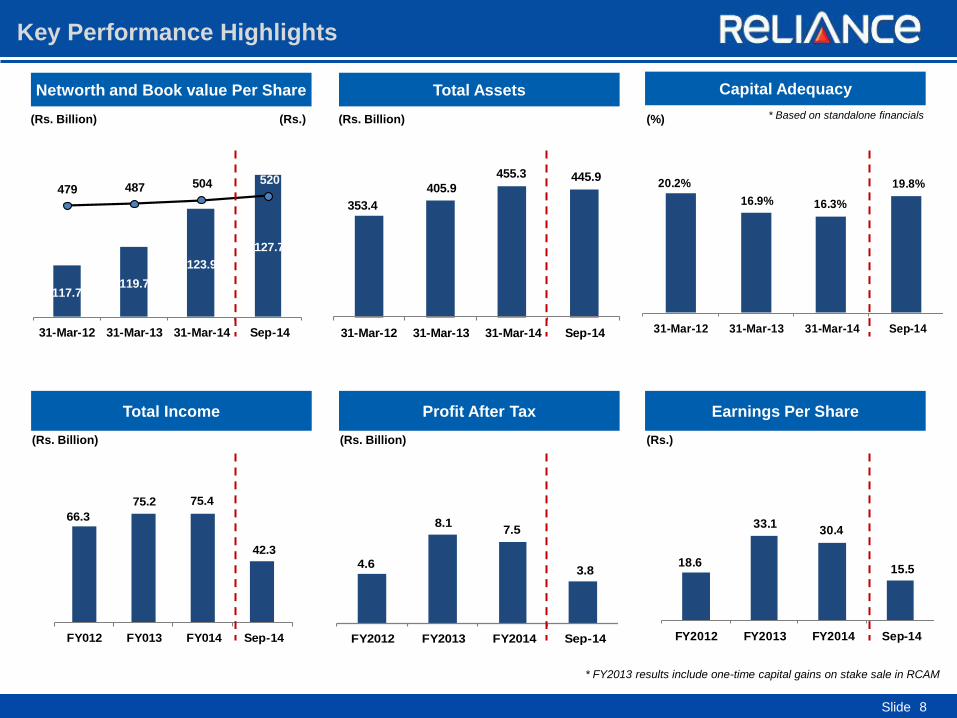
Key Performance Highlights
Total Assets
Profit After Tax Earnings Per Share
Capital Adequacy
Total Income
Networth and Book value Per Share
(Rs. Billion) (Rs. Billion) (%)
(Rs. Billion) (Rs. Billion)
117.7119.7
123.9
127.7
479 487 504 520
31-Mar-12 31-Mar-13 31-Mar-14 Sep-14
(Rs.)
353.4
405.9
455.3 445.9
31-Mar-12 31-Mar-13 31-Mar-14 Sep-14
20.2%
16.9% 16.3%
19.8%
31-Mar-12 31-Mar-13 31-Mar-14 Sep-14
66.3
75.2 75.4
42.3
FY012 FY013 FY014 Sep-14
4.6
8.17.5
3.8
FY2012 FY2013 FY2014 Sep-14
18.6
33.130.4
15.5
FY2012 FY2013 FY2014 Sep-14
(Rs.)
* Based on standalone financials
* FY2013 results include one-time capital gains on stake sale in RCAM
Slide 9
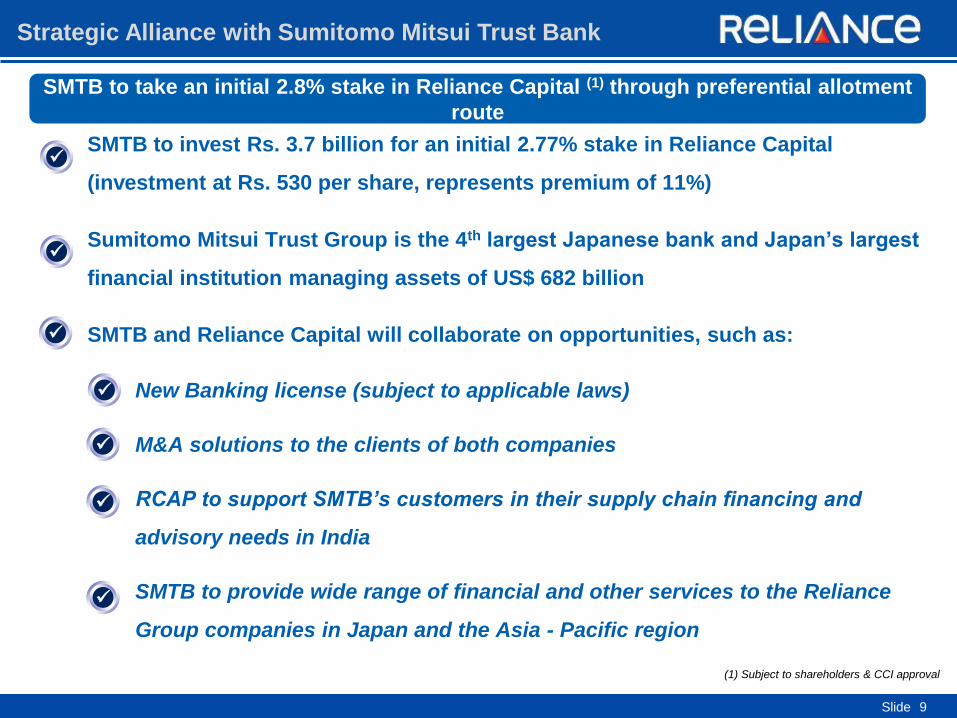
Strategic Alliance with Sumitomo Mitsui Trust Bank
SMTB to invest Rs. 3.7 billion for an initial 2.77% stake in Reliance Capital
(investment at Rs. 530 per share, represents premium of 11%)
Sumitomo Mitsui Trust Group is the 4th largest Japanese bank and Japan’s largest
financial institution managing assets of US$ 682 billion
SMTB and Reliance Capital will collaborate on opportunities, such as:
New Banking license (subject to applicable laws)
M&A solutions to the clients of both companies
RCAP to support SMTB’s customers in their supply chain financing and
advisory needs in India
SMTB to provide wide range of financial and other services to the Reliance
Group companies in Japan and the Asia - Pacific region
SMTB to take an initial 2.8% stake in Reliance Capital (1) through preferential allotment
route
(1) Subject to shareholders & CCI approval

Slide 10
Reliance Life Insurance
Slide 11
Key Highlights - Reliance Life Insurance
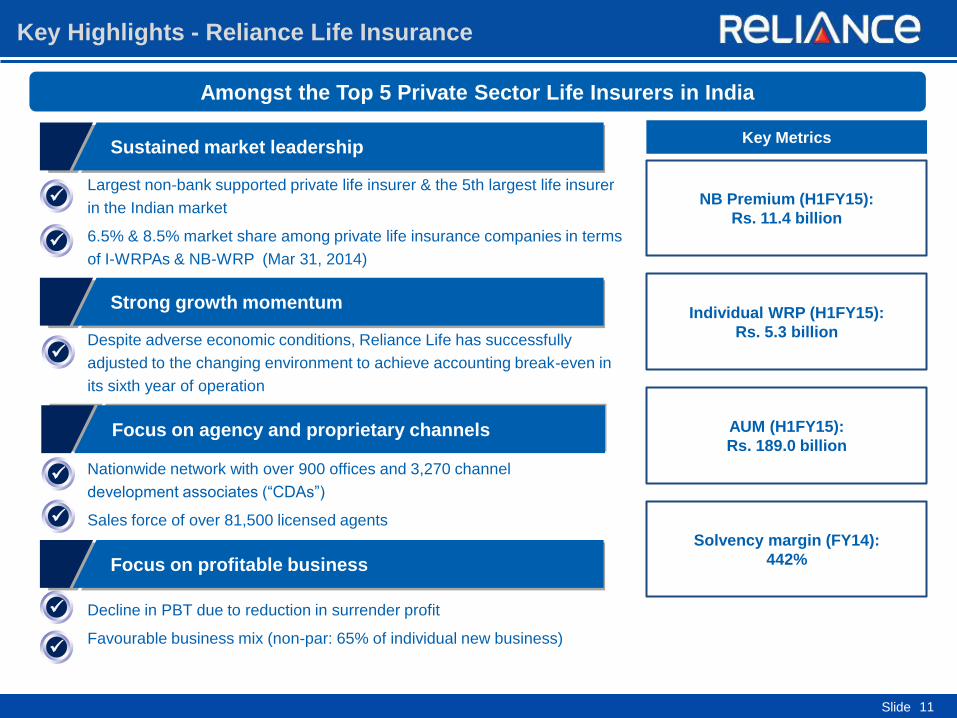
Largest non-bank supported private life insurer & the 5th largest life insurer
in the Indian market
6.5% & 8.5% market share among private life insurance companies in terms
of I-WRPAs & NB-WRP (Mar 31, 2014)
Key Metrics
NB Premium (H1FY15):
Rs. 11.4 billion
Individual WRP (H1FY15):
Rs. 5.3 billion
Amongst the Top 5 Private Sector Life Insurers in India
Sustained market leadership
AUM (H1FY15):
Rs. 189.0 billion
Solvency margin (FY14):
442%
Strong growth momentum
Despite adverse economic conditions, Reliance Life has successfully
adjusted to the changing environment to achieve accounting break-even in
its sixth year of operation
Focus on agency and proprietary channels
Focus on profitable business
Nationwide network with over 900 offices and 3,270 channel
development associates (“CDAs”)
Sales force of over 81,500 licensed agents
Decline in PBT due to reduction in surrender profit
Favourable business mix (non-par: 65% of individual new business)
Slide
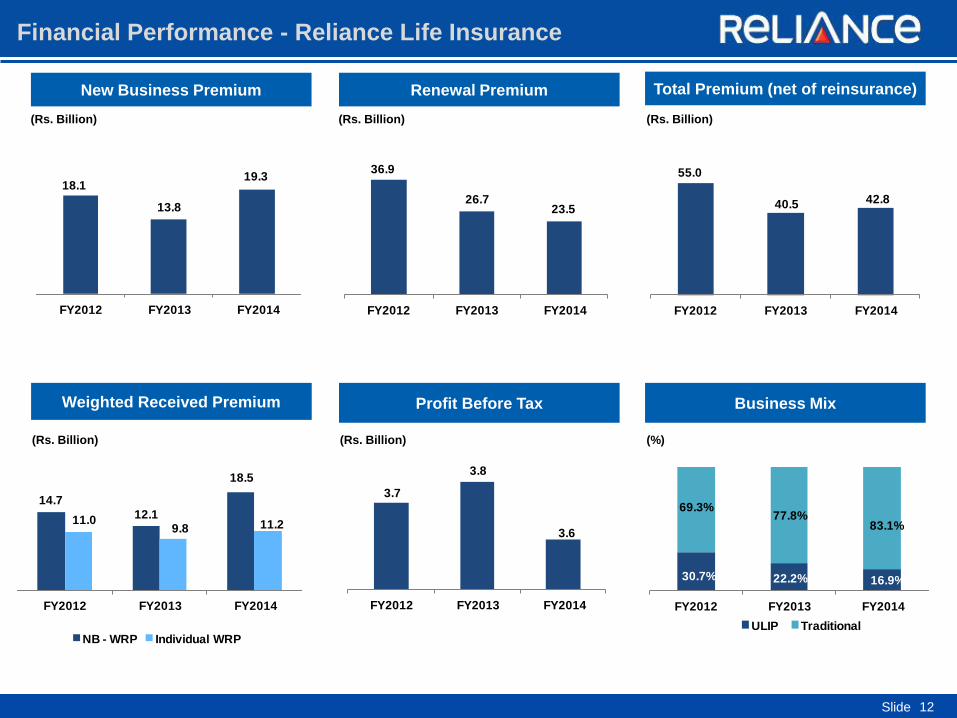
36.9
26.723.5
FY2012 FY2013 FY2014
12
Renewal Premium
Profit Before Tax Business Mix
Total Premium (net of reinsurance)
Weighted Received Premium
New Business Premium
(Rs. Billion) (Rs. Billion) (Rs. Billion)
(Rs. Billion) (Rs. Billion) (%)
18.1
13.8
19.3
FY2012 FY2013 FY2014
3.7
3.8
3.6
FY2012 FY2013 FY2014
55.0
40.5 42.8
FY2012 FY2013 FY2014
30.7% 22.2% 16.9%
69.3%77.8%
83.1%
FY2012 FY2013 FY2014
ULIP Traditional
14.7
12.1
18.5
11.09.8 11.2
FY2012 FY2013 FY2014
NB - WRP Individual WRP
Financial Performance - Reliance Life Insurance

Slide 13
Reliance General Insurance
Slide 14
Key highlights - Reliance General Insurance
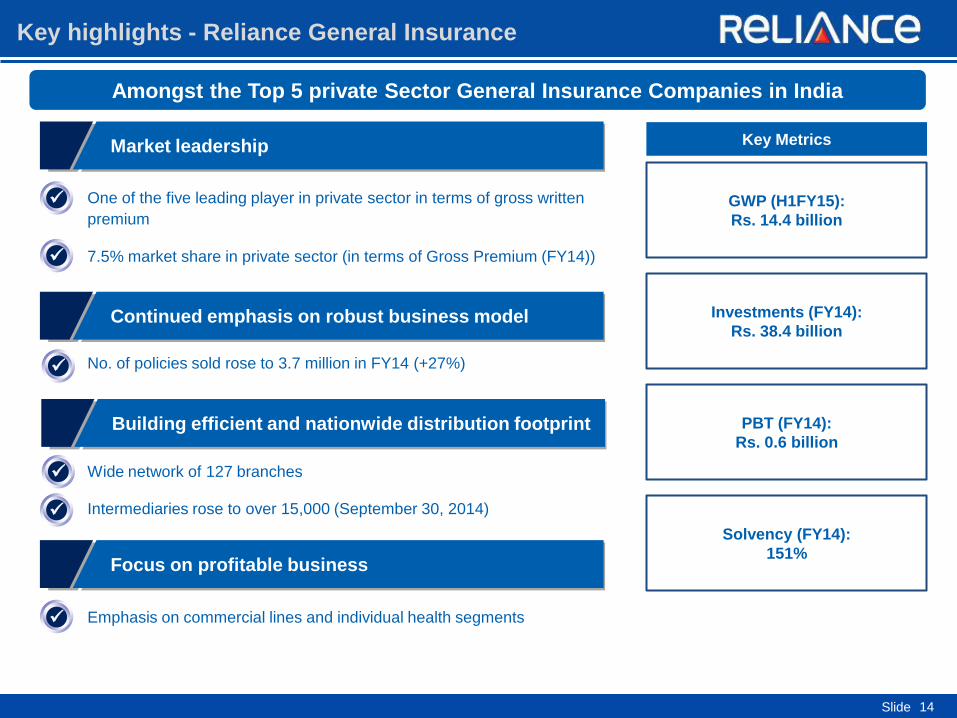
One of the five leading player in private sector in terms of gross written
premium
7.5% market share in private sector (in terms of Gross Premium (FY14))
Key Metrics
GWP (H1FY15):
Rs. 14.4 billion
Investments (FY14):
Rs. 38.4 billion
Amongst the Top 5 private Sector General Insurance Companies in India
Market leadership
PBT (FY14):
Rs. 0.6 billion
Solvency (FY14):
151%
Continued emphasis on robust business model
No. of policies sold rose to 3.7 million in FY14 (+27%)
Building efficient and nationwide distribution footprint
Focus on profitable business
Wide network of 127 branches
Intermediaries rose to over 15,000 (September 30, 2014)
Emphasis on commercial lines and individual health segments
Slide
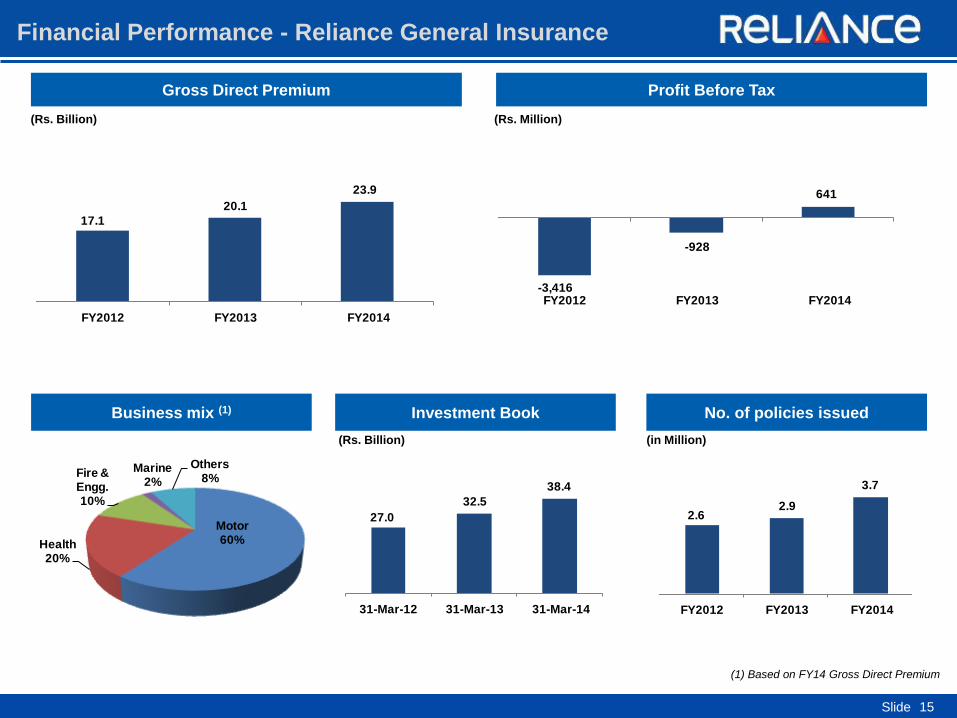
Motor60%Health
20%
Fire & Engg.10%
Marine2%
Others8%
15
Profit Before Tax
Business mix (1)
Gross Direct Premium
(Rs. Billion) (Rs. Million)
(Rs. Billion)
17.1
20.1
23.9
FY2012 FY2013 FY2014
-3,416
-928
641
FY2012 FY2013 FY2014
Investment Book No. of policies issued
27.0
32.5
38.4
31-Mar-12 31-Mar-13 31-Mar-14
2.62.9
3.7
FY2012 FY2013 FY2014
(in Million)
Financial Performance - Reliance General Insurance
(1) Based on FY14 Gross Direct Premium

Slide 16
Reliance Commercial Finance
Slide 17
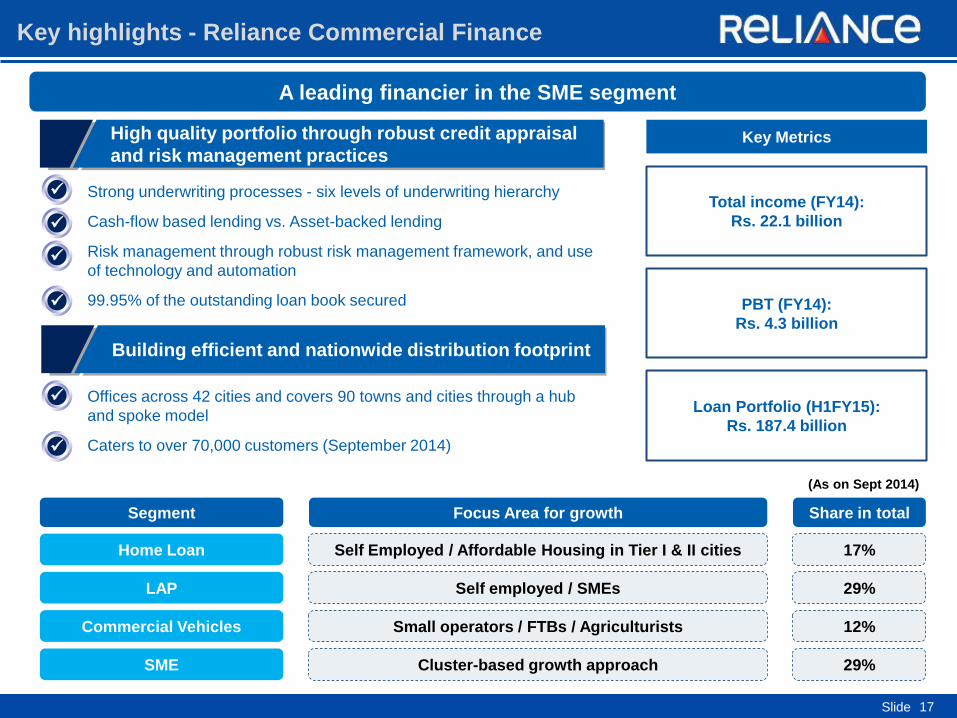
Key highlights - Reliance Commercial Finance
Key Metrics
Total income (FY14):
Rs. 22.1 billion
PBT (FY14):
Rs. 4.3 billion
A leading financier in the SME segment
Loan Portfolio (H1FY15):
Rs. 187.4 billion
High quality portfolio through robust credit appraisal
and risk management practices
Strong underwriting processes - six levels of underwriting hierarchy
Cash-flow based lending vs. Asset-backed lending
Risk management through robust risk management framework, and use
of technology and automation
99.95% of the outstanding loan book secured
Building efficient and nationwide distribution footprint
Offices across 42 cities and covers 90 towns and cities through a hub
and spoke model
Caters to over 70,000 customers (September 2014)
Segment
Home Loan
LAP
Commercial Vehicles
SME
Focus Area for growth
Self Employed / Affordable Housing in Tier I & II cities
Self employed / SMEs
Small operators / FTBs / Agriculturists
Cluster-based growth approach
Share in total
17%
29%
12%
29%
(As on Sept 2014)
Slide
Reliance Capital Asset Management
Slide
Over 170 customer touch points (including offices in Dubai, Singapore and
Mauritius) and 45,000 empanelled distributors
Building efficient and nationwide footprint
19
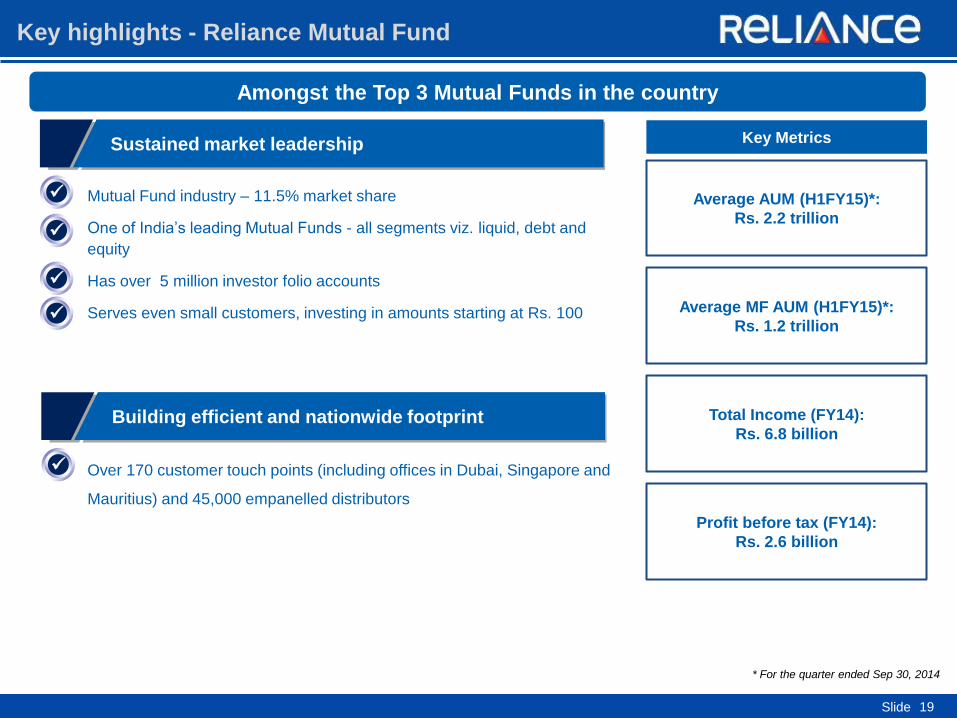
Key highlights - Reliance Mutual Fund
Key Metrics
Average AUM (H1FY15)*:
Rs. 2.2 trillion
Average MF AUM (H1FY15)*:
Rs. 1.2 trillion
Amongst the Top 3 Mutual Funds in the country
Total Income (FY14):
Rs. 6.8 billion
Profit before tax (FY14):
Rs. 2.6 billion
Mutual Fund industry – 11.5% market share
One of India’s leading Mutual Funds - all segments viz. liquid, debt and
equity
Has over 5 million investor folio accounts
Serves even small customers, investing in amounts starting at Rs. 100
Sustained market leadership
* For the quarter ended Sep 30, 2014
Slide 20
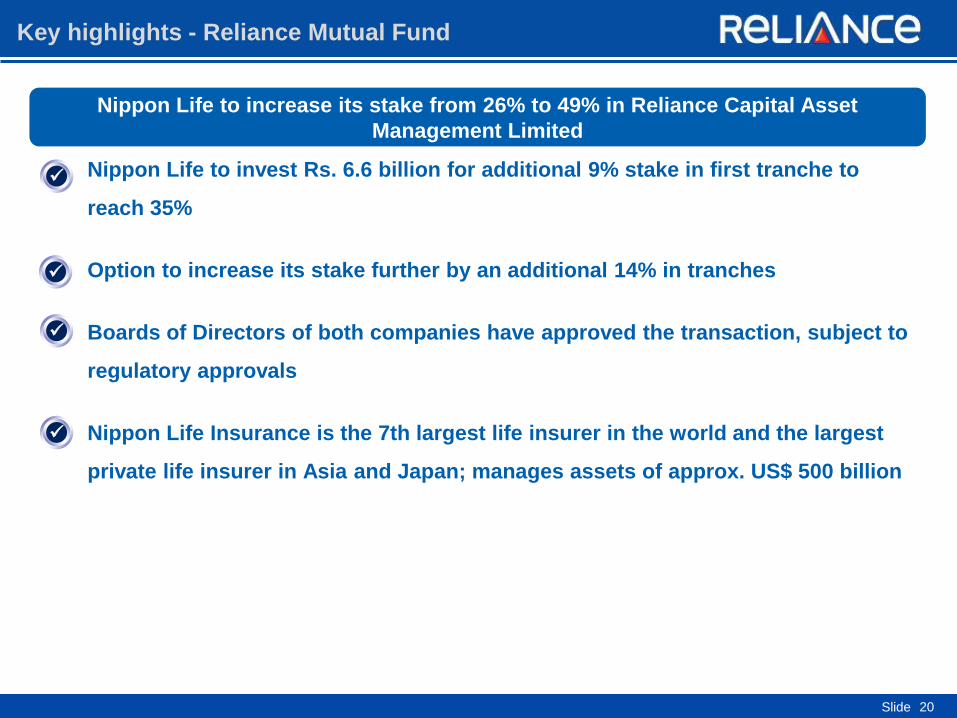
Key highlights - Reliance Mutual Fund
Nippon Life to invest Rs. 6.6 billion for additional 9% stake in first tranche to
reach 35%
Option to increase its stake further by an additional 14% in tranches
Boards of Directors of both companies have approved the transaction, subject to
regulatory approvals
Nippon Life Insurance is the 7th largest life insurer in the world and the largest
private life insurer in Asia and Japan; manages assets of approx. US$ 500 billion
Nippon Life to increase its stake from 26% to 49% in Reliance Capital Asset
Management Limited

Slide 21
Broking and Distribution
Slide 22
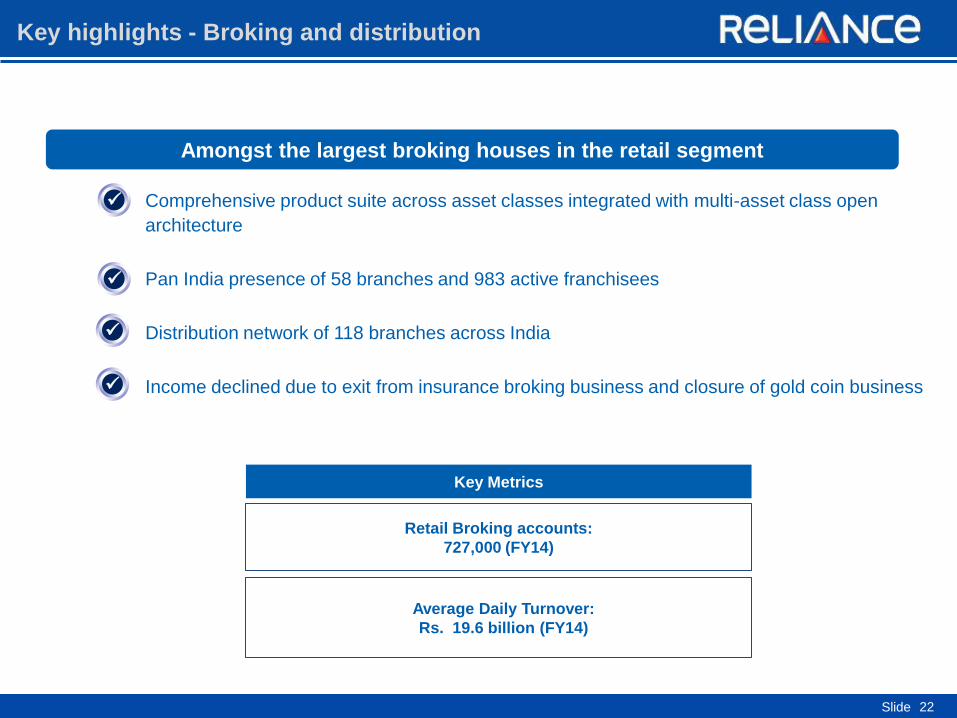
Key highlights - Broking and distribution
Key Metrics
Comprehensive product suite across asset classes integrated with multi-asset class open
architecture
Pan India presence of 58 branches and 983 active franchisees
Distribution network of 118 branches across India
Income declined due to exit from insurance broking business and closure of gold coin business
Retail Broking accounts:
727,000 (FY14)
Average Daily Turnover:
Rs. 19.6 billion (FY14)
Amongst the largest broking houses in the retail segment
Slide 23
Reliance Asset Reconstruction
Slide 24
Reliance Asset Reconstruction (“Reliance ARC”)
Reliance ARC is in the business of acquisition, management and
resolution of distressed debt / assets
The business also focuses on bilateral deals with banks and works
with the management of the NPA company for facilitating time
bound solutions
Assets under management as on March 31, 2014 was Rs. 8.66
billion

Slide 25
Shareholding Pattern & Financials
Slide 26
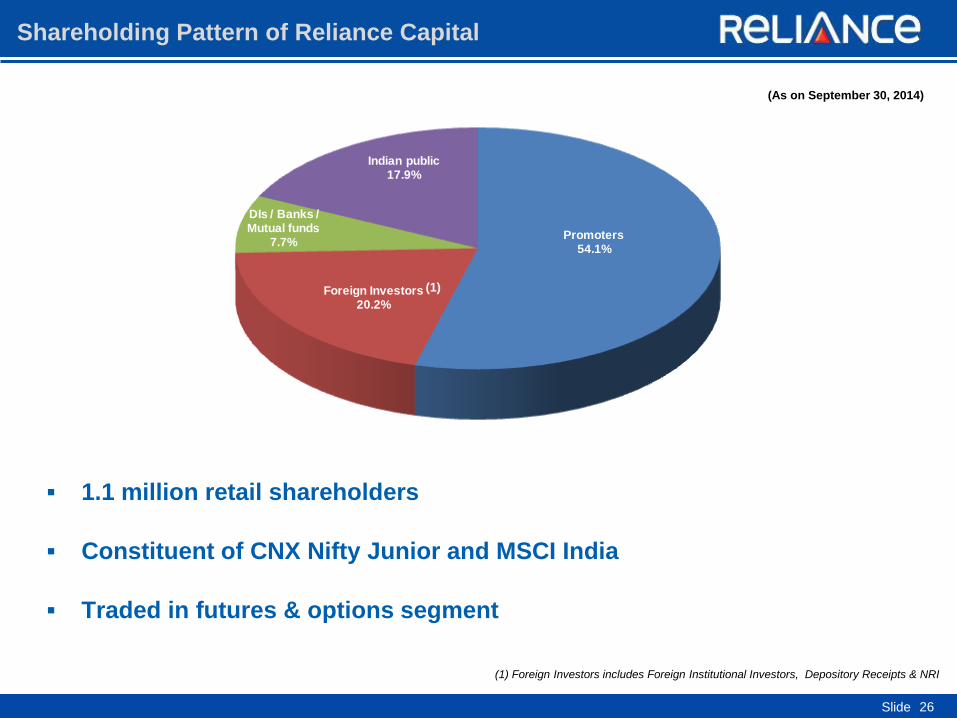
Shareholding Pattern of Reliance Capital
(As on September 30, 2014)
1.1 million retail shareholders
Constituent of CNX Nifty Junior and MSCI India
Traded in futures & options segment
Promoters54.1%
Foreign Investors20.2%
DIs / Banks / Mutual funds
7.7%
Indian public17.9%
(1) Foreign Investors includes Foreign Institutional Investors, Depository Receipts & NRI
(1)
Slide
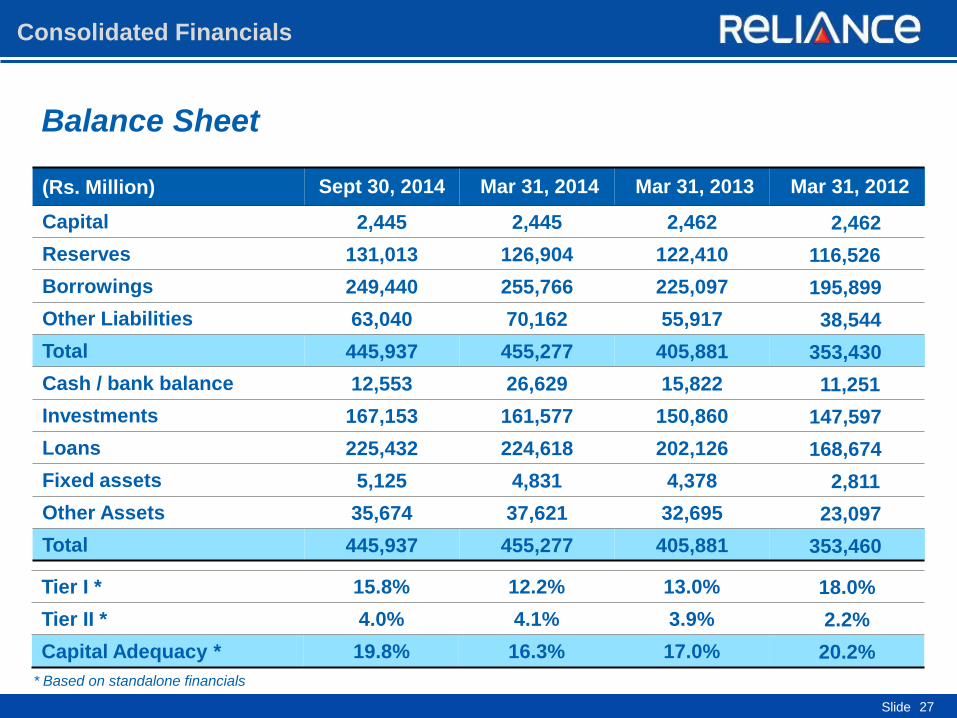
Consolidated Financials
(Rs. Million) Sept 30, 2014 Mar 31, 2014 Mar 31, 2013 Mar 31, 2012
Capital 2,445 2,445 2,462 2,462
Reserves 131,013 126,904 122,410 116,526
Borrowings 249,440 255,766 225,097 195,899
Other Liabilities 63,040 70,162 55,917 38,544
Total 445,937 455,277 405,881 353,430
Cash / bank balance 12,553 26,629 15,822 11,251
Investments 167,153 161,577 150,860 147,597
Loans 225,432 224,618 202,126 168,674
Fixed assets 5,125 4,831 4,378 2,811
Other Assets 35,674 37,621 32,695 23,097
Total 445,937 455,277 405,881 353,460
Balance Sheet
Tier I * 15.8% 12.2% 13.0% 18.0%
Tier II * 4.0% 4.1% 3.9% 2.2%
Capital Adequacy * 19.8% 16.3% 17.0% 20.2%
27
* Based on standalone financials
Slide
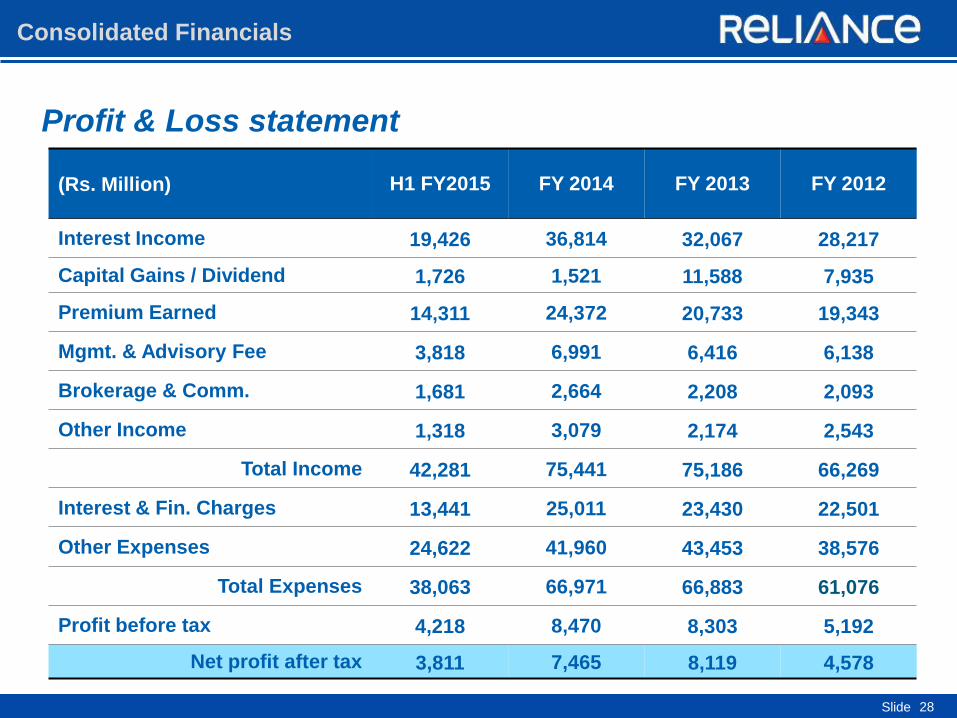
Consolidated Financials
(Rs. Million) H1 FY2015 FY 2014 FY 2013 FY 2012
Interest Income 19,426 36,814 32,067 28,217
Capital Gains / Dividend 1,726 1,521 11,588 7,935
Premium Earned 14,311 24,372 20,733 19,343
Mgmt. & Advisory Fee 3,818 6,991 6,416 6,138
Brokerage & Comm. 1,681 2,664 2,208 2,093
Other Income 1,318 3,079 2,174 2,543
Total Income 42,281 75,441 75,186 66,269
Interest & Fin. Charges 13,441 25,011 23,430 22,501
Other Expenses 24,622 41,960 43,453 38,576
Total Expenses 38,063 66,971 66,883 61,076
Profit before tax 4,218 8,470 8,303 5,192
Net profit after tax 3,811 7,465 8,119 4,578
28
Profit & Loss statement
Thank you

![Domino's launches latest Winter Flavours [Company Update]](https://img.pdfslide.us/doc/110x75/577ca6fb1a28abea748c2283/dominos-launches-latest-winter-flavours-company-update.jpg)