WP/16/173
China’s Growing Influence on Asian Financial Markets
by Serkan Arslanalp, Wei Liao, Shi Piao, and Dulani Seneviratne
IMF Working Papers describe research in progress by the author(s) and are published
to elicit comments and to encourage debate. The views expressed in IMF Working Papers
are those of the author(s) and do not necessarily represent the views of the IMF, its
Executive Board, or IMF management.

IMF Working Paper
Asia and Pacific Department
China’s Growing Influence on Asian Financial Markets
Prepared by Serkan Arslanalp, Wei Liao, Shi Piao, and Dulani Seneviratne 1
Authorized for distribution by Ranil Manohara Salgado
August 2016
Abstract
This paper finds that financial spillovers from China to regional markets are on the rise. The
main transmission channel appears to be trade linkages, although direct financial linkages are
playing an increasing role. Without an impact on global risk premiums, China’s influence on
regional markets is not yet to the level of the United States, but comparable to that of Japan.
If China-related shocks are coupled with a rise in global risk premiums, as in August 2015
and January 2016, spillovers to the region could be significantly larger. Over the medium
term, China’s financial spillovers could rise further with tighter financial linkages with the
region, including through the ongoing internationalization of the renminbi and China’s
capital account liberalization.
JEL Classification Numbers: F15, F41, G11, G15
Keywords: China, Spillovers, Equity markets, Foreign Exchange Markets
Author’s E-Mail Address: [email protected]; [email protected]; [email protected];
1 An earlier version of this paper was presented in the IMF's April 2016 Regional Economic Outlook: Asia and Pacific. We
are grateful to Patrick Blagrave, John Caparusso, Sally Chen, Davide Furceri, Jaime Guajardo, Fei Han, Thomas Harjes, Gee
Hee Hong, Joong Shik Kang, Raphael Lam, Jaewoo Lee, Lucy Liu, Rui Mano, Papa N’Diaye, Mehdi Raissi, Changyong
Rhee, Franto Ricka, Jay Surti, Katya Svirydzenka, and IMF seminar participants for helpful comments and suggestions. All
remaining errors are our own.
IMF Working Papers describe research in progress by the author(s) and are published to
elicit comments and to encourage debate. The views expressed in IMF Working Papers are
those of the author(s) and do not necessarily represent the views of the IMF, its Executive Board,
or IMF management.
Copyright 2016 International Monetary Fund WP/16/173

2
Contents Page
I. Introduction ______________________________________________________________4
II. Co-movements in Asian Markets: A First Glance ________________________________6
III. Channels of Financial Spillovers from China ___________________________________7
A. Trade Linkages _____________________________________________________8
B. Financial Linkages _________________________________________________10
IV. Event Study ____________________________________________________________14
V. Formal Empirical Results __________________________________________________17
VI. Sensitivity Tests ________________________________________________________23
VII. Conclusion ____________________________________________________________27
References ________________________________________________________________34
Annexes
Annex 1. Event Study: Exceptionally Large Movements In Chinese Markets___________ 28
Annex 2. Construction of The Dataset Used in the Empirical Analysis _________________30
Annex 3. Empirical Results: Bond Markets ______________________________________33
Figures
Figure 1. China’s Contribution to Global Growth and Recent Market Turbulence _________4
Figure 2. Asian Market Correlations with China and the United States _________________6
Figure 3. Asia: Business Cycle Synchronization with China __________________________7
Figure 4. Channels of Spillovers from a Slowdown in China _________________________8
Figure 5. Asia: Trade Exposure to China _________________________________________9
Figure 6. Asia: Financial Claims on China and Hong Kong SAR _____________________10
Figure 7. Major Emerging Markets: Total External Liabilities _______________________11
Figure 8. China: Outward Direct Investments and Bilateral Currency Swap Agreements,
end-2015 _________________________________________________________12
Figure 9. Selected Asia: Exchange Rate Depreciations during Risk-Off Episodes,
2010-16 __________________________________________________________13
Figure 10. Regional Equity and Foreign Exchange Markets during China-Related Shocks _14
Figure 11. Event Study: Asian Stock Market Movements when China Experiences
Outsized Market Movements ________________________________________15
Figure 12. Event Study: Asian Exchange Rate Movements when China Experiences
Outsized Market Movements ________________________________________16
Figure 13. Event Study: Asian Market Movements when China Experiences Outsized
Market Movements, Conditional on the VIX ____________________________16
Figure 14. Equity Market Spillovers ____________________________________________19
Figure 15. Asian Stock Markets: Determinants of Beta Coefficients with Center
Economies _______________________________________________________20
Figure 16. Asian Stock Markets: Determinants of Beta Coefficients with China _________21
Figure 17. Scenario Analysis: Transmission of Shocks _____________________________22
Figure 18. Asian Market Sensitivity to China under Different Scenarios _______________22
3
Tables
Table 1. Global Risk-off Episode Since 1992 ____________________________________13
Table 2. Asian Stock Markets: First-Stage Results––Estimated Beta Coefficients ________19
Table 3. Asian Stock Markets: Second-Stage Results––Determinants of Beta Coefficients _20
Table 4. Asian Stock Markets: Financial Linkages with China: Pre-GFC vs. Post-GFC ___21
Table 5. Sensitivity Tests: Drivers of Asian Equity Market Sensitivity to China _________24
Annex Tables
Annex Table 1.1. Event Study: Exceptionally Large Movements in the Chinese
Market ____________________________________________________28
Annex Table 1.2. Event Study: Exceptionally Large Movements in the Chinese Onshore
Spot Exchange Rate (CNY) ____________________________________29
Annex Table 2.1. Correlation between the Variables in First Stage ____________________32
Annex Table 2.2. Correlation between the Variables in Second Stage _________________32
Annex Table 3.1. Asian Bond Markets: First Stage Results––Estimated Beta Coefficients _33
Annex Table 3.2. Asian Bond Markets: Second-Stage Results––Determinants of Beta
Coefficients ________________________________________________33

4
I. INTRODUCTION
The rise of China—now the world’s second largest economy at market exchange
rates—has been a key driver of global growth in recent years. During 2000–15, China
accounted for nearly one-third of global growth. Moreover, its contribution to global growth
rose almost every year since 2000 (Figure 1). Over the same period, exports to China
increased dramatically from 3 percent to 9 percent of world exports and from 9 percent to
22 percent of Asian exports. Furthermore, despite remaining capital account restrictions,
China’s financial linkages with the world have grown considerably. China’s total external
liabilities are now around US$5 trillion, and far exceed that of any other emerging market.
China’s external assets, including reserves, are even larger, at US$6.2 trillion as of 2015.
As the world becomes more reliant on Chinese growth, surprises to China’s growth
outlook are likely to have greater spillovers. The Chinese economy is undergoing a
transition to a model driven increasingly by consumption and services, with growth gradually
slowing to a more sustainable pace (IMF, 2015). This transition is a desirable outcome that is
good for global growth as it reduces tail risks in the long term. In the short term, however,
this shift can be bumpy, as exemplified by the recent turbulence after June 2015 (Figure 1).
Until now, the Chinese stock market remains more than 40 percent below its June 2015 peak,
while more than half of the countries in the MSCI Asia and MSCI Emerging Markets indices
have experienced falls of more than 20 percent from their 2015 peaks.
This paper addresses the following questions arising from these developments. What are
the potential spillover channels from China to financial markets? Are financial spillovers
from China rising, in particular to Asian markets? 2 How do we quantify the size of these
2 As explained later in the paper, financial spillovers are defined as the transmission of a shock—real or financial—in one
country (China) to asset prices in other countries, in line with IMF (2016b). This definition excludes co-movements across
markets due to common factors.
5
spillovers, and what are the roles of different factors such as trade and financial linkages in
driving the spillovers?
The main findings of this paper, which are supported by event studies and an empirical
analysis, are as follows: Financial spillovers from China to regional markets are on the rise,
in particular in equity and foreign exchange markets, and are stronger for economies with
greater trade linkages with China. At the same time, the role of financial linkages in driving
spillovers is growing in importance. Empirical analysis using daily data from 2001 to 2014
confirm that major equity markets in Asia are increasingly influenced by China's equity
market, although not yet to the level of the United States. Finally, if China-related shocks are
coupled with global risk aversion episodes, similar to those experienced in August 2015 and
January 2016, the impact on regional markets could be much larger.3
These findings are robust to an extensive series of sensitivity tests. In particular, the
results are virtually identical whether stock returns are measured in dollars or local currency,
or whether they are expressed in absolute or excess returns. Similarly, the main results are
broadly the same for commodity exporters and importers. Finally, controlling for additional
factors, such as macro-financial vulnerabilities or the presence of common investors in
regional markets, does not change the main findings.
The main policy implications of these findings are as follows. For China, continued efforts
to communicate its policy intentions clearly and effectively will remain essential, given its
rising influence on regional markets. For other countries in the region, macroeconomic and
macro-prudential policies can be used to build resilience against shocks emanating from
China, as discussed later in the paper. Finally, over the long term, diversifying sources of
growth in the region, including through promoting the growth of the services sector can help
reduce reliance on exports and diminish spillovers.
The rest of the paper is organized as follows. Section II presents stylized facts on the co-
movement of Chinese and Asian markets in recent years. Section III describes possible
channels of spillovers that may be driving these co-movements. Section IV presents the
results of an event study to examine how regional markets have been responding to large
movements in Chinese markets. Section V conducts a formal empirical analysis to quantify
the magnitude of these spillovers and assess the drivers behind it. Section VI summarizes a
series of sensitivity tests. Section VII concludes by elaborating on key policy implications.
3 These results are broadly in line with the previous literature on transmission of shocks. In particular, Forbes and Chinn
(2004) find that, despite the growth in global financial flows, direct trade still appears to be the most important determinant
of how movements in the world’s largest markets affect financial markets around the globe. Brooks and Del Negro (2003)
document a significant relationship between trade exposure and firm-level stock returns over annual periods. Another strand
of literature finds that financial shocks spread mostly through financial linkages during contagion (Forbes, 2013; Claessens,
Tong, and Zuccardi, 2012; IMF, 2013).
6
II. CO-MOVEMENTS IN ASIAN MARKETS: A FIRST GLANCE
Co-movement of asset returns can be due to spillovers or due to common or correlated
shocks. Financial spillovers are defined in this paper as the transmission of a shock in one
country (China) to asset prices in other countries, in line with IMF (2016b). The shocks could
originate from either real shocks (such as news about growth prospects) or pure financial
shocks (such as news about a change in the exchange rate regime), or a mixture of both. This
definition excludes co-movements across markets due to common factors, as spillovers are
identified with the transmission of a country-specific shock to other countries (IMF 2013).
Conceptually, the size of spillovers is influenced by (i) the magnitude of the shock in the
originator country, (ii) the extent of economic and financial linkages (direct and indirect)
between the originator and the recipient countries, and (iii) the underlying vulnerabilities and
policy space of recipient countries (Kubelec and Sa, 2008). In this vein, this section presents
some stylized facts on the co-movement of Chinese and Asian markets, before delving into
the specific channels through which China may have spillovers on regional markets.
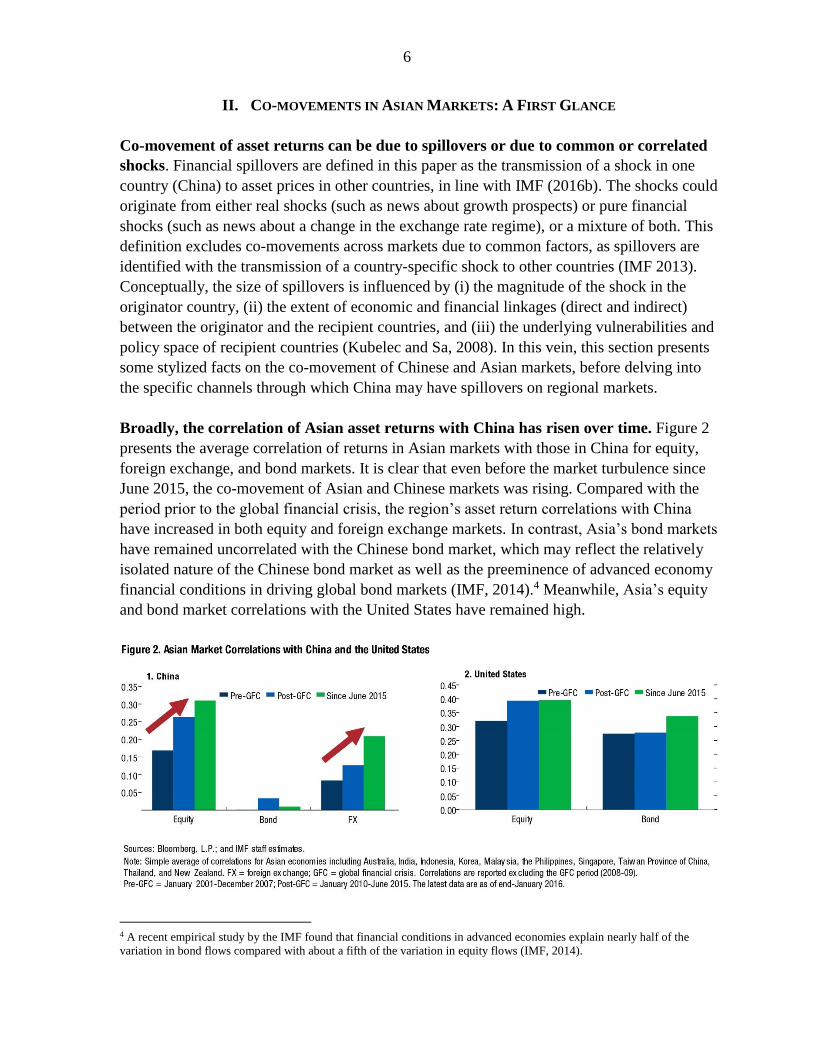
Broadly, the correlation of Asian asset returns with China has risen over time. Figure 2
presents the average correlation of returns in Asian markets with those in China for equity,
foreign exchange, and bond markets. It is clear that even before the market turbulence since
June 2015, the co-movement of Asian and Chinese markets was rising. Compared with the
period prior to the global financial crisis, the region’s asset return correlations with China
have increased in both equity and foreign exchange markets. In contrast, Asia’s bond markets
have remained uncorrelated with the Chinese bond market, which may reflect the relatively
isolated nature of the Chinese bond market as well as the preeminence of advanced economy
financial conditions in driving global bond markets (IMF, 2014).4 Meanwhile, Asia’s equity
and bond market correlations with the United States have remained high.
4 A recent empirical study by the IMF found that financial conditions in advanced economies explain nearly half of the
variation in bond flows compared with about a fifth of the variation in equity flows (IMF, 2014).

7
The rising co-movement of Asian and Chinese markets is in line with the region’s rising
business cycle synchronization with China. In fact, countries with a higher degree of
business cycle synchronization with China have, on average, seen their equity markets move
more closely with China (Figure 3). This may point to the importance of real linkages as a
determinant for equity market spillovers into the rest of Asia. However, before reaching such
a conclusion we have to dig a bit deeper. Hence, in the next section, we discuss the various
channels through which China-specific shocks may have spillovers on regional markets.
III. CHANNELS OF FINANCIAL SPILLOVERS FROM CHINA
Shocks in China could be transmitted to financial markets through multiple channels,
including international trade, price effects on tradable goods, financial flows, and even
general market sentiment. In particular, negative news about China’s growth prospects
could cause negative returns in other countries’ asset market through four distinct channels:
Direct trade linkages, where a slowdown in the Chinese economy lowers exports from
countries with close trade ties with China. As a result of lower sales and earnings from
China, stock market valuations and local currencies of trading partners weaken.
Indirect trade (commodity price) linkages, where concerns over China's slowdown
weigh on global commodity prices. This could weaken stock market valuations and
currencies of commodity exporters.
Direct financial linkages, where a negative shock in China leads to losses on
international investor positions on China (mainland and Hong Kong SAR).

8
Indirect financial linkages, where countries are affected negatively as global risk
premiums rise in response to a growth shock or uncertainty in China.
Asian economies have varying exposures to these spillover channels (Figure 4). In
particular, Australia, Korea, Malaysia, Singapore, Taiwan Province of China, Thailand, and
Vietnam have strong direct trade linkages with China, as measured by the value added of
their exports embedded into final demand in China (more than 4 percent of GDP).5 In terms
of the commodity channel, Australia, Indonesia, Malaysia, and New Zealand are exposed as
the net commodity exporters in the region. In contrast, only Korea, Singapore, and Taiwan
Province of China have substantial direct financial links with China (mainland and Hong
Kong SAR). Finally, Japan, Indonesia, and Malaysia, could be exposed to indirect financial
spillovers, as they tend to be affected by episodes of global risk aversion (or “risk-off”
episodes), as discussed later in this section.
A. Trade Linkages
Shocks can be transmitted from China to regional markets not only due to direct trade links
but also due to indirect trade links via third countries (trade competition) as well as spillovers
through commodity prices. In particular:
5 Studies that try to account for “higher-round” effects of a trade slowdown in China, such as Kireyev and Leonidov (2016),
find similarly that these countries would be relatively more exposed to a trade slowdown in China.

9
Direct trade linkages
During the last decade, the region’s trade links with China have grown significantly.
Countries in Asia have become deeply integrated with China, as China's size and its
centrality to the global supply chain have increased rapidly. China now accounts for about
50 percent of intraregional trade flows of imported inputs, doubling its share since 1995
(IMF 2015). China has also become a larger
consumer of final goods produced in other parts
of Asia. The exposure to final demand in China
has been increasing for nearly all Asian
economies (Figure 5). This is a departure from
the past, when exports of intermediates or export-
related inputs dominated Asia’s export product
profile to China. According to the latest data,
value added in exports embedded into final
demand in China is more than 4 percent of GDP
for Australia, Korea, Malaysia, Singapore,
Taiwan Province of China, Thailand, and
Vietnam (Figure 5). This means that a decline in
Chinese import volumes by 10 percent due to
weaker Chinese domestic demand could take off 0.4 percentage points or more off growth
from these economies.6
Indirect trade linkages
Trade competition with China could work as an additional transmission mechanism,
but it is difficult to predict how this channel would operate ex-ante. Several economies in
the region compete with China in third markets and this could generate positive or negative
spillovers from China depending on the China-specific shock. On the one hand, if negative
news about China’s growth prospects reflect factors hurting firm competitiveness, such as
disappointing productivity growth, this could improve relative competitiveness of other
countries’ exports and generate a positive shock to the other countries’ markets. On the other
hand, if such news corresponds to a depreciation of China’s exchange rate, giving its exports
a competitive advantage, this could generate a negative shock to the trade competitors of
China. Hence, trade competition with China can lead to either positive or negative spillovers,
a point which we return to and test for empirically in Section V.
Moreover, China is a large consumer of commodities and hence negative news about its
growth outlook could weigh on commodity exporters. As discussed earlier, concerns over
China's slowdown can weigh on global commodity prices, which could then weaken stock
6 Several studies have examined potential spillovers of a Chinese slowdown on the region’s growth and exports (Ahuja and
Nabar, 2012; Duval and others, 2014; Cashin and others, 2016; Dizioli and others, 2016; and Hong and others, 2016).

10
market valuations and currencies of commodity exporters. At the same time, this channel
may not be as strong in Asia as in other regions. First, except for Australia, Indonesia,
Malaysia, and New Zealand, Asia has mostly commodity importers which would benefit
from lower commodity prices. Second, various studies suggest that significant heterogeneity
exists in the price sensitivity of commodities to the growth outlook in China (Goldman
Sachs, 2016; IMF, 2016c). In particular, while China’s slowdown is associated with lower
metal prices, its impact on oil and food prices appear to be more limited.
Finally, indirect trade linkages could also include the impact on a country from third
countries that have a direct trade exposure with China. However, as we measure trade
linkages using value added data from the OECD TiVA database, our measure of direct trade
linkages would already capture trade exposures through third countries (see Figure 5).
B. Financial Linkages
On the financial side, shocks can be transmitted from China to regional markets due to direct
financial links but also due to indirect links via common investors as well as through global
risk aversion episodes. In particular:
Direct financial linkages
The region’s financial links with China have risen in
recent years, both through direct links and through
Hong Kong SAR. 7 Financial claims on China and Hong
Kong SAR combined (including portfolio, bank, and
foreign direct investment exposures) were more than
10 percent of GDP for Korea, Singapore, and Taiwan
Province of China according to latest available data as
of end of 2014 (Figure 6). Cross-border bank exposures
to China have expanded especially quickly. According
to Fitch estimates, banks in the Asia-Pacific region
accumulated about US$1.2 trillion of China-related
exposures by the end of 2015, driven by closer
economic ties with China and a booming offshore
renminbi business.8 In particular, at the end of 2015
cross-border loans to China accounted for 27 percent of banking system assets in Hong Kong
SAR, followed by Singapore (15 percent), and Taiwan Province of China (7 percent). More
7 As a global financial center and hub for offshore renminbi clearing and settlement, Hong Kong SAR intermediates funds
from other countries to China. Hong Kong SAR accounted for nearly half of China’s external liabilities at the end of 2015.
About 50 to 60 percent of the Hang Seng Index is comprised of mainland companies listed in Hong Kong SAR.
8 The development of offshore renminbi centers, of which eight are in the region, has supported the growth of cross-border
bank linkages. About RMB 2 trillion of deposits was estimated to be held outside of China at the end of 2015.
11
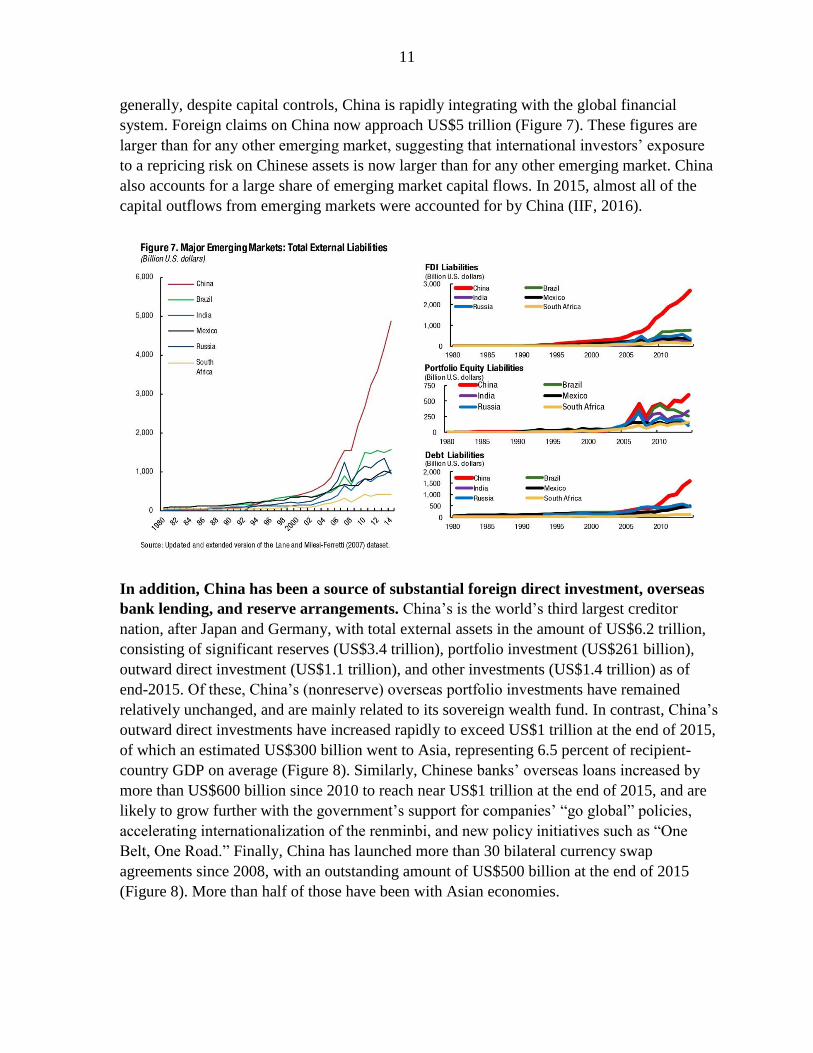
generally, despite capital controls, China is rapidly integrating with the global financial
system. Foreign claims on China now approach US$5 trillion (Figure 7). These figures are
larger than for any other emerging market, suggesting that international investors’ exposure
to a repricing risk on Chinese assets is now larger than for any other emerging market. China
also accounts for a large share of emerging market capital flows. In 2015, almost all of the
capital outflows from emerging markets were accounted for by China (IIF, 2016).
In addition, China has been a source of substantial foreign direct investment, overseas
bank lending, and reserve arrangements. China’s is the world’s third largest creditor
nation, after Japan and Germany, with total external assets in the amount of US$6.2 trillion,
consisting of significant reserves (US$3.4 trillion), portfolio investment (US$261 billion),
outward direct investment (US$1.1 trillion), and other investments (US$1.4 trillion) as of
end-2015. Of these, China’s (nonreserve) overseas portfolio investments have remained
relatively unchanged, and are mainly related to its sovereign wealth fund. In contrast, China’s
outward direct investments have increased rapidly to exceed US$1 trillion at the end of 2015,
of which an estimated US$300 billion went to Asia, representing 6.5 percent of recipient-
country GDP on average (Figure 8). Similarly, Chinese banks’ overseas loans increased by
more than US$600 billion since 2010 to reach near US$1 trillion at the end of 2015, and are
likely to grow further with the government’s support for companies’ “go global” policies,
accelerating internationalization of the renminbi, and new policy initiatives such as “One
Belt, One Road.” Finally, China has launched more than 30 bilateral currency swap
agreements since 2008, with an outstanding amount of US$500 billion at the end of 2015
(Figure 8). More than half of those have been with Asian economies.

12
Going forward, China’s financial links with the world are set to grow further with the
internationalization of the renminbi and gradual capital account liberalization. The
adjustment in China’s gross investment position could potentially be very large. Bayoumi and
Ohnsorge (2013) estimate that capital account liberalization in China may be followed by a stock
adjustment of Chinese assets abroad on the order of 15–25 percent of GDP and a smaller stock
adjustment for foreign assets in China on the order of 2–10 percent of GDP. In 2016, China took
another important step to open up its interbank bond market to foreign investors, and thus foreign
inflows to its large bond market may increase soon. If China’s domestic A-shares were included
in global equity indices such as the Morgan Stanley Capital International (MSCI) Emerging
Markets Index—an index estimated to be followed by US$1.5 trillion of funds— the gradual
portfolio rebalancing by global equity investors could also be large.
Indirect financial linkages
China and regional markets can have indirect financial linkages because of common
investors in a third country. For example, as discussed in Gong and Kim (2013), a shock in
China could be transmitted to Korea because of losses incurred by a large investor in a third
country, which may force a sale of assets in Korea (for example to meet margin requirements).
The presence of such a common investor would then generate indirect financial linkages between
the two economies, even if they were not directly related. To test this hypothesis, Section VI
constructs an “investor similarity index” for countries in the region and examines whether it plays
an important role in the transmission of shocks from China to regional market.
In addition, to the extent that China-related shocks affect global risk premiums, countries
may be affected by global risk aversion episodes. For example, concerns about China’s growth
outlook could worry investors about global growth itself, given China’s large contribution to it.
13
Alternatively, a large unexpected depreciation of the renminbi could lead to perceptions of a
possible round of competitive devaluation in other emerging markets and increase risk premiums
across global markets, leading to a sizeable asset reallocation and tightening of global financial
conditions.9
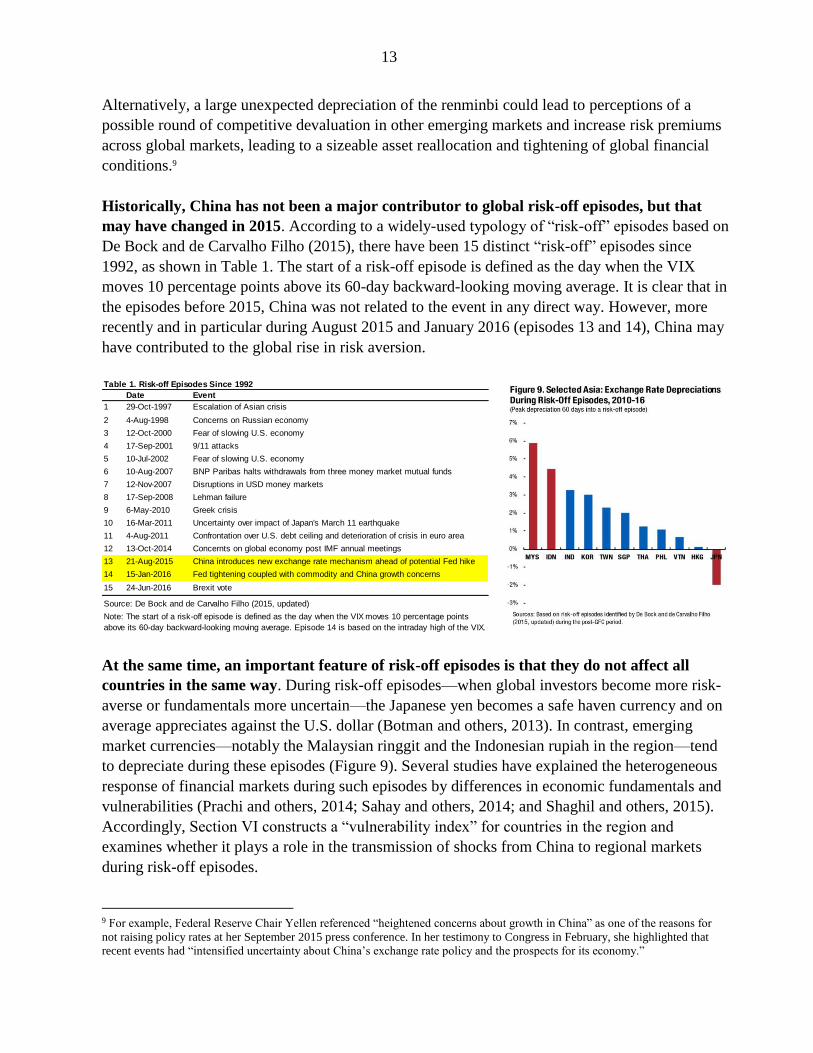
Historically, China has not been a major contributor to global risk-off episodes, but that
may have changed in 2015. According to a widely-used typology of “risk-off” episodes based on
De Bock and de Carvalho Filho (2015), there have been 15 distinct “risk-off” episodes since
1992, as shown in Table 1. The start of a risk-off episode is defined as the day when the VIX
moves 10 percentage points above its 60-day backward-looking moving average. It is clear that in
the episodes before 2015, China was not related to the event in any direct way. However, more
recently and in particular during August 2015 and January 2016 (episodes 13 and 14), China may
have contributed to the global rise in risk aversion.
At the same time, an important feature of risk-off episodes is that they do not affect all
countries in the same way. During risk-off episodes—when global investors become more risk-
averse or fundamentals more uncertain—the Japanese yen becomes a safe haven currency and on
average appreciates against the U.S. dollar (Botman and others, 2013). In contrast, emerging
market currencies—notably the Malaysian ringgit and the Indonesian rupiah in the region—tend
to depreciate during these episodes (Figure 9). Several studies have explained the heterogeneous
response of financial markets during such episodes by differences in economic fundamentals and
vulnerabilities (Prachi and others, 2014; Sahay and others, 2014; and Shaghil and others, 2015).
Accordingly, Section VI constructs a “vulnerability index” for countries in the region and
examines whether it plays a role in the transmission of shocks from China to regional markets
during risk-off episodes.
9 For example, Federal Reserve Chair Yellen referenced “heightened concerns about growth in China” as one of the reasons for
not raising policy rates at her September 2015 press conference. In her testimony to Congress in February, she highlighted that
recent events had “intensified uncertainty about China’s exchange rate policy and the prospects for its economy.”
Date Event
1 29-Oct-1997 Escalation of Asian crisis
2 4-Aug-1998 Concerns on Russian economy
3 12-Oct-2000 Fear of slowing U.S. economy
4 17-Sep-2001 9/11 attacks
5 10-Jul-2002 Fear of slowing U.S. economy
6 10-Aug-2007 BNP Paribas halts withdrawals from three money market mutual funds
7 12-Nov-2007 Disruptions in USD money markets
8 17-Sep-2008 Lehman failure
9 6-May-2010 Greek crisis
10 16-Mar-2011 Uncertainty over impact of Japan's March 11 earthquake
11 4-Aug-2011 Confrontation over U.S. debt ceiling and deterioration of crisis in euro area
12 13-Oct-2014 Concernts on global economy post IMF annual meetings
13 21-Aug-2015 China introduces new exchange rate mechanism ahead of potential Fed hike
14 15-Jan-2016 Fed tightening coupled with commodity and China growth concerns
15 24-Jun-2016 Brexit vote
Source: De Bock and de Carvalho Filho (2015, updated)
Note: The start of a risk-off episode is defined as the day when the VIX moves 10 percentage points
above its 60-day backward-looking moving average. Episode 14 is based on the intraday high of the VIX.
Table 1. Risk-off Episodes Since 1992
14
Finally, an indirect link between China and regional markets could arise from China’s
potential influence on the U.S. Treasury market. China holds the world’s largest foreign
exchange reserves in the amount of US$3.4 trillion as of end-2015. A substantial portion of these
reserves are invested in U.S. Treasury debt securities, according to the U.S. Treasury International
Capital (TIC) reporting system. As a result, some have argued that China has an impact on the
U.S. Treasury bond yields, in particular through its reserve management policies. Several studies,
however, question that assumption. For example, an influential Federal Reserve study estimated
that even if there had been no foreign purchases of U.S. bonds over 2004–05, U.S. long-term
interest rates would have been only 150 basis points higher than they actually were (Warnock and
Warnock, 2005). Since China accounted for about 15 percent of net foreign purchases of U.S.
dollar bonds at the time, it would appear that China's contribution to the total interest rate effect of
foreign purchases of U.S. Treasury bonds was quite small, about 20 to 25 basis points. Given this
and the difficulty of measuring precisely the impact of a slowdown in China on U.S. Treasury
rates, this channel is not examined in the paper.
IV. EVENT STUDY
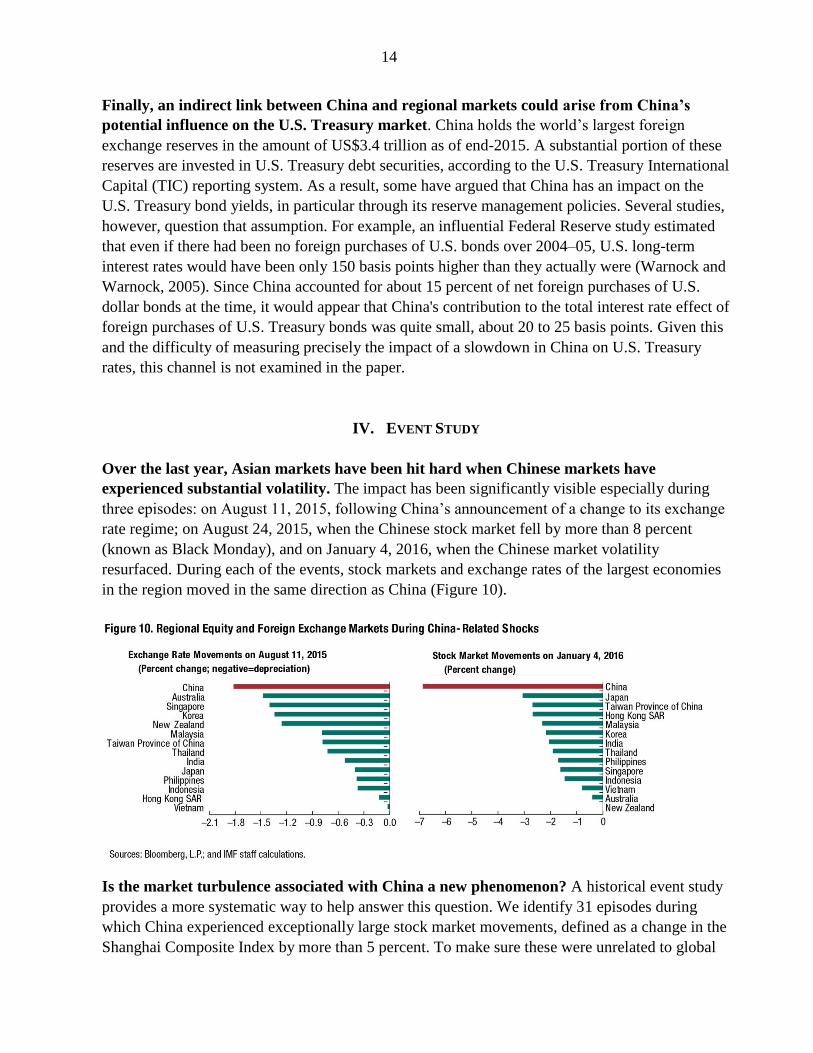
Over the last year, Asian markets have been hit hard when Chinese markets have
experienced substantial volatility. The impact has been significantly visible especially during
three episodes: on August 11, 2015, following China’s announcement of a change to its exchange
rate regime; on August 24, 2015, when the Chinese stock market fell by more than 8 percent
(known as Black Monday), and on January 4, 2016, when the Chinese market volatility
resurfaced. During each of the events, stock markets and exchange rates of the largest economies
in the region moved in the same direction as China (Figure 10).
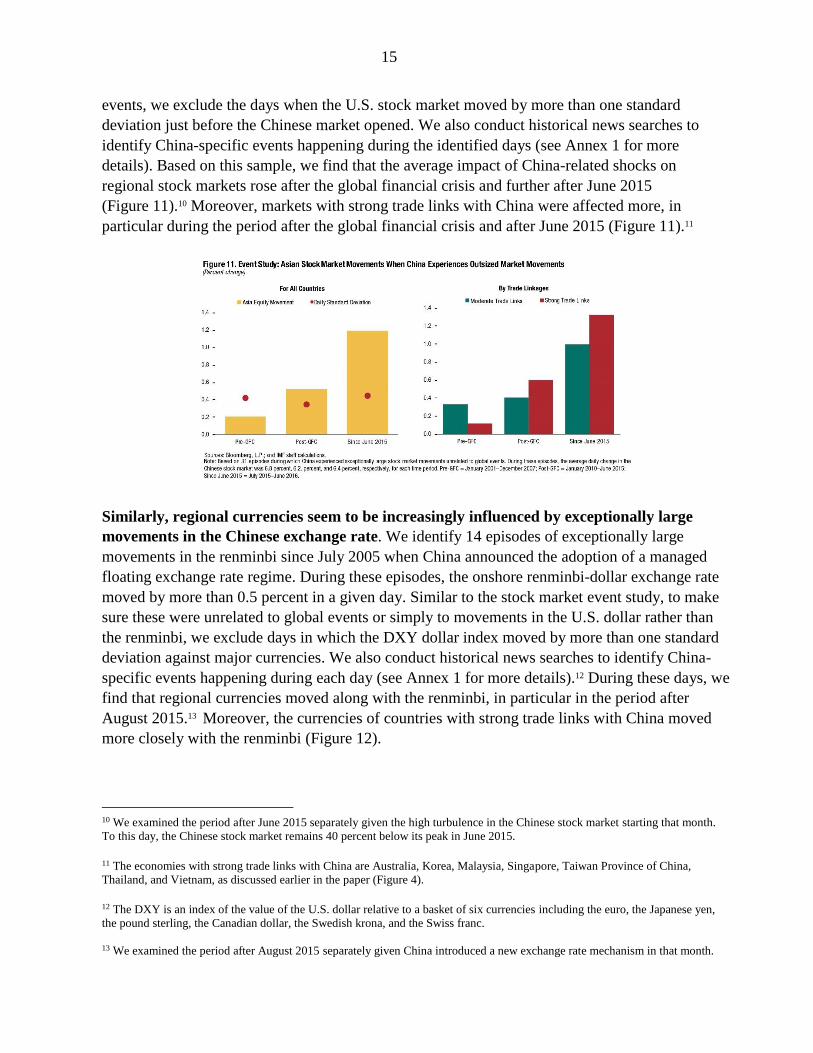
Is the market turbulence associated with China a new phenomenon? A historical event study
provides a more systematic way to help answer this question. We identify 31 episodes during
which China experienced exceptionally large stock market movements, defined as a change in the
Shanghai Composite Index by more than 5 percent. To make sure these were unrelated to global
15
events, we exclude the days when the U.S. stock market moved by more than one standard
deviation just before the Chinese market opened. We also conduct historical news searches to
identify China-specific events happening during the identified days (see Annex 1 for more
details). Based on this sample, we find that the average impact of China-related shocks on
regional stock markets rose after the global financial crisis and further after June 2015
(Figure 11).10 Moreover, markets with strong trade links with China were affected more, in
particular during the period after the global financial crisis and after June 2015 (Figure 11).11
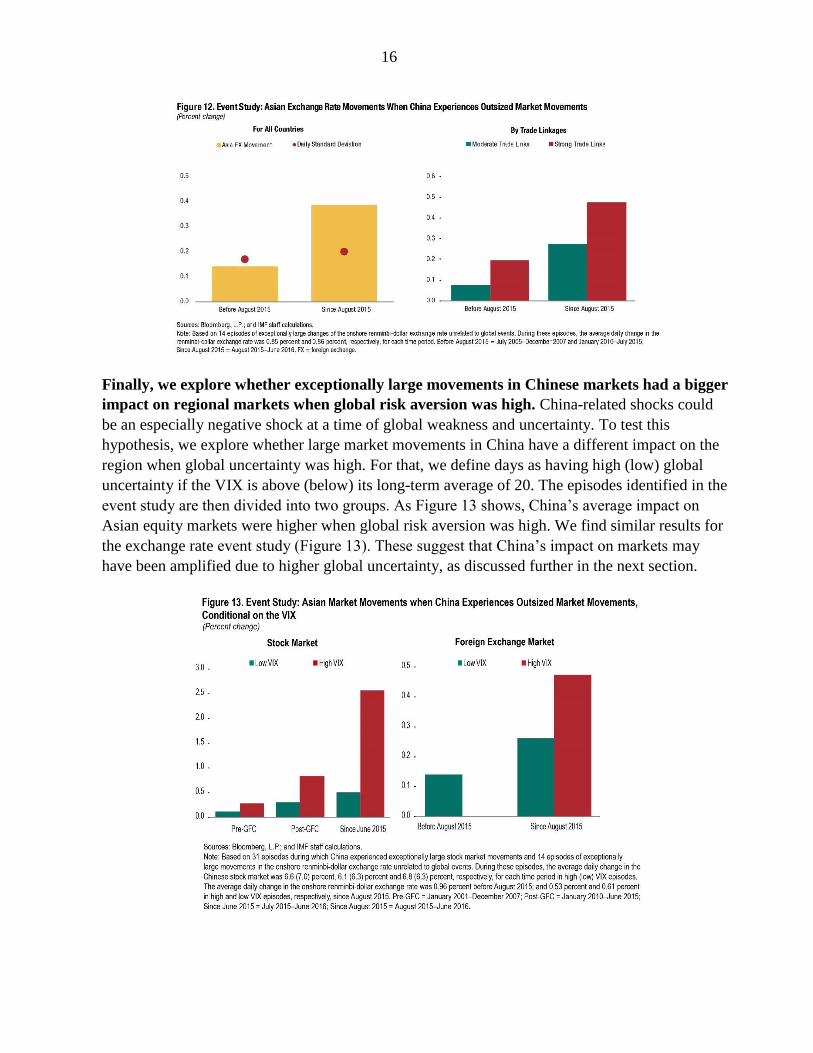
Similarly, regional currencies seem to be increasingly influenced by exceptionally large
movements in the Chinese exchange rate. We identify 14 episodes of exceptionally large
movements in the renminbi since July 2005 when China announced the adoption of a managed
floating exchange rate regime. During these episodes, the onshore renminbi-dollar exchange rate
moved by more than 0.5 percent in a given day. Similar to the stock market event study, to make
sure these were unrelated to global events or simply to movements in the U.S. dollar rather than
the renminbi, we exclude days in which the DXY dollar index moved by more than one standard
deviation against major currencies. We also conduct historical news searches to identify China-
specific events happening during each day (see Annex 1 for more details).12 During these days, we
find that regional currencies moved along with the renminbi, in particular in the period after
August 2015.13 Moreover, the currencies of countries with strong trade links with China moved
more closely with the renminbi (Figure 12).
10 We examined the period after June 2015 separately given the high turbulence in the Chinese stock market starting that month.
To this day, the Chinese stock market remains 40 percent below its peak in June 2015.
11 The economies with strong trade links with China are Australia, Korea, Malaysia, Singapore, Taiwan Province of China,
Thailand, and Vietnam, as discussed earlier in the paper (Figure 4).
12 The DXY is an index of the value of the U.S. dollar relative to a basket of six currencies including the euro, the Japanese yen,
the pound sterling, the Canadian dollar, the Swedish krona, and the Swiss franc.
13 We examined the period after August 2015 separately given China introduced a new exchange rate mechanism in that month.
16
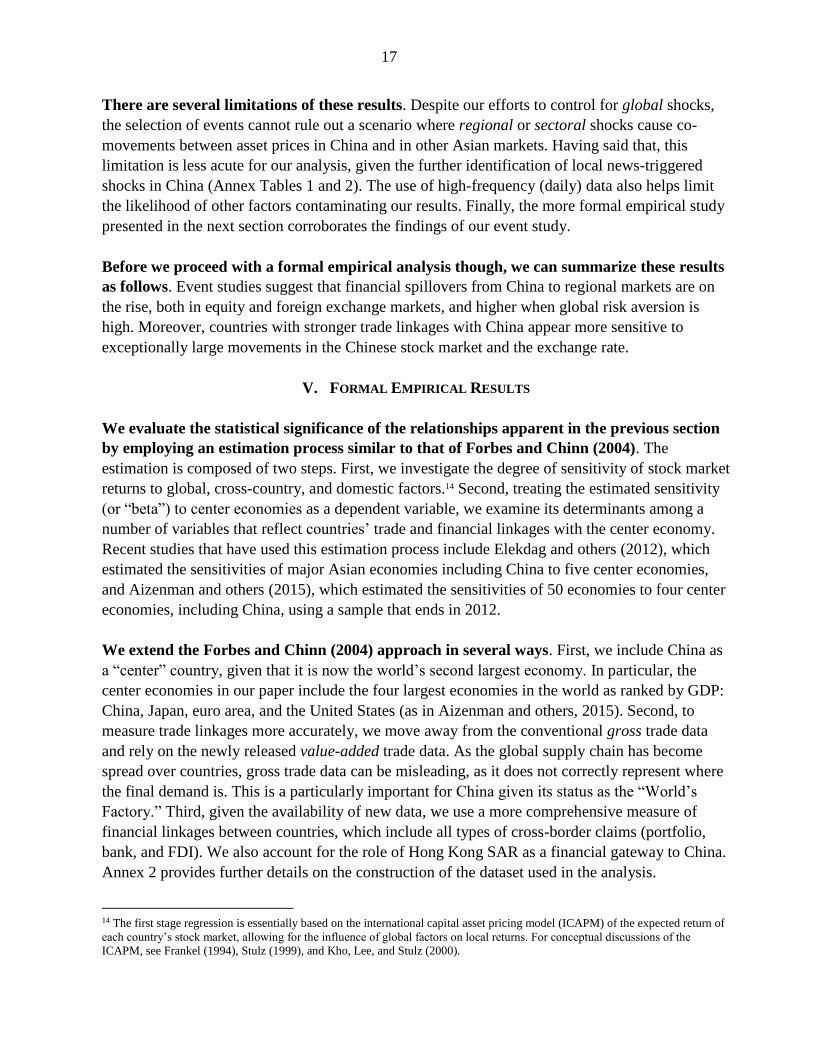
Finally, we explore whether exceptionally large movements in Chinese markets had a bigger
impact on regional markets when global risk aversion was high. China-related shocks could
be an especially negative shock at a time of global weakness and uncertainty. To test this
hypothesis, we explore whether large market movements in China have a different impact on the
region when global uncertainty was high. For that, we define days as having high (low) global
uncertainty if the VIX is above (below) its long-term average of 20. The episodes identified in the
event study are then divided into two groups. As Figure 13 shows, China’s average impact on
Asian equity markets were higher when global risk aversion was high. We find similar results for
the exchange rate event study (Figure 13). These suggest that China’s impact on markets may
have been amplified due to higher global uncertainty, as discussed further in the next section.
17
There are several limitations of these results. Despite our efforts to control for global shocks,
the selection of events cannot rule out a scenario where regional or sectoral shocks cause co-
movements between asset prices in China and in other Asian markets. Having said that, this
limitation is less acute for our analysis, given the further identification of local news-triggered
shocks in China (Annex Tables 1 and 2). The use of high-frequency (daily) data also helps limit
the likelihood of other factors contaminating our results. Finally, the more formal empirical study
presented in the next section corroborates the findings of our event study.
Before we proceed with a formal empirical analysis though, we can summarize these results
as follows. Event studies suggest that financial spillovers from China to regional markets are on
the rise, both in equity and foreign exchange markets, and higher when global risk aversion is
high. Moreover, countries with stronger trade linkages with China appear more sensitive to
exceptionally large movements in the Chinese stock market and the exchange rate.
V. FORMAL EMPIRICAL RESULTS
We evaluate the statistical significance of the relationships apparent in the previous section
by employing an estimation process similar to that of Forbes and Chinn (2004). The
estimation is composed of two steps. First, we investigate the degree of sensitivity of stock market
returns to global, cross-country, and domestic factors.14 Second, treating the estimated sensitivity
(or “beta”) to center economies as a dependent variable, we examine its determinants among a
number of variables that reflect countries’ trade and financial linkages with the center economy.
Recent studies that have used this estimation process include Elekdag and others (2012), which
estimated the sensitivities of major Asian economies including China to five center economies,
and Aizenman and others (2015), which estimated the sensitivities of 50 economies to four center
economies, including China, using a sample that ends in 2012.
We extend the Forbes and Chinn (2004) approach in several ways. First, we include China as
a “center” country, given that it is now the world’s second largest economy. In particular, the
center economies in our paper include the four largest economies in the world as ranked by GDP:
China, Japan, euro area, and the United States (as in Aizenman and others, 2015). Second, to
measure trade linkages more accurately, we move away from the conventional gross trade data
and rely on the newly released value-added trade data. As the global supply chain has become
spread over countries, gross trade data can be misleading, as it does not correctly represent where
the final demand is. This is a particularly important for China given its status as the “World’s
Factory.” Third, given the availability of new data, we use a more comprehensive measure of
financial linkages between countries, which include all types of cross-border claims (portfolio,
bank, and FDI). We also account for the role of Hong Kong SAR as a financial gateway to China.
Annex 2 provides further details on the construction of the dataset used in the analysis.
14 The first stage regression is essentially based on the international capital asset pricing model (ICAPM) of the expected return of
each country’s stock market, allowing for the influence of global factors on local returns. For conceptual discussions of the
ICAPM, see Frankel (1994), Stulz (1999), and Kho, Lee, and Stulz (2000).
18
This methodology involves estimating the following regressions:
First-stage regression:
𝑅𝑖,𝑡 = 𝛼𝑖 + ∑ 𝛽𝑖𝑐𝑅𝑐,𝑡
4
𝑐=1+ ∑ 𝛾𝑖
𝑔𝑋𝑔,𝑡
3
𝑔=1+ 𝛿𝑖𝑌 𝑖,𝑡 + 𝜖𝑖,𝑡 (1)
Second-stage regression:
𝛽𝑖𝑐 = 𝜐𝑖 + 𝜃1𝑇𝑖,𝑐 + 𝜃2𝑇𝑋𝑖,𝑐 + 𝜃3𝐹𝑖,𝑐 + 𝜃4𝐺𝐹𝐶 + 𝜂𝑖,𝑐 (2)
Where,
in Equation 1, Rit is the return on country i's stock market index in day t; Rct is the return on center
country c’ stock market index in day t; Xgt represents the change in global factors in day t—in
particular global risk appetite, world interest rates, and commodity prices; Yit reflects changes in
country risk in day t; and 𝜖𝑖,𝑡 is a normally distributed error term.15 Similarly, in Equation 2, Tic
measures direct trade linkages between country i and c; TXic measures export competition in third
markets between country i and c; Fic measures direct financial linkages between country i and c;
GFC is a dummy variable that is equal to one for the period from 2008 to 2009; and 𝜂𝑖,𝑐 is a
normally distributed error term.16 The country-specific intercepts in Equation 1 allow for the
possibility that average expected returns may differ across countries due to imperfect capital
market integration. Similarly, the country-specific intercepts in Equation 2 allow for country-
specific factors that may affect the sensitivity to movements in center economies, such as the
exchange rate regime or the degree of financial openness, which are found to have direct
influences on the sensitivity to center economies (Aizenman and others, 2015).
Equation 1 constrains the coefficient βic to be the same across the sample period, which means
that the parameter measures the average market sensitivity to center economies over the period.
As such, we use different samples to estimate the parameter over different horizons, including
(i) the full sample from 2001 to 2014 (Table 2); (ii) the pre-GFC and post-GFC subsamples
(Figure 14, left panel), (iii) and a rolling 12-month sample starting from 2001 (Figure 14, right
panel).
15 Returns are calculated as rolling-average, two-day returns to control for the fact that markets in different countries are not open
during the same hours (Annex 2). This approach also controls for potential lags in the transmission of shocks, to the extent it takes
time (more than a day) for markets to process the new information. We calculate returns based on U.S. dollars as well as local
currency, but focus on local-currency returns for the discussion in this section. Similarly, returns are measured in both absolute and
excess returns (i.e., adjusted for the risk-free rate), but we focus on absolute returns in this section. The results using dollar returns
as well as excess returns were virtually unchanged and are presented as sensitivity tests in Section VI.
16 Some extensions of the Forbes and Chinn (2004) approach have included country-specific vulnerability variables in Equation 2
as control factors. In order to preserve the bilateral nature of the second-stage regression, we do not add any such variables in the
baseline specification. Rather, we conduct sensitivity tests using these variables in Section IV.

19
The results of the first-stage regressions suggest that, on average, spillovers from China
have increased during the post-GFC period though still lower than of the United States.
China’s spillover coefficient is positive and significant for all economies in our sample (Table 2),
and has increased in the post-GFC period as shown in Figure 14. With regard to spillovers from
the United States, the U.S. coefficient remains high and has also increased somewhat in the post-
GFC. On the contrary, the spillover coefficient for Japan has declined in the post-GFC years and
was similar to that of China as of end-2014. Chow tests indicate that changes in the spillover
coefficients from pre-GFC to post-GFC periods are statistically significant for China and Japan at
the 1 percent level and for the United States at the 10 percent level.
China United States Japan Euro area
Australia 0.050*** 0.265*** 0.241*** 0.045*** 2,676 0.519
India 0.080*** 0.162*** 0.213*** -0.055** 2,522 0.165
Indonesia 0.075*** 0.198*** 0.241*** -0.047** 2,520 0.236
Korea 0.038*** 0.099*** 0.464*** 0.026 2,608 0.442
Malaysia 0.049*** 0.106*** 0.133*** 0.033** 2,568 0.229
New Zealand 0.022*** 0.213*** 0.068*** 0.029*** 2,649 0.304
Philippines 0.040*** 0.305*** 0.129*** 0.067*** 2,546 0.260
Taiwan Province of China 0.060*** 0.181*** 0.352*** -0.002 2,631 0.315
Thailand 0.073*** 0.116*** 0.200*** -0.014 2,468 0.177
Note: Only the factor loadings for the full sample are shown for illustrative purposes.
*** p<0.01, ** p<0.05, * p<0.1
Source: IMF staff estimates.
Table 2. Asian Stock Markets: First-Stage Results—Estimated Beta Coefficients
Systemic Economy/Region (i.e. Centers)N R2

20
The results of the second-stage regressions suggest that the trade exposure is the main
transmission channel for spillovers from China into Asian equity markets (Table 3). The
estimation is conducted with beta coefficients estimated for each one of the nine Asian countries
over 14 non-overlapping years (2001–14). Separately, we conduct estimations only for the pre-
GFC period (2001–07) and the post-GFC period (2010–14). Overall, we find that trade linkages
with center economies are a statistically significant determinant of spillovers in the full sample
(Figure 15). At the same time, the two center economies in Asia—namely China and Japan—
exhibit a different story. In China, trade exposure is a statistically and economically significant
factor determining how shocks to China’s equity prices affect other Asian economies’ equity
prices. Robustness checks confirm the validity of this result, even at the 5 and 1 percent levels of
statistical significance (as explained in the next section and shown in Table 5). By contrast, in
Japan, trade competition is a statistically significant channel in transmitting Japan’s equity market
spillovers into other Asian economies. This difference may partly reflect China’s role as an
assembly hub versus Japan’s role as an intermediate supplier.
Moreover, the relative contributions of trade and financial linkages in explaining the
variation in equity market spillovers from China have changed since the GFC. In particular,
Asia’s financial linkages with China have become a significant transmission channel after the
GFC—the coefficient on financial linkages is statistically significant in the post-GFC period as
shown in Table 4. Moreover, while trade linkages explained more than 90 percent of the variance
before the GFC, they now explain around 60 percent of the variation, with the rest explained by
financial linkages (Figure 16). Hence, it appears that Asia’s financial linkages with China have
become an additional transmission channel for equity market spillovers in Asia after the global
financial crisis, in particular after 2010. This may partly reflect the internationalization of the
renminbi, which started in 2010. Related to that, robustness tests suggest that financial linkages
Table 3. Asian Stock Markets: Second-Stage Results—Determinants of Beta Coefficients
Linkages with
China
Linkages with
Japan
Trade exposure 1.746* 1.492
(2.058) (0.799)
Trade competition -0.128 -1.057***
(-0.251) (-3.590)
Financial linkages 0.117 0.271
(0.542) (0.313)
Observations 126 126
R-squared 0.241 0.588
Robust t-statistics in parentheses
*** p<0.01, ** p<0.05, * p<0.1
Source: IMF staff estimates.
21
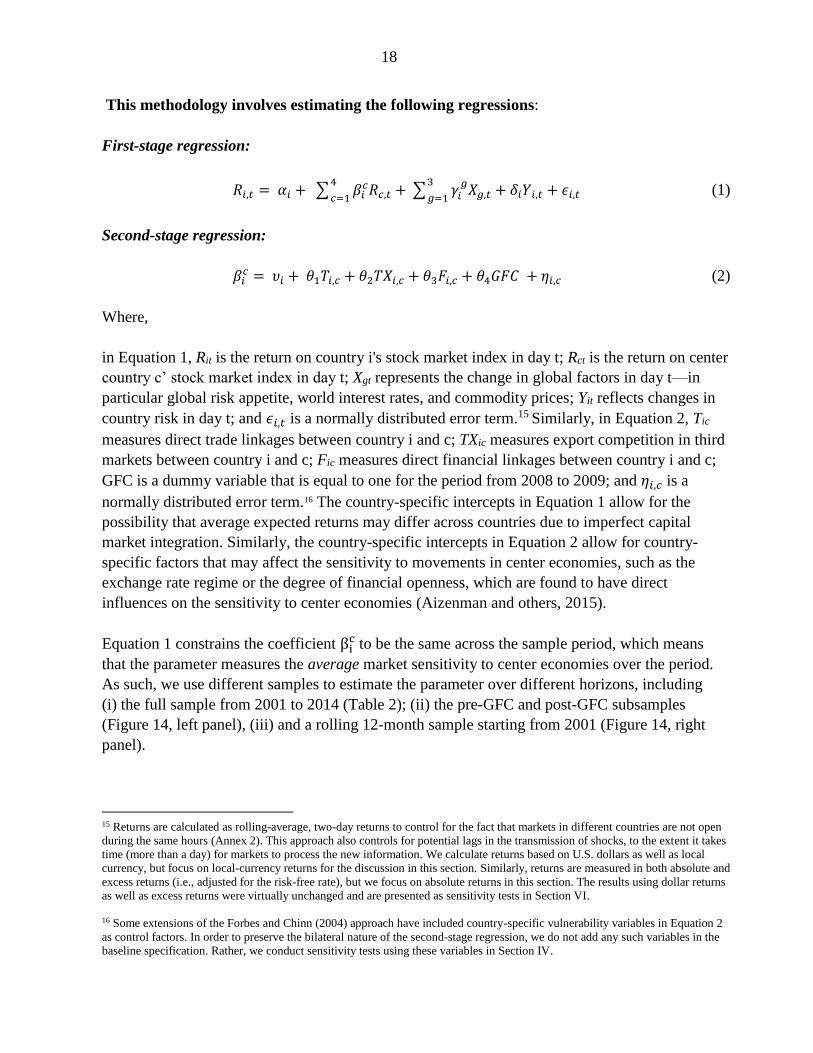
with China is significant notably when they are measured including claims on Hong Kong SAR.
This highlights the important role of Hong Kong SAR as a financial gateway to China.
Finally, as discussed earlier, to the extent that uncertainty about China’s growth and policy
outlook contribute to global risk aversion episodes, countries may be affected more. For
example, if a China-related event contributes to global risk aversion and affects other center
economies (Japan, the euro area, and the United States), there could be an additional impact on
regional markets. As described in Section III.B, even though China has not historically been
associated with global risk aversion episodes in the past, there are two recent instances in which
China may have contributed to a sharp rise in global risk aversion in August 2015 and January
2016. These episodes are outside the sample period of our estimation but the coefficients
estimated in our exercise could help envisage potential spillovers from China, if a China-related
shock were accompanied with a rise in global risk aversion.17 This is illustrated in Figure 17.
17 In particular, estimates are obtained using the coefficients for other center economies estimated in the first stage regression and
the historical response of stock markets in these economies to a VIX shocks of 10 percentage points, which would correspond to a
risk-off episode as defined by De Bock and de Carvalho (2015).
Linkages with CHN
Trade Linkages 1.472*
(2.080)
Trade Competition -0.331
(-0.610)
Financial Linkages: Pre-GFC -0.003
(-1.179)
Financial Linkages: Post-GFC 1
0.463*
(2.234)
Observations 126
R-squared 0.229
Number of id 9
Robust t-statistics in parentheses
*** p<0.01, ** p<0.05, * p<0.1
Table 4. Asian Stock Markets: Financial Linkages with
China: Pre-GFC vs. Post-GFC
1 Estimated by including an interaction term for Financial Linkages*Post-GFC
dummy

22
While it is difficult to quantify the exposure to this risk with precision, our empirical
analysis suggests the impact may be as big as—if not bigger than—the direct impact. In
particular, under a scenario under which a China-related shock is coupled with a “risk-off”
episode (a rise in the VIX by 10 percentage points) affecting other “center” economies (Japan, the
euro area, and the United States), the impact on regional markets could be twice as much based on
the estimated sensitivities of those markets to other center economies (Figure 18). These estimates
are obtained by using the βic coefficients estimated in the first-stage regression.

23
VI. SENSITIVITY TESTS
This section presents a series of sensitivity tests to examine whether the main finding presented in
the previous section is robust to changes in (i) variable definitions; (ii) sample selection; and
(iii) control variables. The results of the sensitivity analysis are summarized in Table 5.
Time fixed effects
First, we replace the GFC dummy included in the baseline specification with time fixed effects in
order to control for time variation over time. With time fixed effects, the coefficient on trade
linkages is still statistically significant at the 5 percent level and remains economically significant.
The coefficient on trade competition still remains negative and insignificant at the 10 percent
level, while the coefficient on financial linkages is higher, even though it remains statistically
insignificant at the 10 percent level.
Different definition of returns
Next, we use U.S. dollar returns from the MSCI, rather than local currency returns based national
stock indices. The coefficient on trade linkages is still statistically significant at the 5 percent
level and remains economically significant. In contrast, the coefficient on trade competition now
becomes statistically significant at the 10 percent level, while its sign remains negative. The
coefficient on financial linkages still remains insignificant at the 10 percent level. We also
perform an additional robustness test by using excess returns, thereby subtracting the risk-free
rate (proxied by the three-month U.S. Treasury rate) from absolute returns. The results are
virtually identical to what we obtain above using dollar returns.

24
Different definitions of global factors
As noted in Forbes and Chinn (2004), global and cross-country factors included in the first-stage
regression can be correlated. For instance, a shock to a center economy could trigger a change in
global risk appetite, making it difficult to separate the effect of cross-country factors. In order to
minimize potential multi-collinearity, we use residual global factors in the first-stage regression,
after controlling for stock returns in center economies. Specifically, we estimate a regression of
global factors (VIX, world interest rates, and commodity prices) on stock returns in the four
largest economies (China, Japan, euro area, and the United States). We then use the estimated
coefficients to calculate the residual global factors. The results remain broadly the same. Indeed,
the correlation structure between independent variables in both the first- and the second-stage
regressions does not point to significant multi-collinearity during the sample period (see Annex
Tables 2.1 and 2.2).
Different definition of financial linkages
As noted earlier, we make an effort to account for the role of Hong Kong SAR as a financial
gateway to China. Specifically, financial linkages with China are measured including claims on
Hong Kong SAR (Annex 2). At the same time, as a financial center, securities and investment
funds in Hong Kong SAR have a wide country coverage and exposure, not just including
Mainland China, but also indigenous Hong Kong SAR and other economies. Hence, as a
robustness check, we run the second-stage regression without accounting for the role of Hong
Kong SAR as a financial gateway to China. The results remain broadly the same. The coefficient
(1) (2) (3) (4) (5) (6) (7) (8)
Controlling for
time fixed
effects
Dependent
variable:
dollar
returns
Dependent
variable:
excess
returns
Independent
variable:
residual global
factors
Excluding
financial linkages
through Hong
Kong SAR
Excluding
Asian
commodity
exporters
Controlling for
country
fundamentals-
related risks
Controlling for
common
investor
channel
Trade exposure 2.275** 2.428** 2.428** 2.005** 1.898* 3.015*** 1.970** 1.952**
(2.918) (2.474) (2.473) (2.665) (2.097) (6.039) (2.371) (2.405)
Trade competition -0.245 -1.524* -1.523* -0.325 -0.218 0.594* -0.039 -0.280
(-0.633) (-2.059) (-2.058) (-0.590) (-0.435) (2.223) (-0.083) (-0.522)
Financial linkages 0.130 -0.685 -0.685 0.016 -0.183 0.054 0.009
(0.603) (-1.507) (-1.507) (0.056) (-1.221) (0.268) (0.040)
Financial linkages (China ex HKG) 0.379
(0.745)
Country fundamentals-based risk index 0.028*
(2.239)
Investor similarity index 0.013
(0.080)
Time fixed effect Y N N N N N N N
GFC dummy N Y Y Y Y Y Y Y
Observations 126 126 126 126 126 70 117 117
R-squared 0.592 0.227 0.227 0.243 0.303 0.425 0.292 0.240
Robust t-statistics in parentheses
*** p<0.01, ** p<0.05, * p<0.1
Table 5. Sensitivity Tests: Drivers of Asian Equity Market Sensitivity to China

25
on trade exposure remains statistically significant, while the coefficient on financial linkages
remains statistically insignificant.
Different sample selection
As an additional robustness check, we exclude all net commodity exporters (Australia, Indonesia,
Malaysia, and New Zealand) from our sample and re-run the baseline specification. Based on this
subsample, the coefficient on trade linkages is now statistically significant at the 1 percent level
and is almost twice as large as the coefficient in the baseline specification. At the same time, the
coefficient on trade competition becomes positive and statistically significant at the 10 percent
level. This result—although statistically significant—should be read with caution given that the
5-digit level trade data used to construct the export similarity index may still capture
complementary products and therefore the result may have been driven by complementarities in
production processes prevalent in Asian value chains. On the other hand, the coefficient on
financial linkages remains statistically insignificant at the 10 percent level.
Additional control variables
Finally, we include two additional control variables in the second-stage regression: a vulnerability
index and an investor similarity index.
First, to the extent that the cross-country spillovers are influenced by underlying vulnerabilities in
recipient economies, we control for such effects by introducing a vulnerability index. The index is
based on a widely-used vulnerability index for emerging markets constructed by Federal Reserve
researchers (Shaghil and others, 2015). Specifically, the index is based on five broad indicators:
(i) external financing requirement in percent of GDP (defined as the sum of current account
balance, short-term debt, and the amortization of long and medium-term debt); (ii) inflation vis-à-
vis its long-term average; (iii) credit gap according to Basel III definition; (iv) IMF’s reserve
adequacy metric, which incorporates country characteristics and potential channels for a
drawdown in reserves; and (v) general government gross debt in percent of GDP.
To construct the index, we rank countries relative to each other according to each variable, from
lowest vulnerability to highest vulnerability. We then take the average ranking of a country across
the five variables to obtain the value of the index for each country, with higher values
representing higher vulnerability. When we add this index as an additional determinant, we find
that the coefficient on the index is statistically significant only at the 10 percent level. Meanwhile,
the coefficients on other variables remain broadly the same.
26
Second, we include another control variable—the investor similarity index (ISI)—to capture
potential indirect financial linkages between country i and c due to a common investor in country
k, which may fire-sell assets in country i because of losses incurred on assets in country c.
Following Gong and Kim (2013), the ISI is constructed as follows:
𝐹𝑋𝑖,𝑐 = ∑ [𝑚𝑖𝑛 (𝐹𝑘,𝑖, 𝐸𝑋𝑘,c)]3
𝑘=0 (3)
where Fk,i and Fk,c are financial claims of country k on country i and country c, respectively, as
defined in Equation 6 in Annex 2. Country k is any of the center countries other than country c.
When we add this index as an additional determinant in the second-stage regression, we find that
the results are virtually the same as in the baseline: the coefficient on trade linkages is statistically
and economically significant, while those on trade competition and financial linkages are not.
Moreover, we do not find the coefficient on the ISI to be statistically significant. To test whether
this results is driven by the possibly correlation between financial linkages and the ISI, the
financial linkage variable is dropped from the specification, but the coefficient on the ISI remains
insignificant.
27
VII. CONCLUSION
The market turbulence after June 2015 raised questions whether spillovers from China
might have become larger lately, coming through not only trade but also financial linkages
(Rhee, 2015; IMF, 2016a). Our empirical results suggest that financial spillovers from China to
regional markets were already on the rise before the recent turbulence. The main transmission
channel appears to be trade linkages, although direct financial linkages are playing an increasing
role in the post-crisis period. At the same time, without an impact on global risk premiums,
spillovers from China to regional markets are not yet to the level of the United States, but
comparable to that of Japan.
In the short term, China’s gradual transition to a new growth model will likely be bumpy,
as exemplified by market turbulence over the last year. Economies most likely to be affected
by China’s financial spillovers are those with strong trade links with China, as well as Singapore,
Korea, and Taiwan Province of China owing to strong financial links. Furthermore, China-related
shocks, to the extent they lead to global “risk-off” episodes, can also affect Japan through safe
haven flows, as well as Indonesia and Malaysia, whose currencies tend to be more sensitive to
such episodes.
Over the long term, however, a more balanced Chinese economy can benefit the region and
the rest of world over the long term. A more liberalized capital market in China could improve
asset diversification of Chinese residents, improve the social safety net, and significantly boost
private consumption and imports. Opportunities could arise from China’s rebalancing, as lower-
income countries benefit from China’s move up the value chain or China increases its investments
abroad (especially FDI). Even for the near term, the negative impact through trade channel could
be partly offset by stronger services import demand from China (especially related to tourism).
The main policy implications of these findings are as follows. China’s impact on regional
markets is likely to grow further with the ongoing internationalization of the renminbi and the
country’s gradual capital account opening. For China, continued efforts to communicate its policy
intentions clearly and effectively remains essential, given its rising influence on regional markets.
For other countries, to mitigate these risks and build resilience, policy buffers could be used,
where available, to discharge macroeconomic support measures judiciously. Macroprudential
policies can be employed to safeguard financial stability, especially if volatile asset prices lead to
substantial capital outflows or worsen vulnerabilities such as those in the corporate sector.
Finally, the structural reform agenda for the region remains valid, especially for diversifying
sources of growth, including through promoting the services sector to reduce reliance on exports.
28
ANNEX 1. EVENT STUDY: EXCEPTIONALLY LARGE MOVEMENTS IN CHINESE MARKETS
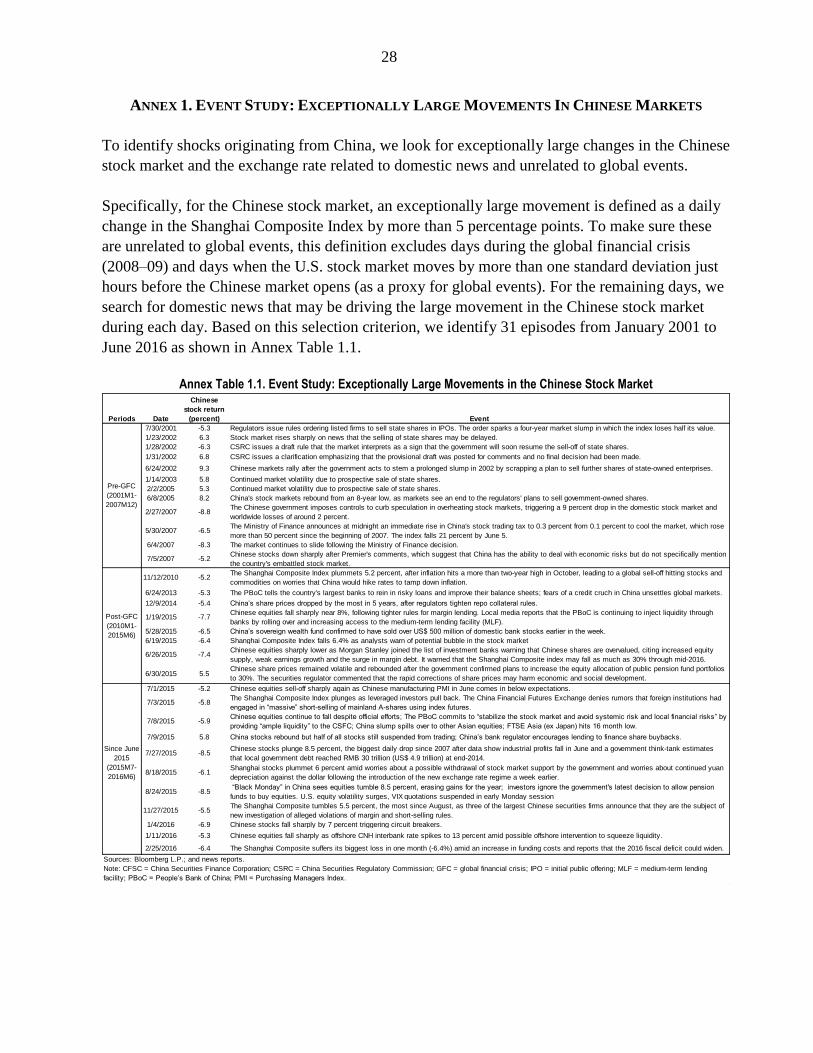
To identify shocks originating from China, we look for exceptionally large changes in the Chinese
stock market and the exchange rate related to domestic news and unrelated to global events.
Specifically, for the Chinese stock market, an exceptionally large movement is defined as a daily
change in the Shanghai Composite Index by more than 5 percentage points. To make sure these
are unrelated to global events, this definition excludes days during the global financial crisis
(2008–09) and days when the U.S. stock market moves by more than one standard deviation just
hours before the Chinese market opens (as a proxy for global events). For the remaining days, we
search for domestic news that may be driving the large movement in the Chinese stock market
during each day. Based on this selection criterion, we identify 31 episodes from January 2001 to
June 2016 as shown in Annex Table 1.1.
Annex Table 1.1. Event Study: Exceptionally Large Movements in the Chinese Stock Market
Periods Date
Chinese
stock return
(percent) Event
7/30/2001 -5.3 Regulators issue rules ordering listed firms to sell state shares in IPOs. The order sparks a four-year market slump in which the index loses half its value.
1/23/2002 6.3 Stock market rises sharply on news that the selling of state shares may be delayed.
1/28/2002 -6.3 CSRC issues a draft rule that the market interprets as a sign that the government will soon resume the sell-off of state shares.
1/31/2002 6.8 CSRC issues a clarification emphasizing that the provisional draft was posted for comments and no final decision had been made.
6/24/2002 9.3 Chinese markets rally after the government acts to stem a prolonged slump in 2002 by scrapping a plan to sell further shares of state-owned enterprises.
1/14/2003 5.8 Continued market volatility due to prospective sale of state shares.
2/2/2005 5.3 Continued market volatility due to prospective sale of state shares.
6/8/2005 8.2 China's stock markets rebound from an 8-year low, as markets see an end to the regulators' plans to sell government-owned shares.
2/27/2007 -8.8The Chinese government imposes controls to curb speculation in overheating stock markets, triggering a 9 percent drop in the domestic stock market and
worldwide losses of around 2 percent.
5/30/2007 -6.5The Ministry of Finance announces at midnight an immediate rise in China's stock trading tax to 0.3 percent from 0.1 percent to cool the market, which rose
more than 50 percent since the beginning of 2007. The index falls 21 percent by June 5.
6/4/2007 -8.3 The market continues to slide following the Ministry of Finance decision.
7/5/2007 -5.2Chinese stocks down sharply after Premier's comments, which suggest that China has the ability to deal with economic risks but do not specifically mention
the country's embattled stock market.
11/12/2010 -5.2The Shanghai Composite Index plummets 5.2 percent, after inflation hits a more than two-year high in October, leading to a global sell-off hitting stocks and
commodities on worries that China would hike rates to tamp down inflation.
6/24/2013 -5.3 The PBoC tells the country's largest banks to rein in risky loans and improve their balance sheets; fears of a credit cruch in China unsettles global markets.
12/9/2014 -5.4 China’s share prices dropped by the most in 5 years, after regulators tighten repo collateral rules.
1/19/2015 -7.7Chinese equities fall sharply near 8%, following tighter rules for margin lending. Local media reports that the PBoC is continuing to inject liquidity through
banks by rolling over and increasing access to the medium-term lending facility (MLF).
5/28/2015 -6.5 China’s sovereign wealth fund confirmed to have sold over US$ 500 million of domestic bank stocks earlier in the week.
6/19/2015 -6.4 Shanghai Composite Index falls 6.4% as analysts warn of potential bubble in the stock market
6/26/2015 -7.4Chinese equities sharply lower as Morgan Stanley joined the list of investment banks warning that Chinese shares are overvalued, citing increased equity
supply, weak earnings growth and the surge in margin debt. It warned that the Shanghai Composite index may fall as much as 30% through mid-2016.
6/30/2015 5.5Chinese share prices remained volatile and rebounded after the government confirmed plans to increase the equity allocation of public pension fund portfolios
to 30%. The securities regulator commented that the rapid corrections of share prices may harm economic and social development.
7/1/2015 -5.2 Chinese equities sell-off sharply again as Chinese manufacturing PMI in June comes in below expectations.
7/3/2015 -5.8The Shanghai Composite Index plunges as leveraged investors pull back. The China Financial Futures Exchange denies rumors that foreign institutions had
engaged in “massive” short-selling of mainland A-shares using index futures.
7/8/2015 -5.9Chinese equities continue to fall despite official efforts; The PBoC commits to “stabilize the stock market and avoid systemic risk and local financial risks” by
providing “ample liquidity” to the CSFC; China slump spills over to other Asian equities; FTSE Asia (ex Japan) hits 16 month low.
7/9/2015 5.8 China stocks rebound but half of all stocks still suspended from trading; China’s bank regulator encourages lending to finance share buybacks.
7/27/2015 -8.5Chinese stocks plunge 8.5 percent, the biggest daily drop since 2007 after data show industrial profits fall in June and a government think-tank estimates
that local government debt reached RMB 30 trillion (US$ 4.9 trillion) at end-2014.
8/18/2015 -6.1Shanghai stocks plummet 6 percent amid worries about a possible withdrawal of stock market support by the government and worries about continued yuan
depreciation against the dollar following the introduction of the new exchange rate regime a week earlier.
8/24/2015 -8.5 “Black Monday” in China sees equities tumble 8.5 percent, erasing gains for the year; investors ignore the government's latest decision to allow pension
funds to buy equities. U.S. equity volatility surges, VIX quotations suspended in early Monday session
11/27/2015 -5.5The Shanghai Composite tumbles 5.5 percent, the most since August, as three of the largest Chinese securities firms announce that they are the subject of
new investigation of alleged violations of margin and short-selling rules.
1/4/2016 -6.9 Chinese stocks fall sharply by 7 percent triggering circuit breakers.
1/11/2016 -5.3 Chinese equities fall sharply as offshore CNH interbank rate spikes to 13 percent amid possible offshore intervention to squeeze liquidity.
2/25/2016 -6.4 The Shanghai Composite suffers its biggest loss in one month (-6.4%) amid an increase in funding costs and reports that the 2016 fiscal deficit could widen.
Sources: Bloomberg L.P.; and news reports.
Note: CFSC = China Securities Finance Corporation; CSRC = China Securities Regulatory Commission; GFC = global financial crisis; IPO = initial public offering; MLF = medium-term lending
facility; PBoC = People’s Bank of China; PMI = Purchasing Managers Index.
Pre-GFC
(2001M1-
2007M12)
Post-GFC
(2010M1-
2015M6)
Since June
2015
(2015M7-
2016M6)
29
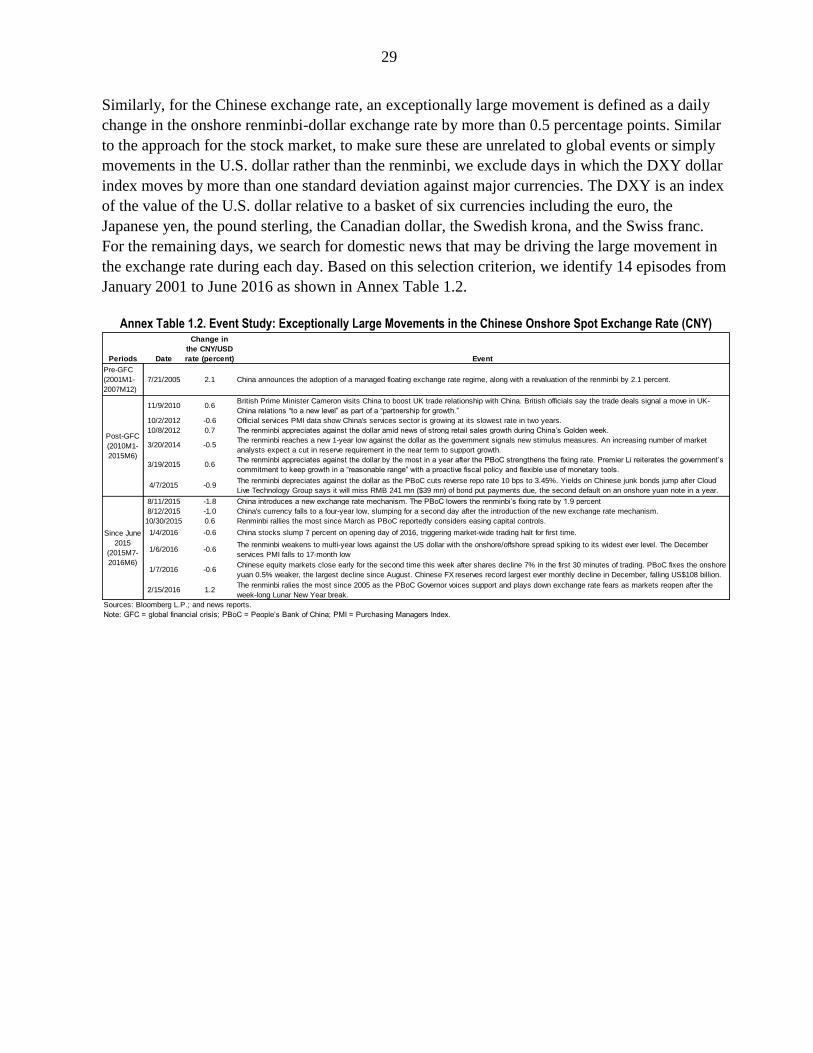
Similarly, for the Chinese exchange rate, an exceptionally large movement is defined as a daily
change in the onshore renminbi-dollar exchange rate by more than 0.5 percentage points. Similar
to the approach for the stock market, to make sure these are unrelated to global events or simply
movements in the U.S. dollar rather than the renminbi, we exclude days in which the DXY dollar
index moves by more than one standard deviation against major currencies. The DXY is an index
of the value of the U.S. dollar relative to a basket of six currencies including the euro, the
Japanese yen, the pound sterling, the Canadian dollar, the Swedish krona, and the Swiss franc.
For the remaining days, we search for domestic news that may be driving the large movement in
the exchange rate during each day. Based on this selection criterion, we identify 14 episodes from
January 2001 to June 2016 as shown in Annex Table 1.2.
Annex Table 1.2. Event Study: Exceptionally Large Movements in the Chinese Onshore Spot Exchange Rate (CNY)
Periods Date
Change in
the CNY/USD
rate (percent) Event
Pre-GFC
(2001M1-
2007M12)
7/21/2005 2.1 China announces the adoption of a managed floating exchange rate regime, along with a revaluation of the renminbi by 2.1 percent.
11/9/2010 0.6British Prime Minister Cameron visits China to boost UK trade relationship with China. British officials say the trade deals signal a move in UK-
China relations “to a new level” as part of a “partnership for growth.”
10/2/2012 -0.6 Official services PMI data show China's services sector is growing at its slowest rate in two years.
10/8/2012 0.7 The renminbi appreciates against the dollar amid news of strong retail sales growth during China’s Golden week.
3/20/2014 -0.5The renminbi reaches a new 1-year low against the dollar as the government signals new stimulus measures. An increasing number of market
analysts expect a cut in reserve requirement in the near term to support growth.
3/19/2015 0.6The renminbi appreciates against the dollar by the most in a year after the PBoC strengthens the fixing rate. Premier Li reiterates the government’s
commitment to keep growth in a “reasonable range” with a proactive fiscal policy and flexible use of monetary tools.
4/7/2015 -0.9The renminbi depreciates against the dollar as the PBoC cuts reverse repo rate 10 bps to 3.45%. Yields on Chinese junk bonds jump after Cloud
Live Technology Group says it will miss RMB 241 mn ($39 mn) of bond put payments due, the second default on an onshore yuan note in a year.
8/11/2015 -1.8 China introduces a new exchange rate mechanism. The PBoC lowers the renminbi’s fixing rate by 1.9 percent
8/12/2015 -1.0 China's currency falls to a four-year low, slumping for a second day after the introduction of the new exchange rate mechanism.
10/30/2015 0.6 Renminbi rallies the most since March as PBoC reportedly considers easing capital controls.
1/4/2016 -0.6 China stocks slump 7 percent on opening day of 2016, triggering market-wide trading halt for first time.
1/6/2016 -0.6The renminbi weakens to multi-year lows against the US dollar with the onshore/offshore spread spiking to its widest ever level. The December
services PMI falls to 17-month low
1/7/2016 -0.6Chinese equity markets close early for the second time this week after shares decline 7% in the first 30 minutes of trading. PBoC fixes the onshore
yuan 0.5% weaker, the largest decline since August. Chinese FX reserves record largest ever monthly decline in December, falling US$108 billion.
2/15/2016 1.2The renminbi ralies the most since 2005 as the PBoC Governor voices support and plays down exchange rate fears as markets reopen after the
week-long Lunar New Year break.
Sources: Bloomberg L.P.; and news reports.
Note: GFC = global financial crisis; PBoC = People’s Bank of China; PMI = Purchasing Managers Index.
Post-GFC
(2010M1-
2015M6)
Since June
2015
(2015M7-
2016M6)
30
ANNEX 2. CONSTRUCTION OF THE DATASET USED IN THE EMPIRICAL ANALYSIS
To examine the role of trade and financial linkages in explaining asset return spillovers, we
compile a dataset from a number of sources. The dataset covers nine Asian economies (Australia,
India, Indonesia, Korea, Malaysia, New Zealand, the Philippines, Taiwan Province of China, and
Thailand) and four “center” economies (China, Japan, the euro area, and the United States).
The daily data used in the first-stage regression are compiled from Bloomberg. Asset returns (Rit)
are measured by stock returns, measured in either local currency or U.S. dollars, based on stock
indices compiled by Bloomberg.1 Following standard practice in the literature (see for example,
Forbes and Rigobon, 2002), stock market returns are calculated as rolling-average, two-day
returns based on each country’s aggregate stock market index. We utilize average two-day returns
to control for the fact that markets in different countries are not open during the same hours.2
Global risk appetite is measured by the CBOE Volatility Index (VIX index). World interest rates
are proxied by the “shadow” U.S. policy rate estimated by Wu and Xia (2016). Commodity prices
are measured by the Bloomberg Commodity Index, which covers 22 commodities in seven
sectors. Country risk is measured by country-specific credit default swap (CDS) spreads or, if not
available, by the J.P. Morgan Emerging Market Bond Index-Global (EMBIG) sovereign spread.
For the second-stage regression, we construct an annual data set from several sources:
Direct trade linkages
The data used to calculate direct trade linkages (Tic) between country i and c come from the
OECD-WTO Trade in Value Added (TiVA) database. This database covers the years 2000, 2005,
and 2008–11. A continuous time series through 2014 is constructed by following as closely as
possible the OECD-WTO methodology but using the United Nation’s Comtrade data and national
income accounts statistics, as explained in Appendix A of Duval and others (2015). More
specifically, the direct trade linkage between country i and c is measured as follows:
𝑇𝑖,𝑐 = 𝐸𝑖
𝑐
𝐺𝐷𝑃𝑖 (4)
where 𝐸𝑖𝑐 is the value added produced by country i and exported for final demand in country c.
Specifically, this measure includes two types of value added: (i) direct exports of final goods and
1 The specific stock indices used in the analysis are the ASX 200 (Australia), Shanghai Composite Index (China), Eurofirst 300
(the euro area), BSE SENSEX 30 (India), Jakarta Composite (Indonesia), NIKKEI 225 (Japan), KOSPI (Korea), FTSE/KLCI
(Malaysia), NZX 50 (New Zealand), PSE Composite Index (the Philippines), TWSE (Taiwan Province of China), SET Index
(Thailand), and S&P500 (the United States).
2 For instance, as Asian trading is ahead of the United States, shocks from Asian markets are always incorporated into U.S. asset
prices, while shocks to U.S. markets can only affect Asian trading on the next trading day. Measuring returns over two-day rolling
windows partially adjusts for these differences in market hours.
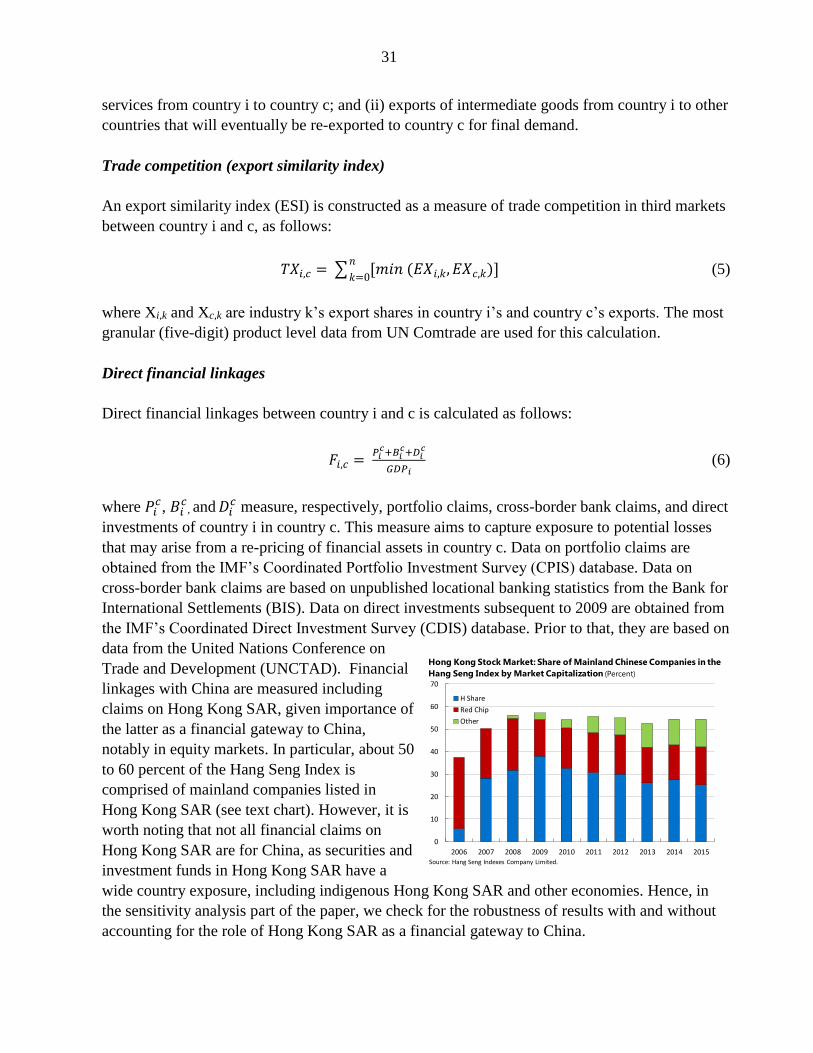
31
services from country i to country c; and (ii) exports of intermediate goods from country i to other
countries that will eventually be re-exported to country c for final demand.
Trade competition (export similarity index)
An export similarity index (ESI) is constructed as a measure of trade competition in third markets
between country i and c, as follows:
𝑇𝑋𝑖,𝑐 = ∑ [𝑚𝑖𝑛 (𝐸𝑋𝑖,𝑘, 𝐸𝑋𝑐,𝑘)]𝑛
𝑘=0 (5)
where Xi,k and Xc,k are industry k’s export shares in country i’s and country c’s exports. The most
granular (five-digit) product level data from UN Comtrade are used for this calculation.
Direct financial linkages
Direct financial linkages between country i and c is calculated as follows:
𝐹𝑖,𝑐 = 𝑃𝑖
𝑐+𝐵𝑖𝑐+𝐷𝑖
𝑐
𝐺𝐷𝑃𝑖 (6)
where 𝑃𝑖𝑐, 𝐵𝑖
𝑐, and 𝐷𝑖
𝑐 measure, respectively, portfolio claims, cross-border bank claims, and direct
investments of country i in country c. This measure aims to capture exposure to potential losses
that may arise from a re-pricing of financial assets in country c. Data on portfolio claims are
obtained from the IMF’s Coordinated Portfolio Investment Survey (CPIS) database. Data on
cross-border bank claims are based on unpublished locational banking statistics from the Bank for
International Settlements (BIS). Data on direct investments subsequent to 2009 are obtained from
the IMF’s Coordinated Direct Investment Survey (CDIS) database. Prior to that, they are based on
data from the United Nations Conference on
Trade and Development (UNCTAD). Financial
linkages with China are measured including
claims on Hong Kong SAR, given importance of
the latter as a financial gateway to China,
notably in equity markets. In particular, about 50
to 60 percent of the Hang Seng Index is
comprised of mainland companies listed in
Hong Kong SAR (see text chart). However, it is
worth noting that not all financial claims on
Hong Kong SAR are for China, as securities and
investment funds in Hong Kong SAR have a
wide country exposure, including indigenous Hong Kong SAR and other economies. Hence, in
the sensitivity analysis part of the paper, we check for the robustness of results with and without
accounting for the role of Hong Kong SAR as a financial gateway to China.
0
10
20
30
40
50
60
70
2006 2007 2008 2009 2010 2011 2012 2013 2014 2015
H Share
Red Chip
Other
Hong Kong Stock Market: Share of Mainland Chinese Companies in the
Hang Seng Index by Market Capitalization (Percent)
Source: Hang Seng Indexes Company Limited.
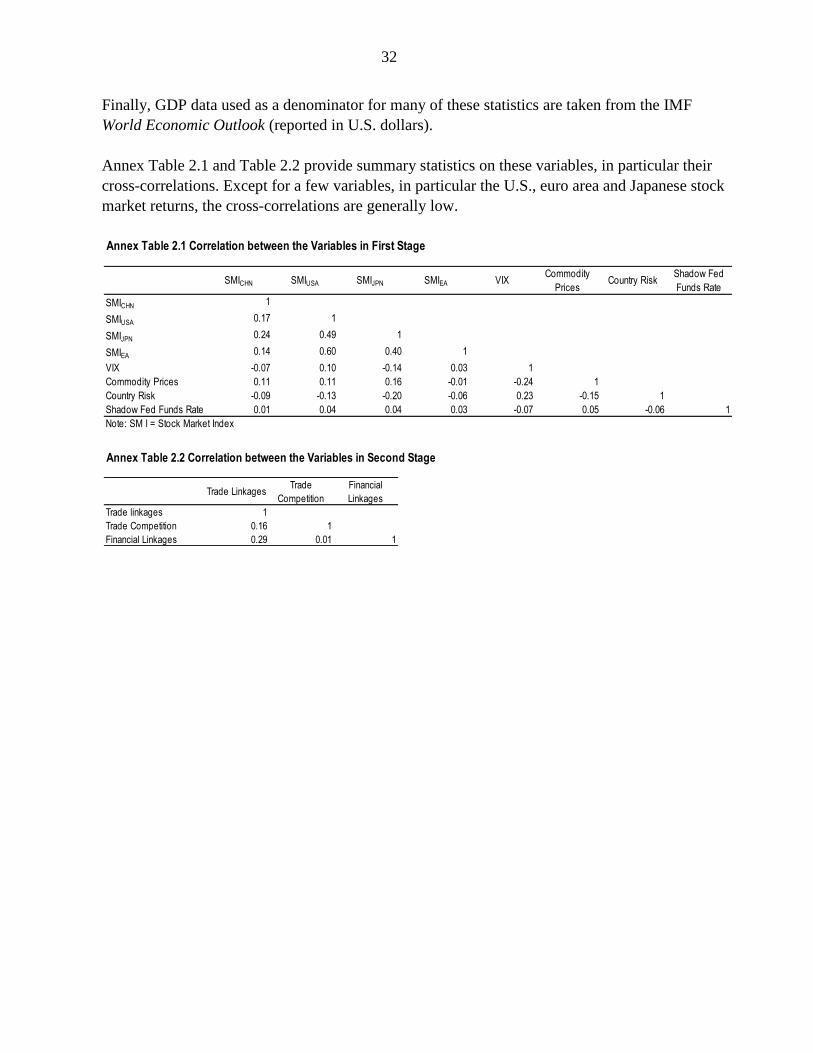
32
Finally, GDP data used as a denominator for many of these statistics are taken from the IMF
World Economic Outlook (reported in U.S. dollars).
Annex Table 2.1 and Table 2.2 provide summary statistics on these variables, in particular their
cross-correlations. Except for a few variables, in particular the U.S., euro area and Japanese stock
market returns, the cross-correlations are generally low.
Annex Table 2.1 Correlation between the Variables in First Stage
SMICHN SMIUSA SMIJPN SMIEA VIXCommodity
PricesCountry Risk
Shadow Fed
Funds Rate
SMICHN 1
SMIUSA 0.17 1
SMIJPN 0.24 0.49 1
SMIEA 0.14 0.60 0.40 1
VIX -0.07 0.10 -0.14 0.03 1
Commodity Prices 0.11 0.11 0.16 -0.01 -0.24 1
Country Risk -0.09 -0.13 -0.20 -0.06 0.23 -0.15 1
Shadow Fed Funds Rate 0.01 0.04 0.04 0.03 -0.07 0.05 -0.06 1
Note: SM I = Stock Market Index
Annex Table 2.2 Correlation between the Variables in Second Stage
Trade LinkagesTrade
Competition
Financial
Linkages
Trade linkages 1
Trade Competition 0.16 1
Financial Linkages 0.29 0.01 1

33
ANNEX 3. EMPIRICAL RESULTS: BOND MARKETS
We repeat the analysis performed in Section V, but this time focusing on the bond market rather
than the equity market. Specifically, in the first-stage regression, we use daily changes in 10-year
government bond yields (in percentage points). In the second-stage regressions, we use the same
dependent variables, in particular trade linkages, trade competition, and financial linkages.
The results of the first-stage regressions are shown in Annex Table 3.1. The results confirm that
Asian bond markets’ sensitivities to the Chinese bond market still remains low except for a few
exceptions (such as Korea and Taiwan Province of China), while the regional bond markets are
indeed sensitive to the U.S. bond market and—to a lesser extent—to the Japanese bond market.
Result of second stage regressions on the determinants of Asian bond market sensitivities are
presented in Annex Table 3.2. In contrast to the results for equity markets, all three explanatory
variables lose their degree of significance. Even with alternate specifications, results for Chinese
bond market specifications remain insignificant.
China United States Japan
Australia 0.003 0.522*** 0.531*** 2,421 0.391
India 0.053 0.089*** 0.087 2,421 0.016
Indonesia 0.137 -0.041 -0.087 2,421 0.009
Korea 0.077** 0.192*** 0.153*** 2,421 0.090
Malaysia 0.023 0.079*** 0.035 2,421 0.019
New Zealand -0.005 0.347*** 0.269*** 2,113 0.283
Philippines 0.066 -0.129*** 0.000 2,207 0.010
Taiwan Province of China 0.045*** 0.085*** 0.133*** 2,421 0.115
Thailand 0.089** 0.146*** 0.093* 2,421 0.041
Note: Only the factor loadings for the full sample are shown for illustrative purposes.
*** p<0.01, ** p<0.05, * p<0.1
Source: IMF staff estimates.
Systemic Economy/Region (i.e. Centers)N R2
Linkages with
China
Linkages with
Japan
Trade exposure 0.004 0.128**
(0.167) (2.521)
Trade competition -0.021 -0.000
(-1.186) (-0.017)
Financial linkages 0.006 0.040
(0.416) (0.827)
Observations 90 90
R-squared 0.119 0.193
Robust t-statistics in parentheses
*** p<0.01, ** p<0.05, * p<0.1
Source: IMF staff estimates.
Annex Table 3.2. Asian Bond Markets: Second-Stage Results—Determinants of Beta Coefficients
Annex Table 3.1. Asian Bond Markets: First Stage Results—Estimated Beta Coefficients
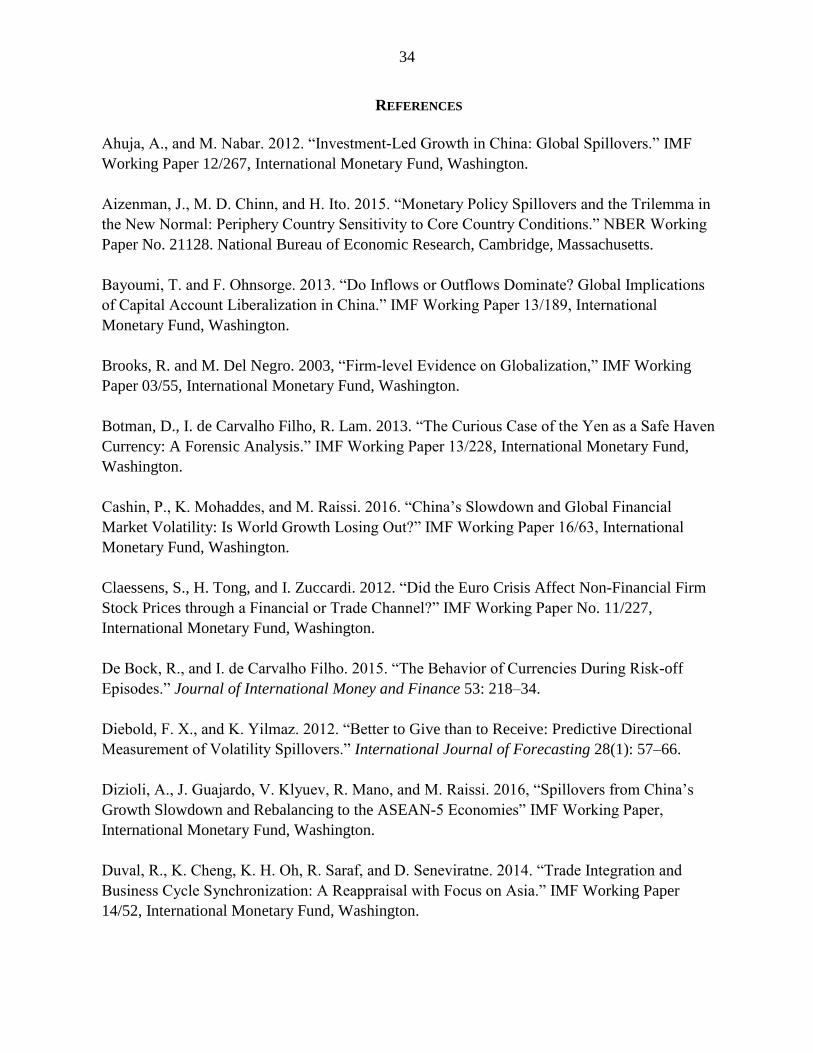
34
REFERENCES
Ahuja, A., and M. Nabar. 2012. “Investment-Led Growth in China: Global Spillovers.” IMF
Working Paper 12/267, International Monetary Fund, Washington.
Aizenman, J., M. D. Chinn, and H. Ito. 2015. “Monetary Policy Spillovers and the Trilemma in
the New Normal: Periphery Country Sensitivity to Core Country Conditions.” NBER Working
Paper No. 21128. National Bureau of Economic Research, Cambridge, Massachusetts.
Bayoumi, T. and F. Ohnsorge. 2013. “Do Inflows or Outflows Dominate? Global Implications
of Capital Account Liberalization in China.” IMF Working Paper 13/189, International
Monetary Fund, Washington.
Brooks, R. and M. Del Negro. 2003, “Firm-level Evidence on Globalization,” IMF Working
Paper 03/55, International Monetary Fund, Washington.
Botman, D., I. de Carvalho Filho, R. Lam. 2013. “The Curious Case of the Yen as a Safe Haven
Currency: A Forensic Analysis.” IMF Working Paper 13/228, International Monetary Fund,
Washington.
Cashin, P., K. Mohaddes, and M. Raissi. 2016. “China’s Slowdown and Global Financial
Market Volatility: Is World Growth Losing Out?” IMF Working Paper 16/63, International
Monetary Fund, Washington.
Claessens, S., H. Tong, and I. Zuccardi. 2012. “Did the Euro Crisis Affect Non-Financial Firm
Stock Prices through a Financial or Trade Channel?” IMF Working Paper No. 11/227,
International Monetary Fund, Washington.
De Bock, R., and I. de Carvalho Filho. 2015. “The Behavior of Currencies During Risk-off
Episodes.” Journal of International Money and Finance 53: 218–34.
Diebold, F. X., and K. Yilmaz. 2012. “Better to Give than to Receive: Predictive Directional
Measurement of Volatility Spillovers.” International Journal of Forecasting 28(1): 57–66.
Dizioli, A., J. Guajardo, V. Klyuev, R. Mano, and M. Raissi. 2016, “Spillovers from China’s
Growth Slowdown and Rebalancing to the ASEAN-5 Economies” IMF Working Paper,
International Monetary Fund, Washington.
Duval, R., K. Cheng, K. H. Oh, R. Saraf, and D. Seneviratne. 2014. “Trade Integration and
Business Cycle Synchronization: A Reappraisal with Focus on Asia.” IMF Working Paper
14/52, International Monetary Fund, Washington.

35
Duval, R., N. Li, R. Saraf, and D. Seneviratne. 2015. “Value-Added Trade and Business Cycle
Synchronization.” Journal of International Economics 99: 251–62.
Elekdag, S., P. Rungcharoenkitkul, and Y. Wu. 2012. “The Evolution of Asian Financial
Linkages: Key Determinants and the Role of Policy.” IMF Working Paper 12/262, International
Monetary Fund, Washington.
Frankel, Jeffrey. 1994. “Introduction,” in The Internationalization of Equity Markets, edited by
Jeffrey Frankel, University of Chicago Press, Chicago and London.
Forbes, Kristin. 2013. “The Big-C: Identifying and Mitigating Contagion,” Jackson Hole
Conference Proceedings.
Forbes, K.J., and M. Chinn. 2004. “A Decomposition of Global Linkages in Financial Markets
Over Time.” Review of Economics and Statistics 86(3): 705–22.
Forbes, K. J., and R. Rigobon. 2002. “No Contagion, Only Interdependence: Measuring Stock
Market Comovements.” Journal of Finance, 2002, v57, 2223–61.
Goldman Sachs. 2016. “Walled In: China’s Great Dilemna.” Investment Strategy Group,
January.
Gong, C. and S. Kim. 2013. “Economic Integration and Business Cycle Synchronization in
Asia.” Asian Economic Papers, Vol. 12 No. 1, pp. 76–99.
Guimarães-Filho, R., and G. Hong. 2016. “Dynamic Connectedness of Asian Equity Markets.”
IMF Working Paper 16/57, International Monetary Fund, Washington.
Hong, G., J. Lee, W. Liao, and D. Seneviratne. 2016. “China and Asia in Global Trade
Slowdown.” IMF Working Paper 16/105, International Monetary Fund, Washington.
Institute of International Finance (IIF). 2016. “Capital Flows to Emerging Markets.”
International Monetary Fund. 2013. “Dancing Together? Spillovers, Common Shocks,
and the Role of Financial and Trade Linkages” in World Economic Outlook, Washington,
October.
––––––. 2014. Global Liquidity, Policy Paper, Washington, April.
———. 2015. “People’s Republic of China—2015 Article IV Consultation—Staff Report.”
IMF Country Report 15/234, Washington.
––––––. 2016a. World Economic Outlook Update. Washington, January.
36
––––––. 2016b. “The Growing Importance of Financial Spillovers from Emerging Market
Economies” in Global Financial Stability Report. Washington, April.
––––––. 2016c. Regional Economic Outlook: Asia and the Pacific. Washington, April.
Kireyev, A., and A. Leonidov. 2016. “China’s Import Slowdown: Spillovers, Spillins, and
Spillbacks.” IMF Working Paper 16/51, International Monetary Fund, Washington.
Kho, B-C, D. Lee, and R. M. Stulz. 2000. “U.S. Banks, Crises, and Bailouts: From Mexico to
LTCM,” American Economic Review 90, 28–31.
Kubelec, C. and F. Sá. 2008. “Financial Globalization and Cross-Country Spillovers.” mimeo,
Bank of England.
Prachi M., K. Moriyama, P. N. Diaye, and L. Nguyen. 2014. “Impact of Fed Tapering
Announcements on Emerging Markets.” IMF Working Paper 14/109, International Monetary
Fund, Washington.
Rhee, Changyong. 2015. “Managing China’s Economic Transition.” iMFdirect, October 5.
Available at https://blog-imfdirect.imf.org/2015/10/05/managing-chinas-economic-transition/
Sahay, R., V. Arora, T. Arvanitis, H. Faruqee, P. N. Diaye, T. Mancini-Griffoli, and an IMF
Team, 2014. “Emerging Market Volatility: Lessons from the Taper Tantrum.” IMF Staff
Discussion Note SDN 14/09, September 2014.
Shaghil A., B. Coulibaly, and A. Zlate. 2015. “International Financial Spillovers to Emerging
Market Economies: How Important Are Economic Fundamentals?” International Finance
Discussion Papers 1135. Board of Governors of the Federal Reserve System, Washington.
Stulz, René M. 1999. “International Portfolio Flows and Security Markets,” in International
Capital Flows, edited by Martin Feldstein, University of Chicago Press, Chicago.
Warnock, F. E. and V. C. Warnock. 2005. “International Capital Flows and U.S. Interest Rates.”
Board of Governors of the Federal Reserve System. International Finance Discussion Papers
Number 840. September 2005.
Wu, J. C. and Xia, F. D. 2016. “Measuring the Macroeconomic Impact of Monetary Policy at
the Zero Lower Bound” Journal of Money, Credit, and Banking, 48(2-3), 253-291.
Recommended