Chapter 5 Reading and Manipulating SAS® Data
Sets and Creating Detailed Reports
Xiaogang Su
Department of Statistics
University of Central Florida

Section 5.1 Introduction
University of Central Florida wants to analyze their applicants’ SAT score and age.

Scenario
The university must– write the relevant data to a SAS data set so that it can
be processed further – determine the minimum, maximum, and average age
and SAT score of applicants– assign each applicant a decision (acceptable,
unacceptable, and undecided) based on SAT score
continued...

Scenario
• determine the number of applicants with acceptable, unacceptable, and undecided status
• determine the minimum, maximum, and average SAT score for each group of applicants
• create an enhanced report that lists all of the applicants.

Calculating Summary Statistics for All Applicants
Variable Label N Mean Std Dev Minimum Maximum
ƒƒƒƒƒƒƒƒƒƒƒƒƒƒƒƒƒƒƒƒƒƒƒƒƒƒƒƒƒƒƒƒƒƒƒƒƒƒƒƒƒƒƒƒƒƒƒƒƒƒƒƒƒƒƒƒ
sat SAT Score 67574 984.13 227.49 200.00 1600.00
act ACT Score 22520 22.86 3.73 8.00 35.00
ƒƒƒƒƒƒƒƒƒƒƒƒƒƒƒƒƒƒƒƒƒƒƒƒƒƒƒƒƒƒƒƒƒƒƒƒƒƒƒƒƒƒƒƒƒƒƒƒƒƒƒƒƒƒƒƒ

Creating a New Variable Using Conditional Processing
SAT Score 1200
850 980 720
Decision1 1 2 2 3
if sat >= 1200 then decision1=1;
else if sat > 800 and sat < 1200 then decision1 = 2;
else if sat <= 800 then decision1=3;
else decision1 = 4;
< 800?
TRUE

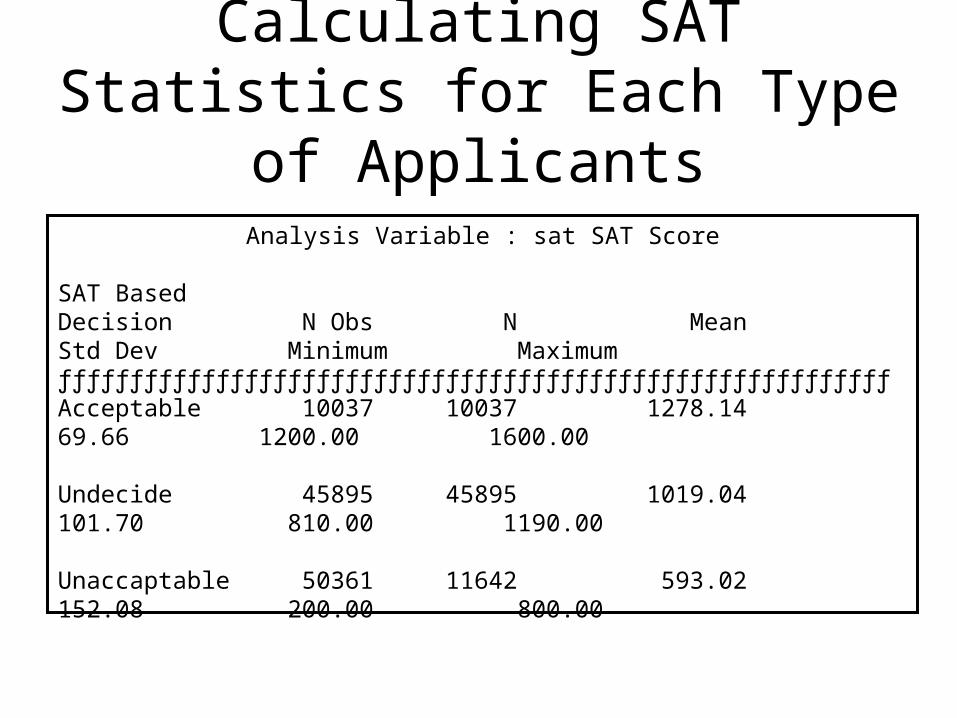
Calculating Summary Statistics for Each Type of Applicants
Analysis Variable : sat SAT Score
SAT BasedDecision N Obs N Mean Std Dev Minimum MaximumƒƒƒƒƒƒƒƒƒƒƒƒƒƒƒƒƒƒƒƒƒƒƒƒƒƒƒƒƒƒƒƒƒƒƒƒƒƒƒƒƒƒƒƒƒƒƒƒƒƒƒƒƒƒƒƒƒƒAcceptable 10037 10037 1278.14 69.66 1200.00 1600.00
Undecide 45895 45895 1019.04 101.70 810.00 1190.00
Unaccaptable 50361 11642 593.02 152.08 200.00 800.00

Creating an Enhanced List Report
Age Decision Average SAT Score Teenage Acceptab 1277.17 Undecide 1032.34 Unaccapt 732.72 Twenty Acceptab 1281.25 Undecide 1014.48 Unaccapt 575.11 Thirty Acceptab 1296.76 Undecide 1015.23 Unaccapt 502.51 Over 40 Acceptab 1278.82 Undecide 1003.91 Unaccapt 501.37

Section 5.2 Creating a SAS Data Set
Objectives
• Create a SAS data set using another SAS data set as input.
• Read and create permanent SAS data sets.
• Select variables to store in a SAS data set.

Reading a SAS Data Set
In order to create a SAS data set using a SAS data set as input, you must– start a DATA step and name the SAS data set
being created (DATA statement)– identify the input SAS data set
(SET statement).

Reading a SAS Data Set
General form of a DATA step:DATA SAS-data-set;
SET SAS-data-set;additional SAS statements
RUN;
Example:data work.revised;
set work.rawdat;run;

Reading a SAS Data Set
By default, the SET statement reads– all of the observations from the input
SAS data set– all of the variables from the input
SAS data set.

Selecting Variables to Store in a SAS Data Set
You can use a DROP= or KEEP= data set option in a DATA statement to control what variables are written to the new SAS data set.
General form of the DROP= and KEEP= data set options:
SAS-data-set(DROP=variables)or
SAS-data-set(KEEP=variables)

Selecting Variables to Store in a SAS Data Set
General form of the DROP= and KEEP= data set options in a DATA statement:
DATA output-SAS-data-set (DROP=variables); SET input-SAS-data-set;RUN;
Example:data work.revised (drop = a b); set work.rawdat;run;

TemporarySAS data set
Reading a SAS Data Set
Input Data Set Output Data SetSET Statement DATA Statement
TemporarySAS data set
PermanentSAS data set
PermanentSAS data set

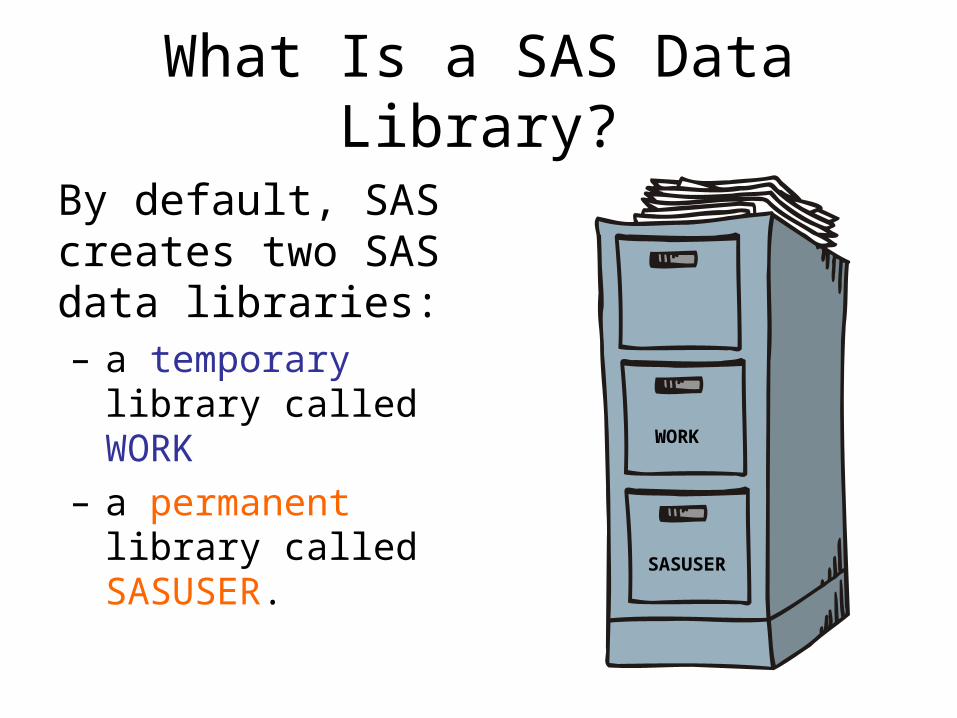
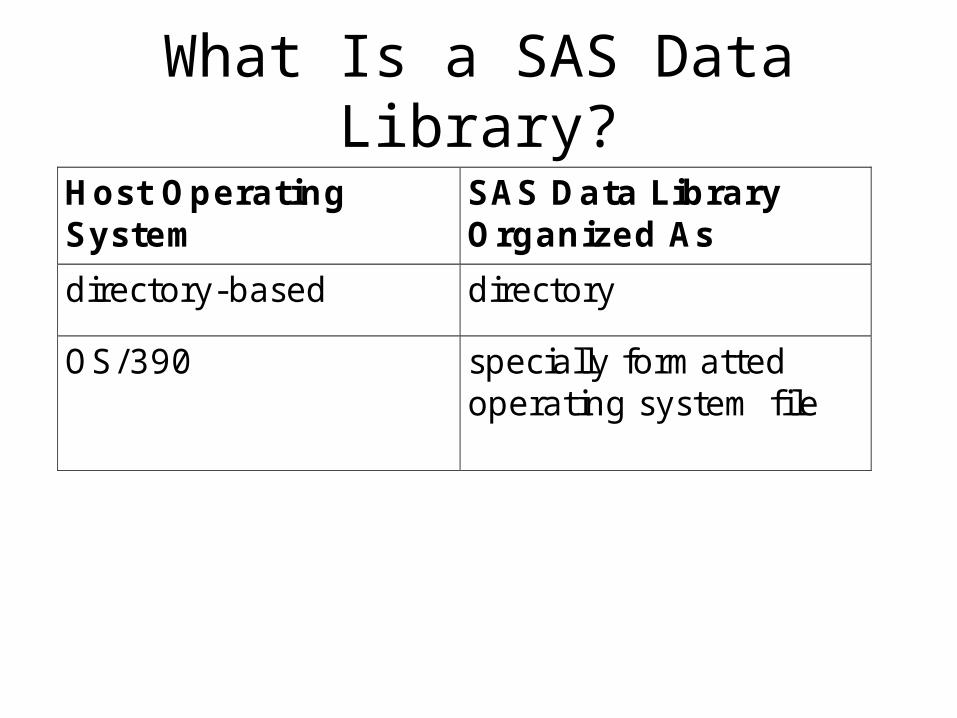
What Is a SAS Data Library?
Regardless of which host operating system you use, you identify SAS data libraries by assigning each one a libref.
libref
What Is a SAS Data Library?
By default, SAS creates two SAS data libraries:– a temporary library called
WORK– a permanent library called
SASUSER.
SASUSER
WORK
What Is a SAS Data Library?
Host OperatingSystem
SAS Data LibraryOrganized As
directory-based directory
OS/390 specially formattedoperating system file

Assigning a Libref
You can use the LIBNAME statement to assign a libref to a SAS data library.
General form of the LIBNAME statement:
Example:Windows libname sta4102 "C:\sta 4102\prog1\chapter5\sasdata";
LIBNAME libref ‘SAS-data-library’ <options>;

Assigning a Libref
More examples:
UNIXlibname mydata '/users/company/datalib';
OS/390libname mydata 'edc.company.datalib';
Selected option:DISP=OLD|SHR specifies the disposition of the file.
The default is OLD.

What Is a SAS Filename?
General form of a SAS filename:
libref refers to the SAS data library (library reference).
SAS-data-set-name refers to a SAS data setin the library.
libref.SAS-data-set-name

What Is a SAS Filename?
The data set EMPLOYEE is a SAS file in the IA data library.
The SAS filename is IA.EMPLOYEE.
DATA
IA
WORK
SASUSER

What Is a SAS Filename?
The libref WORK can be omitted when you refer to a file in the WORK library.
Example:
work.revised <-----> revised

Examining a SAS Data Library
Generate a listing of all SAS files in a SAS data library.
IA
WORK
SASUSER
Examining a SAS Data Library
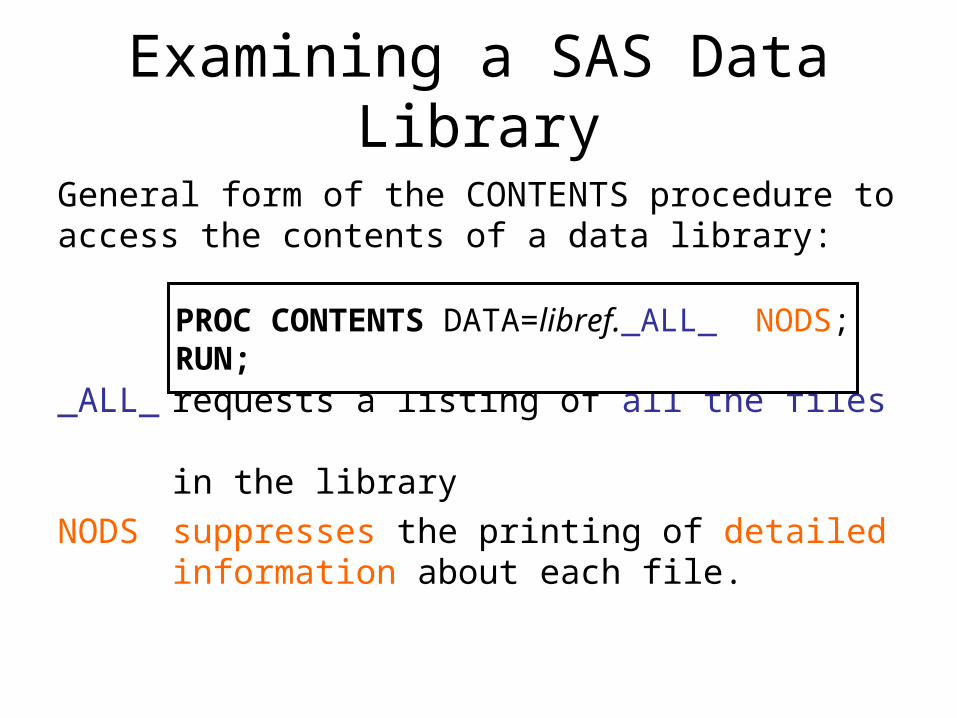
General form of the CONTENTS procedure to access the contents of a data library:
_ALL_ requests a listing of all the files in the library
NODS suppresses the printing of detailed information about each file.
PROC CONTENTS DATA=libref._ALL_ NODS;RUN;

Examining the IA Data Library
proc contents data=sta4102._all_ nods;run;
IA
WORK
SASUSER

Reading and Creating Permanent SAS Data Sets
data sta4102.revised (drop = a b); ;
set sta4102.rawdat;
run;
IA
WORK
SASUSER

Creating a New Column
The SUM function adds the values of the arguments and ignores missing values.
General form of the SUM function to create a new variable:
variable variable you want to create
argument variables, literals, or expressions to be summed.
variable = SUM(argument1, argument2);

Reading and Creating Permanent SAS Data Sets
data sta4102.example1
(keep = sat gender year semester);
set sta4102.revised;
sat = sum(verbal,quant);
run;
IA
WORK
SASUSER

Assigning Librefs and Creating SAS Data Sets
File: pg1-ch5-ex03.sas
This demonstration illustrates how to assign a libref and create a SAS data set from another SAS data set.

Section 5.3 Calculating Simple Descriptive Statistics
• Objectives– Generate simple descriptive statistics using the
MEANS procedure.– Restrict the variables processed by the MEANS
procedure using the VAR statement.– Group observations of a SAS data set for analysis
using the CLASS statement in the MEANS procedure.

Business Scenario
University of Central Florida wants to determine the minimum, maximum, and average SAT scorefor their applicants.
Minimum SAT: 1600Maximum SAT: 200Average SAT: 984.13

Calculating Summary Statistics
By default, PROC MEANS– analyzes every numeric variable in the
SAS data set– prints the statistics N, MEAN, STD, MIN, and MAX– excludes missing values before calculating statistics.

Selecting Variables
The VAR statement restricts the variables processed by PROC MEANS. Variables that are included in the statistical analysis are listed in the VAR statement.
General form of the VAR statement:VAR SAS-variables;

Selecting Variables
General form of the VAR statement in a PROC MEANS step:
Example:proc means data=sta4102.example1; label sat='SAT Score'; var sat act;run;
PROC MEANS DATA=SAS-data-set; VAR variables;
RUN;

The MAXDEC= Option
The PROC MEANS statement option MAXDEC= gives the maximum number of decimal places for PROC MEANS to use in printing results.
General form of PROC MEANS with the MAXDEC= option:PROC MEANS DATA=SAS-data-set MAXDEC=number; RUN;

The MAXDEC= Option
proc means data=sta4102.example1 maxdec=2; label sat='SAT Score'; var sat act;run;
Variable Label N Mean Std Dev Minimum Maximum
ƒƒƒƒƒƒƒƒƒƒƒƒƒƒƒƒƒƒƒƒƒƒƒƒƒƒƒƒƒƒƒƒƒƒƒƒƒƒƒƒƒƒƒƒƒƒƒƒƒƒƒƒƒƒƒƒ
sat SAT Score 67574 984.13 227.49 200.00 1600.00
act ACT Score 22520 22.86 3.73 8.00 35.00
ƒƒƒƒƒƒƒƒƒƒƒƒƒƒƒƒƒƒƒƒƒƒƒƒƒƒƒƒƒƒƒƒƒƒƒƒƒƒƒƒƒƒƒƒƒƒƒƒƒƒƒƒƒƒƒƒ

Grouping Observations
The CLASS statement in the MEANS procedure groups the observations of the SAS data set for analysis.
General form of the CLASS statement:CLASS SAS-variables;

Grouping Observations
General form of a CLASS statement in a PROC MEANS step:
Example:proc means data=sta4102.example1 maxdec=2; label sat='SAT Score'; var sat act; class gender;run;
PROC MEANS DATA=SAS-data-set; CLASS SAS-variables;RUN;

Grouping Observations
The MEANS ProcedureAnalysis Variable : sat SAT Score
Gender N Obs N Mean Std Dev Minimum Maximum ƒƒƒƒƒƒƒƒƒƒƒƒƒƒƒƒƒƒƒƒƒƒƒƒƒƒƒƒƒƒƒƒƒƒƒƒƒƒƒƒƒƒƒƒƒƒƒƒƒƒƒƒƒƒƒƒƒ Female 59999 36653 962.11 223.76 200.00 1600.00
Male 46210 30893 1010.33 229.00 200.00 1600.00
Not Report 84 28 906.79 318.95 350.00 1490.00
Partial SAS Output

Creating Simple Descriptive Statistics
ReportsFile: pg1-ch5-ex05.sas
This demonstration illustrates how to create a simple descriptive statistics report.

Section 5.4 Creating Variables through Conditional Processing
• Objectives– Execute statements conditionally using
IF-THEN logic.– Control the length of character variables explicitly
with the LENGTH statement.

Scenario
University of Central Florida wants to identify applicants based on their SAT score as unacceptable, acceptable, and undecided.
Unacceptable: SAT 800
Acceptable: SAT 1200
Undecided: 800 < SAT <1200

Scenario
University of Central Florida wants to calculate descriptive statistics for each type of applicants.
Analysis Variable : sat SAT Score
SAT BasedDecision N Obs N Mean Std Dev Minimum MaximumƒƒƒƒƒƒƒƒƒƒƒƒƒƒƒƒƒƒƒƒƒƒƒƒƒƒƒƒƒƒƒƒƒƒƒƒƒƒƒƒƒƒƒƒƒƒƒƒƒƒƒƒƒƒƒƒƒƒAcceptable 10037 10037 1278.14 69.66 1200.00 1600.00
Undecide 45895 45895 1019.04 101.70 810.00 1190.00
Unaccaptable 50361 11642 593.02 152.08 200.00 800.00

Conditionally Executing Statements
General form of IF-THEN and ELSE statements:
IF expression THEN statement;ELSE statement;

Conditionally Executing Statements
Expression contains operands and operators that form a set of instructions that produce a resulting value.
Operands are
• variable names
• functions
• constants.

Conditionally Executing Statements
Operators are symbols that request
• a comparison
• a logical operation
• an arithmetic calculation.

Conditionally Executing Statements
Example:
if sat >= 1200 then decision1=1;
else if sat > 800 and sat < 1200 then decision1 = 2;
else if sat <= 800 then decision1=3;
else decision1 = 4;

Conditionally Creating a New Variable
SAT Score 1200
850 980 720
Decision1
if sat >= 1200 then decision1=1;
else if sat > 800 and sat < 1200 then decision1 = 2;
else if sat <= 800 then decision1=3;
else decision1 = 4;
...

Conditionally Creating a New Variable
SAT Score 1200
850 980 720
Decision1 1
if sat >= 1200 then decision1=1;
else if sat > 800 and sat < 1200 then decision1 = 2;
else if sat <= 800 then decision1=3;
else decision1 = 4;
>= 1200?
TRUE

Conditionally Creating a New Variable
SAT Score 1200
850 980 720
Decision1 1
if sat >= 1200 then decision1=1;
else if sat > 800 and sat < 1200 then decision1 = 2;
else if sat <= 800 then decision1=3;
else decision1 = 4;
>= 1200?
FALSE

Conditionally Creating a New Variable
SAT Score 1200
850 980 720
Decision1 1 2
if sat >= 1200 then decision1=1;
else if sat > 800 and sat < 1200 then decision1 = 2;
else if sat <= 800 then decision1=3;
else decision1 = 4;
> 800 and < 1200?
TRUE

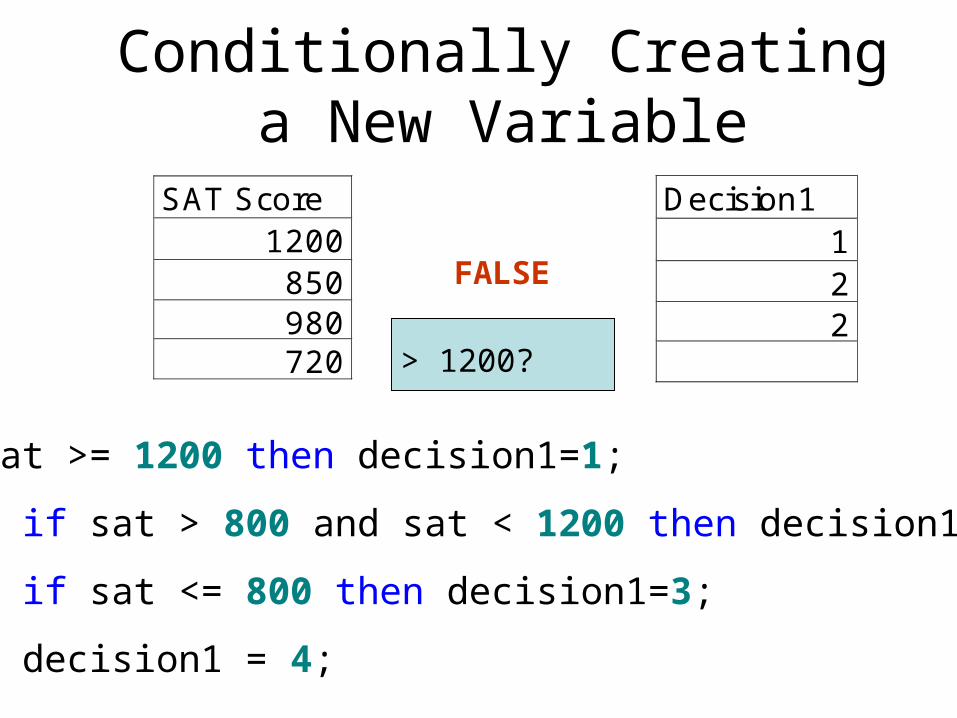
Conditionally Creating a New Variable
SAT Score 1200
850 980 720
Decision1 1 2
if sat >= 1200 then decision1=1;
else if sat > 800 and sat < 1200 then decision1 = 2;
else if sat <= 800 then decision1=3;
else decision1 = 4;
> 1200?
FALSE
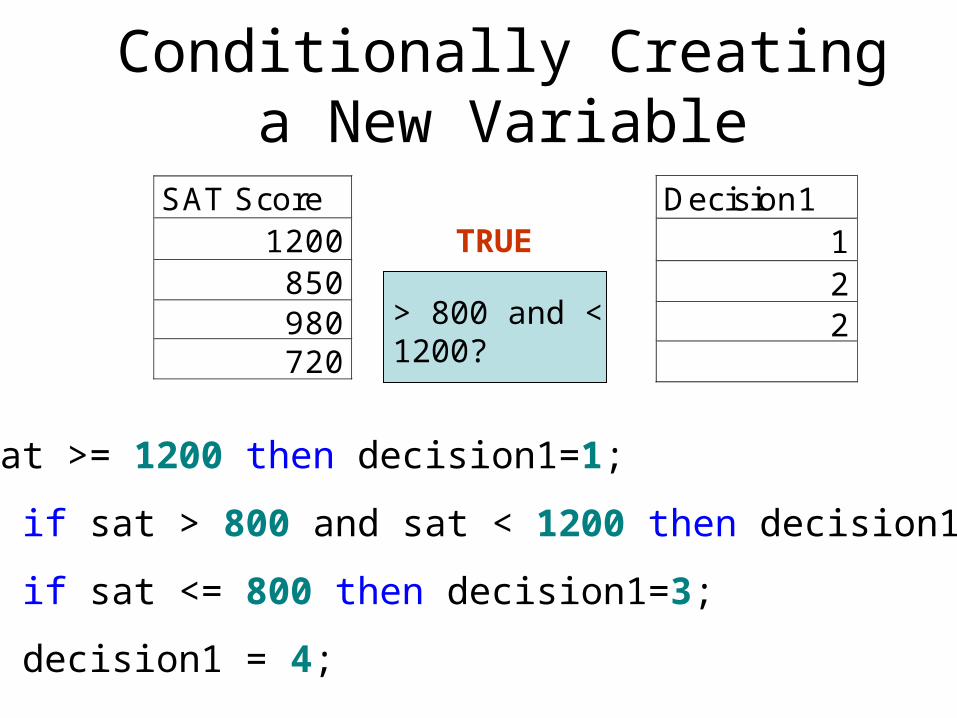
Conditionally Creating a New Variable
SAT Score 1200
850 980 720
Decision1 1 2 2
if sat >= 1200 then decision1=1;
else if sat > 800 and sat < 1200 then decision1 = 2;
else if sat <= 800 then decision1=3;
else decision1 = 4;
> 800 and < 1200?
TRUE
Conditionally Creating a New Variable
SAT Score 1200
850 980 720
Decision1 1 2 2
if sat >= 1200 then decision1=1;
else if sat > 800 and sat < 1200 then decision1 = 2;
else if sat <= 800 then decision1=3;
else decision1 = 4;
> 1200?
FALSE

Conditionally Creating a New Variable
SAT Score 1200
850 980 720
Decision1 1 2 2
if sat >= 1200 then decision1=1;
else if sat > 800 and sat < 1200 then decision1 = 2;
else if sat <= 800 then decision1=3;
else decision1 = 4;
> 800 and < 1200?
FALSE

Conditionally Creating a New Variable
SAT Score 1200
850 980 720
Decision1 1 2 2 3
if sat >= 1200 then decision1=1;
else if sat > 800 and sat < 1200 then decision1 = 2;
else if sat <= 800 then decision1=3;
else decision1 = 4;
< 800?
TRUE

Conditionally Executing Statements
File: pg1-ch5-ex05.sas
This demonstration illustrates how to create a SAS variable conditionally.

The LENGTH Statement
You can use the LENGTH statement to define the length of a variable explicitly.
General form of the LENGTH statement:
Example:
length Size $ 6; /* Character variable */
length decision1 3; /* Numeric variable */
LENGTH variable(s) ($) length;

The LENGTH Statement
data sta4102.example2; set sta4102.example1; length decision1 3; if sat >= 1200 then decision1=1; else if sat > 800 and sat < 1200 then
decision1 = 2; else if sat <= 800 then decision1=3;
else decision1 = 4;label decision1 = 'SAT Based Decision';format decision1 desfmt.;
run;

Calculating SAT Statistics for Each Type of Applicants
proc means data=sta4102.example2 maxdec=2; label sat='SAT Score'; var sat; class decision1;run;
Calculating SAT Statistics for Each Type of Applicants
Analysis Variable : sat SAT Score
SAT BasedDecision N Obs N Mean Std Dev Minimum MaximumƒƒƒƒƒƒƒƒƒƒƒƒƒƒƒƒƒƒƒƒƒƒƒƒƒƒƒƒƒƒƒƒƒƒƒƒƒƒƒƒƒƒƒƒƒƒƒƒƒƒƒƒƒƒƒƒƒƒAcceptable 10037 10037 1278.14 69.66 1200.00 1600.00
Undecide 45895 45895 1019.04 101.70 810.00 1190.00
Unaccaptable 50361 11642 593.02 152.08 200.00 800.00

Conditionally Executing Multiple Statements
You can use DO and END statements to execute a group of statements based on a condition.
General form of DO and END statements:
IF expression THEN DO;
executable statementsEND;
ELSEDO;
executable statementsEND;

Explicitly Assigning a Length to a Variable
and Calculating Summary StatisticsFile: pg1-ch5-ex05.sas
This demonstration illustrates how to explicitly assign a length to a variable and calculate capacity statistics for each type of plane.
Section 5.5 Creating a Detail Report
with the REPORT Procedure • Objectives
– Create a list report using the REPORT procedure in a nonwindowing environment.
– Select variables to include in a list report using the COLUMN statement.
– Enhance a report using the DEFINE statement.

Scenario
University of Central Florida wants to create an enhanced list report.
Age Decision Average SAT Score Teenage Acceptab 1277.17 Undecide 1032.34 Unaccapt 732.72 Twenty Acceptab 1281.25 Undecide 1014.48 Unaccapt 575.11 Thirty Acceptab 1296.76 Undecide 1015.23 Unaccapt 502.51 Over 40 Acceptab 1278.82 Undecide 1003.91 Unaccapt 501.37

67
PROC REPORT
• The REPORT procedure combines features of the PRINT, MEANS, and TABULATE procedures with features of the DATA step in a single report-writing tool that can produce a variety of reports.
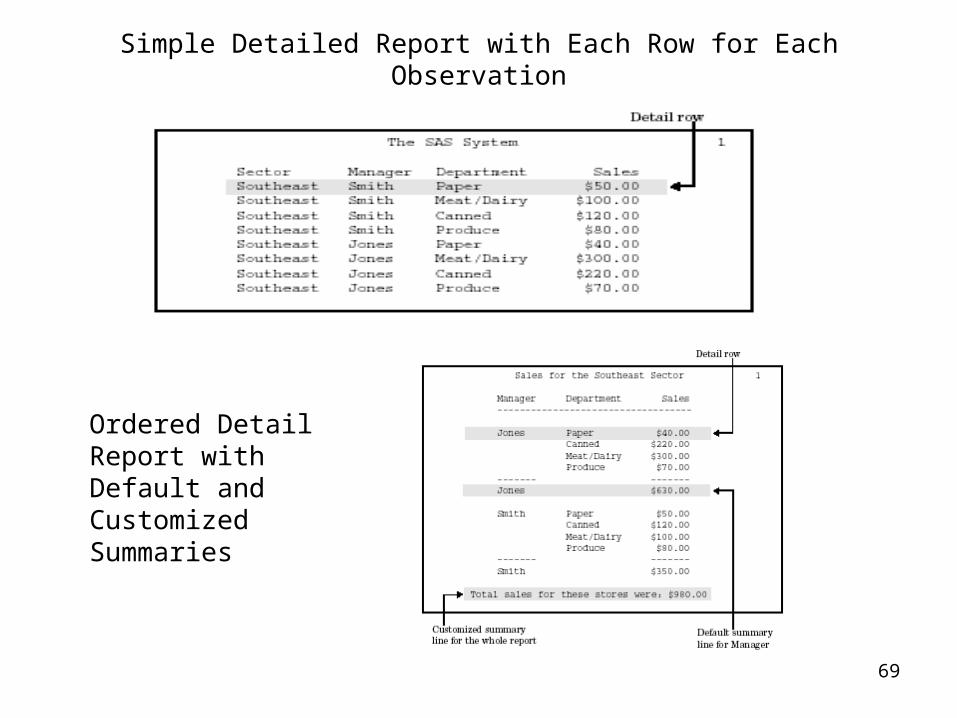
• Detail Report: detail row– A simple PROC REPORT step produces a report
similar to one produced by a simple PROC PRINT step.
• Summary Report: summary line

PROC REPORT Features
In addition to creating list reports, PROC REPORT enables you to– create custom reports– request separate subtotals and grand totals– calculate columns– create and store report definitions– generate reports in windowing or nonwindowing
environments.
69
Simple Detailed Report with Each Row for Each Observation
Ordered Detail Report with Default and Customized Summaries

Creating a List Report
General form of a simple PROC REPORT step:
Selected options:
WINDOWS|WD invokes the procedure in a windowing mode (default).
NOWINDOWS|NOWD displays a listing of the report in the OUTPUT window.
PROC REPORT DATA=SAS-data-set <options>;RUN;

Creating a List Report...
proc report data=sta4102.example3 nowd;
run;
Semeste Entranc SAT Based
Gender r e Age SAT Score Decision
Male Fall Twenty 930 Undecide
Female Fall Twenty 1200 Acceptable
Female Fall Twenty 900 Undecide
Female Fall Twenty 680 Unaccaptable
Male Fall Twenty 960 Undecide
Female Fall Twenty 830 Undecide

Printing Selected Variables
You can use a COLUMN statement to– select the variables to appear in the report
– select the order in which the variables appear in the report.
– defines headers that span multiple columns.
A General form of the COLUMN statement:
COLUMN SAS-variables;

Creating a List Report
proc report data=sta4102.example3 nowd;
column year semester entry_age decision1 sat;
run;
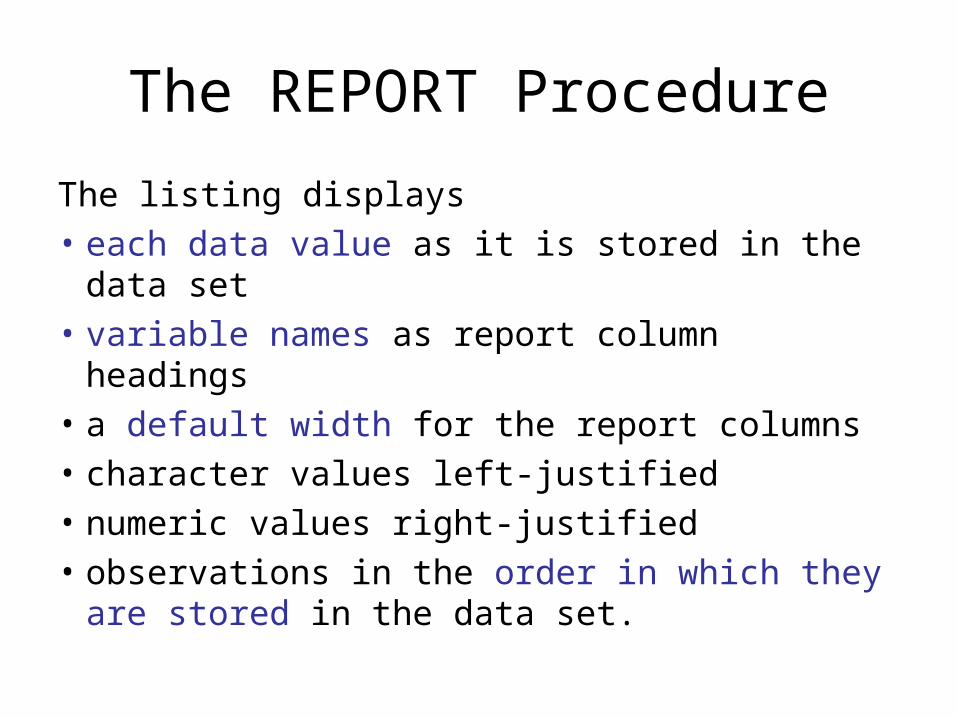
The REPORT Procedure
The listing displays
• each data value as it is stored in the data set
• variable names as report column headings
• a default width for the report columns
• character values left-justified
• numeric values right-justified
• observations in the order in which they are stored in the data set.

The DEFINE Statement
You can enhance the report by using DEFINE statements to– define how each variable is used in the report– assign formats to variables– specify report column headers and column
widths– justify the variable values and column headings
within the report columns– change the order of the rows in the report.
The DEFINE Statement
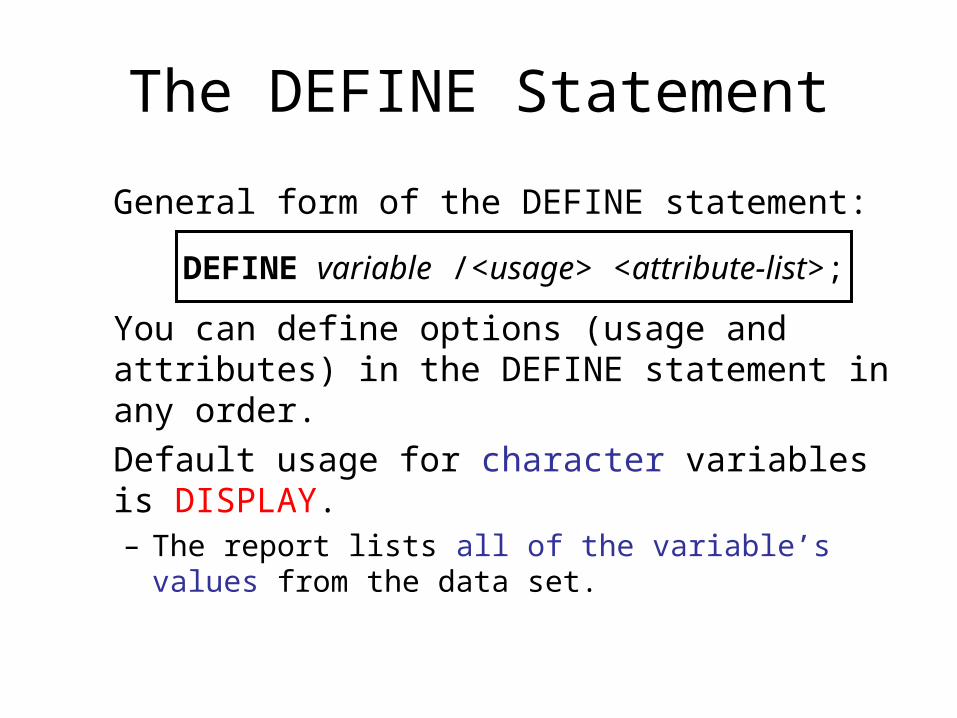
General form of the DEFINE statement:
You can define options (usage and attributes) in the DEFINE statement in any order.
Default usage for character variables is DISPLAY.– The report lists all of the variable’s values from the
data set.
DEFINE variable /<usage> <attribute-list>;

77
Usage of Variables in PROC REPORT
• Usage of Variables in a Report Much of a report’s layout is determined by the usages that you specify for variables in the DEFINE statements or DEFINITION windows.
• For data set variables, these usages areDISPLAYDISPLAYORDERORDERACROSSACROSSGROUPGROUPANALYSISANALYSIS
• A report can contain variables that are not in the input data set. These variables must have a usage of COMPUTEDCOMPUTED.
78
Display Variables
• A report that contains one or more display variables has a row for every observation
• in the input data set. Display variables do not affect the order of the rows in the report.
• If no order variables appear to the left of a display variable, then the order of the rows
• in the report reflects the order of the observations in the data set. By default, PROC
• REPORT treats all character variables as display variables.

79
Order Variables• A report that contains one or more order variables has a
row for every observation in the input data set. • If no display variable appears to the left of an order
variable, then PROC REPORT orders the detail rows according to the ascending, formatted values of the order variable. You can change the default order with ORDER= and DESCENDING in the DEFINE statement or with the DEFINITION window.
• If the report contains multiple order variables, then PROC REPORT establishes the order of the detail rows by sorting these variables from left to right in the report.
• PROC REPORT does not repeat the value of an order variable from one row to the next if the value does not change, unless an order variable to its left changes values.

80
Across Variables
• PROC REPORT creates a column for each value of an across variable.
• PROC REPORT orders the columns by the ascending, formatted values of the across variable. You can change the default order with ORDER= and DESCENDING in the DEFINE statement or with the DEFINITION window.
• If no other variable helps define the column, then PROC REPORT displays the N statistic (the number of observations in the input data set that belong to that cell of the report).
• Across variables are class variables that are used in the column dimension.

81
Group Variables• If a report contains one or more group variables, then PROC
REPORT tries to consolidate into one row all observations from the data set that have a unique combination of formatted values for all group variables.
• When PROC REPORT creates groups, it orders the detail rows by the ascending, formatted values of the group variable. You can change the default order with ORDER= and DESCENDING in the DEFINE statement or with the DEFINITION window.
• With multiple group variables, PROC REPORT establishes the order of the detail rows by sorting these variables from left to right.
• PROC REPORT does not repeat the values of a group variable from one row to the next if the value does not change, unless a group variable to its left changes values.
• Group variables are class variables that are used in the row dimension.

82
Analysis Variables
• An analysis variable is a numeric variable that is used to calculate a statistic for all the observations represented by a cell of the report.
• Across variables, in combination with group variables or order variables, determine which observations a cell represents. You associate a statistic with an analysis variable in the variable’s definition or in the COLUMN statement.
• By default, PROC REPORT uses numeric variables as analysis variables that are used to calculate the Sum statistic.

83
Computed Variables
• Computed variables are variables that you define for the report. They are not in the input data set, and PROC REPORT does not add them to the input data set. However, computed variables are included in an output data set if you create one.
• In the nonwindowing environment, you add a computed variable by– including the computed variable in the COLUMN statement– defining the variable’s usage as COMPUTED in the DEFINE
statement– computing the value of the variable in a compute block
associated with thevariable.
The DEFINE Statement
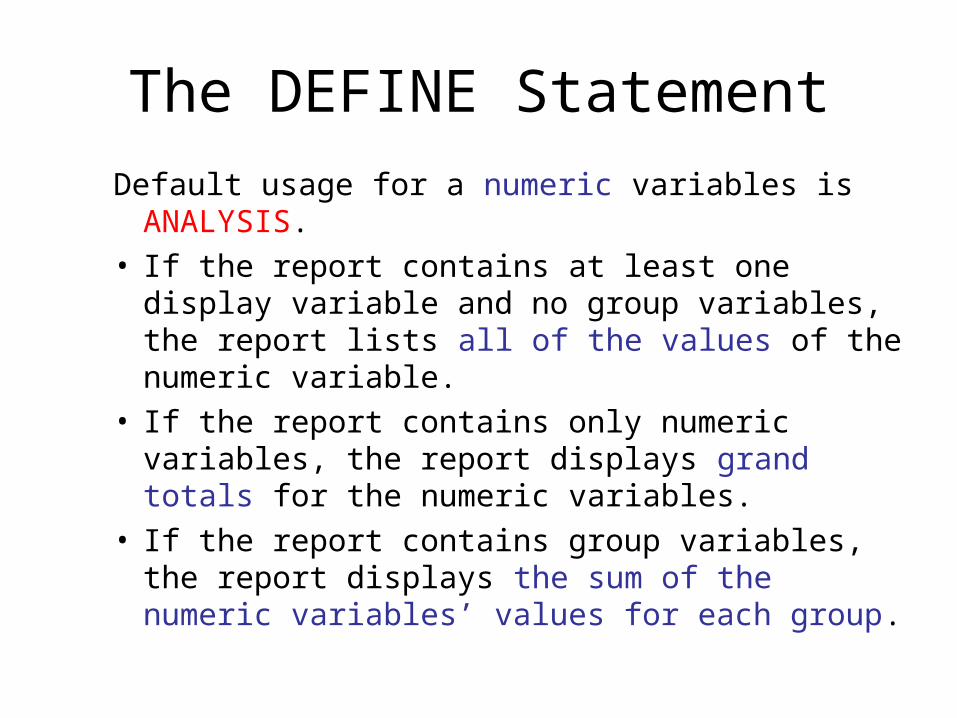
Default usage for a numeric variables is ANALYSIS.• If the report contains at least one display variable
and no group variables, the report lists all of the values of the numeric variable.
• If the report contains only numeric variables, the report displays grand totals for the numeric variables.
• If the report contains group variables, the report displays the sum of the numeric variables’ values for each group.

The DEFINE Statement
Other available statistics include
N number of nonmissing values
MEAN average
MAX maximum value
MIN minimum value

The DEFINE Statement
Additional usage:
ORDER determines the order of the rows inthe report. The default order is ascending. To force the order to be descending,
include the DESCENDING option onthe DEFINE statement.
Repetitious printing of values issuppressed.

The DEFINE Statement
Selected attributes:
FORMAT= assigns a format to a variable. I f there is a format stored in the
descriptor portion of the data setit is the default format.
WIDTH= controls the width of a reportcolumn. The default width is the variable
length.
continued...

The DEFINE Statement
CENTERLEFTRIGHT
identifies the justification of valuesand the header within the reportcolumn. The default is LEFT for character
values and RIGHT for numericvalues.
continued...

The DEFINE Statement
'report-column-header' defines the reportcolumn header. I f there is a label
stored in thedescriptor portion ofthe data set it is thedefault header.

Creating an Enhanced List Report
The enhanced aircraft capacity list report includes– appropriate report column headings– formatted values for the INSERVICE variable– column widths wide enough for the headings– values and headings centered within the
columns– rows of the report ordered by descending values
of the variable SIZE.
Enhancing a List Report
File: pg1-ch5-ex06.sas
This demonstration illustrates how to enhance a list report.

Chapter Summary• Create a SAS data set from an existing SAS data set
DATA SAS-data-set;SET SAS-data-set;additional SAS statements
RUN;
• Selecting variables to store in a SAS Data set
SAS-data-set(DROP=variables)or
SAS-data-set(KEEP=variables)
Chapter Summary
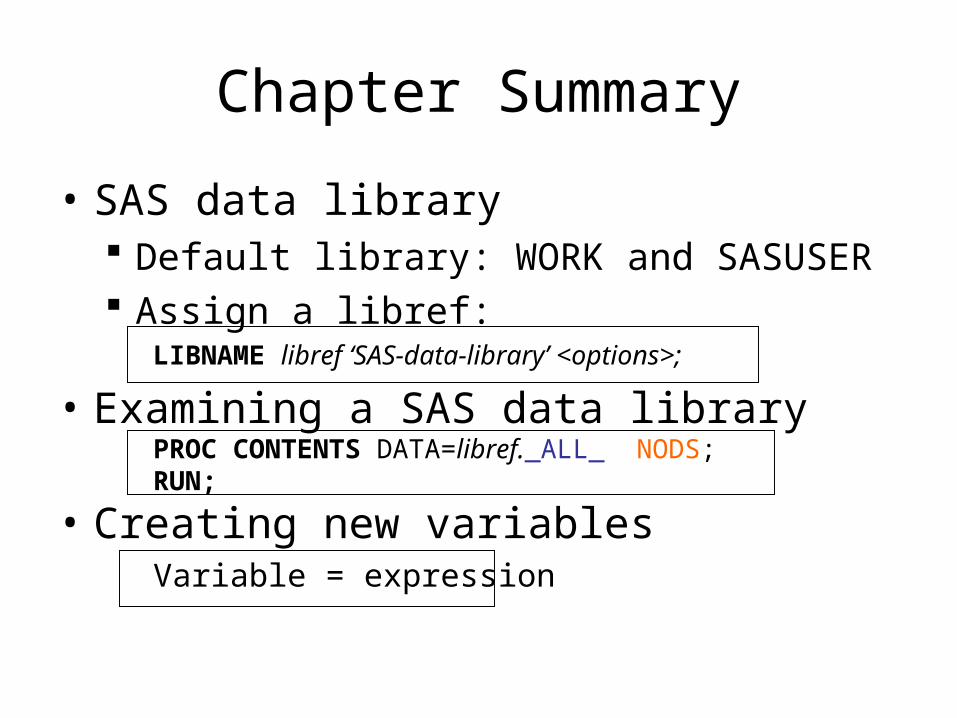
• SAS data library Default library: WORK and SASUSER Assign a libref:
LIBNAME libref ‘SAS-data-library’ <options>;
• Examining a SAS data libraryPROC CONTENTS DATA=libref._ALL_ NODS;RUN;
• Creating new variablesVariable = expression

Chapter Summary
• Creating summary statistics with PROC MEANS
PROC MEANS DATA=SAS-data-set; VAR variables;RUN;
• CLASS statement and MAXDEC option in PROC Means
Chapter Summary
• Conditionally executing statement in DATA step
• LENGTH statement in DATA step
• Conditionally executing multiple statements in DATA step

Chapter Summary
• Creating a list report with PROC REPORT
• Use DEFINE statement in PROC REPORT
Recommended