Ch i Kid DiChronic Kidney Disease (CKD) Care: a partnership(CKD) Care: a partnership
il l likA. Bilal Malik, MD.
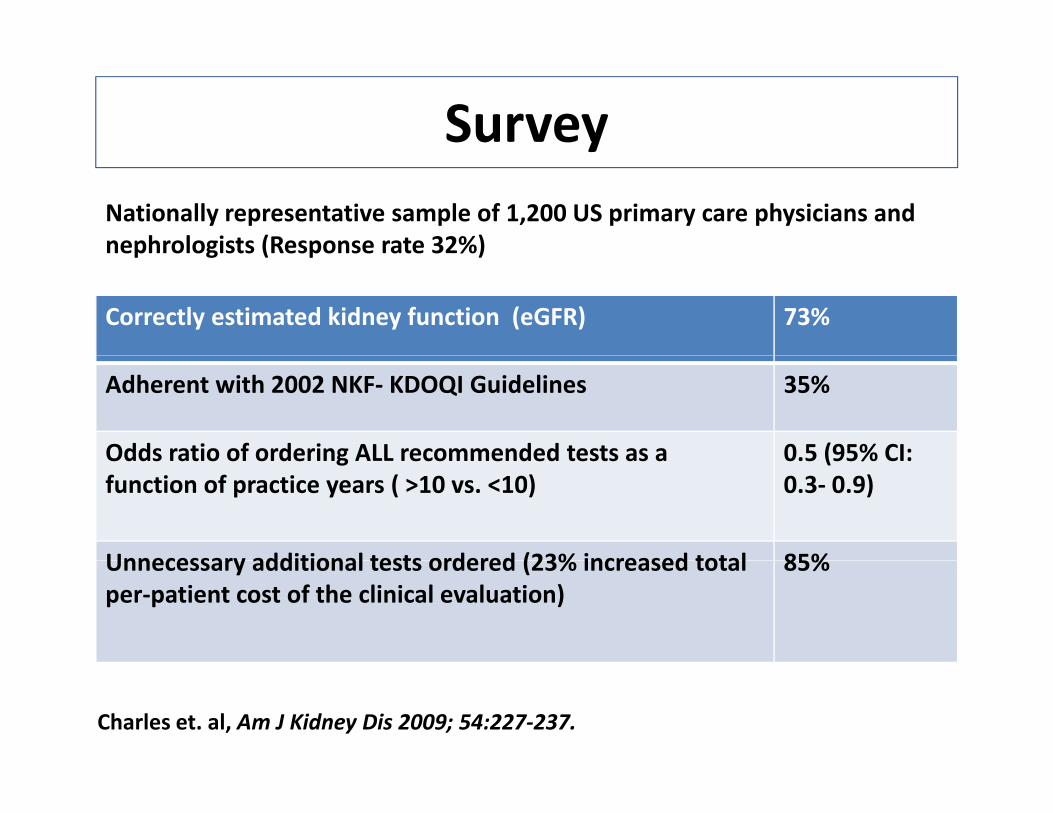
SurveyyNationally representative sample of 1,200 US primary care physicians and nephrologists (Response rate 32%)
Correctly estimated kidney function (eGFR) 73%
nephrologists (Response rate 32%)
Adherent with 2002 NKF‐ KDOQI Guidelines 35%
Odds ratio of ordering ALL recommended tests as a 0.5 (95% CI:Odds ratio of ordering ALL recommended tests as a function of practice years ( >10 vs. <10)
0.5 (95% CI: 0.3‐ 0.9)
Unnecessary additional tests ordered (23% increased total 85%Unnecessary additional tests ordered (23% increased total per‐patient cost of the clinical evaluation)
85%
Charles et. al, Am J Kidney Dis 2009; 54:227‐237.

IM Resident PerformanceIM Resident Performance
• 28% not aware of CKD guidelines (9%: 3rd year residents)
% f•43% aware of NKF‐KDOQI guidelines•50% did not know definition of CKD•33% did not know CKD Staging/ unable to identify Stage 3 CKDStage 3 CKD•90% correctly referred for nephrology consultation
Agrawal et. al, Am J Kidney Dis 2008; 52:1061‐1069.

Conceptual Model of CKDp
• 2002= National Kidney Foundation (NKF): Kidney Disease Outcomes Quality Initiative (KDOQI) guidelines
• 2005= Kidney Disease: Improving Global Outcomes (KDIGO)Outcomes (KDIGO)
• Concepts:oDefinitionoDefinition
o Staging
oOutcomes & Treatment
oRisk Factors
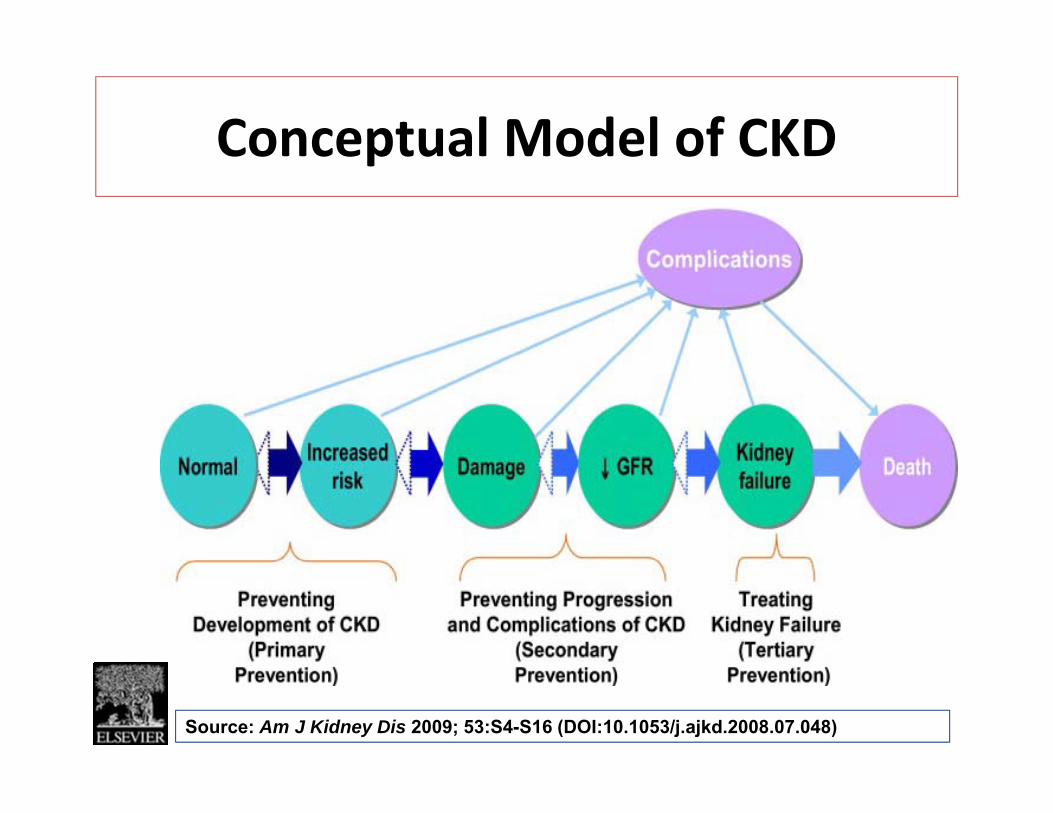
Conceptual Model of CKDConceptual Model of CKD
Source: Am J Kidney Dis 2009; 53:S4-S16 (DOI:10.1053/j.ajkd.2008.07.048)
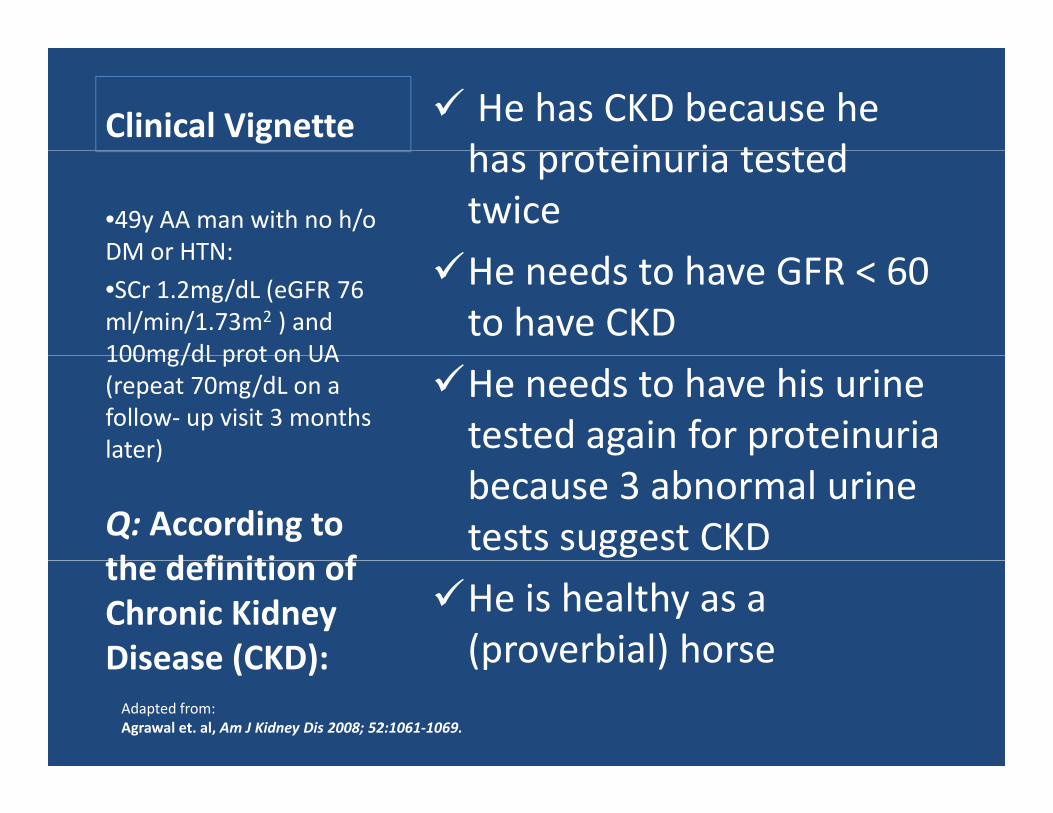
Clinical Vignette He has CKD because he h t i i t t dhas proteinuria tested twice •49y AA man with no h/o
DM or HTN:He needs to have GFR < 60 to have CKD
DM or HTN:
•SCr 1.2mg/dL (eGFR 76 ml/min/1.73m2 ) and 100mg/dL prot on UA
He needs to have his urine tested again for proteinuria
100mg/dL prot on UA (repeat 70mg/dL on a follow‐ up visit 3 months later)
because 3 abnormal urine tests suggest CKD
)
Q: According to th d fi iti f
He is healthy as a (proverbial) horse
the definition of Chronic Kidney Disease (CKD): (p )Disease (CKD): Adapted from:Agrawal et. al, Am J Kidney Dis 2008; 52:1061‐1069.

Definition
CriteriaKidney damage for ≥3 months, with or without decreased GFR•Pathological abnormalities (Markers of kidney damage)Urinary abnormalities (proteinuria)U a y ab o a t es (p ote u a)Blood abnormalities (renal tubular syndromes)Imaging abnormalities
•Kidney transplantationy p
GFR <60 ml/min/1.73 m2 for ≥3 months, with or without kidney / / f , ydamage
Kidney Disease Outcome Quality Initiative: K/DOQI clinical practice guidelines for chronic kidney disease: Evaluation, classification, and stratification. Am J Kidney Dis 39(2 Suppl 2):S1–246, 2002 [Table 2].

Definitions of Micro‐albuminuria & Proteinuria
Collection Method Normal Micro‐ Overt albuminuria Proteinuria
Total Protein24 h ti <300 mg/d NA >300 mg/d•24‐hour excretion
•Spot urine protein‐creatinine ratio
<300 mg/d<200 mg/g
NANA
>300 mg/d>200 mg/g
Albumin•24‐hour excretion•Spot urine albumin‐
i i i
<30 mg/d<17 mg/g (men)
30‐ 300 mg/d17‐250 mg/g (men)
>300 mg/d>250 mg/g (men)creatinine ratio (men)
<25 mg/g (women)
(men)25‐355 mg/g (women)
(men)>355 mg/g(women)
Adapted from National Kidney Foundation KDOQI Clinical Practice Guidelines for CKD.

GFR Estimating EquationsGFR Estimating Equations
1. The original MDRD Study equation:g y qGFR = 186 × Scr−1.154 × age−0.203 × 1.212 [if black] × 0.742 [if female]
2 The “re expressed” MDRD Study equation for standardized2. The re‐expressed MDRD Study equation for standardized serum creatinine:GFR = 175 × standardized Scr−1.154 × age−0.203 × 1.212 [if black] ×0.742 [if female]
3. Cockcroft– Gault equation:CrCl = (140−age) × weight × 0.85 [if female] × 1.73/(72 Scr × BSA)
Age is expressed in years; weight is expressed in kilograms; body surface area is calculated as W 0.425
× H 0.725 × 0.007184 /1.73 m2. MDRD= Modification of Diet in Renal Disease.

Relation of Estimated GFR to Measured GFR in the Participants in the Modification of Diet in Renal
Di (MDRD) St dDisease (MDRD) Study
Stevens L et al. N Engl J Med 2006;354:2473-2483

Clinical Vignette • <15 ml/min/1.73m2g
• 30‐60 ml/min/1.73m2
• 60 90 ml/min/1 73m2•49y AA man with no h/o DM or HTN: • 60‐90 ml/min/1.73m2
• 15‐30 ml/min/1.73m2
DM or HTN:
•SCr 3.2mg/dL (repeat 3.3mg/dL on a follow‐ up visit 3 months later)
• ‐∞ to +∞visit 3 months later)
Q: He is labeled as having CKD Stage IV because his estimated glomerular filtration rate (eGFR) falls in the ( )following range:
Adapted from:Agrawal et. al, Am J Kidney Dis 2008; 52:1061‐1069.
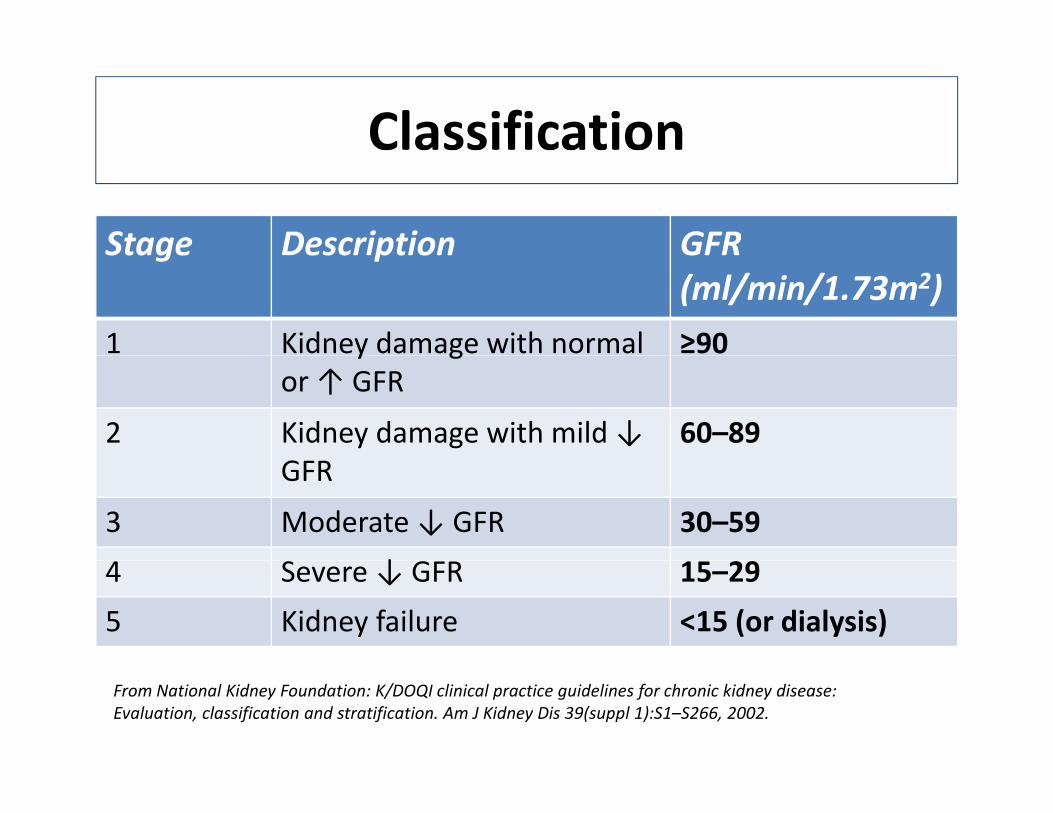
Classification
Stage Description GFRStage Description GFR(ml/min/1.73m2)
1 Kidney damage with normal ≥90y gor ↑ GFR
2 Kidney damage with mild ↓ 60–89GFR
3 Moderate ↓ GFR 30–59
↓4 Severe ↓ GFR 15–29
5 Kidney failure <15 (or dialysis)
From National Kidney Foundation: K/DOQI clinical practice guidelines for chronic kidney disease: Evaluation, classification and stratification. Am J Kidney Dis 39(suppl 1):S1–S266, 2002.

Clinical Vignette• SCr alone [with eGFR] • UrinanalysisUrinanalysis• Random Urine albumin or protein Q:What tests
• Random urine albumin: creatinine ratio or urine protein: creatinine ratio
would you order to assess kidney damage in a protein: creatinine ratio
• 24 hour urine creatinineclearance
damage in a patient who is at increased risk for
• 24 hour urine protein excretion
increased risk for chronic kidney disease?
• CT Abdomen & Pelvis• Capsule Endoscopy
Adapted from:Agrawal et. al, Am J Kidney Dis 2008; 52:1061‐1069.

PrevalencePrevalence
Large cross‐ sectional health surveysg y[National Health and Nutrition Examination Survey (NHANES)]Screening programs in↑risk groupsScreening programs in ↑risk groups
[Kidney Early Evaluation Program (KEEP)]• Adjusted weights allow for sound inferences on national prevalencej g p• Unbiased estimates of complication rates• All prevalence estimates show a strong age dependence• Use of GFR estimation equations & Cr assay calibrationq y• Albuminuria used as a surrogate for ‘damage’ in CKD Stage 1 & 2• Limitations

Prevalence [NHANES](Coresh et al JAMA 2007 298(17) 2038 2047)(Coresh et. al, JAMA. 2007;298(17):2038‐2047)
Stage GFR (ml/min/1.73m2) Prevalence [%] Cases (95% CI)
__________________1988‐ 1994 1999‐ 2004
________________Millions
1 ≥90 1.71 1.78 3.6 (2.7‐ 4.5)( )
2 60–89 2.70 3.24 6.5 (5.2‐ 7.8)
3 30–59 5.42 7.69 15.5 (14.1‐ 16.8)
4 15–29 0.21 0.35 0.7 (0.5‐ 0.9)
1‐ 4 10.03 13.07 26.3 (24.2‐ 28.3)
*5 <15 (±dialysis) ‐ 0.2 0.3( y )
*From US Renal Data System (USRDS)

Prevalence of CKD Stages by Age Group in NHANES 1988-1994 and 1999-2004
Coresh, J. et al. JAMA 2007;298:2038-2047.
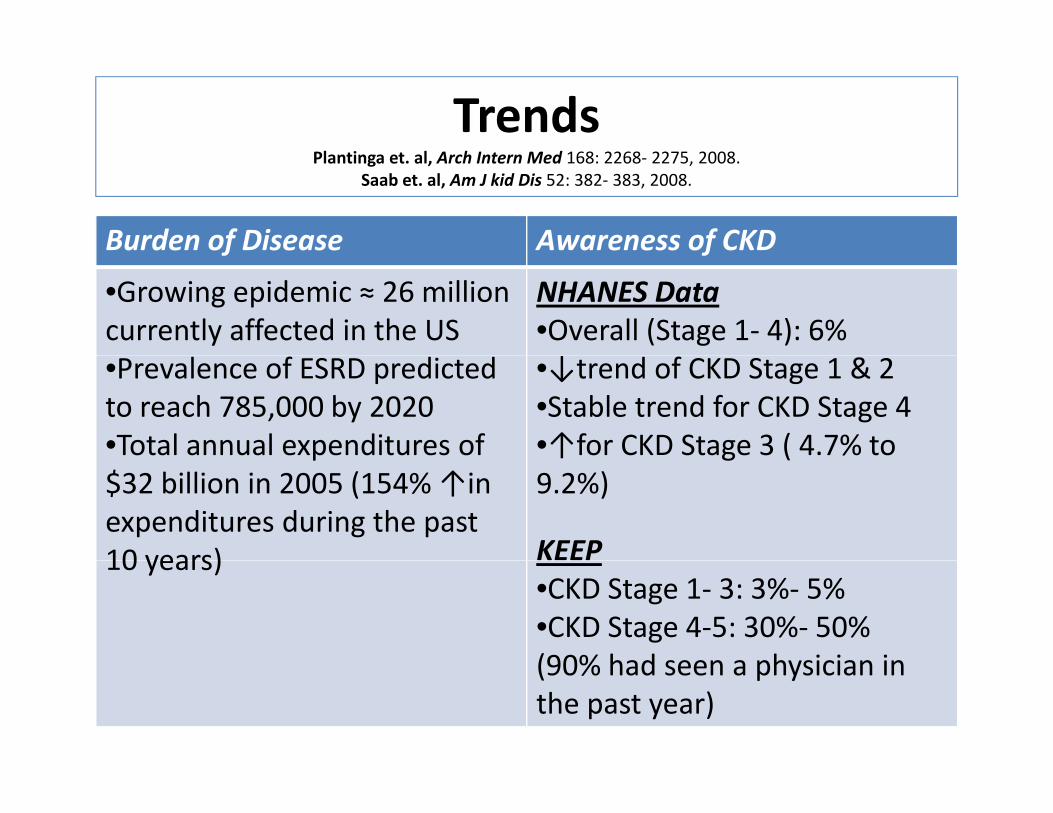
TrendsPlantinga et. al, Arch Intern Med 168: 2268‐ 2275, 2008.
Saab et. al, Am J kid Dis 52: 382‐ 383, 2008.
Burden of Disease Awareness of CKDf f
•Growing epidemic ≈ 26 million currently affected in the US
NHANES Data•Overall (Stage 1‐ 4): 6%
•Prevalence of ESRD predictedto reach 785,000 by 2020•Total annual expenditures of
•↓trend of CKD Stage 1 & 2•Stable trend for CKD Stage 4•↑for CKD Stage 3 ( 4.7% to p
$32 billion in 2005 (154% ↑in expenditures during the past 10 years)
↑ g (9.2%)
KEEP10 years)•CKD Stage 1‐ 3: 3%‐ 5%•CKD Stage 4‐5: 30%‐ 50%(90% had seen a physician in(90% had seen a physician in the past year)
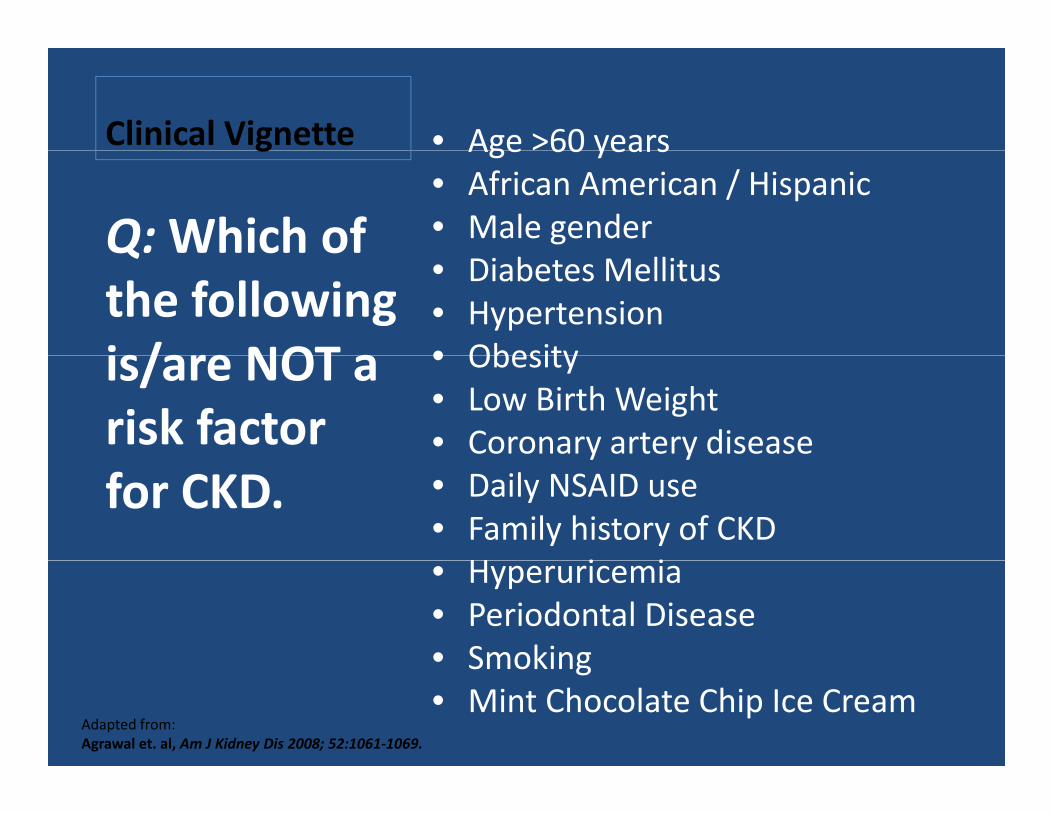
Clinical Vignette • Age >60 yearsg Age 60 years• African American / Hispanic• Male genderQ:Which of • Diabetes Mellitus • Hypertension • Obesity
Q: c othe following is/are NOT a • Obesity
• Low Birth Weight• Coronary artery disease
is/are NOT a risk factor y y
• Daily NSAID use• Family history of CKDH i i
for CKD.• Hyperuricemia• Periodontal Disease• SmokingSmoking• Mint Chocolate Chip Ice Cream
Adapted from:Agrawal et. al, Am J Kidney Dis 2008; 52:1061‐1069.

Risk Factors
Susceptibility F
Initiation Factors Progression FactorsFactors
•Older age•Family h/o CKD
•Diabetes Mellitus•Hypertension
•↑level of proteinuriaFamily h/o CKD
•Low birth weight•US Racial/ Ethnic i it
Hypertension•AutoimmunediseasesS t i i f ti
proteinuria•SBP•Poor glycemic
t lminority•Low socio‐economic status
•Systemic infections•UTIs•Nephrolithiasis
control•Smoking•Metabolic
•Low education level•↓kidney mass
•Obstruction•Drug toxicity
syndrome•Obesity
↓kidney mass•ObesityLevey et. al, Ann Intern Med 139: 137‐ 147, 2003.

Risk Factors: HypertensionEvidence
•MRFIT (16y f/u of 332 544 middle‐aged332,544 middle‐aged men: >127/82mmHg)•Okinawa StudyEffect ofEffect of
proteinuria?•↑BP is a stronger risk factor in patients withfactor in patients with ↑proteinuriaSBP or DBP?
•PHS (>8000 men): ORPHS (>8000 men): OR 1.11 vs. 1.05 for SBP•MRFIT

Risk Factors: Hypertension
Relationship between BP and GFR in CKD, based on d f i li i ldata from nine clinical trials, indicate that mean rate of decline in GFR is directly associated with ylevel of mean SBP.
Effect of an intervention that ↓BP ↓on the rate of decline in GFR and the time of onset of ESRD in a theoretical patient withtheoretical patient with CKD and HTN.

Risk Factors: Diabetes Mellitus
• ~1/2 of all incident cases of ESRD/• Overall population‐ attributable risk for kidney failure ~ 42% (Perneger et. al, Ann Intern Med 121: 912‐918, 1994)
• United Kingdom Prospective Diabetes Study (UKPDS): 10y after diagnosis prevalence of μalbuminuria was 25%, macroalbuminuria 5.3%μalbuminuria was 25%, macroalbuminuria 5.3% and ↑SCr 0.8%.
• Only 1/3 of patients with DM develop h h i f ibili fnephropathy: impact of susceptibility factors
• ?Role of strict metabolic control in the initiation ±progression of CKDprogression of CKD

Risk Factors: Smoking• Type 1 & 2 Diabetes Mellitusrisk factor for development of μalbuminuria overt proteinuria &risk factor for development of μalbuminuria, overt proteinuria &
↑CKD
• Non‐ diabetic CKDADPCKD, IgA Nephropathy, Lupus Nephritis: median time to
ESRD halved
• PREVEND/ Framingham Offspring Study
• Mechanism(s): ↑Symp; ↑PGC; Endothelial injury; direct tubulotoxicity
Prospective studies showing a renoprotective benefit from smoking cessation are lacking.

Risk Factors: Dyslipidemiay p
• Positive data from fProspective studies ONLYPHS [↑T t l Ch l]→PHS [↑Total Chol]→ARIC [↑TG, ↓HDL]FraminghamFramingham Offspring Study [↓HDL: independent risk factor for incident CKD]CKD]

Risk Factors: Obesity
Study Findings
US rate has ‘Tripled’: from 11.5% (1990) to 34.1% (2004)
Framingham OffspringStudy
•n= 2676 (12% obese: followed for 18.5y)•8% developed CKD Stage 3•Obese= 68%↑riskStudy •Obese= 68%↑risk•Adjustment for HTN/DM/HDL‐C= ns
Ryu et. al, JASN •9000 Korean men (no DM/HTN: f/u 4y)19: 1798‐1805,2008.
•Gain of >0.75kg/y= CKD RR 4.21‐ 4.32•U‐ shaped relationship (↓risk with <0.25kg/y)<0.25kg/y)
Meta‐analysis(Wang et. al, KI73 19 33 2008)
•16 published cohorts•RR: Overweight (1.4); Obese (1.83)
73: 19‐33, 2008) •Women > Men•25%‐33% CKD

Risk Factors: Metabolic SyndromeyAbdominal obesity/ Dyslipidemia/ Hypertension/ Insulin resistance/ Hyperfiltration/ Prothrombotic & proinflammatory statesHyperfiltration/ Prothrombotic & proinflammatory states
Study Findings
NHANES III •Linear relationship between CKD & number of components
ARIC Study •10,096 non‐ diabetic participants i h l l f i (f/ 9 )
ywith normal renal function (f/u= 9y)•43%↑risk of CKD with metabolic syndrome•Independent risk factor (persisted•Independent risk factor (persisted after adjustment for future development of DM & HTN)
No intervention trials planned to study effect of treatment on CKD risk/No intervention trials planned to study effect of treatment on CKD risk/ progression

Risk Factors: Cardiovascular Disease
?CVD independent i k f f CKDrisk factor for CKD
•CHF= ↓renal perfusion•CAD= ↑renovascular diseasedisease

Patient‐ specific Factors
RaceCohort Study
(Medicare Beneficiaries with 10y f/u)After adjustment for age & gender, risk of ESRD in AA vs. Caucasians:•DM ~2 5X (Others•DM: ~2.5X (Others: 1.5X)•HTN: 3X (Others: 2X)•Neither DM nor HTN:Neither DM nor HTN: 3.5X (Others: 2X)
Xue et al J Am Soc Nephrol
Cumulative probability of developing ESRD by race after adjustment for age and gender.
Xue et. al, J Am Soc Nephrol 18: 1299–1306, 2007.

Patient‐ specific Factors
Race & Socio‐economic StatusUSCensus and ESRD Network 6 data:
•34,767 incident HD in GA, NC & SC (Jan 1998‐ Dec 2002)•Variable of interest: ‘Neighborhood Poverty’•Outcome: Incidence of ESRD•Findings: N i hb h d P t ↑i id f ESRD i BOTH C i & AA•Neighborhood Poverty ∞↑incidence of ESRD in BOTH Caucasians & AA
•Reference population (<5% pop below poverty level)•5%‐ 9.9%= 1.5X•10%‐ 14 9%= 1 8X•10%‐ 14.9%= 1.8X•15%‐ 19.9%= 2.6X•>20%= >3XImpact greater in AA populationImpact greater in AA population
Volkova et. al, J Am Soc Nephrol 19: 356–364, 2008.

Patient‐ specific Factors
GenderConflicting evidenceConflicting evidence
Direct Effects of Estradiol
Reverses TGF‐β–induced type I and type IV collagen
on Mesangial Cells
synthesis
Reverses TGF‐β–induced apoptosis
Increases collagenaseactivity
Inhibits oxidation of LDL
Affects cellular proliferation

Risk Factors: Uric Acid+ve association:
•ARIC & CHSNo association:No association:
•MMKD
Prospective Study→•21,475 healthy volunteers (followed prospectively for a median of 7 yr)•Outcome: Incident CKD•Adjustment for baseline eGFR:
/
OR for development of a GFR <60 ml/min
UA 7‐ 8.9mg/dL = OR 1.74UA ≥9mg/dL = OR 3.12
Obermayr, R. P. et al. J Am Soc Nephrol 2008;19:2407-2413
OR for development of a GFR <60 ml/min per 1.73 m2 depending on UA levels

Risk factors: Uric AcidAssociation of Uric Acid With Change in Kidney Function in
Healthy Normotensive Individuals
[r= -0.22 p< 0.001] [Test for trend p= 0.001]
Source: Am J Kidney Dis. Bellomo, et. al, 2010; 56:264-272. DOI:10.1053/j.ajkd.2010.01.019

Risk Factors: Low Birth Weight
Birth Weight N No. of Glomeruli [adjusted for age, gender, race, BSA]
2 65kg (1 81‐ 3 12) 29 770 860 (658 757‐ 882 963)
Hoy et. al, J Am Soc Nephrol 16:2557‐ 2564, 2005.
2.65kg (1.81 3.12) 29 770,860 (658,757 882,963)
3.27kg (3.18‐ 3.38) 28 965,729 (885,714‐ 1,075,744)
3.93kg (3.41‐ 4.94) 30 1,005,356 (900,094‐ 1,110,599)

Age: Normal Values for GFR in Men and Women
Stevens L et al. N Engl J Med 2006;354:2473-2483

Risk Factors: Proteinuria•Earliest pathological marker of kidney damage•Strongest & independent i k f t f i frisk factor for progression of diabetic and non‐diabetic CKD•Strong & independent risk factor for CVD
•Non‐diabetic proteinurich thnephropathy
REIN Study→MDRD Study AASK StudyAASK Study
•Diabetic nephropathyHOPE StudyIDNT StudyIDNT StudyRENAAL StudyIRMA‐2 Study

Risk Factors: ProteinuriaBaseline proteinuria & ↓ in GFR: MDRD Study
Peterson, J. C. et. al. Ann Intern Med 1995;123:754-762

Proteinuria: Initial ↓: 1/∞ long‐ term CKD progression↓ / g p g
Six-month change in proteinuriaEarly proteinuria (1 mo) change predicts S o t c a ge p ote u apredicts risk for ESRD
Early proteinuria (1 mo) change predicts long-term (> 6mo) renal decline
Bakris,G.L. Clin J Am Soc Nephrol 2008;3:S3-S10.

Clinical Vignette Diabetes MellitusgCKD
Peripheral VascularQ: Which of the Peripheral Vascular Disease
following is/are considered as
Cerebrovascular Accident
“Coronary Artery Disease
Jay‐ walkingEquivalent”?

CKD as a CVD Risk FactorIncidence rate ratio (IRR) (95% confidence interval) for cardiovascular death.
CV mortality risk by categories of eGFR and urine ACR. (*P < .05. P < .01. P < .001)
The HUNT II Study. Arch Intern Med. 2007;167(22):2490‐2496

CKD as a CVD Risk Factor

Angiotensin II•loss of glomerular•loss of glomerular size permselectivity•Mesangial cell proliferation/proliferation/ activation (↑TGF‐β)•Activation of endothelial & VSM cells by ROS (↑PAI‐1)•Activation of macrophage/ monocytes (↑phagocytosis)•↑cytokine
iexpression•Fibrosis (↑aldo/ ↑TGF‐β)


Clinical Vignette What is the goal BP in this ti t?patient?
What would be the goal BP 52 year old caucasianwoman with type 2
if proteinuria was 1.2g/day?
diabetes mellitus comes to you with blood pressure (BP)
EBM dictates the agent of choice for BP control
blood pressure ( P)148/92 mmHg and the following labs:
SC 0 9 /dl d should be?
What agent(s) should be
SCr 0.9 mg/dl and eGFR 70 ml/min/1.73m2 with at age t(s) s ou d be
avoided given proteinuria and CKD for BP control?
Microalbuminuria(268mg/g)
Adapted from:Agrawal et. al, Am J Kidney Dis 2008; 52:1061‐1069.

Strategies: MDRD Study:840 di b ti f ll d f 2 2
Hypertension840 non‐diabetics followed for 2.2y
Low BP Group (125/75 or MAP 92mmHg) vs. Usual BP Group (140/90 or MAP 107mmHg)
Q: How much lowering of BP is required for optimal renoprotection?

Strategies: AASK Study:1094 bl k 3 8 f llHypertension 1094 blacks: 3.8y follow‐ up
Target MAP≤ 92mmHg vs. MAP 102‐ 107mmHg
Q: How much lowering of BP is required forrequired for optimal renoprotection?renoprotection?
Wright et. al, JAMA. 2002;288(19):2421‐2431.

Strategies: REIN‐2 Study:338 i i i F l di i dd dHypertension 338 proteinuric patients: Felodipine added to
Ramipril for target goal
(<130/80 vs. DBP <90mmHg)= additional BP↓ hi d 4 1/2 8 H )achieved= 4.1/2.8mmHg)Q: How much
lowering of BP is required forrequired for optimal renoprotection?renoprotection?
Ruggenenti et. al, Lancet 2005; 365: 939–46

Strategies: Meta‐analysis:11 RCT i l di 1860 di b tiHypertension 11 RCTs including 1860 non‐diabetics
Lowest risk of progression= achieved SBP 110‐129mmHg (independent of ACE‐I use)
SBP<110mmHg= ↑CKD progression (RR 2.48)Q: How much lowering of BP is required forrequired for optimal renoprotection?renoprotection?

Does intensive BP↓retard the progression of CKD?p g
African-American Studyyof Kidney Disease and Hypertension(AASK)(AASK)
8.8- 12.2y follow- up
130/80 vs. 140/90
Risk of 1˚ Outcome [HR in intensive- controlintensive control group: 0.91 (p= 0.27)]
Appel LJ et al. N Engl J Med 2010;363:918-929

Hypertension: SummationHypertension: Summation
• Equivocal results from RCTs comparing “low”Equivocal results from RCTs comparing low vs. “usual” BP targets
• Overall picture: lower BP targets ~ effective• Overall picture: lower BP targets ~ effective renoprotection (especially with ↑proteinuria)
H i id• Hypotension: avoid
Consensus:
<130/80mmHg in ALL CKD
<125/75mmHg (>1g proteinuria/d)<125/75mmHg (>1g proteinuria/d)

Q:Which Antihypertensive?:
• ↑dietary salt abrogates the anti‐proteinuric effect of ACEi
Diuretics • Diuretic restores this effect despite ↑salt intake
Dietary Salt Restriction
Thiazide diureticsThiazide diuretics
as 2nd line Rx
(Stage 1‐ 3 CKD)(Stage 1 3 CKD)
Loop diuretics (advanced CKD)

Q:Which Antihypertensive?:2Ca2+ Channel Blockers
DihydropyridineDihydropyridineCa2+ blockers [amlodipine, felodipine, nifedipine]
Non‐ DHP Ca2+ Non‐ DHP Cablockers [diltiazem,
il]verapamil]

Angiotensin Converting Enzyme Inhibitors
Non‐diabetic CKD(Th GISEN G L t)
↓doubling of SCr/ ESRD (RR= 0.52)(The GISEN Group: Lancet)
Advanced CKD (Hou FF et al N Eng J Med
43% ↓risk of doubling of SCr, ESRD or death(Hou FF et. al, N Eng J Med
2006; 354:131‐140)or death
Non‐ Renal ↓Overall Mortality (RR= 0.84)
Outcomes [HOPE Study]
↓CV Mortality (RR= 0.74)

Angiotensin Converting Enzyme Inhibitors
Diabetic NephropathyType 1 DMType 1 DM
•CKD 50%↓risk of dialysis, transplant or death
lb i i ↓ i k f h h (OR 0 38)•μalbuminuria ↓risk of overt nephropathy (OR= 0.38)
•Normoalbuminuria 12.7% ↓in albuminuria (ns)
Type 2 DM
CKD B fit i l 1 t d•CKD Benefit in only 1 study
•μalbuminuria 24%‐ 67% ↓risk of overt nephropathy
•Normoalbuminuric/ Normotensive
12.5% ↓risk of developing μalbuminuria

Angiotensin Converting Enzyme Inhibitors: Evidence
Diabetic Nephropathy
Type 1 Type 2Established indicationslb i i
Established indicationslb i i•μalbuminuria
•Overt nephropathy•Hypertensive
•μalbuminuria•Hypertensive normoalbuminuria
normoalbuminuria
Possible benefit
Possible benefit•Normotensive
•Normotensive normoalbuminuria
normoalbuminuria
No RCT Evidence•Established nephropathy
N di b i ALL CKD ith t i i ≥ 0 5 /dNon‐ diabetic CKD
ALL CKD with proteinuria ≥ 0.5g/d
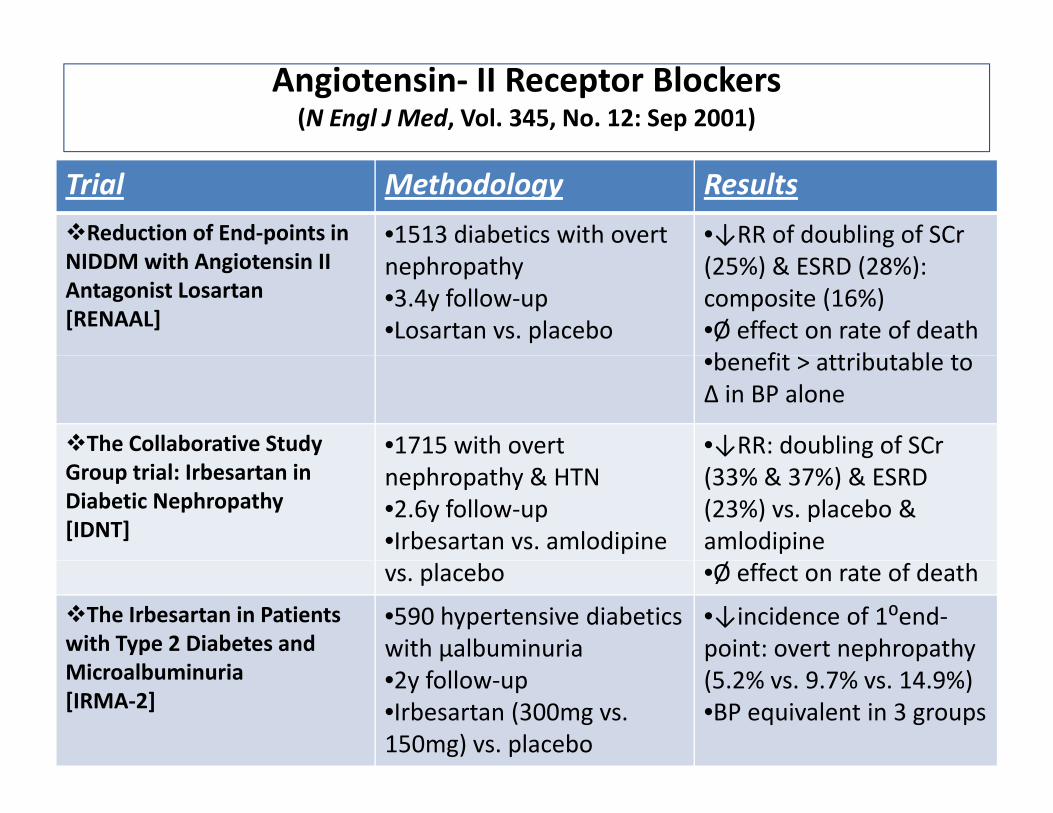
Angiotensin‐ II Receptor Blockers(N Engl J Med, Vol. 345, No. 12: Sep 2001)
∙September 20, 2001
Trial Methodology Results
Reduction of End‐points in h
•1513 diabetics with overt •↓RR of doubling of SCrp ,NIDDM with Angiotensin II Antagonist Losartan[RENAAL]
nephropathy•3.4y follow‐up•Losartan vs. placebo
(25%) & ESRD (28%): composite (16%)•Ø effect on rate of deathb fit tt ib t bl t•benefit > attributable to Δ in BP alone
The Collaborative Study •1715 with overt •↓RR: doubling of SCrGroup trial: Irbesartan in Diabetic Nephropathy [IDNT]
nephropathy & HTN•2.6y follow‐up•Irbesartan vs. amlodipine
g(33% & 37%) & ESRD (23%) vs. placebo & amlodipine
vs. placebo •Ø effect on rate of deathThe Irbesartan in Patients
with Type 2 Diabetes and •590 hypertensive diabetics with μalbuminuria
•↓incidence of 1⁰end‐point: overt nephropathy
Microalbuminuria[IRMA‐2]
•2y follow‐up•Irbesartan (300mg vs. 150mg) vs. placebo
(5.2% vs. 9.7% vs. 14.9%)•BP equivalent in 3 groups

Angiotensin‐ II Receptor Blockers: Consensus
I T 2 DMIn Type 2 DM:IRMA‐2/IDNT/RENAAL TrialsSt id fStrong evidence for
↓ ESRD (RR 0.78) and doubling of SCr (RR 0 79)0.79) Prevent progression
from μalbuminuria to overt nephropathy (RRovert nephropathy (RR 0.49)Doses ↑than
maximal recommended ≈ greater ↓proteinuriawithout further ↓in
Strippoli, G. F M et al. BMJ 2004;329:828
BP

ACEi vs. ARB• Changes from Baseline in GFR Based on
Analyses of the Last Observation Carried Forward [Complete 5-Year Data]
Diabetics Exposed to Telmisartan and E l il [DETAIL]Enalapril [DETAIL] TrialTelmisartan NOT
i f i t E l ilinferior to Enalapril.
JNC VII dJNC‐VII (2003) and ADA (Arauz‐Pacheo 2003):ACEi and ARB can be used interchangeablyinterchangeably. Both agents prevent progression of nephropathy.
Barnett et. al, N Eng J Med 2004 351:1952‐1961

ACEi + ARB: Combination R
• 1⁰ renal outcome= composite of dialysis, doubling of SCr & death (RR 1.09, p=0.037)Combination Rx • ↑incidence of acute dialysis (HR 2.19)
ONTARGET Study•>25 000 with vascular•>25,000 with vascular disease or DM with end‐organ damage (f/u ~ 4.5y)
•24.1% had eGFR <60ml/min/
•3000 had μalbuminuria
•1000 had macroalbuminuria
•Telmisartan 80mg (1/3),Telmisartan 80mg (1/3), Ramipril 10mg (1/3) & combination (1/3)
↑renal impairment (RR 1.33, p<0.0001)
Mann et. al, Lancet. 2008 Aug 16;372(9638):547‐53.

Clinical Vignette • Weight lossS ki ti• Smoking cessation
• Dietary salt restriction <2 4 /d
52 year old caucasianwoman with type 2 <2.4g/d
• Dietary protein restriction (0 6 t i /k /d)
woman with type 2 diabetes mellitus comes to you with blood pressure (BP) 148/92 mmHg and th f ll i l b (0.6g protein/kg/d)
• Statin therapy
the following labs:SCr 1.8mg/dl and eGFR 48 ml/min/1.73m2 with Microalbuminuria • Control of hyperuricemia
• Tight Glycemic control
Microalbuminuria(58mg/g).
Q: Is there any (HbA1c <7%)
• Tango lessons
Q: Is there anyevidence of benefit for?
Adapted from:Agrawal et. al, Am J Kidney Dis 2008; 52:1061‐1069.

Protein Restriction
Non‐ diabetic CKDMDRD:MDRD:↓protein intake of 0.2g/kg/d ≈ ↓1.15ml/min/y in rate of GFR decline↓29% in rate of GFR decline ≈ ↑41% in renal survival
l iMeta‐analysis:5 studies (1413 patients):Low prot diet ≈ RR 0.67 (95% CI: 0.5‐ 0.89) for ESRD or Death
Diabetic CKDMeta‐analysis:5 studies (108 Type 1 DM)5 studies (108 Type 1 DM)Low prot diet ≈ RR 0.56 (95% CI: 0.4‐ 0.77) for ↑albuminuria or ↓GFR
Enough evidence exists to recommend modest protein restriction (0.6g/kg/d) in CKD + evidence of progression.

Estimated Cumulative Incidence of the Composite Primary End Point.
Statins & ESRD:
4D Study•1255 Type2 DM on HD1255 Type2 DM on HD•Atorvastatin 20mg vs. placebo (4y f/u)•1⁰end‐point: composite p pof death from cardiac causes, nonfatal MI & stroke=RR 0.92 (95% CI: 0.77 to 1.10; P=0.37)
Wanner C et al. N Engl J Med 2005;353:238-248

Statins & CKD:
Meta‐analysis:y•50 trials (30,144 patients)•Significant ↓TC, LDL‐C & proteinuria•NO improvement in GFR:[11 studies, 548 pts: 1.48 ml/min (95% CI: –2.32 to 5.28)]NO i ifi t ff t ll•NO significant effect on all causemortality [44 studies, 23 665 pts; RR 0.92, (95%CI: 0.82 to 1 03)]→to 1.03)]→•Meta‐regression analysis showed that treatment effects did not vary significantly with
Strippoli et al. BMJ 2008;336:645-651
did not vary significantly with stage of CKD

Siu et. al, Am J Kidney Dis. 2006 47(1):51‐9Hyperuricemia
•Small prospective RCT (54 pts with 12mo f/u)(54 pts with 12mo f/u)•CKD (prot > 0.5g/d ± SCr> 1.35mg/dL) with hyperuricemia•Allopurinol (100‐300mg/d) vs. usual careg/ )↑SCr/RRT= 16% Allopurinol group vs 46% of controlvs. 46% of control (p= 0.015)
Mean SCr levels at baseline and end of treatment.

Tight Glycemic Control Cumulative Incidence of UAE >= 300mg/d (Dashed Line) & >=
40mg/d (Solid Line)
The Diabetes Control and Complications Trial Research Group. N Engl J Med 1993;329:977-986
?Role in established nephropathy:Conflicting results from recent large RCTs.
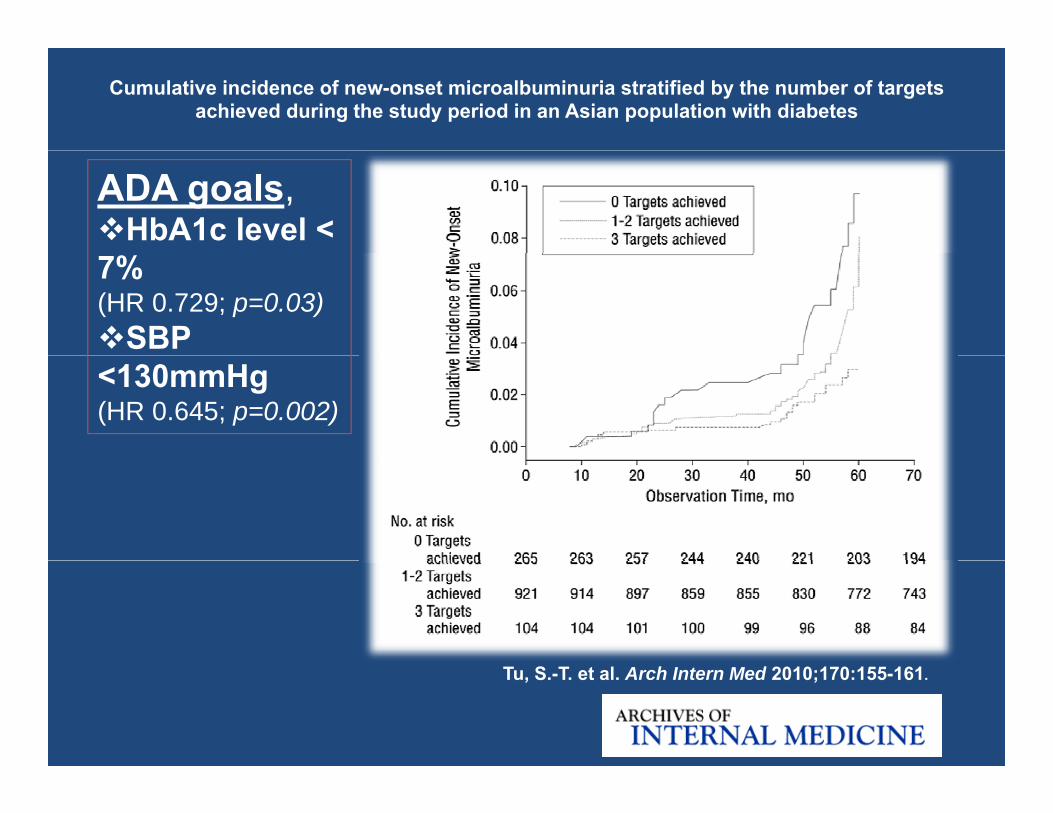
Cumulative incidence of new-onset microalbuminuria stratified by the number of targets achieved during the study period in an Asian population with diabetes
ADA goals,HbA1c level <
7% (HR 0.729; p=0.03)
SBP <130mmHg(HR 0.645; p=0.002)
Tu, S.-T. et al. Arch Intern Med 2010;170:155-161.
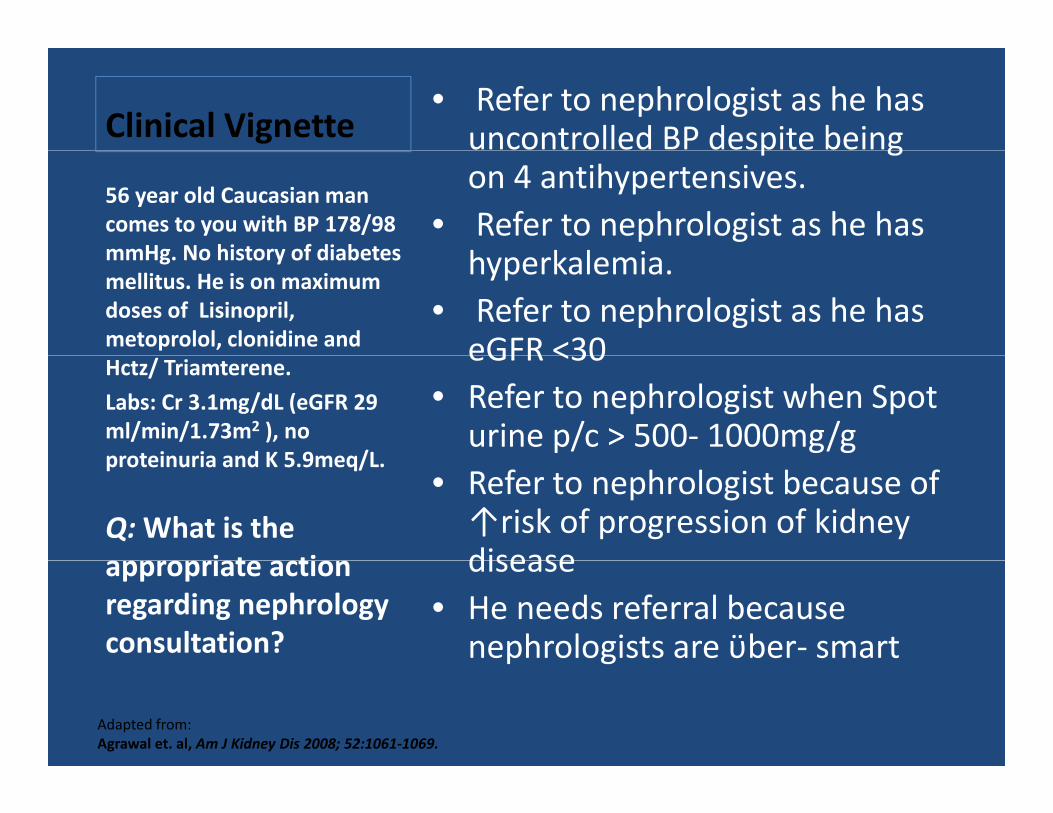
Clinical Vignette• Refer to nephrologist as he has uncontrolled BP despite being p gon 4 antihypertensives.
• Refer to nephrologist as he has h k l i
56 year old Caucasian man comes to you with BP 178/98 mmHg No history of diabetes hyperkalemia.
• Refer to nephrologist as he has eGFR <30
mmHg. No history of diabetes mellitus. He is on maximum doses of Lisinopril, metoprolol, clonidine and eGFR <30
• Refer to nephrologist when Spot urine p/c > 500‐ 1000mg/g
Hctz/ Triamterene.
Labs: Cr 3.1mg/dL (eGFR 29 ml/min/1.73m2 ), no proteinuria and K 5 9meq/L
• Refer to nephrologist because of ↑risk of progression of kidney disease
proteinuria and K 5.9meq/L.
Q:What is the i t ti disease
• He needs referral because nephrologists are ϋber‐ smart
appropriate action regarding nephrology consultation? p g
Adapted from:Agrawal et. al, Am J Kidney Dis 2008; 52:1061‐1069.

So……
Intervention Goal1. ACEi or ARB (especially with proteinuria >0.5g/d)
Proteinuria < 0.5g/dGFR decline < 1ml/min/year
2 Additi l tih t i <130/80 H f ALL CKD2. Additional antihypertensive therapy
<130/80mmHg for ALL CKD<125/75mmHg (for proteinuria >1g/d)
3. Weight loss (if obese) BMI < 30kg/m2g ( ) g
4. Dietary Sodium restriction <2.3g/d (<100 mmol/d)
5. Dietary Protein restriction 0.6g/kg/d
6. Tight glycemic control HbA1c <7%
7. Smoking cessation7. Smoking cessation
8. Lipid lowering therapy LDL‐C < 100mg/dL

Limitations of TherapyLimitations of Therapy
AASKAASK• 10y cumulative incidence of composite end‐point (doubling of
SCr, ESRD or death)= 53.9%
• Mean annual rate of eGFR decline= ‐1.5ml/min/1.73m2
RENAAL• 63% in Losartan arm & 51% in placebo arm: <140/90mmHg
• BUT 26% of these did not have a ↓albuminuria
di b i i i h hNon‐ diabetic proteinuric nephropathy• Meta‐analysis (11RCTs)= ACEi reduce renal end‐ points ONLY
in the subpopulation with >0 5g proteinuria/din the subpopulation with >0.5g proteinuria/d.
Recommended