Embed Size (px)
Citation preview
Comparison of High vs. Normal/Low Protein Diets onRenal Function in Subjects without Chronic KidneyDisease: A Systematic Review and Meta-AnalysisLukas Schwingshackl*, Georg Hoffmann
University of Vienna, Faculty of Life Sciences, Department of Nutritional Sciences, Vienna, Austria
Abstract
Background: It was the aim of the present systematic review and meta-analysis to investigate the effects of high protein(HP) versus normal/low protein (LP/NP) diets on parameters of renal function in subjects without chronic kidney disease.
Methods: Queries of literature were performed using the electronic databases MEDLINE, EMBASE, and the Cochrane TrialRegister until 27th February 2014. Study specific weighted mean differences (MD) were pooled using a random effect modelby the Cochrane software package Review Manager 5.1.
Findings: 30 studies including 2160 subjects met the objectives and were included in the meta-analyses. HP regimensresulted in a significantly more pronounced increase in glomerular filtration rate [MD: 7.18 ml/min/1.73 m2, 95% CI 4.45 to9.91, p,0.001], serum urea [MD: 1.75 mmol/l, 95% CI 1.13 to 237, p,0.001], and urinary calcium excretion [MD: 25.43 mg/24h, 95% CI 13.62 to 37.24, p,0.001] when compared to the respective LP/NP protocol.
Conclusion: HP diets were associated with increased GFR, serum urea, urinary calcium excretion, and serum concentrationsof uric acid. In the light of the high risk of kidney disease among obese, weight reduction programs recommending HP dietsespecially from animal sources should be handled with caution.
Citation: Schwingshackl L, Hoffmann G (2014) Comparison of High vs. Normal/Low Protein Diets on Renal Function in Subjects without Chronic Kidney Disease:A Systematic Review and Meta-Analysis. PLoS ONE 9(5): e97656. doi:10.1371/journal.pone.0097656
Editor: Jeff M. Sands, Emory University, United States of America
Received March 12, 2014; Accepted April 22, 2014; Published May 22, 2014
Copyright: � 2014 Schwingshackl, Hoffmann. This is an open-access article distributed under the terms of the Creative Commons Attribution License, whichpermits unrestricted use, distribution, and reproduction in any medium, provided the original author and source are credited.
Data Availability: The authors confirm that all data underlying the findings are fully available without restriction. All data are included within the manuscriptand Supporting Information files..
Funding: The authors have no support or funding to report.
Competing Interests: The authors have declared that no competing interests exist.
* E-mail: [email protected]
Introduction
In face of the worldwide increase in prevalence of obesity, a
large number of dietary measures aiming at weight reduction of
weight management have been described. These diets differ
mainly with respect to macronutrient composition, and among
them, a high protein (HP) regimen has gained interest in recent
years. However, there is inconsistent data regarding the potential
beneficial or detrimental effects of HP diets on parameters of
obesity as well as its associated risks. While HP protocols were
reported to be advantageous when compared to their low/normal
protein counterparts in short-term trials [1], no such benefits on
outcome markers of obesity, cardiovascular disease or glycemic
control could be reported in a recent meta-analysis investigating
long-term interventions [2]. In 2002, the Institute of Medicine
published an acceptable macronutrient distribution range
(AMDR) for protein of 5–35% of daily calories (depending on
age), with a special emphasis that there is insufficient data on the
long-term safety of the upper limit of this range [3]. A major
concern in relation to potential deleterious effects of HP diets is the
increased risk of renal dysfunction [4,5]. High protein intake is
regarded to be a trigger of renal hyperfiltration and may therefore
cause renal damage [6]. In animal and human studies, HP
consumption has been found to accelerate chronic kidney disease
(CKD), raise albuminuria and diuresis, natriuresis, and kaliuresis
[7]. Epidemiological data from the Nurses’ Health study showed
that high intake of non-dairy animal protein may accelerate renal
dysfunction in women with an already established mild renal
insufficiency (glomerular filtration rate (GFR) ,80 ml/min/
1.73 m2), while HP intake was not associated with a decline in
regular renal function in women (initial GFR values . 80 ml/
min/1.73 m2) [8]. In a long-term study in pigs, an HP diets (35%
of total energy consumption, TEC) resulted in enlarged kidneys
accompanied by histological damage as well as renal and
glomerular volumes being 60–70% higher when compared to
control animals (protein intake = 15% of TEC) [9]. Moreover, risk
of kidney stone formation due to high urinary calcium excretion
was increased in healthy subjects following an HP dietary protocol
for 6 weeks [10]. In contrast to these findings, a 2-year trial in non-
diabetic obese individuals reported that an HP diet was not
associated with harmful effects on GFR, urinary albumin
excretion, or fluid and electrolyte balance compared with a NP
diet [11]. However, evidence indicates that obesity itself may
accelerate the progression of CKD, induced by pathophysiological
PLOS ONE | www.plosone.org 1 May 2014 | Volume 9 | Issue 5 | e97656
mechanism such glomerular hyperfiltration/hypertrophy caused
by the raised metabolic needs of the obese individual [12]. In
addition, due to the National Health and Nutrition Examination
Survey III (NHANES) data, approximately 30% of the US
population feature characteristics of reduced kidney function
(GFR = 60–89 ml/min/1.73 m2) increasing with age . 40 years
[13]. Regarding the increased prevalence of overweight and
obesity in this age group, HP diets might thus not represent a
reasonable tool in weight management programs even for subjects
without an established kidney dysfunction. Therefore, it was the
aim of the present systematic review to examine the effects of HP
versus LP/NP diets on parameters of renal function in adult
subjects. To the best of our knowledge, this is the first meta-
analysis performed to investigate the effects of HP diets on
outcomes of renal function in subjects without CKD (GFR $
60 ml/min/1.73 m2).
Methods
Data Sources and SearchesQueries of literature were performed using the electronic
databases MEDLINE (until 27th February 2014), EMBASE (until
27th February 2014), and the Cochrane Trial Register (until 27th
February 2014) with restrictions to randomized controlled trials,
but no restrictions to language and calendar date using the
following search term: ("protein") AND ("renal" OR "kidney" OR
"glomerular filtration" OR "creatinine" OR "urea" OR "albumin" OR
"calcium"). Moreover, the reference lists from retrieved articles
were checked to search for further relevant studies. This systematic
review was planned, conducted, and reported in adherence to
standards of quality for reporting meta-analyses [14]. Literature
search was conducted independently by both authors, with
disagreements resolved by consensus.
Study SelectionStudies were included in the meta-analysis if they met all of the
following criteria: (i) randomized controlled or cross-over design;
(ii) minimum intervention period of 1 week; (iii) comparing a HP
dietary intervention with a NP/LP intervention (using a 5%
difference in total energy intake, as defined previously by Santesso
et al. 2012 [1]) that were designed for weight loss or not; (iv) age:
$ 18 years; (v) sample size: healthy, overweight, obese, type 2
diabetes (T2D); (vi) assessment of the ‘‘outcome of interest’’
markers: GFR, serum creatinine, serum urea, urinary calcium
excretion, urinary albumin excretion, serum uric acid, urinary pH;
(vii) report of post-intervention mean values (if not available,
change from baseline values were used) with standard deviation (or
basic data to calculate these parameters: standard error, 95%
confidence interval, p-values). If data of ongoing studies were
published as updates, results of only the longest duration periods
were included. Studies enrolling subjects with CKD (GFR ,
60 ml/min/1.73 m2), type 1 diabetes, and macroalbuminuria
were excluded. Trials were included if subjects had microalbu-
minuria, since data from the NHANES III indicated that 12% of
the included population suffered from microalbminuria, whereas
only 1.5% had macroalbuminuria [15].
Data Extraction and Quality AssessmentThe risk of bias assessment tool by the Cochrane Collaboration
was applied specifying the following bias domains: selection bias
(random sequence generation, allocation concealment), perfor-
mance/detection bias (blinding of participants and personnel/
blinding of outcome assessment), attrition bias (incomplete data
outcome), and reporting bias (selective reporting) [16] (Figure S1).
The following data were extracted from each study: the first
author’s last name, year of publication, study length, gender
distribution and age, BMI, % diabetics, sample size, protein intake
(% of total energy content, TEC or g * kg body weight21 * d21),
protein origin, calcium intake, energy content of HP and NP/LP
diets, outcomes and post mean values or differences in mean of
two time point values with corresponding standard deviation.
Data Synthesis and AnalysisFor each outcome measure of interest, a meta-analysis was
performed in order to determine the pooled effect of the
intervention in terms of weighted mean differences (MDs) between
the post-intervention (or change from baseline) values of the HP
and NP/LP groups. Combining both the post-intervention values
and difference in means in one meta-analysis is an accepted
method described by the Cochrane Collaboration [17]. All data
were analyzed using the REVIEW MANAGER software provided
by the Cochrane Collaboration (http://ims.cochrane.org/
revman). The random-effects model was used to estimate MDs
with 95% confidence intervals (CIs). Forest plots were generated to
illustrate the study-specific effect sizes along with a 95% CI.
Heterogeneity between trial results was tested with a standard x2
test. The I2 parameter was used to quantify any inconsistency:
I2 = [(Q – d.f.)]/Q6100%, where Q is the x2 statistic and d.f. is its
degrees of freedom. A value for I2 greater than $ 75% was
considered to indicate considerable heterogeneity [18]. Funnel
plots were sketched to indicate potential publication bias (e.g. the
tendency for studies yielding statistically significant results to be
more likely to be submitted and accepted for publication). To
evaluate substantial heterogeneity, several post hoc univariate
random-effects meta-regressions were performed to examine the
association between age, BMI, study length, and % protein intake
as independent variables, and changes in GFR, creatinine, urea,
and pH (were substantial heterogeneity could be detected) as
depending variables, respectively. The p-values for differences in
effects between the covariates were obtained using the metareg
command of Stata 12.0 (Stata-Corp, College Station, TX. USA).
Two sided p-values ,0.05 were considered to be statistically
significant. To determine the presence of publication bias, the
symmetry of the funnel plots in which mean differences were
plotted against their corresponding standard errors were assessed.
Results
Literature SearchA total of 30 trials (32 reports) extracted from 15734 articles met
the inclusion criteria and were analyzed in the systematic review
(References S1). The detailed steps of the meta-analysis article
selection process are given as a flow chart in Figure S2. Although
in accordance with the overall inclusion criteria, one trial was
excluded due to inconsistencies in the mean GFR (#60 ml/min/
1.73 m2 in 45% of the study population), which was considered to
increase the potential for selection bias (Figure S1) [19].
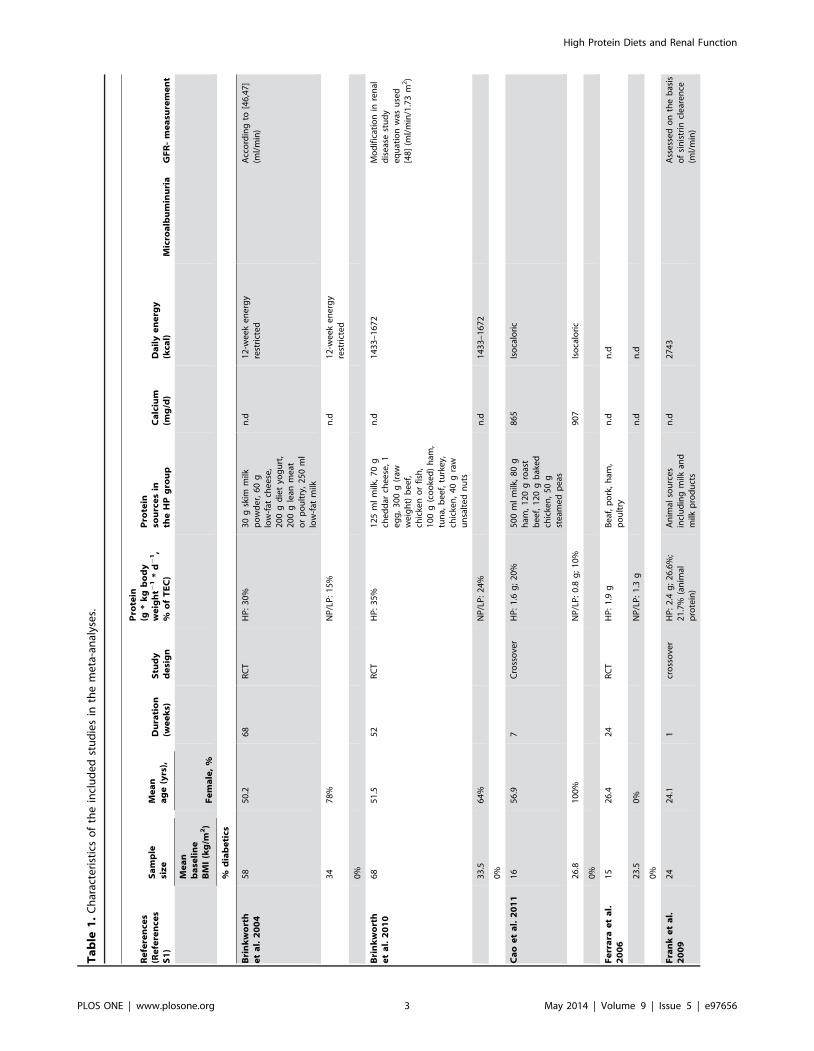
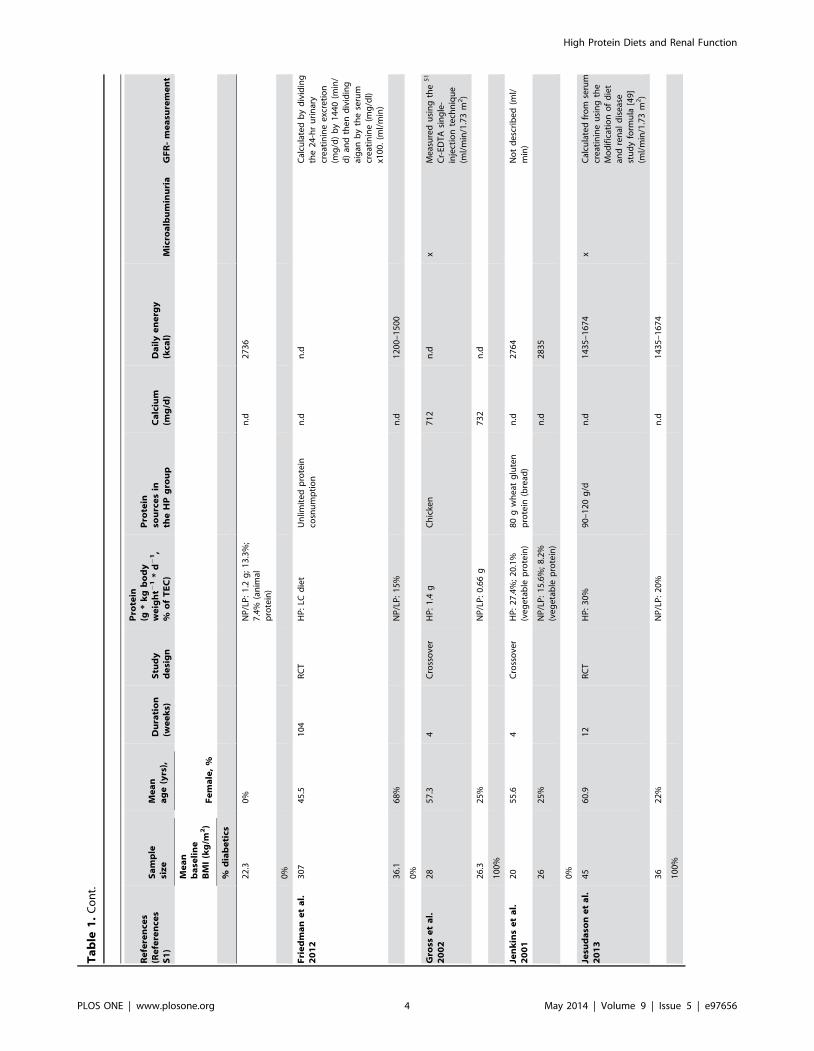
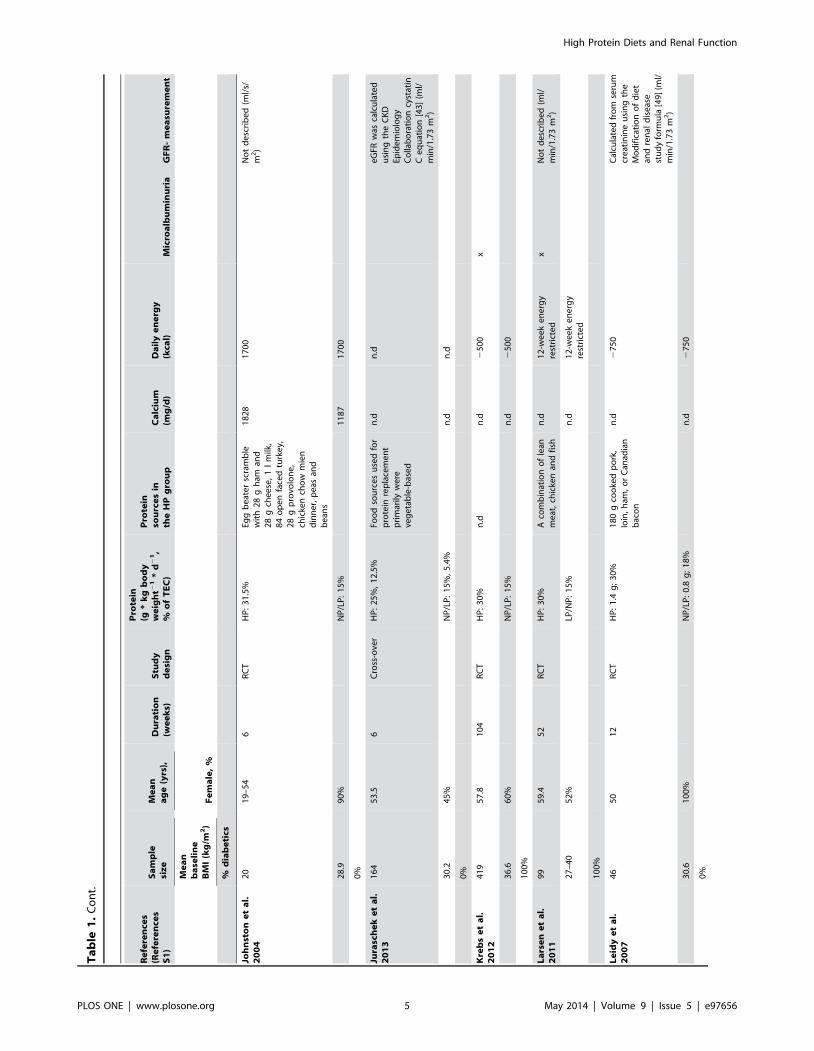
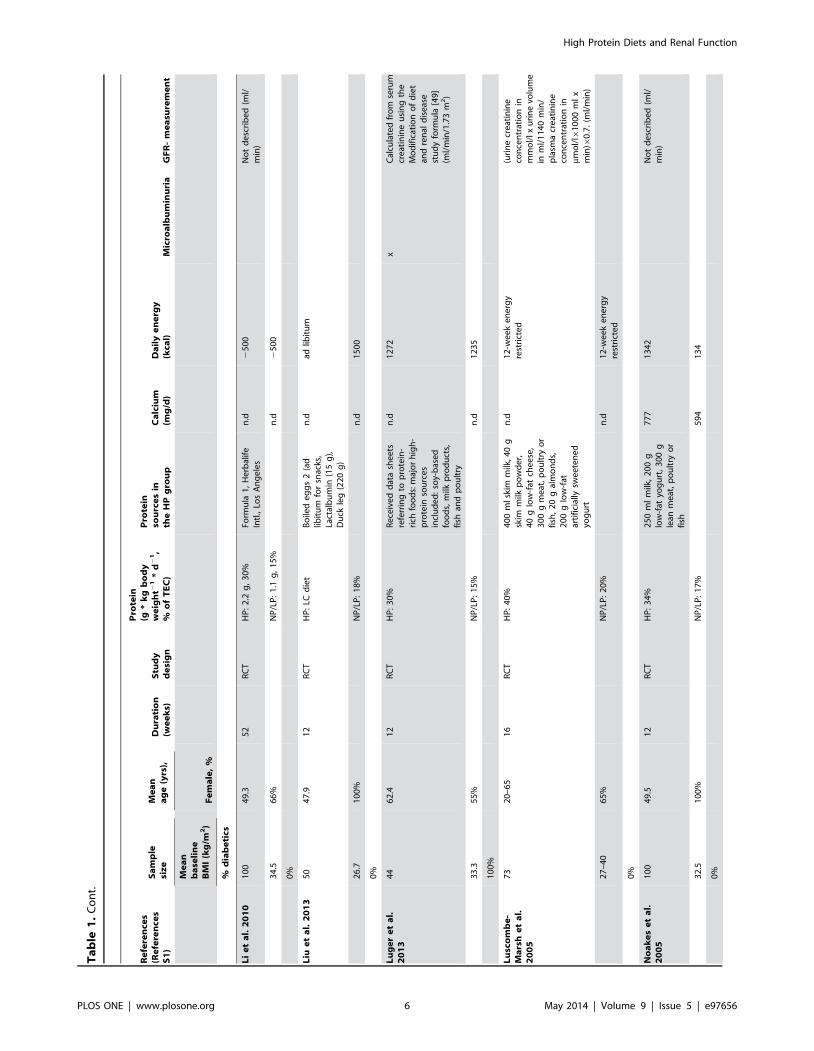
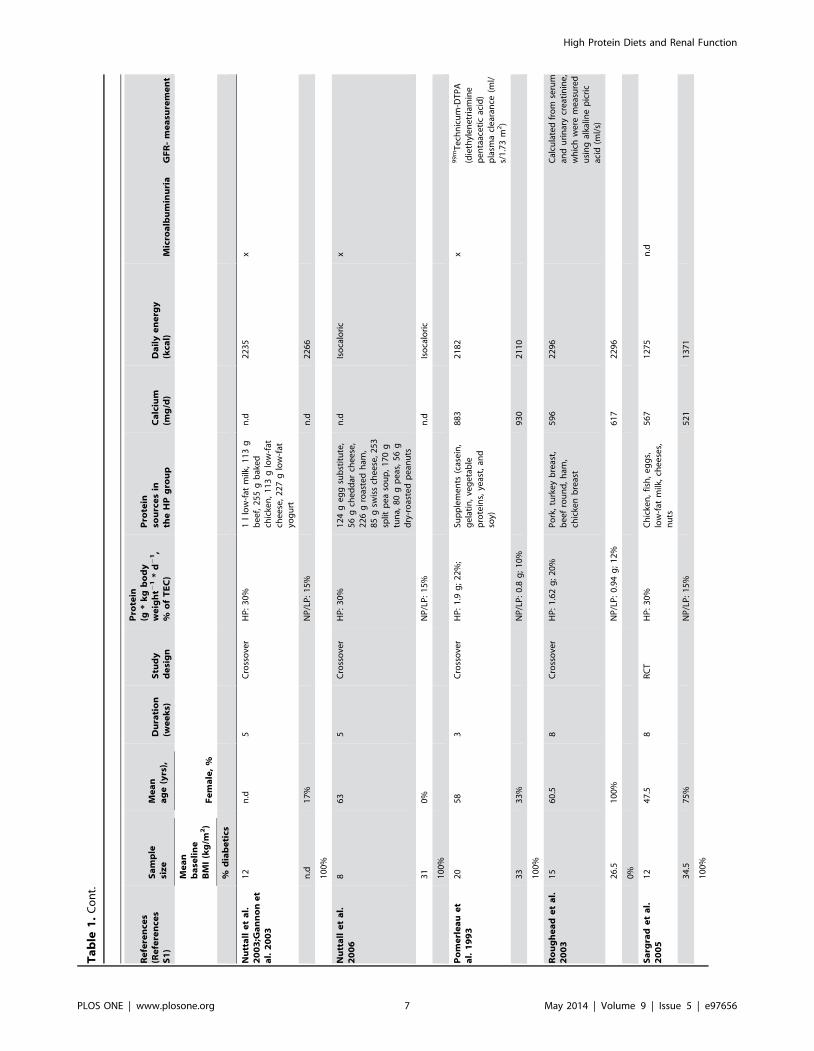
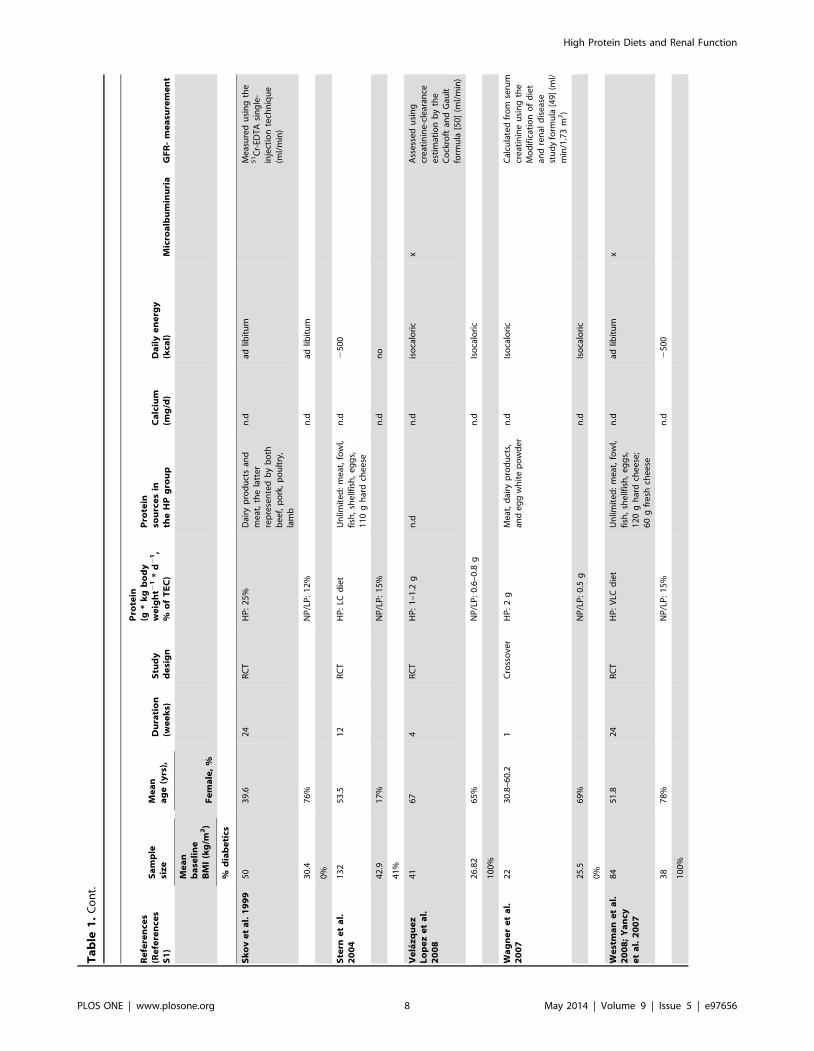
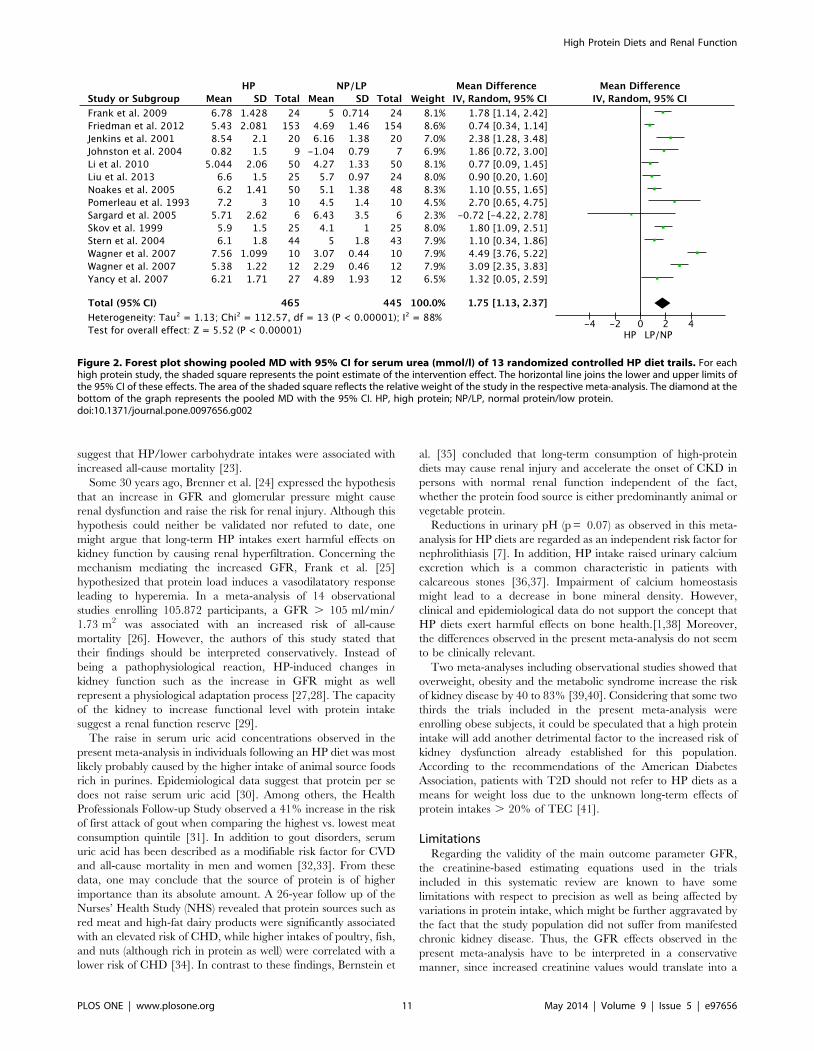
Characteristics of Studies and ParticipantsAll studies included in this systematic review were RCTs with a
duration ranging between 1 week and 24 months, published
between 1993 and 2013, and enrolling a total of 2160 participants.
All studies compared a HP diet to a NP/LP regimen. The mean
age of participants varied between 22.3 and 67 years. Protein
intakes in the HP groups were mostly of animal origin except for
one trial, where wheat gluten protein was used [20]. General study
characteristics are given in Table 1.
High Protein Diets and Renal Function
PLOS ONE | www.plosone.org 2 May 2014 | Volume 9 | Issue 5 | e97656
Ta
ble
1.
Ch
arac
teri
stic
so
fth
ein
clu
de
dst
ud
ies
inth
em
eta
-an
alys
es.
Re
fere
nce
s(R
efe
ren
ces
S1
)
Sa
mp
lesi
ze
Me
an
ag
e(y
rs),
Du
rati
on
(we
ek
s)S
tud
yd
esi
gn
Pro
tein
(g*
kg
bo
dy
we
igh
t21
*d
21
,%
of
TE
C)
Pro
tein
sou
rce
sin
the
HP
gro
up
Ca
lciu
m(m
g/d
)D
ail
ye
ne
rgy
(kca
l)M
icro
alb
um
inu
ria
GF
R-
me
asu
rem
en
t
Me
an
ba
seli
ne
BM
I(k
g/m
2)
Fe
ma
le,
%
%d
iab
eti
cs
Bri
nk
wo
rth
et
al.
20
04
58
50
.26
8R
CT
HP
:3
0%
30
gsk
imm
ilkp
ow
de
r,6
0g
low
-fat
che
ese
,2
00
gd
iet
yog
urt
,2
00
gle
anm
eat
or
po
ult
ry,
25
0m
llo
w-f
atm
ilk
n.d
12
-we
ek
en
erg
yre
stri
cte
dA
cco
rdin
gto
[46
,47
](m
l/m
in)
34
78
%N
P/L
P:
15
%n
.d1
2-w
ee
ke
ne
rgy
rest
rict
ed
0%
Bri
nk
wo
rth
et
al.
20
10
68
51
.55
2R
CT
HP
:3
5%
12
5m
lm
ilk,
70
gch
ed
dar
che
ese
,1
eg
g,
30
0g
(raw
we
igh
t)b
ee
f,ch
icke
no
rfi
sh,
10
0g
(co
oke
d)
ham
,tu
na,
be
ef,
turk
ey,
chic
ken
,4
0g
raw
un
salt
ed
nu
ts
n.d
14
33
–1
67
2M
od
ific
atio
nin
ren
ald
ise
ase
stu
dy
eq
uat
ion
was
use
d[4
8]
(ml/
min
/1.7
3m
2)
33
.56
4%
NP
/LP
:2
4%
n.d
14
33
–1
67
2
0%
Ca
oe
ta
l.2
01
11
65
6.9
7C
ross
ove
rH
P:
1.6
g;
20
%5
00
ml
milk
,8
0g
ham
,1
20
gro
ast
be
ef,
12
0g
bak
ed
chic
ken
,5
0g
ste
ame
dp
eas
86
5Is
oca
lori
c
26
.81
00
%N
P/L
P:
0.8
g;
10
%9
07
Iso
calo
ric
0%
Fe
rra
rae
ta
l.2
00
61
52
6.4
24
RC
TH
P:
1.9
gB
eaf
,p
ork
,h
am,
po
ult
ryn
.dn
.d
23
.50
%N
P/L
P:
1.3
gn
.dn
.d
0%
Fra
nk
et
al.
20
09
24
24
.11
cro
sso
ver
HP
:2
.4g
;2
6.6
%;
21
.7%
(an
imal
pro
tein
)
An
imal
sou
rce
sin
clu
din
gm
ilkan
dm
ilkp
rod
uct
s
n.d
27
43
Ass
ess
ed
on
the
bas
iso
fsi
nis
trin
cle
are
nce
(ml/
min
)
High Protein Diets and Renal Function
PLOS ONE | www.plosone.org 3 May 2014 | Volume 9 | Issue 5 | e97656
Ta
ble
1.
Co
nt.
Re
fere
nce
s(R
efe
ren
ces
S1
)
Sa
mp
lesi
ze
Me
an
ag
e(y
rs),
Du
rati
on
(we
ek
s)S
tud
yd
esi
gn
Pro
tein
(g*
kg
bo
dy
we
igh
t21
*d
21
,%
of
TE
C)
Pro
tein
sou
rce
sin
the
HP
gro
up
Ca
lciu
m(m
g/d
)D
ail
ye
ne
rgy
(kca
l)M
icro
alb
um
inu
ria
GF
R-
me
asu
rem
en
t
Me
an
ba
seli
ne
BM
I(k
g/m
2)
Fe
ma
le,
%
%d
iab
eti
cs
22
.30
%N
P/L
P:
1.2
g;
13
.3%
;7
.4%
(an
imal
pro
tein
)
n.d
27
36
0%
Fri
ed
ma
ne
ta
l.2
01
23
07
45
.51
04
RC
TH
P:
LCd
iet
Un
limit
ed
pro
tein
cosn
um
pti
on
n.d
n.d
Cal
cula
ted
by
div
idin
gth
e2
4-h
ru
rin
ary
cre
atin
ine
exc
reti
on
(mg
/d)
by
14
40
(min
/d
)an
dth
en
div
idin
gai
gan
by
the
seru
mcr
eat
inin
e(m
g/d
l)x1
00
.(m
l/m
in)
36
.16
8%
NP
/LP
:1
5%
n.d
12
00
–1
50
0
0%
Gro
sse
ta
l.2
00
22
85
7.3
4C
ross
ove
rH
P:
1.4
gC
hic
ken
71
2n
.dx
Me
asu
red
usi
ng
the
51
Cr-
EDT
Asi
ng
le-
inje
ctio
nte
chn
iqu
e(m
l/m
in/1
.73
m2)
26
.32
5%
NP
/LP
:0
.66
g7
32
n.d
10
0%
Jen
kin
se
ta
l.2
00
12
05
5.6
4C
ross
ove
rH
P:
27
.4%
;2
0.1
%(v
eg
eta
ble
pro
tein
)8
0g
wh
eat
glu
ten
pro
tein
(bre
ad)
n.d
27
64
No
td
esc
rib
ed
(ml/
min
)
26
25
%N
P/L
P:
15
.6%
;8
.2%
(ve
ge
tab
lep
rote
in)
n.d
28
35
0%
Jesu
da
son
et
al.
20
13
45
60
.91
2R
CT
HP
:3
0%
90
–1
20
g/d
n.d
14
35
–1
67
4x
Cal
cula
ted
fro
mse
rum
cre
atin
ine
usi
ng
the
Mo
dif
icat
ion
of
die
tan
dre
nal
dis
eas
est
ud
yfo
rmu
la[4
9]
(ml/
min
/1.7
3m
2)
36
22
%N
P/L
P:
20
%n
.d1
43
5–
16
74
10
0%
High Protein Diets and Renal Function
PLOS ONE | www.plosone.org 4 May 2014 | Volume 9 | Issue 5 | e97656
Ta
ble
1.
Co
nt.
Re
fere
nce
s(R
efe
ren
ces
S1
)
Sa
mp
lesi
ze
Me
an
ag
e(y
rs),
Du
rati
on
(we
ek
s)S
tud
yd
esi
gn
Pro
tein
(g*
kg
bo
dy
we
igh
t21
*d
21
,%
of
TE
C)
Pro
tein
sou
rce
sin
the
HP
gro
up
Ca
lciu
m(m
g/d
)D
ail
ye
ne
rgy
(kca
l)M
icro
alb
um
inu
ria
GF
R-
me
asu
rem
en
t
Me
an
ba
seli
ne
BM
I(k
g/m
2)
Fe
ma
le,
%
%d
iab
eti
cs
Joh
nst
on
et
al.
20
04
20
19
–5
46
RC
TH
P:
31
.5%
Egg
be
ate
rsc
ram
ble
wit
h2
8g
ham
and
28
gch
ee
se,
1l
milk
,8
4o
pe
nfa
ced
turk
ey,
28
gp
rovo
lon
e,
chic
ken
cho
wm
ien
din
ne
r,p
eas
and
be
ans
18
28
17
00
No
td
esc
rib
ed
(ml/
s/m
2)
28
.99
0%
NP
/LP
:1
5%
11
87
17
00
0%
Jura
sch
ek
et
al.
20
13
16
45
3.5
6C
ross
-ove
rH
P:
25
%,
12
.5%
Foo
dso
urc
es
use
dfo
rp
rote
inre
pla
cem
en
tp
rim
arily
we
reve
ge
tab
le-b
ase
d
n.d
n.d
eG
FRw
asca
lcu
late
du
sin
gth
eC
KD
Epid
em
iolo
gy
Co
llab
ora
tio
ncy
stat
inC
eq
uat
ion
[43
](m
l/m
in/1
.73
m2)
30
.24
5%
NP
/LP
:1
5%
,5
.4%
n.d
n.d
0%
Kre
bs
et
al.
20
12
41
95
7.8
10
4R
CT
HP
:3
0%
n.d
n.d
25
00
x
36
.66
0%
NP
/LP
:1
5%
n.d
25
00
10
0%
La
rse
ne
ta
l.2
01
19
95
9.4
52
RC
TH
P:
30
%A
com
bin
atio
no
fle
anm
eat
,ch
icke
nan
dfi
shn
.d1
2-w
ee
ke
ne
rgy
rest
rict
ed
xN
ot
de
scri
be
d(m
l/m
in/1
.73
m2)
27
–4
05
2%
LP/N
P:
15
%n
.d1
2-w
ee
ke
ne
rgy
rest
rict
ed
10
0%
Le
idy
et
al.
20
07
46
50
12
RC
TH
P:
1.4
g;
30
%1
80
gco
oke
dp
ork
,lo
in,
ham
,o
rC
anad
ian
bac
on
n.d
27
50
Cal
cula
ted
fro
mse
rum
cre
atin
ine
usi
ng
the
Mo
dif
icat
ion
of
die
tan
dre
nal
dis
eas
est
ud
yfo
rmu
la[4
9]
(ml/
min
/1.7
3m
2)
30
.61
00
%N
P/L
P:
0.8
g;
18
%n
.d2
75
0
0%
High Protein Diets and Renal Function
PLOS ONE | www.plosone.org 5 May 2014 | Volume 9 | Issue 5 | e97656
Ta
ble
1.
Co
nt.
Re
fere
nce
s(R
efe
ren
ces
S1
)
Sa
mp
lesi
ze
Me
an
ag
e(y
rs),
Du
rati
on
(we
ek
s)S
tud
yd
esi
gn
Pro
tein
(g*
kg
bo
dy
we
igh
t21
*d
21
,%
of
TE
C)
Pro
tein
sou
rce
sin
the
HP
gro
up
Ca
lciu
m(m
g/d
)D
ail
ye
ne
rgy
(kca
l)M
icro
alb
um
inu
ria
GF
R-
me
asu
rem
en
t
Me
an
ba
seli
ne
BM
I(k
g/m
2)
Fe
ma
le,
%
%d
iab
eti
cs
Li
et
al.
20
10
10
04
9.3
52
RC
TH
P:
2.2
g,
30
%Fo
rmu
la1
,H
erb
alif
eIn
tl.,
Los
An
ge
les
n.d
25
00
No
td
esc
rib
ed
(ml/
min
)
34
.56
6%
NP
/LP
:1
.1g
,1
5%
n.d
25
00
0%
Liu
et
al.
20
13
50
47
.91
2R
CT
HP
:LC
die
tB
oile
de
gg
s2
(ad
libit
um
for
snac
ks,
Lact
alb
um
in(1
5g
),D
uck
leg
(22
0g
)
n.d
adlib
itu
m
26
.71
00
%N
P/L
P:
18
%n
.d1
50
0
0%
Lu
ge
re
ta
l.2
01
34
46
2.4
12
RC
TH
P:
30
%R
ece
ive
dd
ata
she
ets
refe
rrin
gto
pro
tein
-ri
chfo
od
s:m
ajo
rh
igh
-p
rote
inso
urc
es
incl
ud
ed
:so
y-b
ase
dfo
od
s,m
ilkp
rod
uct
s,fi
shan
dp
ou
ltry
n.d
12
72
xC
alcu
late
dfr
om
seru
mcr
eat
inin
eu
sin
gth
eM
od
ific
atio
no
fd
iet
and
ren
ald
ise
ase
stu
dy
form
ula
[49
](m
l/m
in/1
.73
m2)
33
.35
5%
NP
/LP
:1
5%
n.d
12
35
10
0%
Lu
sco
mb
e-
Ma
rsh
et
al.
20
05
73
20
–6
51
6R
CT
HP
:4
0%
40
0m
lsk
imm
ilk,4
0g
skim
milk
po
wd
er,
40
glo
w-f
atch
ee
se,
30
0g
me
at,
po
ult
ryo
rfi
sh,
20
gal
mo
nd
s,2
00
glo
w-f
atar
tifi
cial
lysw
ee
ten
ed
yog
urt
n.d
12
-we
ek
en
erg
yre
stri
cte
d(u
rin
ecr
eat
inin
eco
nce
ntr
atio
nin
mm
ol/
lxu
rin
evo
lum
ein
ml/
11
40
min
/p
lasm
acr
eat
inin
eco
nce
ntr
atio
nin
mmo
l/l6
10
00
ml
xm
in)6
0.7
.(m
l/m
in)
27
–4
06
5%
NP
/LP
:2
0%
n.d
12
-we
ek
en
erg
yre
stri
cte
d
0%
No
ak
es
et
al.
20
05
10
04
9.5
12
RC
TH
P:
34
%2
50
ml
milk
,2
00
glo
w-f
atyo
gu
rt,
30
0g
lean
me
at,
po
ult
ryo
rfi
sh
77
71
34
2N
ot
de
scri
be
d(m
l/m
in)
32
.51
00
%N
P/L
P:
17
%5
94
13
4
0%
High Protein Diets and Renal Function
PLOS ONE | www.plosone.org 6 May 2014 | Volume 9 | Issue 5 | e97656
Ta
ble
1.
Co
nt.
Re
fere
nce
s(R
efe
ren
ces
S1
)
Sa
mp
lesi
ze
Me
an
ag
e(y
rs),
Du
rati
on
(we
ek
s)S
tud
yd
esi
gn
Pro
tein
(g*
kg
bo
dy
we
igh
t21
*d
21
,%
of
TE
C)
Pro
tein
sou
rce
sin
the
HP
gro
up
Ca
lciu
m(m
g/d
)D
ail
ye
ne
rgy
(kca
l)M
icro
alb
um
inu
ria
GF
R-
me
asu
rem
en
t
Me
an
ba
seli
ne
BM
I(k
g/m
2)
Fe
ma
le,
%
%d
iab
eti
cs
Nu
tta
lle
ta
l.2
00
3;G
an
no
ne
ta
l.2
00
3
12
n.d
5C
ross
ove
rH
P:
30
%1
llo
w-f
atm
ilk,
11
3g
be
ef,
25
5g
bak
ed
chic
ken
,1
13
glo
w-f
atch
ee
se,
22
7g
low
-fat
yog
urt
n.d
22
35
x
n.d
17
%N
P/L
P:
15
%n
.d2
26
6
10
0%
Nu
tta
lle
ta
l.2
00
68
63
5C
ross
ove
rH
P:
30
%1
24
ge
gg
sub
stit
ute
,5
6g
che
dd
arch
ee
se,
22
6g
roas
ted
ham
,8
5g
swis
sch
ee
se,
25
3sp
litp
ea
sou
p,
17
0g
tun
a,8
0g
pe
as,
56
gd
ry-r
oas
ted
pe
anu
ts
n.d
Iso
calo
ric
x
31
0%
NP
/LP
:1
5%
n.d
Iso
calo
ric
10
0%
Po
me
rle
au
et
al.
19
93
20
58
3C
ross
ove
rH
P:
1.9
g;
22
%;
Sup
ple
me
nts
(cas
ein
,g
ela
tin
,ve
ge
tab
lep
rote
ins,
yeas
t,an
dso
y)
88
32
18
2x
99
mT
ech
nic
um
-DT
PA
(die
thyl
en
etr
iam
ine
pe
nta
ace
tic
acid
)p
lasm
acl
ear
ance
(ml/
s/1
.73
m2)
33
33
%N
P/L
P:
0.8
g;
10
%9
30
21
10
10
0%
Ro
ug
he
ad
et
al.
20
03
15
60
.58
Cro
sso
ver
HP
:1
.62
g;
20
%P
ork
,tu
rke
yb
reas
t,b
ee
fro
un
d,
ham
,ch
icke
nb
reas
t
59
62
29
6C
alcu
late
dfr
om
seru
man
du
rin
ary
cre
atin
ine
,w
hic
hw
ere
me
asu
red
usi
ng
alka
line
pic
ric
acid
(ml/
s)
26
.51
00
%N
P/L
P:
0.9
4g
;1
2%
61
72
29
6
0%
Sa
rgra
de
ta
l.2
00
51
24
7.5
8R
CT
HP
:3
0%
Ch
icke
n,
fish
,e
gg
s,lo
w-f
atm
ilk,
che
ese
s,n
uts
56
71
27
5n
.d
34
.57
5%
NP
/LP
:1
5%
52
11
37
1
10
0%
High Protein Diets and Renal Function
PLOS ONE | www.plosone.org 7 May 2014 | Volume 9 | Issue 5 | e97656
Ta
ble
1.
Co
nt.
Re
fere
nce
s(R
efe
ren
ces
S1
)
Sa
mp
lesi
ze
Me
an
ag
e(y
rs),
Du
rati
on
(we
ek
s)S
tud
yd
esi
gn
Pro
tein
(g*
kg
bo
dy
we
igh
t21
*d
21
,%
of
TE
C)
Pro
tein
sou
rce
sin
the
HP
gro
up
Ca
lciu
m(m
g/d
)D
ail
ye
ne
rgy
(kca
l)M
icro
alb
um
inu
ria
GF
R-
me
asu
rem
en
t
Me
an
ba
seli
ne
BM
I(k
g/m
2)
Fe
ma
le,
%
%d
iab
eti
cs
Sk
ov
et
al.
19
99
50
39
.62
4R
CT
HP
:2
5%
Dai
ryp
rod
uct
san
dm
eat
,th
ela
tte
rre
pre
sen
ted
by
bo
thb
ee
f,p
ork
,p
ou
ltry
,la
mb
n.d
adlib
itu
mM
eas
ure
du
sin
gth
e5
1C
r-ED
TA
sin
gle
-in
ject
ion
tech
niq
ue
(ml/
min
)
30
.47
6%
NP
/LP
:1
2%
n.d
adlib
itu
m
0%
Ste
rne
ta
l.2
00
41
32
53
.51
2R
CT
HP
:LC
die
tU
nlim
ite
d:
me
at,
fow
l,fi
sh,
she
llfis
h,
eg
gs,
11
0g
har
dch
ee
se
n.d
25
00
42
.91
7%
NP
/LP
:1
5%
n.d
no
41
%
Ve
laz
qu
ez
Lo
pe
ze
ta
l.2
00
8
41
67
4R
CT
HP
:1
–1
.2g
n.d
n.d
iso
calo
ric
xA
sse
sse
du
sin
gcr
eat
inin
e-c
lear
ance
est
imat
ion
by
the
Co
ckro
ftan
dG
ault
form
ula
[50
](m
l/m
in)
26
.82
65
%N
P/L
P:
0.6
–0
.8g
n.d
Iso
calo
ric
10
0%
Wa
gn
er
et
al.
20
07
22
30
.8–
60
.21
Cro
sso
ver
HP
:2
gM
eat
,d
airy
pro
du
cts,
and
eg
gw
hit
ep
ow
de
rn
.dIs
oca
lori
cC
alcu
late
dfr
om
seru
mcr
eat
inin
eu
sin
gth
eM
od
ific
atio
no
fd
iet
and
ren
ald
ise
ase
stu
dy
form
ula
[49
](m
l/m
in/1
.73
m2)
25
.56
9%
NP
/LP
:0
.5g
n.d
Iso
calo
ric
0%
We
stm
an
et
al.
20
08
;Y
an
cye
ta
l.2
00
7
84
51
.82
4R
CT
HP
:V
LCd
iet
Un
limit
ed
:m
eat
,fo
wl,
fish
,sh
ellf
ish
,e
gg
s,1
20
gh
ard
che
ese
;6
0g
fre
shch
ee
se
n.d
adlib
itu
mx
38
78
%N
P/L
P:
15
%n
.d2
50
0
10
0%
High Protein Diets and Renal Function
PLOS ONE | www.plosone.org 8 May 2014 | Volume 9 | Issue 5 | e97656
OutcomesThe pooled estimates of effect size for the effects of HP as
compared to NP/LP on outcomes of kidney function are
summarized in Table 2. Changes in serum creatinine (Figure
S3), urinary albumin excretion (Figure S5), uric acid (Figure S4),
and urinary pH (Figure S7) were not significantly different
following HP diets as compared to NP/LP diets and are given
as Supplementary material.
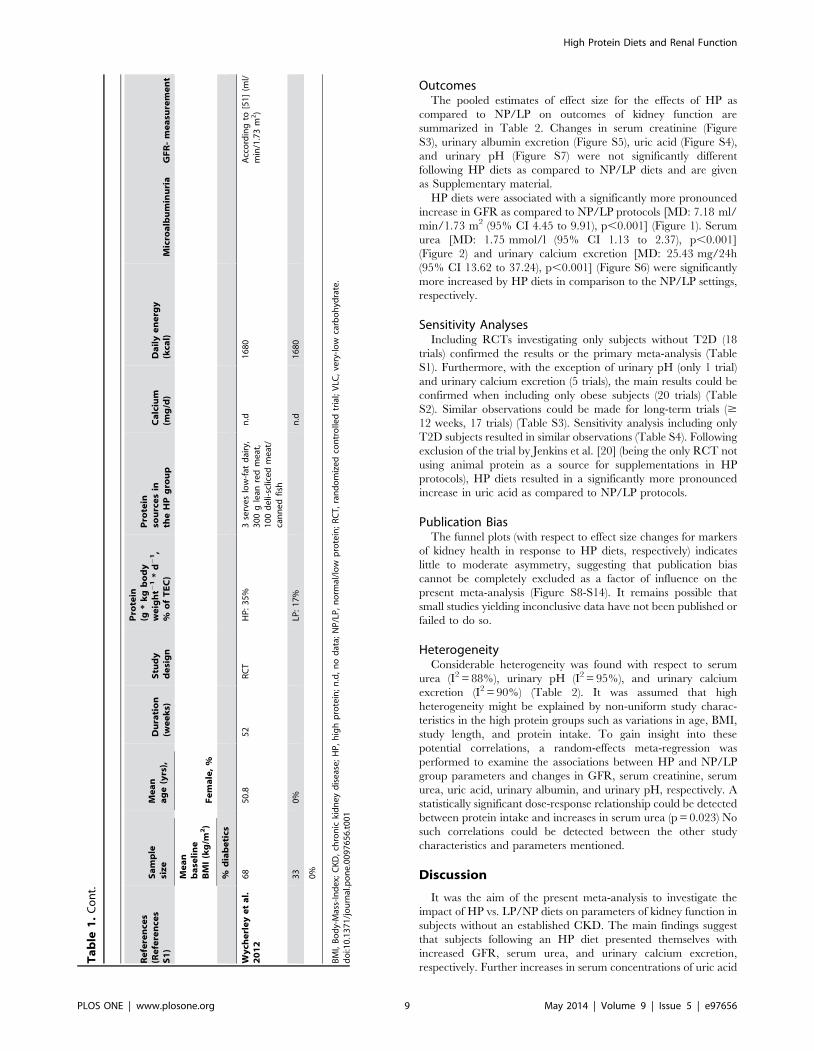
HP diets were associated with a significantly more pronounced
increase in GFR as compared to NP/LP protocols [MD: 7.18 ml/
min/1.73 m2 (95% CI 4.45 to 9.91), p,0.001] (Figure 1). Serum
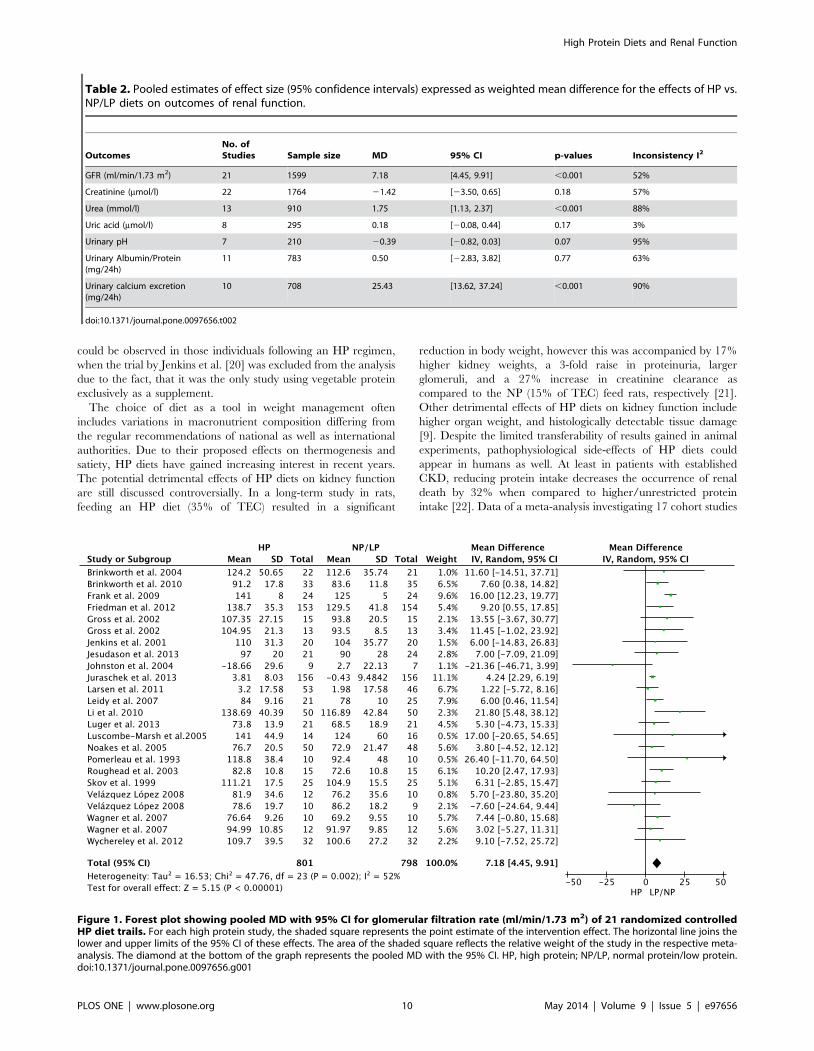
urea [MD: 1.75 mmol/l (95% CI 1.13 to 2.37), p,0.001]
(Figure 2) and urinary calcium excretion [MD: 25.43 mg/24h
(95% CI 13.62 to 37.24), p,0.001] (Figure S6) were significantly
more increased by HP diets in comparison to the NP/LP settings,
respectively.
Sensitivity AnalysesIncluding RCTs investigating only subjects without T2D (18
trials) confirmed the results or the primary meta-analysis (Table
S1). Furthermore, with the exception of urinary pH (only 1 trial)
and urinary calcium excretion (5 trials), the main results could be
confirmed when including only obese subjects (20 trials) (Table
S2). Similar observations could be made for long-term trials ($
12 weeks, 17 trials) (Table S3). Sensitivity analysis including only
T2D subjects resulted in similar observations (Table S4). Following
exclusion of the trial by Jenkins et al. [20] (being the only RCT not
using animal protein as a source for supplementations in HP
protocols), HP diets resulted in a significantly more pronounced
increase in uric acid as compared to NP/LP protocols.
Publication BiasThe funnel plots (with respect to effect size changes for markers
of kidney health in response to HP diets, respectively) indicates
little to moderate asymmetry, suggesting that publication bias
cannot be completely excluded as a factor of influence on the
present meta-analysis (Figure S8-S14). It remains possible that
small studies yielding inconclusive data have not been published or
failed to do so.
HeterogeneityConsiderable heterogeneity was found with respect to serum
urea (I2 = 88%), urinary pH (I2 = 95%), and urinary calcium
excretion (I2 = 90%) (Table 2). It was assumed that high
heterogeneity might be explained by non-uniform study charac-
teristics in the high protein groups such as variations in age, BMI,
study length, and protein intake. To gain insight into these
potential correlations, a random-effects meta-regression was
performed to examine the associations between HP and NP/LP
group parameters and changes in GFR, serum creatinine, serum
urea, uric acid, urinary albumin, and urinary pH, respectively. A
statistically significant dose-response relationship could be detected
between protein intake and increases in serum urea (p = 0.023) No
such correlations could be detected between the other study
characteristics and parameters mentioned.
Discussion
It was the aim of the present meta-analysis to investigate the
impact of HP vs. LP/NP diets on parameters of kidney function in
subjects without an established CKD. The main findings suggest
that subjects following an HP diet presented themselves with
increased GFR, serum urea, and urinary calcium excretion,
respectively. Further increases in serum concentrations of uric acid
Ta
ble
1.
Co
nt.
Re
fere
nce
s(R
efe
ren
ces
S1
)
Sa
mp
lesi
ze
Me
an
ag
e(y
rs),
Du
rati
on
(we
ek
s)S
tud
yd
esi
gn
Pro
tein
(g*
kg
bo
dy
we
igh
t21
*d
21
,%
of
TE
C)
Pro
tein
sou
rce
sin
the
HP
gro
up
Ca
lciu
m(m
g/d
)D
ail
ye
ne
rgy
(kca
l)M
icro
alb
um
inu
ria
GF
R-
me
asu
rem
en
t
Me
an
ba
seli
ne
BM
I(k
g/m
2)
Fe
ma
le,
%
%d
iab
eti
cs
Wy
che
rle
ye
ta
l.2
01
26
85
0.8
52
RC
TH
P:
35
%3
serv
es
low
-fat
dai
ry,
30
0g
lean
red
me
at,
10
0d
eli-
sclic
ed
me
at/
can
ne
dfi
sh
n.d
16
80
Acc
ord
ing
to[5
1]
(ml/
min
/1.7
3m
2)
33
0%
LP:
17
%n
.d1
68
0
0%
BM
I,B
od
y-M
ass-
Ind
ex;
CK
D,
chro
nic
kid
ne
yd
ise
ase
;H
P,
hig
hp
rote
in;
n.d
,n
od
ata;
NP
/LP
,n
orm
al/l
ow
pro
tein
;R
CT
,ra
nd
om
ize
dco
ntr
olle
dtr
ial;
VLC
,ve
ry-l
ow
carb
oh
ydra
te.
do
i:10
.13
71
/jo
urn
al.p
on
e.0
09
76
56
.t0
01
High Protein Diets and Renal Function
PLOS ONE | www.plosone.org 9 May 2014 | Volume 9 | Issue 5 | e97656
could be observed in those individuals following an HP regimen,
when the trial by Jenkins et al. [20] was excluded from the analysis
due to the fact, that it was the only study using vegetable protein
exclusively as a supplement.
The choice of diet as a tool in weight management often
includes variations in macronutrient composition differing from
the regular recommendations of national as well as international
authorities. Due to their proposed effects on thermogenesis and
satiety, HP diets have gained increasing interest in recent years.
The potential detrimental effects of HP diets on kidney function
are still discussed controversially. In a long-term study in rats,
feeding an HP diet (35% of TEC) resulted in a significant
reduction in body weight, however this was accompanied by 17%
higher kidney weights, a 3-fold raise in proteinuria, larger
glomeruli, and a 27% increase in creatinine clearance as
compared to the NP (15% of TEC) feed rats, respectively [21].
Other detrimental effects of HP diets on kidney function include
higher organ weight, and histologically detectable tissue damage
[9]. Despite the limited transferability of results gained in animal
experiments, pathophysiological side-effects of HP diets could
appear in humans as well. At least in patients with established
CKD, reducing protein intake decreases the occurrence of renal
death by 32% when compared to higher/unrestricted protein
intake [22]. Data of a meta-analysis investigating 17 cohort studies
Table 2. Pooled estimates of effect size (95% confidence intervals) expressed as weighted mean difference for the effects of HP vs.NP/LP diets on outcomes of renal function.
OutcomesNo. ofStudies Sample size MD 95% CI p-values Inconsistency I2
GFR (ml/min/1.73 m2) 21 1599 7.18 [4.45, 9.91] ,0.001 52%
Creatinine (mmol/l) 22 1764 21.42 [23.50, 0.65] 0.18 57%
Urea (mmol/l) 13 910 1.75 [1.13, 2.37] ,0.001 88%
Uric acid (mmol/l) 8 295 0.18 [20.08, 0.44] 0.17 3%
Urinary pH 7 210 20.39 [20.82, 0.03] 0.07 95%
Urinary Albumin/Protein(mg/24h)
11 783 0.50 [22.83, 3.82] 0.77 63%
Urinary calcium excretion(mg/24h)
10 708 25.43 [13.62, 37.24] ,0.001 90%
doi:10.1371/journal.pone.0097656.t002
Figure 1. Forest plot showing pooled MD with 95% CI for glomerular filtration rate (ml/min/1.73 m2) of 21 randomized controlledHP diet trails. For each high protein study, the shaded square represents the point estimate of the intervention effect. The horizontal line joins thelower and upper limits of the 95% CI of these effects. The area of the shaded square reflects the relative weight of the study in the respective meta-analysis. The diamond at the bottom of the graph represents the pooled MD with the 95% CI. HP, high protein; NP/LP, normal protein/low protein.doi:10.1371/journal.pone.0097656.g001
High Protein Diets and Renal Function
PLOS ONE | www.plosone.org 10 May 2014 | Volume 9 | Issue 5 | e97656
suggest that HP/lower carbohydrate intakes were associated with
increased all-cause mortality [23].
Some 30 years ago, Brenner et al. [24] expressed the hypothesis
that an increase in GFR and glomerular pressure might cause
renal dysfunction and raise the risk for renal injury. Although this
hypothesis could neither be validated nor refuted to date, one
might argue that long-term HP intakes exert harmful effects on
kidney function by causing renal hyperfiltration. Concerning the
mechanism mediating the increased GFR, Frank et al. [25]
hypothesized that protein load induces a vasodilatatory response
leading to hyperemia. In a meta-analysis of 14 observational
studies enrolling 105.872 participants, a GFR . 105 ml/min/
1.73 m2 was associated with an increased risk of all-cause
mortality [26]. However, the authors of this study stated that
their findings should be interpreted conservatively. Instead of
being a pathophysiological reaction, HP-induced changes in
kidney function such as the increase in GFR might as well
represent a physiological adaptation process [27,28]. The capacity
of the kidney to increase functional level with protein intake
suggest a renal function reserve [29].
The raise in serum uric acid concentrations observed in the
present meta-analysis in individuals following an HP diet was most
likely probably caused by the higher intake of animal source foods
rich in purines. Epidemiological data suggest that protein per se
does not raise serum uric acid [30]. Among others, the Health
Professionals Follow-up Study observed a 41% increase in the risk
of first attack of gout when comparing the highest vs. lowest meat
consumption quintile [31]. In addition to gout disorders, serum
uric acid has been described as a modifiable risk factor for CVD
and all-cause mortality in men and women [32,33]. From these
data, one may conclude that the source of protein is of higher
importance than its absolute amount. A 26-year follow up of the
Nurses’ Health Study (NHS) revealed that protein sources such as
red meat and high-fat dairy products were significantly associated
with an elevated risk of CHD, while higher intakes of poultry, fish,
and nuts (although rich in protein as well) were correlated with a
lower risk of CHD [34]. In contrast to these findings, Bernstein et
al. [35] concluded that long-term consumption of high-protein
diets may cause renal injury and accelerate the onset of CKD in
persons with normal renal function independent of the fact,
whether the protein food source is either predominantly animal or
vegetable protein.
Reductions in urinary pH (p = 0.07) as observed in this meta-
analysis for HP diets are regarded as an independent risk factor for
nephrolithiasis [7]. In addition, HP intake raised urinary calcium
excretion which is a common characteristic in patients with
calcareous stones [36,37]. Impairment of calcium homeostasis
might lead to a decrease in bone mineral density. However,
clinical and epidemiological data do not support the concept that
HP diets exert harmful effects on bone health.[1,38] Moreover,
the differences observed in the present meta-analysis do not seem
to be clinically relevant.
Two meta-analyses including observational studies showed that
overweight, obesity and the metabolic syndrome increase the risk
of kidney disease by 40 to 83% [39,40]. Considering that some two
thirds the trials included in the present meta-analysis were
enrolling obese subjects, it could be speculated that a high protein
intake will add another detrimental factor to the increased risk of
kidney dysfunction already established for this population.
According to the recommendations of the American Diabetes
Association, patients with T2D should not refer to HP diets as a
means for weight loss due to the unknown long-term effects of
protein intakes . 20% of TEC [41].
LimitationsRegarding the validity of the main outcome parameter GFR,
the creatinine-based estimating equations used in the trials
included in this systematic review are known to have some
limitations with respect to precision as well as being affected by
variations in protein intake, which might be further aggravated by
the fact that the study population did not suffer from manifested
chronic kidney disease. Thus, the GFR effects observed in the
present meta-analysis have to be interpreted in a conservative
manner, since increased creatinine values would translate into a
Figure 2. Forest plot showing pooled MD with 95% CI for serum urea (mmol/l) of 13 randomized controlled HP diet trails. For eachhigh protein study, the shaded square represents the point estimate of the intervention effect. The horizontal line joins the lower and upper limits ofthe 95% CI of these effects. The area of the shaded square reflects the relative weight of the study in the respective meta-analysis. The diamond at thebottom of the graph represents the pooled MD with the 95% CI. HP, high protein; NP/LP, normal protein/low protein.doi:10.1371/journal.pone.0097656.g002
High Protein Diets and Renal Function
PLOS ONE | www.plosone.org 11 May 2014 | Volume 9 | Issue 5 | e97656
lower estimated GFR [42]. A cross-sectional study by Inker et al.
has shown that cystatin C might represent a more useful marker
for estimating GFR especially when combined with creatinine
[43]. Moreover, a post hoc analysis of the ‘‘Modification of Diet
and Renal Disease’’ study (the origin of eGFR based on serum
creatinine) has shown that dietary protein reduced the change in
creatinine, but did not significantly affect cystatin C changes [44].
Other limitations of the present review include the limited
number of studies and the heterogeneity of the study designs.
Thus, this meta-analysis does not consider unpublished data.
Examination of funnel plots showed little to moderate asymmetry
suggesting that publication bias cannot be completely excluded as
a confounder of the present meta-analysis (e.g. lack of published
studies with inconclusive results) which may have had at least a
moderate impact on the effect size estimates. A major limitation of
nutritional intervention trials is the heterogeneity of various
aspects and characteristics of the study protocols. Therefore, it is
not surprising that the RCTs and crossover studies included in the
present analyses varied regarding type(s) of diets used (energy
restriction, isocaloric), definitions of HP and NP/LP diets, study
population (i.e. age, sex, healthy, overweight, obese, type 2
diabetics), intervention time (1–108 weeks), as well as nutritional
assessment. Following sensitivity analyses excluding only trials
enrolling patients with T2D, the effect of HP diets on GFR
remained the same as those observed in the conclusive analyses.
With respect to other potential modulating variables, sensitivity
analyses and meta-regressions failed to show any correlations
between the findings of the meta-analyses and age, gender, BMI,
and study duration and % protein intakes (data not shown). Only
few studies provided information on the quality of their respective
setup (e.g. method of randomization, follow-up protocol with
reasons for withdrawal, see Figure S1 for Risk of bias assessment
according to the Cochrane Collaboration) demanding a conser-
vative interpretation of results. To estimate GFR heterogeneous
equation were used (see Table 2). Moreover, the included trials
varied with respect to dietary assessment methods to validate
adherence of participants. In an HP dietary intervention study by
Friedman et al. [11], significant increases in serum creatinine
clearance were found after 3 and 12 months, but were not
detectable anymore following a 24 month interval, indicating that
adherence to the HP diet was not present at the end of the trial. In
addition, Krebs et al. [45] could not measure significant
differences in renal function at any time-point (6, 12, and 24
months) when comparing an HP with a LP regimen. Assessment of
protein intakes revealed that the difference between the two
groups did not exceed more than 2% of TEC suggesting a very
low adherence to the dietary interventions. Therefore, adherence
of individuals assigned to a HP diet might change over time.
Although adherence is usually good in the short term, the long-
term effects of HP vs. LP/NP diets are of higher interest.
Augmentations of urinary calcium excretions found in the present
meta-analysis in individuals following an HP diet might be
interpreted as an adherence marker of HP diets. Some of the
present meta-analyses were done using both post-intervention
values and changes in mean difference, however, this was
considered to be an acceptable procedure as described by the
Cochrane Collaboration [17]. On the other hand, this meta-
analysis has several strengths as well. All analyses were conducted
following a stringent protocol, e.g. participants were randomly
assigned to the intervention groups in all trials. Randomized
controlled trials are considered to be the gold standard for
evaluating the effects of an intervention and are subject to fewer
biases as compared to observational studies. With a sample size of
2160 volunteers, the present meta-analysis provides the power to
detect statistically significant mean differences as well as to assess
publication bias.
In conclusion, HP diets were associated with increased GFR,
serum urea, urinary calcium excretion, and serum concentrations
of uric acid. Most of these changes could be interpreted as
physiological adaptive mechanism induced by HP diet without any
clinical relevance. However, considering of the fact that subclinical
CKD is highly prevalent, and that obesity is associated with kidney
disease, weight reduction programs recommending HP diets
especially from animal sources should be handled with caution.
Supporting Information
Figure S1 Risk of bias assessment tool.
(EPS)
Figure S2 Flow chart.
(DOCX)
Figure S3 Forest plot showing pooled MD with 95% CIfor serum creatinine.
(EPS)
Figure S4 Forest plot showing pooled MD with 95% CIfor serum uric acid.
(EPS)
Figure S5 Forest plot showing pooled MD with 95% CIfor urinary albumin/protein excretion.
(EPS)
Figure S6 Forest plot showing pooled MD with 95% CIfor urinary calcium excretion.
(EPS)
Figure S7 Forest plot showing pooled MD with 95% CIfor urinary pH.
(EPS)
Figure S8 Funnel plot: glomerular filtration rate.
(EPS)
Figure S9 Funnel plot: serum creatinine.
(EPS)
Figure S10 Funnel plot: serum urea.
(EPS)
Figure S11 Funnel plot: serum uric acid.
(EPS)
Figure S12 Funnel plot: urinary pH.
(EPS)
Figure S13 Funnel plot: urinary albumin/protein ex-cretion.
(EPS)
Figure S14 Funnel plot: urinary calcium excretion.
(EPS)
Table S1 Sensitivity analysis for subjects without T2D.
(DOCX)
Table S2 Sensitivity analysis for obese subjects.
(DOCX)
Table S3 Sensitivity analysis for long-term studies ($12weeks).
(DOCX)
Table S4 Sensitivity analysis for T2D subjects.
(DOCX)
High Protein Diets and Renal Function
PLOS ONE | www.plosone.org 12 May 2014 | Volume 9 | Issue 5 | e97656
Checklist S1 PRISMA checklist.
(DOCX)
References S1 (DOCX)
Author Contributions
Conceived and designed the experiments: LS GH. Performed the
experiments: LS GH. Analyzed the data: LS GH. Contributed reagents/
materials/analysis tools: LS GH. Contributed to the writing of the
manuscript: LS GH.
References
1. Santesso N, Akl EA, Bianchi M, Mente A, Mustafa R, et al. (2012) Effects of
higher- versus lower-protein diets on health outcomes: a systematic review andmeta-analysis. Eur J Clin Nutr 66: 780–788.
2. Schwingshackl L, Hoffmann G (2013) Long-term effects of low-fat diets either
low or high in protein on cardiovascular and metabolic risk factors: a systematicreview and meta-analysis. Nutr J 12: 48.
3. Food and Nutrition Board IoM (2002) Dietary reference intakes for energy,carbohydrates, fiber, fatty acids, cholesterol, protein, and amino acids
(macronutrients). In: Washington DNAP, editor. pp. 207–264.4. Adam-Perrot A, Clifton P, Brouns F (2006) Low-carbohydrate diets: nutritional
and physiological aspects. Obes Rev 7: 49–58.
5. Crowe TC (2005) Safety of low-carbohydrate diets. Obes Rev 6: 235–245.6. Brenner BM, Lawler EV, Mackenzie HS (1996) The hyperfiltration theory: a
paradigm shift in nephrology. Kidney Int 49: 1774–1777.7. Friedman AN (2004) High-protein diets: potential effects on the kidney in renal
health and disease. Am J Kidney Dis 44: 950–962.
8. Knight EL, Stampfer MJ, Hankinson SE, Spiegelman D, Curhan GC (2003)The impact of protein intake on renal function decline in women with normal
renal function or mild renal insufficiency. Ann Intern Med 138: 460–467.9. Jia Y, Hwang SY, House JD, Ogborn MR, Weiler HA, et al. (2010) Long-term
high intake of whole proteins results in renal damage in pigs. J Nutr 140: 1646–
1652.10. Reddy ST, Wang CY, Sakhaee K, Brinkley L, Pak CY (2002) Effect of low-
carbohydrate high-protein diets on acid-base balance, stone-forming propensity,and calcium metabolism. Am J Kidney Dis 40: 265–274.
11. Friedman AN, Ogden LG, Foster GD, Klein S, Stein R, et al. (2012)Comparative effects of low-carbohydrate high-protein versus low-fat diets on the
kidney. Clin J Am Soc Nephrol 7: 1103–1111.
12. Griffin KA, Kramer H, Bidani AK (2008) Adverse renal consequences ofobesity. Am J Physiol Renal Physiol 294: F685–696.
13. Coresh J, Astor BC, Greene T, Eknoyan G, Levey AS (2003) Prevalence ofchronic kidney disease and decreased kidney function in the adult US
population: Third National Health and Nutrition Examination Survey.
Am J Kidney Dis 41: 1–12.14. Moher D, Liberati A, Tetzlaff J, Altman DG (2009) Preferred reporting items for
systematic reviews and meta-analyses: the PRISMA statement. PLoS Med 6:e1000097.
15. Snyder JJ, Foley RN, Collins AJ (2009) Prevalence of CKD in the United States:a sensitivity analysis using the National Health and Nutrition Examination
Survey (NHANES) 1999–2004. Am J Kidney Dis 53: 218–228.
16. Higgins JP, Altman DG, Gotzsche PC, Juni P, Moher D, et al. (2011) TheCochrane Collaboration’s tool for assessing risk of bias in randomised trials. BMJ
343: d5928.17. Higgins JP, Green S (updated March 2011) Cochrane Handbook of systematic
reviews, Version 5.1.0
18. Higgins JP, Thompson SG, Deeks JJ, Altman DG (2003) Measuringinconsistency in meta-analyses. BMJ 327: 557–560.
19. Tirosh A, Golan R, Harman-Boehm I, Henkin Y, Schwarzfuchs D, et al. (2013)Renal Function Following Three Distinct Weight Loss Dietary Strategies During
2 Years of Randomized Controlled Trial. Diabetes Care.20. Jenkins DJ, Kendall CW, Vidgen E, Augustin LS, van Erk M, et al. (2001) High-
protein diets in hyperlipidemia: effect of wheat gluten on serum lipids, uric acid,
and renal function. Am J Clin Nutr 74: 57–63.21. Wakefield AP, House JD, Ogborn MR, Weiler HA, Aukema HM (2011) A diet
with 35% of energy from protein leads to kidney damage in female Sprague-Dawley rats. Br J Nutr 106: 656–663.
22. Fouque D, Laville M (2009) Low protein diets for chronic kidney disease in non
diabetic adults. Cochrane Database Syst Rev: CD001892.23. Noto H, Goto A, Tsujimoto T, Noda M (2013) Low-carbohydrate diets and all-
cause mortality: a systematic review and meta-analysis of observational studies.PLoS One 8: e55030.
24. Brenner BM, Meyer TW, Hostetter TH (1982) Dietary protein intake and the
progressive nature of kidney disease: the role of hemodynamically mediatedglomerular injury in the pathogenesis of progressive glomerular sclerosis in
aging, renal ablation, and intrinsic renal disease. N Engl J Med 307: 652–659.25. Frank H, Graf J, Amann-Gassner U, Bratke R, Daniel H, et al. (2009) Effect of
short-term high-protein compared with normal-protein diets on renal hemody-namics and associated variables in healthy young men. Am J Clin Nutr 90:
1509–1516.
26. Matsushita K, van der Velde M, Astor BC, Woodward M, Levey AS, et al.(2010) Association of estimated glomerular filtration rate and albuminuria with
all-cause and cardiovascular mortality in general population cohorts: acollaborative meta-analysis. Lancet 375: 2073–2081.
27. Martin WF, Armstrong LE, Rodriguez NR (2005) Dietary protein intake and
renal function. Nutr Metab (Lond) 2: 25.28. Fliser D, Ritz E, Franek E (1995) Renal reserve in the elderly. Semin Nephrol
15: 463–467.
29. Bosch JP, Saccaggi A, Lauer A, Ronco C, Belledonne M, et al. (1983) Renalfunctional reserve in humans. Effect of protein intake on glomerular filtration
rate. Am J Med 75: 943–950.30. Choi HK, Liu S, Curhan G (2005) Intake of purine-rich foods, protein, and
dairy products and relationship to serum levels of uric acid: the Third NationalHealth and Nutrition Examination Survey. Arthritis Rheum 52: 283–289.
31. Choi HK, Atkinson K, Karlson EW, Willett W, Curhan G (2004) Purine-rich
foods, dairy and protein intake, and the risk of gout in men. N Engl J Med 350:1093–1103.
32. Niskanen LK, Laaksonen DE, Nyyssonen K, Alfthan G, Lakka HM, et al. (2004)Uric acid level as a risk factor for cardiovascular and all-cause mortality in
middle-aged men: a prospective cohort study. Arch Intern Med 164: 1546–1551.
33. Kim SY, Guevara JP, Kim KM, Choi HK, Heitjan DF, et al. (2010)Hyperuricemia and coronary heart disease: a systematic review and meta-
analysis. Arthritis Care Res (Hoboken) 62: 170–180.34. Bernstein AM, Sun Q, Hu FB, Stampfer MJ, Manson JE, et al. (2010) Major
dietary protein sources and risk of coronary heart disease in women. Circulation
122: 876–883.35. Bernstein AM, Treyzon L, Li Z (2007) Are high-protein, vegetable-based diets
safe for kidney function? A review of the literature. J Am Diet Assoc 107: 644–650.
36. Parmar MS (2004) Kidney stones. BMJ 328: 1420–1424.37. Cao JJ, Johnson LK, Hunt JR (2011) A diet high in meat protein and potential
renal acid load increases fractional calcium absorption and urinary calcium
excretion without affecting markers of bone resorption or formation inpostmenopausal women. J Nutr 141: 391–397.
38. Calvez J, Poupin N, Chesneau C, Lassale C, Tome D (2012) Protein intake,calcium balance and health consequences. Eur J Clin Nutr 66: 281–295.
39. Wang Y, Chen X, Song Y, Caballero B, Cheskin LJ (2008) Association between
obesity and kidney disease: a systematic review and meta-analysis. Kidney Int73: 19–33.
40. Thomas G, Sehgal AR, Kashyap SR, Srinivas TR, Kirwan JP, et al. (2011)Metabolic syndrome and kidney disease: a systematic review and meta-analysis.
Clin J Am Soc Nephrol 6: 2364–2373.41. Bantle JP, Wylie-Rosett J, Albright AL, Apovian CM, Clark NG, et al. (2008)
Nutrition recommendations and interventions for diabetes: a position statement
of the American Diabetes Association. Diabetes Care 31 Suppl 1: S61–78.42. Levey AS, Bosch JP, Lewis JB, Greene T, Rogers N, et al. (1999) A more
accurate method to estimate glomerular filtration rate from serum creatinine: anew prediction equation. Modification of Diet in Renal Disease Study Group.
Ann Intern Med 130: 461–470.
43. Inker LA, Schmid CH, Tighiouart H, Eckfeldt JH, Feldman HI, et al. (2012)Estimating glomerular filtration rate from serum creatinine and cystatin C. N
Engl J Med 367: 20–29.44. Tangri N, Stevens LA, Schmid CH, Zhang YL, Beck GJ, et al. (2011) Changes
in dietary protein intake has no effect on serum cystatin C levels independent ofthe glomerular filtration rate. Kidney Int 79: 471–477.
45. Krebs JD, Elley CR, Parry-Strong A, Lunt H, Drury PL, et al. (2012) The
Diabetes Excess Weight Loss (DEWL) Trial: a randomised controlled trial ofhigh-protein versus high-carbohydrate diets over 2 years in type 2 diabetes.
Diabetologia 55: 905–914.46. Hallynck TH, Soep HH, Thomis JA, Boelaert J, Daneels R, et al. (1981) Should
clearance be normalised to body surface or to lean body mass? Br J Clin
Pharmacol 11: 523–526.47. Skov AR, Toubro S, Bulow J, Krabbe K, Parving HH, et al. (1999) Changes in
renal function during weight loss induced by high vs low-protein low-fat diets inoverweight subjects. Int J Obes Relat Metab Disord 23: 1170–1177.
48. Gross JL, de Azevedo MJ, Silveiro SP, Canani LH, Caramori ML, et al. (2005)
Diabetic nephropathy: diagnosis, prevention, and treatment. Diabetes Care 28:164–176.
49. Levey AS, Greene T, Beck GJ, Caggiula AW, Kusek JW, et al. (1999) Dietaryprotein restriction and the progression of chronic renal disease: what have all of
the results of the MDRD study shown? Modification of Diet in Renal DiseaseStudy group. J Am Soc Nephrol 10: 2426–2439.
50. Kesteloot H, Joossens JV (1996) On the determinants of the creatinine clearance:
a population study. J Hum Hypertens 10: 245–249.51. Du Bois D, Du Bois EF (1989) A formula to estimate the approximate surface
area if height and weight be known. 1916. Nutrition 5: 303–311; discussion 312–303.
High Protein Diets and Renal Function
PLOS ONE | www.plosone.org 13 May 2014 | Volume 9 | Issue 5 | e97656