Funded by the
Pilot project on availability, use and sustainability of water production of nuclear and fossil energy –
Geo-localised inventory of water use in cooling processes, assessment of vulnerability and of water use management
measures
End Report

ECOFYS Netherlands B.V. | Kanaalweg 15G | 3526 KL Utrecht| T +31 (0)30 662-3300 | F +31 (0)30 662-3301 | E [email protected] | I www.ecofys.com
Chamber of Commerce 30161191
ENV.D1/SER/2013/0004
Pilot project on availability, use and sustainability of water
production of nuclear and fossil energy –
Geo-localised inventory of water use in cooling processes,
assessment of vulnerability and of water use management
measures
End Report
Date: 10 July 2014
Ecofys project number: CESNL13784
Funded by the
Ecofys 2014 by order of: the European Commission Directorate General Environment
The information and views set out in this report are those of the author(s) and do not necessarily
reflect the official opinion of the Commission. The Commission does not guarantee the accuracy of
the data included in this study. Neither the Commission nor any person acting on the Commission’s
behalf may be held responsible for the use which may be made of the information contained therein.

ECOFYS Netherlands B.V. | Kanaalweg 15G | 3526 KL Utrecht| T +31 (0)30 662-3300 | F +31 (0)30 662-3301 | E [email protected] | I www.ecofys.com
Chamber of Commerce 30161191
Table of contents
Foreword
Abstract
1 Introduction 1
1.1 Background 1
1.2 Previous study 2
1.3 Objective 3
1.4 Scope 3
1.5 Reading guide 4
2 Methodology 5
2.1 Starting point 5
2.2 Existing data and literature 6
2.3 Approach outline 6
2.4 Addressing challenges 8
2.5 Project organisation 9
2.6 Steering committee interaction and sector commitment 11
3 Principles of cooling water use 13
3.1 Need for cooling systems 13
3.2 Heat export 14
3.3 Quality of cooling water discharge and temperature 15
3.4 Basis for selection of cooling system 15
3.5 Types of cooling system 16
3.6 Sea water cooling and fresh water cooling 19
3.7 Cooling water use variation over time 22
3.8 Regulation and permitting of cooling water use 22
3.9 Definitions cooling water intake, discharge and consumption 23
4 Selection of plants 25
4.1 Purpose of selecting plants 25
4.2 Selection of facilities in power sector 25
4.3 Selection of facilities in iron & steel sector 27
4.4 Selection of facilities refineries sector 28
4.5 Selection facilities in chemical sector 29
4.6 Resulting list of selected facilities 31
4.7 Example data coverage with cut-off criterion of cooling water for Rotterdam area 33
5 Matching facilities to water bodies 36
5.1 Water body data in ECRINS 36
5.2 Challenges in matching facilities with water bodies 37

ECOFYS Netherlands B.V. | Kanaalweg 15G | 3526 KL Utrecht| T +31 (0)30 662-3300 | F +31 (0)30 662-3301 | E [email protected] | I www.ecofys.com
Chamber of Commerce 30161191
5.3 Main limitations of ECRINS database related to this project 37
6 Cooling water use in power sector 42
6.1 Plant characteristics power sector 42
6.2 Key factors governing cooling water use in the power sector 44
6.3 Overview of cooling water use in power sector 45
6.4 Identification of cooling system 48
6.5 Approach to quantifying cooling water use in power sector 50
6.6 Direct data gathering power sector 50
6.7 Specific cooling water use estimates based on pigeonholing approach and literature 51
6.8 Cooling water use functions for power sector 56
7 Cooling water use iron and steel sector 58
7.1 Plant characteristics iron and steel sector 58
7.2 Approach to quantifying cooling water use in iron & steel sector 60
7.3 Direct data gathering iron and steel sector 60
7.4 Literature cooling water use iron and steel sector 62
7.5 Cooling water use functions primary steel production 64
7.6 Cooling water use functions secondary steel production 66
7.7 Cooling water use functions implemented in database 68
8 Cooling water use refineries sector 70
8.1 Sector characteristics refineries sector 70
8.2 Key factors governing cooling water use 70
8.3 Anonymous cooling water data provided by refineries sector 71
8.4 Cooling water use estimates – refineries sector 72
9 Cooling water use chemical sector 74
9.1 Chemical sector characteristics and key factors governing cooling water use 74
9.2 Attempted data gathering in chemical sector 74
9.3 Cooling water use function for 3 chemical subsectors 75
10 Database design 78
10.1 Outline 78
10.2 Development process and alignment with EEA 78
10.3 Handover of database to EEA 80
10.4 Database use 80
10.5 Database updating 80
11 Data gathering 81
11.1 Data gathering methodology 81
11.2 Data gathering questionnaire 81
11.3 Overview results from data gathering 82
11.4 Screening and processing of data received 83
ECOFYS Netherlands B.V. | Kanaalweg 15G | 3526 KL Utrecht| T +31 (0)30 662-3300 | F +31 (0)30 662-3301 | E [email protected] | I www.ecofys.com
Chamber of Commerce 30161191
12 Data validation 85
12.1 Data validation approach 85
12.2 Power sector data validation based on country sums 85
12.3 Power sector – validation with existing database developed by JRC 89
12.4 Industrial sectors data validation based on country sums 91
12.5 Results data validation based on direct feedback 93
12.6 Other comments received 99
13 Catalogue of Measures to reduce vulnerability 100
13.1 Introduction 100
13.2 Vulnerability indicators 100
13.3 Proposed outline for Catalogue of Measures 101
13.4 Selection of cooling approaches and techniques 101
13.5 Conceptual mitigation measures 103
13.6 Economics of mitigation measures 105
13.7 Recommended steps in considering mitigation measures 106
14 Conclusions and Executive Summary 107
14.1 Role of cooling water 107
14.2 Definitions and terminology 108
14.3 Availability of data 108
14.4 Key factors governing cooling water use 109
14.5 Use of geo-localised database on cooling water use 110
References 111
Appendix I Definitions 113
Appendix II Database description & manual 121
Appendix III Data gathering questionnaire 139
Appendix IV Data validation documents 154
Appendix VI Vulnerability and water risk indicators earlier used 163
Appendix VII Vulnerability indicators 168
Appendix VIII Supplemental tables 171
Appendix IX Overview data gathering and validation contacts 175

ECOFYS Netherlands B.V. | Kanaalweg 15G | 3526 KL Utrecht| T +31 (0)30 662-3300 | F +31 (0)30 662-3301 | E [email protected] | I www.ecofys.com
Chamber of Commerce 30161191
Foreword
This End Report was prepared as part of the conclusion of the Pilot project on availability, use and
sustainability of water production of nuclear and fossil energy – Geo-localised inventory of water use
in cooling processes, assessment of vulnerability and of water use management measures
(ENV.D.1/SER/2013/0004). This End Report was preceded by two Interim Reports that served to
describe our progress and align the approach along with DG Environment, EEA and sector
stakeholders.
The study was carried out by a consortium consisting of Ecofys, Deltares and TNO for the European
Commission Directorate General Environment (DG Environment) between September 2013 and June
2014. The present report discusses the aim of the work, the approach followed, the resulting dataset
and conclusion. The report compliments the Cooling Water Use Database that was produced as the
second main deliverable from the pilot study. The European Environment Agency (EEA) will be the
custodian of this database, where it will serve as input in on-going work on building the Water
Accounts for Europe.
The study revolved around actual cooling water use from the 4 key sectors: Power Generation, Iron
and Steel, Refineries and Chemical. The interaction with, input data provided and review of results by
these sectors was essential to the results achieved. Numerous organisations and persons have played
an important role in this and the authors would like to thank all persons involved. In particular, we
would like to mention the contributions by the following organisations: Eurelectric, Eurofer, Concawe
and Cefic, European Industrial Gasses Association, Fertilizers Europe. Furthermore, we would like to
thank the various European institutions that have provided information and suggestions, including
EEA, JRC Institute for Environment and Sustainability, JRC Institute for Energy & Transport, JRC
Institute for Prospective Technological Studies and Eurostat.
Finally, we would also like to thank the numerous persons, companies and institutes that have
invested time and effort in sharing their knowledge and providing essential input and feedback to the
project team. Among the many, we would like to mention in particular: EDF France, EDP Spain and
EDP Portugal, Energy UK and RWE nPower, Enemalta, Federatie van de Belgische Elektriciteits en
Gasbedrijven (FEBEG) and GDF Suez, Energie Nederland and Essent, Electricity Association of Ireland
(EAI), Svensk Energie, Tata Steel IJmuiden, Netherlands Ministry of Public Works, UK Environment
Agency, Slovak Hydro Metereological Institute (SHNU).
Utrecht, The Netherlands
10 July 2014

ECOFYS Netherlands B.V. | Kanaalweg 15G | 3526 KL Utrecht| T +31 (0)30 662-3300 | F +31 (0)30 662-3301 | E [email protected] | I www.ecofys.com
Chamber of Commerce 30161191
Abstract
Cooling water plays an essential role in the effective and efficient operation of a range of industries
and sectors that are vital to the European economy. Cooling water use may involve significant
quantities of water when compared to other water uses, particularly in case of once-through cooling
systems. However, with these systems virtually all water taken in, is returned to the water system
albeit at a slightly higher temperature. When selecting a cooling system configuration for a plant,
there are environmental and economic trade-offs that are site-specific. This pilot project has
delivered a database that provides a comprehensive dataset on cooling water use in 4 key sectors for
EU28 countries: power generation, iron & steel, refineries and chemical sector. The dataset includes
collected actual data from numerous plants but also estimated values for those plants where no direct
data could be obtained. As such the database can be used to inform industry and governments with a
fair approximation of average cooling water use in different sectors and regions. It is suitable for
aggregated assessments on the level of river basin, country or region, but not for detailed temporal
resolution or plant-specific analysis, comparison or benchmarking.

CESNL13784 End Report 1
1 Introduction
1.1 Background
Cooling water plays an essential role in the effective and efficient operation of a range of industries
and sectors that are vital to the European economy. A good overview of cooling water use is an
essential starting point for addressing availability, use and sustainability of water use within the
broader context of the EU addressing climate change through adaptation strategies and promoting
the sustainable use of resources. Secondly, it provides a starting point for identifying and quantifying
the vulnerability of these sectors to any constraints in the availability of cooling water, as the first
step in the process to mitigate these vulnerabilities. This process is essential to building a more
resilient economy for the future.
This is recognized within the EU and has resulted in the assessment of cooling water needs in the EU
within the EC’s Blueprint framework1.
“The “Blueprint” outlines actions that concentrate on better implementation of current
water legislation, integration of water policy objectives into other policies, and filling the
gaps in particular in regards to water quantity and efficiency. The objective is to ensure
that a sufficient quantity of good quality water is available for people's needs, the
economy and the environment throughout the EU.”
Within this context DG Environment and the European Environment Agency are building Water
Accounts for all river basins in Europe. These Water Accounts provide a quantitative overview of the
various ways in which water is used2 at river sub-catchment level. The first version of these Water
Accounts was defined in a study in 2011 – 2012. These included preliminary estimates for water use
functions in the power sector and some other sectors of industry3. However, these existing estimates
are not considered sufficiently accurate in the next round of work on Water Accounts.
In particular, cooling water use in four key sectors was identified as a focus area for improvement:
Power Generation, Iron and Steel, Refineries and Chemical sectors based on three criteria:
1. Cooling water use adds up to sizeable fraction of all water use in the Water Accounts.
2. The four sectors considered make up an important part of all cooling water use.
3. The design of plants and their cooling systems typically aim for an economically efficient
optimum at the site, taking into account local cooling water availability and environmental
regulations. The resulting cooling water intake and discharge varies widely from plant to plant.
1 http://ec.europa.eu/environment/water/blueprint/ 2 http://ec.europa.eu/environment/water/blueprint/pdf/brochure_en.pdf 3 http://ec.europa.eu/environment/water/blueprint/index_en.htm, http://ec.europa.eu/environment/water/blueprint/pdf/WaterEcosystemAccount2.pdf
CESNL13784 End Report 2
Context - excerpt from EEA Report No 2/2009
“Water resources across Europe — confronting water scarcity and drought in the EU as a whole, energy
production accounts for 44 % of total water abstraction, primarily serving as cooling water. Twenty-four per
cent of abstracted water is used in agriculture, 21 % for public water supply and 11 % for industrial
purposes. These EU-wide figures for sectoral water use mask strong regional differences, however. In
southern Europe, for example, agriculture accounts for more than half of total national abstraction, rising to
more than 80 % in some regions, while in western Europe more than half of water abstracted goes to energy
production as cooling water. These sectors also differ significantly in their 'consumptive' use of water. Almost
100 % of cooling water used in energy production is restored to a water body. In contrast, the consumption
of water through crop growth and evaporation typically means that only about 30 % of water abstraction for
agriculture is returned.”
Added note: the statement that 100% of cooling water used in energy production is returned to a water body
relates primarily to once-through cooling systems. In other cooling system layouts it does not necessarily
hold.
The present study was commissioned by European Commission Director General Environment (DG
Environment) as a pilot project to address this gap. The results are to be plant-specific, geo-localised
data on cooling water use for a sample of facilities in the relevant sectors. The information is to be
organised in a database that can be used as input for the on-going work to develop the next
generation of Water Accounts by the European Environment Agency (EEA).
The work took place under the Service Contract No. 070334/2013/658529/SER/ENV.C1: “Pilot project
on availability, use and sustainability of water production of nuclear and fossil energy – geo-localised
inventory of water use in cooling processes, assessment of vulnerability and of water use
management measures”
1.2 Previous study
The basis for this selection of sectors (Power Generation, Iron and Steel, Refineries and Chemical
sectors) is provided by the 2012 Blueprint project report for DG Environment4. In this study the total
water use- including cooling water - was estimated for the energy sector and several industrial
sectors.
The study showed that the power sector is the most relevant sector to include in a geo-specific
assessment of cooling water inventory across Europe, Figure 1 (Pöyri and VITO 2012). Other facilities
of importance are oil refineries and iron and steel facilities, although with significantly different needs
relating to water use and cooling water use. A fourth sector was added for this specific study: the
chemical sector. This sector is also thought to be of high importance in relation to cooling water use5.
4 http://ec.europa.eu/environment/water/blueprint/index_en.htm
http://ec.europa.eu/environment/water/blueprint/pdf/WaterEcosystemAccount2.pdf 5 The following statement is provided in the BREF Industrial Cooling systems (section 3.3): “Generally, the largest share of (surface) water is
required by power stations. The remainder in accounted for by a small number of larger industries, of which the chemical industry is the
largest user.” IPPC 2001 Reference Document on the application of Best Available techniques to Industrial Cooling Systems

CESNL13784 End Report 3
Figure 1 Water use, discharge and consumption estimates for various sectors in the EU28 countries in million
m3 (Mm3). Note that this is not limited to cooling water. Source: Pöyri and VITO (2012).
1.3 Objective
The objective is to establish a reliable database that captures key parameters on cooling water and
which can form a basis for onward development. The database needs to build on the experience
gained with the existing European Pollutant Release and Transfer Register (E-PRTR)6 and Water
Information System for Europe (WISE)7 databases. By including water use management measures
and information on vulnerability of the industry and the water availability, these results can
contribute to shape European policy (development, impact assessment and evaluation) on
sustainable production including the use of water for cooling purposes.
The specific objectives of the present pilot study are:
1. To gather reliable location-specific data on water use for cooling purposes in energy and
industry for the EU countries, for the power, iron & steel, refineries, and chemical sectors.
2. To organise this information in a database that can be linked to the existing E-PRTR, Large
Combustion Plants (LCP) and WISE (water system) databases and as such can serve as a tool
to support European policy.
1.4 Scope
The scope of the present pilot study can be summarised as follows:
a. The present inventory is a pilot focused on four sectors that make up an important share of
total cooling water use in the European Union:
- Power generation
- Iron and Steel
- Refineries
- Chemical sector
6 http://prtr.ec.europa.eu/ 7 http://water.europa.eu/
0
10000
20000
30000
40000
50000
60000
70000
80000
Mm3 Mm3 Mm3 Mm3 Mm3 Mm3 Mm3
Energy sector
fossil fuels
Energy sector
nuclear fuels
Pulp and
paper
Oil refinery Steel BOF Steel EAF Cement
Mil
lio
n M
3/y
r
Water use
Water discharge
Water consumption

CESNL13784 End Report 4
b. For each relevant sector a subset of facilities will be selected with the aim to capture the
majority of cooling water use within that sector.
c. The geographical scope of the inventory is the entire European Union: EU28 countries,
including ultra-peripheral regions.
d. Cooling water intake, consumption and discharge will be considered.
e. To the extent possible, measured data will be sought on actual cooling water use. Gaps in the
available data will be filled with estimated values.
f. The temporal scope covers the period 2001-2012 at a month time resolution.
1.5 Reading guide
Chapter 2 presents an overview of the methodology and the organisation of this study.
Chapter 3 provides an introduction to some of the general aspects of cooling water use.
Chapter 4 describes how the facilities covered in the present pilot study were selected, while Chapter
5 describes how location of facilities were matched with water body IDs to allow linking cooling water
use locations to water sub-catchment areas.
Chapters 6 through 9 presents the specific approach used for each of the four sectors considered in
the present study: Power, Iron & Steel, Refineries and Chemical sector. For each of the sectors, main
factors governing cooling water use are described and the approach used in data gathering and
estimating cooling water use when no data was available.
Chapter 10 presents the design for the cooling water use database.
Chapter 11 discusses the results from the comprehensive data gathering effort that was carried out.
Results from the data validation are presented in Chapter 12. This chapter furthermore provides
insight into the quality of the estimated and gathered information.
Chapter 13 presents an introduction to potential measures for reducing cooling water use.
The final Chapter 14 presents the overall conclusions from the pilot study.
Furthermore, a set of Appendices provide background information and more detailed results.

CESNL13784 End Report 5
2 Methodology
2.1 Starting point
The approach for the present study was designed to meet the objectives of this pilot study while
taking into account a number of key challenges that were identified at the onset:
1. The list of facilities to target for data gathering needed to be carefully selected, taking into
account the range of cooling water use characteristics and plant characteristics. In most
sectors one would expect that a limited subset of plants would be responsible for the majority
of cooling water use, but in some cases there may be a long-tail of numerous smaller plants
that all have a relevant contribution.
2. Existing databases provided an important starting point for the study, but required
supplemental datasets to address known limitations or inaccuracies. For example, the E-PRTR
database provides data on emissions from plants, but not on plant activity production.
Furthermore, some types of plants do not feature in E-PRTR by their nature, as is the case for
Nuclear power plants.
3. Nonetheless, we expected it to be impossible to gather data for a significant share of the plants
for various reasons:
- Plant owners were under no obligation to provide data for this study.
- Information on cooling water use is related to plant efficiency and operation and these
are typically considered to be commercially sensitive information.
- If plant owners are reporting information on cooling water use because of permit
requirements, this information can typically not be released by the authorities involved
due to confidentiality commitments towards the owners.
- Data may not yet be available in a well-organised way and it is likely to be a time
consuming effort to start doing this.
4. Ensuring productive interaction with the relevant sector organisations is essential to ensure a
detailed understanding of key factors governing cooling water use in the sector and to seek
their assistance in contacting and convincing plant owners to provide data on actual cooling
water use.
5. A method for estimating cooling water use values was required to fill any gaps in the data
gathered. However, ideally this builds on detailed information for each plant on a range of plant
characteristics which may difficult to obtain.
6. The screening and validation of the data received and included in the database will be
necessary to allow a good understanding of the quality of information. Such validation would
best make use of plant specific information, which may be constrained by willingness of the
sector players to invest the time required.

CESNL13784 End Report 6
2.2 Existing data and literature
There are a number of existing sources of information that provided a valuable initial set of data for
the project from scientific literature on global cooling water use, previous work on cooling water
inventory for the European Union and existing databases. The following key sources are highlighted
here:
1. Literature on cooling water use, both in the specific sectors considered in this pilot study and in
general, including:
- Integrated Pollution Prevention and Control (IPPC) Reference Document on the
application of Best Available Techniques (BAT) to Industrial Cooling Systems, 2001.
- Macknick et al (2012). Operational water consumption and withdrawal factors for
electricity generating technologies: a review of existing literature. Environmental
Research Letters. (7) (10pp) doi:10.1088/1748-9326/7/4/045802.
2. Earlier work on cooling water use in the European Union, including:
- Building of Water and Ecosystem accounts at EU level by Pöyri and VITO (2012),
previous work on water accounts that included estimated cooling water use.
- Power Sector Use of Water & the Blueprint ad hoc Modelling Group by Neil Edwards
(2013).
3. Existing databases on facilities and water bodies including E-PRTR, LCP and WISE. This data
was used for preparing a list of the relevant facilities and some of their key parameters.
A comprehensive list of literature sources used is included in the References section after the
concluding chapter of this report.
2.3 Approach outline
The main steps take in the project were:
1. Identifying facilities and direct data gathering on cooling water intake, discharge and
consumption by distributing a detailed questionnaire to key stakeholders. In agreement with
the Steering Committee, the relevant European sector organisations assisted in establishing
contact with key persons in different countries and / or companies, explaining the relevance
and added value of contributing, addressing questions or concerns from their members and
contributing to validation of the acquired data with national sector organisations and water
institutes.
The main steps for the data gathering consisted of:
- Collect base data on facilities from E-PRTR to characterise the facility.
- Define the scope and size of the sample of facilities per sector.
- Prepare data gathering questionnaire and supporting documentation.
- Approach EU and national sector organisations and National governmental bodies
responsible for water.
- Collect data gathered on volume and temperature of cooling water intake, consumption
and discharge.
CESNL13784 End Report 7
2. Defining water use functions to allow estimation of corresponding cooling water use values
at facility level based on plant characteristics, to fill any gaps in data gathered. Initially, a first
version for the water use functions is proposed and discussed in the Steering Committee.
Based on feedback received as well as the results from direct data gathering, the cooling water
use functions could be further refined. The quality and degree of refinement of these water use
functions depends on the quality and quantity of data gathered.
The main steps in defining the water use functions consisted of:
- Review literature on cooling water use.
- Quantitative analysis of data gathered on cooling water intake, discharge and
consumption.
- Estimate key parameters on volume of cooling water intake, consumption and discharge
where no data was available. A sector specific water use function is determined and
applied.
Data on the characteristics of the facility and on the water body (or bodies) that the facility is linked
to through the cooling water use of a facility is captured and connected in the project. The connecting
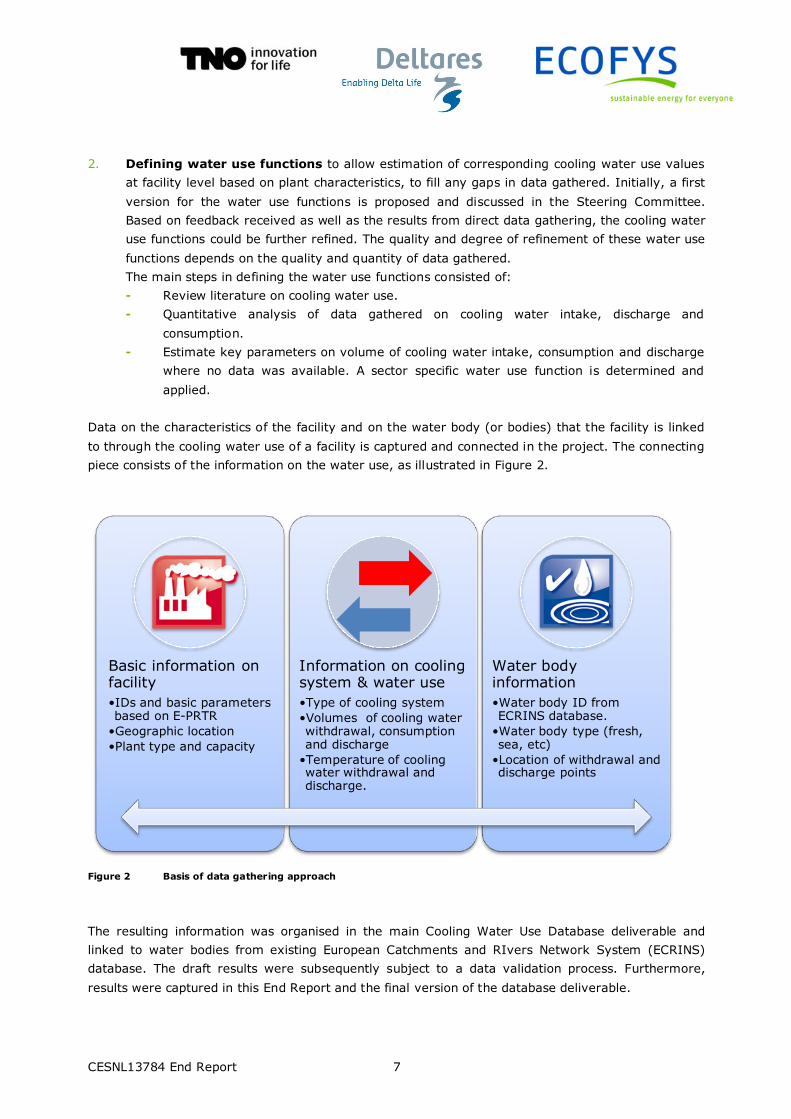
piece consists of the information on the water use, as illustrated in Figure 2.
Figure 2 Basis of data gathering approach
The resulting information was organised in the main Cooling Water Use Database deliverable and
linked to water bodies from existing European Catchments and RIvers Network System (ECRINS)
database. The draft results were subsequently subject to a data validation process. Furthermore,
results were captured in this End Report and the final version of the database deliverable.
Basic information on facility•IDs and basic parameters based on E-PRTR
•Geographic location•Plant type and capacity
Information on cooling system & water use •Type of cooling system•Volumes of cooling water withdrawal, consumption and discharge
•Temperature of cooling water withdrawal and discharge.
Water body information•Water body ID from ECRINS database.
•Water body type (fresh, sea, etc)
•Location of withdrawal and discharge points
CESNL13784 End Report 8
3. Database construction with the main steps:
- Development of database design in alignment with EEA as the final custodian of the
results.
- Linking of E-PRTR facility IDs with water body IDs using a GIS-based approach.
- Importing of cooling water data in the database.
- Hand-over of database to EEA to allow WISE integration.
4. Data validation to ensure the quality of the results.
The main steps in the data validation consisted of:
- Review and validation based on team expertise.
- Set up a validation review cycle with national sector organisations and (water) institutes.
- Set up a validation review by steering committee that includes EU sector organisations.
5. Publication of final deliverables consisting of:
- Defining vulnerability indicators and measures for reducing cooling water use (Task 4)
- Public database listing facilities and corresponding cooling water use;
- Public report with justification of approach, data validation, context and any qualifications
and background on the meaning of data and limitations therein.
2.4 Addressing challenges
A number of choices were made over the course of the pilot study to address challenges. These are
described in following chapters where these relate to specific sectors. For example, each sector has a
different type output and plant characteristics. This has required a slightly differentiated approach in
direct data gathering and estimating the water use function.
Some choices relate to the overall approach and are elaborates here:
a. It did not prove practical to obtain direct data at the same 12-year timespan and 1-month time
resolution that the output information required. Firstly, companies were not willing to share
such detailed information due to commercial sensitivity and secondly this would have required
a prohibitive amount of time in completing the questionnaire. As a consequence, it was decided
to use the year 2010 as a base year. Subsequently, estimates for cooling water use for the 12-
year timespan and 1-month time resolution were derived from this base year based on sector
production statistics. It was noted 2010 may be considered an atypical year for some sectors
due to the economic downturn that had started just before. To some extent this is
compensated for through the sector production statistics used. However, this approach does
not capture all year-on-year variation in actual plants as individual maintenance periods and
variation of the plants are operated are not reflected.
b. The study linked cooling water use for each facility to a water body. There are cases where a
single plant uses multiple cooling water intakes and outlets that may be associated with
different water bodies. Initially, the questionnaires were setup to seek this detailed
information, however, feedback from the sector organisations indicated that this was not
feasible due to the amount of extra effort required. Moreover, in many cases a clear dominant
type of cooling system responsible for the majority of cooling water use per plant could be
identified. This was subsequently used as the leading principle.
CESNL13784 End Report 9
c. Some sectors indicated that they were not willing to provide detailed and plant-specific data on
cooling water use due to commercial sensitivity. However, some of these were willing to
provide detailed cooling water data for anonymous plants and basic characteristics for all plants
on a non-anonymous basis. It was agreed that the best approach would be to use the
anonymous data to prepare differentiated estimates for cooling water use values for the plants
of a comparable type. The term “pigeonholing approach” was introduced to refer to this
method.
d. Part of the resulting quantitative information will be based on plant-specific data while other
parts will rely on estimated values. There will be a substantial difference in accuracy of these
respective types of information. It was therefore decided to show results in terms of a
bandwidth in case these were based on estimates and to present a low-estimate and a high-
estimate in the cooling water database that aim to represent first and third quartile values for a
population of comparable plants. In this way, one would expect that 50% of the actual values
fall within the estimated range, while 25% of cases would have a water use greater than the
high estimate and 25% of cases with a water use lower than the low estimate. This method
was preferred over presenting an absolute minimum and absolute maximum that includes
100% of all cases, as that would have resulted in a very wide range between the highest and
the lowest value. That would have provided information mostly about outliers rather than the
majority of cases.
e. Specific information on cooling water temperatures could not be obtained from the sectors and
it was subsequently decided not to consider this as part of the present pilot study.
f. Specific information on measures to reduce cooling water use was not available. Moreover, it
was clear that these measures would require detailed considerations of the design of the plant,
the water availability at the site and the trade-offs in costs, plant efficiency and environmental
impacts that this would involve. It was therefore decided to limit that part of the pilot study to
a conceptual description of measures.
2.5 Project organisation
In accordance with the Terms of Reference, the project organisation consisted of the following main
elements, illustrated in Figure 3:
▪ Client DG Environment with the project lead Henriette Faergemann as the focal point for
communication (in the first three months: Jacques Delsalle).
▪ Project team consisting of experts from Ecofys, Deltares and TNO, with the project manager
Frank Wiersma as the main point of contact.
▪ Steering committee that provided recommendations on the methodology and that included the
following members:
- EEA as the future custodian of the project deliverables and user of the resulting data on
cooling water use as input for the work on the Water Accounts.
- JRC Institute for Environment and Sustainability as one of the future users of the
resulting data as input in the hydro-economic modelling.
- JRC Institute for Energy & Transport
- JRC Institute for Prospective Technological Studies
- Eurostat
CESNL13784 End Report 10
- Eurelectric as the European sector organisation for the power generation sector. Through
Eurelectric, EDF also joined one of the Steering Committee meetings
- Eurofer as the European sector organisation for the iron and steel sector.
- Concawe as the European sector organisation for the refineries sector.
- CEFIC as the European sector organisation for the chemical industry. Through CEFIC, the
following European sub-sector organisations also joined one of the Steering Committee
meetings: European Industrial Gasses Association and Fertilizers Europe.
Figure 3 Project organisation chart.
The methodology was elaborated during the inception phase of the project and discussed in detail
with DG Environment and the Steering Committee. The following steering committee meetings
played an important role in this:
▪ Steering Committee kick-off meeting on 21 October 2013 in Brussels. This meeting focussed on
presenting the methodology for the study, seeking feedback from the steering committee to
fine-tune the approach and seeking their commitment in convincing their members to make
key data on cooling water use available.
▪ Steering Committee workshops on 10th and 12th of February, 2014 in Brussels. During this
meeting the progress made and challenges encountered were discussed. There were a number
of sector-specific sessions in which the approach was discussed for estimating cooling water
use for plants where no data was available. Furthermore, the sector specific approach to data
gathering was discussed.
Beside these meetings, the project team has had numerous meetings and communications by
telephone and video-conferencing with the various steering committee members individually.
Furthermore, there has been regular interaction through telecommunication and meetings between
the project leads for the DG Environment and for the project on methodology, progress and how to
address challenges encountered.

CESNL13784 End Report 11
2.6 Steering committee interaction and sector commitment
An essential part of the project objectives was the attempt to gather detailed data on cooling water
intake, discharge and consumption from the companies operating in four focus sectors. As there is no
obligation from these companies to share such information, the assistance from the sector
representatives that were part of the steering committee was sought in a series of meetings and
follow-up communications. This process shaped the way in which this pilot project was eventually
implemented as follows:
1. During the first steering committee meeting the sector organisations indicated their willingness
to assist in this pilot project but also their concern that it was unlikely that many of their
membership – businesses in the respective sectors – would be willing to share detailed data on
cooling water use. Furthermore, the sector organisation pointed to the importance of working
with clear definitions, taking into account plant-specific circumstances and appreciating the
specific pros and cons of different cooling water arrangements.
2. The project team proceeded based on these suggestions and sought to convince the
membership of the sector organisations to share data on cooling water use during a series of
sector-specific meetings and/or teleconferences that were organised with the kind assistance of
the sector organisations. Although some businesses signalled their willingness to share data on
cooling water use under some conditions, this effort did not lead to a broad commitment to do
so. The main concerns raised related to the commercial sensitivity of such data and the
potential for future misinterpretation or use for other purposes.
3. During the second steering committee meeting, an attempt was made to define a way forward
that would address these concerns, while allowing the project to achieve its aims in providing
key data as a basis for the water accounts work. This lead to the proposed approach in which
each sector would provide (a) detailed data on cooling water use for an anonymous subset of
plants and (b) key characteristics for all plants that govern cooling water use. This method
(pigeonholing approach, section 6.6) would allow a reasonably well refined way of estimating
cooling water use based these key characteristics, including the type of technology and cooling
water system in place. Based on this approach it was decided that – where values were
estimated – these would be included in the database as a range, instead of a single estimate.
4. The sector organisations have subsequently discussed this approach with their membership to
seek their commitment and to share data accordingly. Revised data gathering questionnaires
were prepared and disseminated. In the power sector – representing the largest number of
facilities and majority of cooling water use - this resulted in broad (although not universal)
commitment to do so. The businesses in the iron and steel sector could not come to universal
agreement on such a step, which – according to the understanding within this sector -
prevented others from committing to taking the step to share data. The refineries sector
organisation was able to share existing detailed yet anonymous data on cooling water use.
Finally, the 2 key subsectors of the chemical industry did not commit to sharing data.
5. Based on the data received the pigeonholing approach was elaborated and implemented, with
remaining gaps filled based on data from literature. Subsequently, detailed data validation
sheets were prepared and the assistance from the sector organisations was sought to request
their membership to review and either confirm or correct the cooling water use values included
for each facility. Within the power sector this process was handled through national focal points
and this lead to detailed feedback from a sizeable share of all EU28 countries. The iron and
CESNL13784 End Report 12
steel sector indicated that their membership were not willing to confirm or comment on the
provided values. The refineries sector indicated that the anonymous that they had provided
earlier was all that they were able to commit to. Finally, some of the subsectors from the
chemical industry responded in general terms but not on a plant-by-plant basis. Secondly,
country-by-country data validation sheets were submitted to and discussed with national
authorities responsible for water management. The feedback received was used to improve the
cooling water use values included in the database.
6. Given the limited willingness of the companies in the four sectors to share data on cooling
water use and the fact that this would clearly require detailed information on plant-specific
circumstances, it was agreed with DG Environment to limit the scope of defining measures to
reduce vulnerability to what is available in current BREF documents.
7. Finally, the feedback from the sector organisations was invited on the draft version of this End
Report that described the approach followed and results achieved. This report also elaborated
the way in which pigeonholing approach had been implemented and cooling water use values
were estimated based on the data provided. Subsequently, the power sector provided detailed
feedback on this report. The chemical industry sector and refineries sector organisations
responded in general terms with some comments and general agreement, respectively. The
End Report was updated and finalised taking into account this feedback received.

CESNL13784 End Report 13
3 Principles of cooling water use
3.1 Need for cooling systems
The present chapter provides a concise introduction into some of the basic principles governing
cooling water systems as well as a set of relevant definitions used in the present study. For detailed
aspects of cooling systems the reader is referred to IPPC’s Reference Document on the application of
Best Available Techniques to Industrial Cooling Systems.
A cooling system is designed to remove excess heat, or unused heat from a process to the
environment. The heat may originate from unused energy from combustion or other exothermal
processes. A cooling system uses heat exchange between the process to be cooled, the cooling
medium and the environment. Often heat exchange is done using air or water, but also other media
are used.
Cooling requirements must be met to ensure reliable and efficient process conditions. This may be a
manufacturing process such as found in the industry, but can also relate to the process of heat
generation used in the power sector. In the power sector the condenser needs to be cooled to enable
the so called Carnot cycle to work and generate power.
There are different types of cooling systems that discharge heat into the environment in different
ways. Dry air cooled systems are designed to dissipate the heat load and discharge this to the
atmosphere. Wet cooling systems are designed to use water as medium and discharge heat into the
air or water depending on the design variant. A once-through design is designed to transfer the heat
to a water body. Water that is taken in from a water body absorbs the heat load and is subsequently
discharged at higher temperatures, which results in some temperature increase of the water body
itself. This water body will subsequently discharge excess heat to its environment over time.
If the wet system uses recirculation of water, typically through the use of a cooling tower, then the
heat is for a large part discharged into the atmosphere. In these cases less heat is released to the
water body.

CESNL13784 End Report 14
3.2 Heat export
A cooling system is used to discharge non-recoverable heat into the environment. As the term says,
it is the part of heat production that is not recovered or cannot be recovered for further use. In many
cases industry and power sector are working to reduce the amount of non-recoverable heat by
improved process management and energy saving investments. An example of this could be
improved catalysis – enabling reactions at lower temperatures, thus reducing heating and cooling
needs.
As a next step, the useful application of as much heat as possible reduces the need for further cooling
need. Systems for further useful application of the heat are:
1. Improved heat integration (in which one process stream exchanges heat with another process
stream through a heat exchanger or over some distance through a pipeline system, thus
reducing the need for external heating and cooling).
2. In other cases heat is exported towards district heating systems providing heating to city
neighbourhoods or agricultural areas.
Combined Heat and Power - Impacts on cooling water use
Combined heat and power generation affects the amount of heat being discharged into the
environment. The technology to use the (waste) heat that is generated is an important factor. There
are two possibilities: backpressure steam turbines and condensing steam turbines. The first option
is the most common type used for CHP generation in the industry (IEA 2005). As seen in Figure 4
(left), in this option typically steam is extracted at the exit of the turbine to supply heat for industry
or district heating. In the case of district heating it is common that exhaust steam from the turbine
condenses in a "hot condenser" where the heat is extracted by the water going to the district hot-
water grid (IEA 2005). This reduces or eliminates the need for further external cooling. In the
second option, see Figure 4 (right), the steam is extracted mid-stage from the turbine for use in
industrial processes or district heating systems. The steam can also be condensed to low
temperature and pressure in a condenser for maximum electricity production. This system is often
used in large power plants, especially in the northern EU countries. Cooling water use then depends
on the type of steam turbine (back pressure or condensing) as well as on the operating mode of the
steam turbine, the power to heat ratio, of CHP production.
Figure 4 Scheme of steam boiler with backpressure (left) and condensing (right) steam turbine CHP power
plant (source: IEA 2005)

CESNL13784 End Report 15
3.3 Quality of cooling water discharge and temperature
Environmental impacts of cooling water discharge are typically associated with either:
▪ Temperature increase of the water body that may have an impact on aquatic life when
exceeding certain limits. Details on temperature in combination with cooling water volumes
would give detailed insights in heat being discharged and process efficiency. This is could be
deemed commercially sensitive and confidential information and is therefore in this pilot study
not taken into account.
▪ Release of small quantities of chemicals that are added to the cooling water to assure a proper
operation of the cooling process. These additives are used to prevent amongst others algae
growth, corrosion or scaling8.
3.4 Basis for selection of cooling system
Each cooling system has advantages and disadvantages that need to be balanced before selecting a
system. Typically, the design of a cooling system is site and process specific. Key factors that
influence the design include:
▪ Cooling requirements of the process, in relation to process efficiency;
▪ Availability and temperature of water that can be used for cooling;
▪ Environmental considerations;
▪ Economics;
▪ Regulatory or permitting constraints;
▪ Geography of the site.
The temperature and quantity of heat that needs to be discharged into the environment has an
important effect on the choice and impact of a cooling system on its environment. According to the
BREF an important distinction is made between cooling systems for low level (10-25ºC), medium
level (25-60ºC) and high level (60ºC) non-recoverable heat. In most cases, wet cooling systems are
applied in case of low level heat and dry cooling systems for high level heat.
As the second main factor the availability and temperature of water are important factors that govern
the choice of a cooling system.
Based on these multiple factors, a number of trade-offs have to be addressed in selecting an
optimum cooling system. The BREF document underlines the fact that these trade-offs have to be
explicitly considered. A summary of some of the key trade-offs are shown in Figure 5 from the BREF
Industrial Cooling Systems. Although this table does not relate to the power sector, a somewhat
comparable set of aspects would have to be considered in that case.
8 The BREF 2001 notes:” The application of additives in open evaporative cooling towers is complex and largely related
to the water balance and the cycles of concentration with which the system is operated. The blowdown is an important measure to correct
the solids balance and plays a role in the optimisation of cooling systems performance and cooling water treatment.”

CESNL13784 End Report 16
Figure 5 Environmental aspects of industrial cooling systems (source: IPPC BREF Industrial Cooling systems
2001).
3.5 Types of cooling system
Seven types of cooling systems can be distinguished using the definitions as provided in the
Industrial Cooling System BREF document (see Table 1). Although this specific BREF table was not
prepared for the power sector (whereas the BREF includes another table that does), it was decided to
use these categories across all four sectors in the present study to ensure consistency. According to
the BREF typically, once-through systems and open recirculating systems are applied to larger plants
in the power and the (petro-) chemical industries. The main principles and application areas of these
cooling systems are provided in the table below, detailed definitions are provided in Table 2.
When considering the different types of cooling systems it is important to keep in mind the following:
1. In many cases plants have more than one cooling system which may be of a different type and
may rely on different sources of cooling water. This may be the result of different part-
processes having different cooling needs, plants having been expanded with new units while
technology or regulations may have changed over time.
2. There are two main classes of cooling systems that were mentioned before once-through
cooling systems versus recirculating cooling systems. When considering a comparable cooling
need, a once-through cooling system requires and order of magnitude greater volume of
cooling water intake than recirculating systems. However, the almost identical greater volume
of water is discharged again, albeit at a higher temperature than at its intake.
3. When considering reduction of cooling water use by using a different type of cooling system,
one needs to take into account that there are trade-offs involved, for example in terms of plant
efficiency (typically lower with recirculating cooling systems) and environmental impacts
(greater release of chemical additives to the environment with recirculating cooling systems).

CESNL13784 End Report 17
Table 1 General principles and application areas of cooling systems (source: BREF 2001).
Cooling System Cooling medium Cooling principle Capacity of process
(MWth)
Open: once-through direct Water Conduction / convection <0.01 ->2000
Open: once-through indirect Water Conduction / convection <0.01 ->2000
Open: recirculating wet system Water/air1,2 Evaporation3 <0.1 ->2000
Closed circuit: dry Air Convection <0.1 ->100
Closed circuit: wet Water/air1,2 Evaporation + Convection 0.2 - 10
Hybrid (wet/dry): open circuit Water/air1,2 Evaporation + Convection 0.15 – 2.5
Hybrid (wet/dry): closed circuit Water/air1,2 Evaporation + Convection 0.15 – 2.5
1Water is the secondary cooling medium and is mostly recirculated. Evaporating water transfers the heat to the air
2Air is the cooling medium in which the heat is transferred to the environment
3Evaporation is the main cooling principle. Heat is also transferred by conduction/convection but in a smaller ratio.
Figure 6 Types of cooling systems characterised in this study (source: BREF 2001).

CESNL13784 End Report 18
Table 2 Definitions of cooling systems characterised in this study (source: BREF 2001).
Table 3 Types of cooling towers.
Cooling Tower type Description
Natural draught cooling tower
Tower where the heated water is cooled through, depending on the cooling
system, sensible and latent heat losses by contact with air
Mechanical draught cooling
tower
Tower where the heated water is cooled through, depending on the cooling
system, sensible and latent heat losses by contact with air. Mechanical cooling
towers use fans to create the airflow
Type Cooling System Description
A Open: once-
through direct
The coolant (i.e. water) is pumped from a source (e.g. sea, river, lake,
groundwater), it passes through a heat exchanger (where heat is transferred from
the process to the coolant through a partition wall), then it optionally passes
through a cooling tower (where the heated water is cooled, through sensible heat
loss, by contact with air) and, finally, it is discharged back to the receiving water.
B Open: once-
through indirect
The primary coolant (i.e. water) is pumped from a source (e.g. sea, river, lake,
groundwater), it passes through a heat exchanger (where heat is transferred from
the secondary cooling circuit to the primary coolant through a partition wall), then
it optionally passes through a cooling tower (where the heated water is cooled
through sensible heat loss by contact with air) and, finally, it is discharged back to
the receiving water. In the secondary circuit, there is another heat exchanger
(where heat is transferred from the process to the secondary coolant through the
partition wall). Please note that, in a plant, there may be tertiary, quarterly, etc.
cooling circuit(s).
C Open: recirculating
wet cooling system
The coolant (i.e. water) is pumped from a reservoir, it passes through a heat
exchanger (where heat is transferred from the process to the coolant through a
partition wall), then it passes through a cooling tower and, finally, it is collected
back in the reservoir.
D Closed circuit: dry The primary coolant (i.e. air) passes through a heat exchanger (where heat is
transferred from the secondary cooling circuit to the primary coolant through a
partition wall) and is released to the atmosphere. In the secondary circuit, there is
another heat exchanger (where heat is transferred from the process to the
secondary coolant through the partition wall). Please note that, in a plant, there
may be tertiary, quarterly, etc. cooling circuit(s). Example: air radiators.
E Closed circuit: wet The primary coolant (i.e. water) is pumped from a reservoir; it passes through a
heat exchanger (where heat is transferred from the secondary cooling circuit to the
primary coolant through a partition wall, which causes latent heat losses) and is
collected back in the reservoir. In the secondary circuit, there is another heat
exchanger (where heat is transferred from the process to the secondary coolant
through the partition wall). There may be tertiary, quarterly, etc. cooling circuit(s)
in a plant.
F Hybrid (wet/dry):
open circuit
The heated cooling water first passes through a dry section of the cooling tower,
where part of the heat load is removed by an air current. Afterwards, water is
further cooled in the wet section of the tower. The heated air from the dry section
is mixed with vapour from the wet section, thus lowering the relative humidity
before the air current leaves the cooling tower, which reduces plume formation.
Combined cooling systems can be operated either as a pure wet cooling tower or as
a combined wet/dry cooling tower, depending on the ambient temperature.
G Hybrid (wet/dry):
closed circuit

CESNL13784 End Report 19
3.6 Sea water cooling and fresh water cooling
Both fresh water from rivers and salt water from the sea are used in cooling systems. In some cases
the proximity of the ocean or sea with a virtually endless supply of water has been an important
factor in deciding the location of a plant with extensive cooling needs. There are also plants that
make use of estuarine water for cooling, with varying degrees of salinity.
In Northern and Western Europe, the ample supply and comparatively low temperature of seawater
allows for efficient cooling. In general, with lower temperatures of the cooling medium, a higher
efficiency of the cooling process can be achieved.
However, in Southern Europe this does not necessarily hold. As fresh water from rivers tends to be
relatively scarce, many plants with extensive cooling needs are situated along the sea. However, sea
water temperatures in shallow coastal water can increase significantly during summer. This has led to
known cases where cooling capacity was constrained during summer due to high intake water
temperatures even as near limitless volumes were available in principle.
Some processes, in particular where there is direct contact between cooling water and a product to
be cooled, require cooling with fresh water to limit contamination of the product to be cooled.
Therefore, sea water cooling cannot be used for these processes. For the sectors under study this
relates mostly to petro-chemical and iron and steel facilities.

CESNL13784 End Report 20
Article, Climate Central, 10 April 2011
In Tennessee, Heat Waves Diminish Nuclear Power Output
Alyson Kenward
On July 8, 2010, as the temperature in downtown Decatur, Alabama climbed to a sweltering 98°F, operators
at the Browns Ferry nuclear power plant a few miles outside of town realized they had only one option to
avoid violating their environmental permit: turn down the reactors. For days, the Tennessee Valley Authority
(TVA), which owns the nuclear plant, had kept a watchful eye on the rising mercury, knowing that more heat
outside could spell trouble inside the facility. When the Tennessee River, whose adjacent waters are used to
cool the reactors, finally hit 90°F and forced Browns Ferry to run at only half of their regular power output,
the TVA hoped the hot spell would last just a few days.
Eight weeks of unrelenting heat later, the plant was still running at half its capacity, robbing the grid of
power it desperately needed when electricity demand from air conditions and fans was at its peak. The total
cost of the lost power over that time? More than $50 million dollars, all of which was paid for by TVA’s
customers in Tennessee.
[…]
With river water so warm, the nuclear plant couldn’t draw in as much water as usual to cool the facility's
three reactors, or else the water it pumped back into the river could be hot enough to harm the local
ecosystem, says Golden. But for every day that the Browns Ferry plant ran at 50 % of its maximum output,
the TVA had to spent $1 million more than usual to purchase power from somewhere else, he says.
What happened in northern Alabama last summer, at the largest of TVA's nuclear power plants, did not
present a human safety concern.
[…]
The Browns Ferry nuclear plant, located
on the Wheeler Reservoir along the
Tennessee River near Athens, Alabama. It
has three reactors, each producing about
1000 megawatts of electricity. Credit:
Nuclear Regulatory Commission.
Source: http://www.climatecentral.org/news/in-tennessee-heat-waves-frustrate-nuclear-power

CESNL13784 End Report 21
Figure 7 Examples of power plants with different configurations of cooling systems. Source: Eurelectric
Figure 8 Example of river based power plant with once-through cooling system equipped with a natural draft
cooling tower (Amer power plant in the Netherlands). Discharge point visible just below cooling tower.
CESNL13784 End Report 22
3.7 Cooling water use variation over time
The use of cooling water over the year can vary strongly over time due to:
a. Changes in production levels, for example in the case of a power plant with a production that
follows the demand for electricity over the course of the day. Fluctuations also result from
plants operating at lower levels or production or units being shut down temporarily for
maintenance turn-arounds or de-bottlenecking projects.
b. Seasonal changes in water temperature at the intake or discharge points. Changes in ambient
temperatures and humidity as well as temperature of water at the intake have a profound
effect on the volume of cooling water that is needed. The availability and temperature of
cooling water also determines whether a facility is able to operate according to plan.
For the facilities in our sample this variation over time is particularly relevant for power plants.
Information on the monthly production of electricity and water use is often considered to be
confidential or too difficult to obtain during the course of this study. The approach therefore
estimates this monthly fluctuation based on typical annual profiles for power plants, differentiated per
EU member state.
3.8 Regulation and permitting of cooling water use
Different regulatory frameworks exist among the EU member states to govern the intake and
discharge of cooling water. These may be water abstraction limits in permitting due to location and
specific limits due to the availability of cooling water from a certain water body. Likewise, emission
limits that prescribe the maximum temperature of discharge or the maximum increase in water
temperature are enforced. There are also examples of the permitting of maximum heat load
(expressed MW discharge) or the maximum heating effect to occur in the receiving water body.
The level of reporting and the requirements of reporting of cooling water intake, discharge and
consumption various from country to country, for example the level of detail and time dimension of
reporting varies considerably.

CESNL13784 End Report 23
3.9 Definitions cooling water intake, discharge and consumption
Various definitions for different elements of cooling systems are used in literature sources. The
present section presents a short list of the main definitions used in the present study, to allow an
appropriate interpretation of the results and comparison against previous studies and future results of
work done in this area. A long list of definitions used is included in Appendix I Definitions.
Cooling water intake: Total gross amount of deliberately abstracted, or withdrawn, water from a
water body or system for the use of cooling. Make-up water for the (recirculating) cooling system is
assumed to be included. Seven types of sources of water are discerned: brackish water, coastal
water, fresh surface water, ground water (deep), ground water (shallow), public water and water
from other facility.
Cooling water discharge: Total gross amount of deliberately released liquid water used for cooling
that is being discharged back into the aquatic environment. Water that leaves the power plant in
gaseous/vapour form or bound into waste and (secondary) products is not considered as part of this.
Seven types of water bodies are discerned into which discharge may occur: brackish water, coastal
water, fresh surface water, ground water (deep), ground water (shallow), public water, water to
other facility. Leaks, losses and rainfall are not taken into account in this study.
Cooling water consumption: Consumptive use of cooling water is calculated as the total amount of
cooling water intake minus the total amount of cooling water discharge. It is the portion of withdrawn
water that is consumed through evaporation, incorporation into a product, or waste materials, such
that it is no longer available for reuse.9
Main operating mode: The power industry is characterised by power plants operating at a range of
different load factors. Both total and specific cooling water use is affected by the mode of operation.
Four different operating modes are discerned based on the annual equivalent full load hours.
Main operating mode Description
Base load ‘base-load’ plant operating in excess of 4000 equivalent full load hours per year
Mid merit mid-merit' plant operating in excess of 1500 equivalent full load hours per year
Peak load Peak load plant operating less than 1500 equivalent full load hours per year
Emergency Plants for emergency use that operate less than 500 hours per year
Export of heat (e.g. heat integration, heat transfer to other facility, district heating): The
capacity to re-use, transfer or export heat to another part of a process, a nearby facility or system,
e.g. a district heating system. The default unit of reporting is MWth.
Facility – power plant: A facility is defined as one or multiple production units that are located at
one site. In the case of a plant the level of reporting is the power plant, and not the individual
9 See also http://www.wri.org/sites/default/files/pdf/aqueduct_metadata_global.pdf

CESNL13784 End Report 24
generating unit. If multiple units (either fired with the same fuel or not) are operating at one site
than aggregated values should be reported.
Facility – iron and steel: a facility, or iron and steel plant, includes all processes and units up to
and including the continuous casting process. Coke, sinter, pellets and pig iron may be procured
externally instead of produced on site. If these (half-) products are produced on-site then those
process are considered to be within the scope of the facility. Downstream processes such as rolling
and forging are assumed to be outside the scope of the facility. Data requests always apply to the full
scope of the facility as defined above.
Facility – refinery or chemical plant: A facility is defined as one or multiple production units that
are located at one site. The level of reporting is at facility level, same level as E-PRTR reporting, and
not the individual unit. If multiple units are operating at one site than aggregated values should be
reported.
Cooling Water versus Process Water: The primary use of cooling water is to discharge excess
heat. Many types of plants use water for multiple purposes, for example as a feedstock, for rinsing or
as a medium for moving other materials. Sometimes it is difficult to make a clear distinction between
cooling water and process water, for example in the case of water used for quenching cokes as part
of iron and steel production or water that is sometimes used in direct contact with the product that
needs to be cooled but serves multiple purposes while doing so. In the present study the distinction is
made according to primary purpose. In case of any sector specific delineation then this is discussed in
the sector-specific chapter.

CESNL13784 End Report 25
4 Selection of plants
4.1 Purpose of selecting plants
Within the scope of the present pilot project, a subset of the most important cooling water users will
be selected. Secondly, the study will set up an inventory method that can be applied beyond this
project to further develop the resulting database by including a longer list of plants. The key to our
approach is the effective use of a combination of relevant existing databases as a starting point and
to select the most relevant water users from these databases. This will allow for covering the bigger
part of European cooling water use in the four focus sectors. The selection process is evaluated as
part of the comprehensive validation steps described in more detail at the end of this report, amongst
other by comparing cooling water use captured in the database with statistical data for a sector or
country.
The E-PRTR database was adopted as the main starting point. For power plants (including nuclear
power stations most of which are not covered in E-PRTR) this information was complemented and
cross-checked with information from a set of different sources:
▪ Large Combustion Plants database,
▪ Geo-localised facility data from online sources, including detailed lists available from
Wikipedia10
▪ Sector-specific plant lists from previous studies online or available at the consultants.
From the full list of facilities in the sectors under study we have selected a sample of facilities to
include in the inventory. This sample was created by selecting cut-off criteria on the production
capacity, used as a proxy for the cooling water use. For each sector this resulted in a short list of
facilities. The cut-off criteria and effect on the coverage of cooling water use in a certain sector is
described in more detail in this chapter.
4.2 Selection of facilities in power sector
The list of power plants selected for detailed analysis was built based on the publicly available E-PRTR
and LCP databases complemented with other online lists of nuclear and non-nuclear power plants.
The geographical coordinates of the power plants in the E-PRTR database are matched with
coordinates in the other databases to allow for cross-checking of information. This coupling procedure
proved to work well, but could not be 100% accurate due to inexact and possibly outdated
information on the power plant’s location in either one or more of the databases. A success-rate of
matching was found to be around 95%.
10 Including, but not limited to:
http://en.wikipedia.org/wiki/List_of_nuclear_power_stations
http://en.wikipedia.org/wiki/List_of_power_stations_in_Europe
http://en.wikipedia.org/wiki/List_of_oil_refineries

CESNL13784 End Report 26
In an earlier endeavour to analyse cooling water use in the power sector the JRC-IET had used a
comparable cut-off value of 100 MWth. For the present study a slightly lower cut off capacity of 50
MWe was applied as a criterion in the power sector. This eliminated relatively small power plants from
the sample. This was assessed to be appropriate for two reasons:
1. The cooling water needs from small power plants tend to be relatively low due to their size
(installed capacity).
2. Smaller power plants are more often equipped with air cooled condenser systems or are
combined heat and power plants that require less or no cooling water for waste heat discharge.
Table 4 shows the most important meta information relating to the sample of power plants under
study. The sample includes 953 power plants with a total installed capacity of 550 GW. Eurelectric
(2011) reports11 a total of nuclear, fossil and biomass/biogas fired capacity of 607 GWe in the EU27.
The list of facilities used in the present study thus covers approximately 90% of the installed capacity
most relevant in relation to cooling water use. The sample includes 408 GW of fossil fired capacity,
which compares with 462 GW reported by Eurelectric for the year 2010. Our list of nuclear capacity
about equals the capacity reported by Eurelectric for the year 2010: 129 GWe.
All in all, the sample size covers a significant part of the installed capacity in the EU, and certainly a
high share of the installed capacity that is most relevant in relation to cooling water use. We estimate
that more than 90% of cooling water use by power plants is covered by the selected sample.
Table 4 Summary of the sample of power plants under study
Aspect Sample in database
E-PRTR for comparison sums from Platts
Powervision
Cut off size for power plants >50 MWe 50 MWth >50 MWe (assumed)
Number of power plants 953 2675 (not including nuclear)
1054
Total installed capacity of thermal combustion power plants
414 GWe Not reported in E-PRTR
448 GWe
Total installed capacity of nuclear power plants
136 GWe Not included in E-PRTR
131 GWe
Total installed capacity 550 GWe Not reported in E-PRTR
579 GWe
Table 4 summarises the list of power plants included in the study and compares these with the total
set of power plants included in E-PRTR database. A comparison with summed information from the
Platts Powervision databases is also included for reference. The E-PRTR list of 2675 was compiled by
selecting ‘Combustion installations > 50 MW’ and ‘Thermal power stations and other combustion
installations’ from the E-PRTR database. The total sample of 953 power plants was compiled based on
E-PRTR, LCP databases, lists available from online sources and input from direct data gathering.
The difference between the E-PRTR sample can partially be explained by the cut-off value. The cut-off
capacity implicit to the E-PRTR database is significantly lower at 50 MWth. It is important to note that
E-PRTR selection does not include auto-producers as separate entities, but rather as part of the
overall plant. This is a potential source of double counting of cooling water use when summing over
11 http://www.eurelectric.org/powerstats2011/

CESNL13784 End Report 27
regions. A second important source of mismatches is the fact that compiling a list building on multiple
datasets was based primarily on geographic coordinates. However, other studies have concluded
before that this location information is not always accurate in E-PRTR.
Also, the following aspects of the sample are important to take into account when reviewing results.
These are simplifying assumptions used in the selection / definition of the facilities considered. With
the underlying reality typically being more complex, these are likely result some inaccuracies and
deviations, in particular in those cases where cooling water use is estimated based on these
characteristics.
▪ Power plant or unit: A power plant can consist of multiple generating units. If multiple units
are installed at one site than total installed capacity of all units is included in the database. It is
important to note that in many cases these have different plant ages and efficiencies.
▪ Characterisation of fuel type: some power plants consist of multiple generating units with
different main fuel inputs and conversion technology. There are some examples of gas, coal
and nuclear fired generation units co-located at the same site. In the database the power plant
is characterised according to its largest generating unit and its primary fuel input.
▪ Operating modes may vary between units on the same location or that may vary over time.
▪ Operational status: all power plants included in the sample were assumed to be operational
in the base year 2010. During the direct data gathering this information was checked and
updated where relevant.
4.3 Selection of facilities in iron & steel sector
All integrated iron and steel works in the European Union are included in the database. Plant
characteristics have been derived from E-PRTR, LCP and listings from earlier studies. Integrated iron
and steel plants consisting of a combination of coke ovens, sinter plants, blast furnaces, BOFs and
continuous casting are treated as one facility. Integrated plants usually comprise all of these sub-
processes. Incidentally, one or more sub-processes may be absent (in these cases some of the
intermediate products are procured externally instead of being produced on-site). Blast furnace
capacity is considered normative for overall steel producing capacity of the integrated plant. In total
our database contains 35 integrated plants. Note that “integrated” is used here in a technical sense,
which may not necessarily match legal/economical/administrative definition. Any combination of
mentioned sub-processes co-located on a single site is considered as one plant, even if the sub-
processes each have different legal owners. Information on past and announced shutdowns,
mothballed/reserved and idle capacity during 2000 to 2013 have been included. Steel producing
capacities of integrated plants range from 1 to 7 Mton annually.
A list of secondary iron and steel plants (EAFs) has also been compiled. Electric arc furnaces are far
more numerous than integrated plants and capacities are smaller (typically around 0.6Mt annually).
Since specific cooling water intake appears on average much lower than that of integrated plants,
only plants with a production capacity above 1Mt/year are included (36 in total). These account for
approximately one third of the total production of secondary EAF steel in Europe.
The integrated and EAF steel plants have been linked to the corresponding FacilityID in the European
Pollutant Release and Transfer Register (E-PRTR). The link with E-PRTR enables retrieving the exact

CESNL13784 End Report 28
location, name and other plant details from E-PRTR. We have used E-PRTR version 5 covering the
years 2001, 2004 (both converted from E-PRTR’s predecessor EPER) and 2007 to 2011. It should be
noted that in several cases a steel plant has been linked to more than one E-PRTR FacilityID number.
There can be several reasons for this, the first being that a certain plant got assigned a new ID
number in E-PRTR because it changed names or has been given a new NationalID and the link
between the old and new situation was not apparent.
This could potentially result in a new E-PRTR FacilityID. Secondly, companies may have been merged
or split up, in an economic sense during the course of the period 2000-2013, sometimes bringing
about a new FacilityID. Another reason is that while multiple sections of a certain plant may be
integrated in a technical sense, in a legal or administrative sense they may not be. This would results
in multiple FacilityIDs for the different sections of the same (integrated) plant.
4.4 Selection of facilities refineries sector
A list of petroleum refineries in the European Union and corresponding capacity, operational in 2013,
is available from the Oil and Gas Journal’s (OGJ) Worldwide Refining Survey and the 2013 BREF
document on oil and gas refining, and online at http://en.wikipedia.org/wiki/List_of_oil_refineries. An
overview of refineries that have recently been shut down (2000 – 2013), which is relevant for
historical water use data series, is available online at: http://abarrelfull.wikidot.com/refineries-that-
are-closed-down.
We have included nearly all refineries located in Europe and in total our list includes 109 plants. This
list includes a variety of different types of refineries that include different ranges of processes on the
site (complexity) and are oriented towards different types of feedstock or products. This variety will
be looked at in more detail in the sector specific Chapter 8.
The petroleum refineries operating have been linked to the corresponding FacilityID in the European
Pollutant Release and Transfer Register (E-PRTR). The link with E-PRTR enables retrieving the exact
location, name and other plant details from E-PRTR. We have used E-PRTR version 5 covering the
years 2001, 2004 (both converted from E-PRTR’s predecessor EPER) and 2007 to 2011. It should be
noted that in several cases a refinery has been linked to more than one E-PRTR FacilityIDs.
There are several reasons for this:
1. A refinery obtained a new ID number in E-PRTR because it changed names or has been given a
new NationalID and no link between the old and new situation was provided, resulting in a re-
entering of the plant in the database under a different FacilityID.
2. Companies may have merged or split, requiring a new FacilityID.
3. While multiple parts of a plant may be integrated in a technical sense, in a legal sense they
may not be, resulting in multiple FacilityIDs for the same refinery.

CESNL13784 End Report 29
4.5 Selection facilities in chemical sector
The chemical sector is very diverse with numerous types of products produced and processes in use.
The present pilot study focusses on 3 sub-sectors to limit range of facilities considered. These sub-
sectors have been selected, primarily based on the associated aggregated cooling needs and within
each sub-sector a number of the most important facilities have been identified:
▪ Ammonia 38 facilities
▪ Ethylene 33 facilities
▪ Hydrogen 77 facilities
The first step towards this selection was estimating the total cooling need for the most important
production processes in the chemical industry from various literature sources. The indicative results
of this step are shown in Figure 10. It is important to note that this cooling need is but a proxy for
the cooling water requirement, as site specific situations regarding cooling system and water
recirculation will have large effects on the actual cooling water intake, consumption and discharge.
The next step towards a selection was to combine the specific cooling needs per process with the
annual production estimates. We have pre-selected the high volume chemicals for this calculation as
we anticipate that these chemicals are the largest demand for cooling and with it for cooling water.
The result of this selection process is shown in Figure 9 and should be regarded as indicative only.
Figure 9 Indicative annual total cooling requirement for different branches of high volume chemicals sector,
expressed in PJ heat discharge per ton product. Ranges include different production processes.
0 100 200 300 400 500 600 700
ton hydrogen
ton ethylene
ton ammonia
ton nitric acid
ton ammonium nitrate fertiliser
ton PE
ton chlorine product (1.5 ton 76% caustic soda)
Annual heat load
(PJ/ year)
High
Central
Low
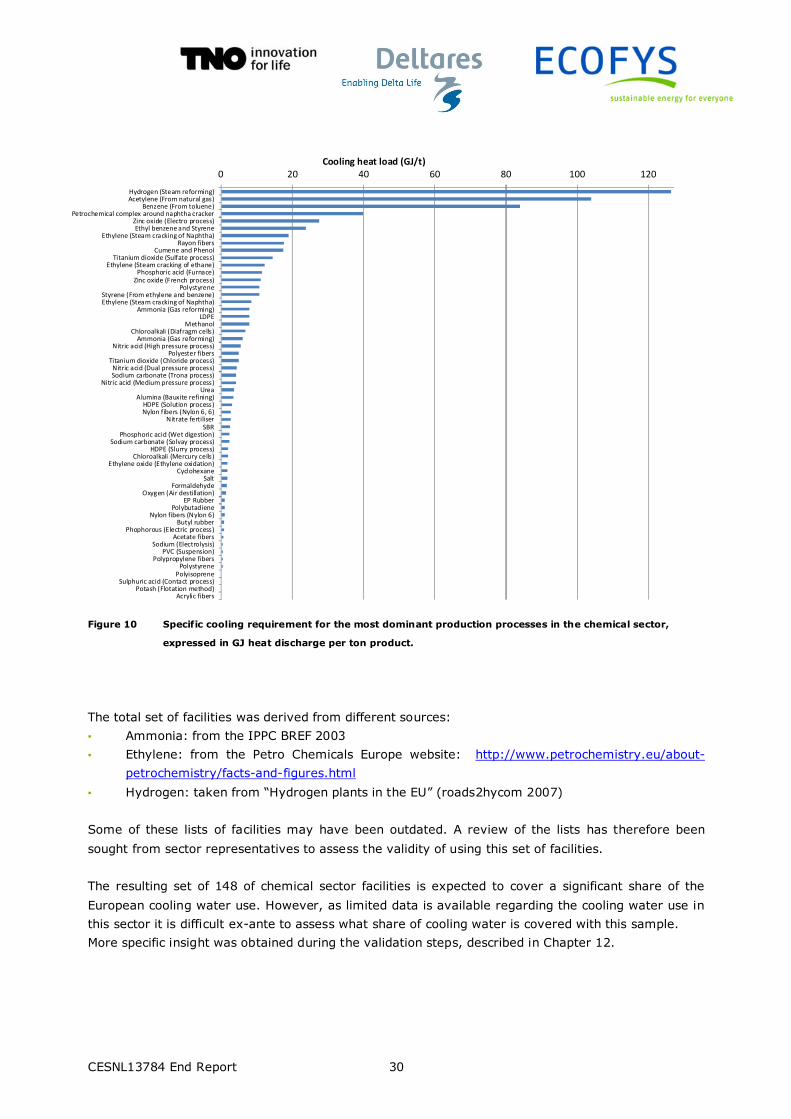
CESNL13784 End Report 30
Figure 10 Specific cooling requirement for the most dominant production processes in the chemical sector,
expressed in GJ heat discharge per ton product.
The total set of facilities was derived from different sources:
▪ Ammonia: from the IPPC BREF 2003
▪ Ethylene: from the Petro Chemicals Europe website: http://www.petrochemistry.eu/about-
petrochemistry/facts-and-figures.html
▪ Hydrogen: taken from “Hydrogen plants in the EU” (roads2hycom 2007)
Some of these lists of facilities may have been outdated. A review of the lists has therefore been
sought from sector representatives to assess the validity of using this set of facilities.
The resulting set of 148 of chemical sector facilities is expected to cover a significant share of the
European cooling water use. However, as limited data is available regarding the cooling water use in
this sector it is difficult ex-ante to assess what share of cooling water is covered with this sample.
More specific insight was obtained during the validation steps, described in Chapter 12.
0 20 40 60 80 100 120
Hydrogen (Steam reforming)Acetylene (From natural gas)
Benzene (From toluene)Petrochemical complex around naphtha cracker
Zinc oxide (Electro process)Ethyl benzene and Styrene
Ethylene (Steam cracking of Naphtha)Rayon fibers
Cumene and PhenolTitanium dioxide (Sulfate process)
Ethylene (Steam cracking of ethane)Phosphoric acid (Furnace)
Zinc oxide (French process)Polystyrene
Styrene (From ethylene and benzene)Ethylene (Steam cracking of Naphtha)
Ammonia (Gas reforming)LDPE
MethanolChloroalkali (Diafragm cells)
Ammonia (Gas reforming)Nitric acid (High pressure process)
Polyester fibersTitanium dioxide (Chloride process)
Nitric acid (Dual pressure process)Sodium carbonate (Trona process)
Nitric acid (Medium pressure process)Urea
Alumina (Bauxite refining)HDPE (Solution process)Nylon fibers (Nylon 6, 6)
Nitrate fertiliserSBR
Phosphoric acid (Wet digestion)Sodium carbonate (Solvay process)
HDPE (Slurry process)Chloroalkali (Mercury cells)
Ethylene oxide (Ethylene oxidation)Cyclohexane
SaltFormaldehyde
Oxygen (Air destillation)EP Rubber
PolybutadieneNylon fibers (Nylon 6)
Butyl rubberPhophorous (Electric process)
Acetate fibersSodium (Electrolysis)
PVC (Suspension)Polypropylene fibers
PolystyrenePolyisoprene
Sulphuric acid (Contact process)Potash (Flotation method)
Acrylic fibers
Cooling heat load (GJ/t)

CESNL13784 End Report 31
4.6 Resulting list of selected facilities
The starting point of this study was to make an inventory of power plants (in specific nuclear power
plants) and industrial facilities included in E-PRTR where water is used for cooling in the whole EU
territory (including ultra-peripheral regions). The Terms of Reference mentioned a preliminary
estimate of 2,000 facilities based on E-PRTR database.
Based on the selection process described in the previous section, the following total number of plants
results, broken down per sector in Figure 11. Clearly the set of power plants dominate the sample
with 953 out of 1,281 facilities. This set is expected to cover a significant share of facilities located at
water bodies and covering a substantial share of total cooling water use. The difference with the
preliminary number mentioned in the ToR is explained by the common occurrence of multiple E-PRTR
IDs related to co-located parts of plants that are treated as single facilities in the present project.
Figure 11 Facilities included in the sample considered in the present pilot study.

CESNL13784 End Report 32
Figure 12 Overview of the selected facilities in the sectors: Power, Iron and Steel, Chemical and Refineries in
Europe. Note that this overview does not show the facilities in the ultra-peripheral regions.

CESNL13784 End Report 33
4.7 Example data coverage with cut-off criterion of cooling water for Rotterdam area
When inventories of thermal discharges are made, researchers often ignore the smaller discharges.
In other words a cut-off criterion is applied. The reason for this approach may be related to the
limited availability of data and on the other hand to the additional effort required to collect a larger
number of these smaller contributions. In this study all discharges below 50 MW are excluded. That,
in principle, leads to a systematic error (bias) of the overall heat load estimated that way. In this
section we make an attempt to quantify this bias for an industrialised region within The Netherlands.
The results may serve to validate the overall cut-off criterion used in this pilot study. For this
purpose, the following two data sources of thermal discharges are used:
1. An inventory of the Dutch thermal discharges from power plants to surface water for the years
2000-2005 using a cut-off criterion of 1.0 MW made by RIZA (RIZA, 2006). The set contains
permitted values.
2. In 2011 KEMA updated the RIZA inventory (data source 1). For the electricity production
system the thermal discharges are corrected using the most recent information available at
KEMA based on actual data of the Dutch grid operator (TenneT) for the years 2005-2010. For
industrial thermal discharges an update was made on the basis of the latest information
available at the regional directorates of the ministry of infrastructure and environment
(Rijkswaterstaat) which are responsible for the authorization of these discharge permits. The
cut-off criteria used in this inventory is 10 kW thermal. This data set contains both permitted
and actual thermal discharges.
Here we consider the thermal discharges in the Rotterdam Port area in the Netherlands, while we
distinguish:
1. source-1 permitted >1.0 MW ±7500 MW from 50 discharge locations (2000-2005)
2. source-2 permitted >10kW ±9000 MW from 100 discharge locations (2005-2010)
3. source-2 actual > 10 kW ±4550 MW from 100 discharge locations (2005-2010)
Figure 13 shows the individual magnitude (MW) of 50 permitted thermal discharges to surface water
in the Rotterdam harbour area from data source 1 on the vertical axis, against the total thermal heat
input as a percentage on the horizontal axis whereby 100% is the equivalent of 7500MW. The graph
is cut in two parts showing magnitudes up to 100 MW on the left axis and larger ones on the right
axis. Figure 13 shows that thermal heat inputs up to 50 MW sum up to about 7% of the total
permitted discharges in the area resulting in a bias of 7% when using a cut of value of 50MW.
Figure 14 shows the same type of graph for data source 2. When looking at the curves for the
permitted discharges within this figure, it follows that thermal heat inputs up to 50 MW now sum up
to about 8% of the total permitted discharges in the area. This value differs somewhat from the 7%
value obtained for data source 1 (Figure 13) and can only partly be explained by the difference in the
data source. The fact that data source 2 contains a number (31) of thermal discharges smaller than 1
MW that was not included in data source 1 explains only 15 MW (the sum of the 31 additional
discharges) which is only 0.2% of the total. Apparently differences result from other aspects of the
update of the inventory as well.

CESNL13784 End Report 34
Figure 13 Magnitude (MW) of individual heat discharges to surface water in Rotterdam harbour area (data
source 1 permitted values) against total heat input as % (100 % = 7000 MW) on horizontal axis.
Figure 14 Distribution of the magnitude (MW) for 100 heat discharges to surface water in the Rotterdam harbour
area (data source 2). Permitted discharges (light colour) and actual discharges (dark colour) plotted
on two vertical axis (dashed on left-axis and solid on right-axis).

CESNL13784 End Report 35
Figure 14 shows that thermal heat inputs up to 50 MW sum up to about 14% of the total actual
discharges in the area (other values are 100 MW ~ 25%, 200 MW ~ 40% of the total). The difference
with the cut off value obtained for permitted discharge <50 MW (8%) is significant. This is caused
by a change in the frequency distribution of the discharges as shown in Figure 15. Figure 15 shows
that actual discharges occur at lower magnitude of thermal heat inputs compared to permitted
discharges therefore the smaller discharges are relatively more important for actual heat discharges.
Figure 15 also shows that smaller (<100 KW) thermal heat inputs are indeed present and are an
indication that the inventory used here gives the best and a nearly complete picture of the thermal
inputs to the area. Therefore, the calculated effect of 14% when using a cut off valued of 50 MW may
be considered a maximum value that is likely to overestimate the actual value somewhat.
Figure 15 Frequency distribution of the magnitude (MW) for 100 heat discharges (data source2, permitted and
actual) to surface water in the Rotterdam harbour area.
CESNL13784 End Report 36
5 Matching facilities to water bodies
5.1 Water body data in ECRINS
This section describes the procedure that was used to assign the selected list of facilities used in this
pilot study to the European Catchments and RIvers Network System (ECRINS) database and the
specific water bodies defined therein. The first step is the mapping of the selected facilities. This was
implemented based on the geographic coordinates of the facilities as derived from the E-PRTR
database and other databases.
The following ECRINS v1.1 data layers have been used (see for more information (EEA, 2012):
▪ C_ZHYD: containing CCM2 based catchment polygons;
▪ C_TR: containing river segments;
▪ C_LAK: containing lake polygons;
▪ RBD_Int_Clp: containing River basis districts
The purpose of the coupling of facilities with water bodies is to determine which type of water body a
given facility is most likely abstracting from and discharging to. The water body is assumed to be the
closest one to the facility and inside the same catchment. Facilities located closer to the coastline
than to a river or lake are assumed to discharge directly into the sea.
This coupling procedure was performed with an Arcpy script performing following actions:
▪ For each facility, determine the catchment it is located in
▪ Find all rivers and lakes contained in that catchment
▪ Compute the distances between the facility and the selected rivers and lakes
▪ If the catchment has a coastline, compute the distance between facility and coastline
▪ Link the facility to the nearest river, lake or coast if applicable.
▪ Manual distinction between coastal and transitional waters. Facilities located in coastal waters
are linked to coast, facilities located in a transitional area where not all water bodies are
defined in ECRINS are linked to transitional.
As a result, the facility dataset will be extended with additional fields:
IDRV ID of river if linked to a river, else NULL
IDLK ID of lake if linked to a lake, else NULL
COAST 1 if containing catchment has a coastline, else 0
DISTRV Distance to closest river in containing catchment, -1 of none.
DISTLK Distance to closest lake in containing catchment, -1 of none.
DISTCS Smallest distance to coastline of containing catchment, -1 if none
ZHYD ID of containing catchment
RBD ID of containing River basin district
LNKTO Label indicating what the facility was linked to [‘river’, ‘lake’, ‘coast’, ‘transitional’]

CESNL13784 End Report 37
Field LNKTO will be “sea” for facilities located outside any catchment and “nothing” for facilities
located in a catchment without any river or lake and not connected to a coastline.
This information is used to estimate the type of water body that is used for cooling water intake and
discharge if no site specific information is provided by direct data gathering.
5.2 Challenges in matching facilities with water bodies
Coordinates as provided in the E-PRTR database typically refer to the geographical centre of the site
of the facility, not their specific cooling water discharge or intake points. As a consequence, the
coordinates of the location in E-PRTR give a precision of the order of at least ± 500 meters.
Also other mistakes or irregularities in the E-PRTR coordinates were observed. It is for example
known from previous projects that in some cases the coordinates of the postal address of the facility
are submitted in E-PRTR.
After aligning with EEA, it was decided to use ECRINS version 1.1 as part of the present project. The
EEA is currently working on an updated version (v1.5), but this version is not available yet. However,
the ECRINS v1.1 has a number of limitations, which are described in more detail in the following
section.
5.3 Main limitations of ECRINS database related to this project
Only the bigger rivers/streams/lakes are available in ECRINS. All facilities have to be matched to
available streams or lakes in ECRINS. Facilities with an intake or discharge of cooling water to a
smaller stream, not available in ECRINS, are not matched correctly or cannot be matched at all.
Figure 16 illustrates this in a Dutch example. The left picture shows the match made between the
E.on power facility and the ECRINS water system (a lake in this case) in the way as described on the
previous page. The picture on the right shows also the smaller existing streams (not covered in
ECRINS) in the neighbourhood of the power plant on a Top10 vector map. The facility discharges in
reality to the “Oude Rijn”, a small river which is not covered by ECRINS. This is likely to result in a
limitation of the results from the pilot study, as in particular a large water extraction or a large
temperature discharge in combination with a smaller water system will potentially have a high
vulnerability.
Transitional waters are (often) not included in ECRINS, at least for the Netherlands and Belgium. For
example, in the ports of Antwerp and Rotterdam, with a lot of industry that requires cooling water,
gaps in water body’s definition in ECRINS were apparent. The left slides in Figure 17 show the
ECRINS situation, the right slides show the “real” situation. For the port of Rotterdam a Top10 vector
map is used. The white parts on the left map are not designated in ECRINS as water systems,
although these areas consist of WFD water bodies. Also a part of the land (catchment) is missing in
ECRINS as well. On the right map the white area is land (harbour), where a number of relevant
facilities is located. The Corine Land Cover map (CLC2006) is used for the port of Antwerp. The white
areas on the left map are transitional waters and not present in ECRINS. The consequence is that in

CESNL13784 End Report 38
both situations the intake and discharge of cooling water cannot be assigned to surface water in
ECRINS.
Furthermore, coastal waters are missing in ECRINS v1.1 (see for example Figure 18. Port of
Rotterdam, left map). It would be useful to add the coastal waters in ECRINS and to distinguish
between the transitional waters and the coastal water systems. In general, the expected vulnerability
in the coastal waters will be less than transitional waters, due to the larger dimensions of the coastal
systems.
For the Netherlands, the position of the main rivers Meuse and Rhine is not correctly included in the
ECRINS ‘main_river’ map. This seems to be the result of a combination of missing water bodies and
omission of transitional waters in ECRINS. Instead of flowing into the North Sea, these end in the
middle of the Netherlands, see Figure 18 where the situation is indicated with an A.
For this project it is a serious problem because there seems no hydrological connection between
different water bodies in these cases. Important water bodies for the Meuse and Rhine are missing,
indicated with a B. The real (more detailed) Dutch situation is shown in Figure 19, where a Top10
vector map is used.
The map for “river_network” contains only information about the geographical location. Only the
shape length of the water bodies is included in the table. There is no information available about
flows, the amount of water or characteristics of the water bodies or temperature. This data is
therefore not available and with it limits possible further assessment of (cooling) water availability,
for instance in an assessment of the vulnerability of facilities to changes in water availability and
temperature.
Another problem that was encountered is that not all the River Basins are present in the ECRINS: for
example a large River District in the Balkan area is missing, see Figure 20.
The subunits of the River Basin Districts are not covered in ECRINS. In ECRINS v1.1 only a layer with
the River Basin Districts is available. Also no link is available with the WFD Water Bodies. For the
project, communication with Member States and sector organisations about intake and discharge
points of the cooling water would be useful. Therefore names for all (important) rivers and lakes per
country are needed. In ECRINS, river names are only defined for a number of large trans-boundary
rivers, not for all rivers. Furthermore, names are only defined for about 23000 of the 1,2 million
smaller water parts (segments). Names are not defined for all the lakes. For these segments we only
have an ID number. This limits the possibility to effectively communicate with stakeholders (i.e.
sector organisations, national water institutes, facility owners) on the relevant water bodies from
which cooling water is abstracted and cooling water is discharged to.
The limitations of the ECRINS database discussed here limit the possibilities to link plants / facilities
to specific water bodies in the ECRINS database. As part of the future Water Accounts work, this
limits the amount of information available to aggregate cooling water use per catchment area and
vulnerability.

CESNL13784 End Report 39
Given the anticipated planning of updating the ECRINS database it is not considered realistic that a
new version of ECRINS can be used in this study. The team will proceed as follows, based on the
information that is available:
▪ When a cooling water location clearly matches a nearby ECRINS water body, the corresponding
water body ID will be linked to this point.
▪ When a cooling water location clearly matches a coastline from the XX map, the corresponding
water body will be labelled as sea.
▪ When a cooling water location cannot be matched in either of the above ways – likely because
it is in a transitional area where not all water bodies are defined in ECRINS, or because it is tied
to a small river not defined in ECRINS, it will be flagged as such.
▪ In all cases the X,Y coordinates for the cooling water (withdrawal / discharge) locations will be
the most reliable indicator of the associated water body. This could be used in future updated
versions of ECRINS to improve the matching with water body IDs or matching with sub-
catchment areas.
▪ In all cases the facilities will be matched to the ECRINS catchments (using the X,Y
coordinates), except in the cases the location is outside the catchment schematisation as
mentioned in the bullets above.
Figure 16 The assignment of the E.on facility with ECRINS layers (segments/lakes) on the left and a Top10
Vector map which shows also a large number of smaller water systems on the right.

CESNL13784 End Report 40
Figure 17 Comparison of the Ports of Antwerp and Rotterdam in ECRINS versus the port of Rotterdam in a top10
vector map and the port of Antwerp in the CLC2006 map.

CESNL13784 End Report 41
Figure 18 ECRINS situation for rivers Meuse and Rhine
in the Netherlands.
Figure 19 Actual situation in the Netherlands based on a
Top10 vector map.
Figure 20 Missing river basin district area in the Balkan.

CESNL13784 End Report 42
6 Cooling water use in power sector
6.1 Plant characteristics power sector
Electrical power plays an essential role in our society and economy. Power generation has
traditionally relied and continues to rely to a large extent on coal, oil, gas or nuclear powered
technology, all of which require cooling. The output of power plants is measured in MWh of electricity
delivered to the grid. This output is related to the net installed capacity of the power plant (net MWe)
and the plants operating hours, noting that power plants operate on partial load as well. The
operating mode is an indicator of the type of operation and is related to the number full load hours
per year.
Electricity production needs to be balanced with consumption at all times, with very little storage in
the system. Because of this the value of MWh produced varies of time, which is reflected in prices on
the wholesale electricity market: typically high when demand is high and low when demand is low
relative to the available production capacity. Owners of power plants decide on the production of each
plant based on current power prices in the electricity market in relation to the marginal cost of
operating the plant or specific supply commitments.
As a consequence, typically the operating mode and number of full load hours depends on the type of
technology / fuel and generation costs/MWh and this balance may pan out slightly differently from
country to country. Equivalent full load hours for different types of power plants (see ‘Definitions’ for
a detailed description of the type of power plants) would therefore need to be assessed using country
specific information, such as reported by Eurelectric (Power Statistics 2010). When country specific
information is not available then the average value as reported for the other EU countries could
possibly be used as a basis for estimating an operating regime.
In this study the operating mode is categorized into four categories: base load, mid-merit, peak load
and emergency. The definition of the operation mode and the number of equivalent full load hours
per year is presented in Table 5. Whether a power plant runs at base load or peak load thus indicates
the number of operating hours per year, which has a profound effect on the cooling water use.
Table 5 Modes of power plant operation as used in this study
Main operating mode Description
Base Load Base-load plant operating in excess of 4000 equivalent full load hours per year
Mid-merit Mid-merit plant operating in excess of 1500 equivalent full load hours per year
Peak load Peak-load plant operating less than 1500 equivalent full load hours per year
Emergency Plants for emergency use that operate less than 500 hours per year
Definitions are based on definitions provided in BREF LCP (June 2013), UK Environment Agency and Directive
2010/75/EU12
12 http://eippcb.jrc.ec.europa.eu/reference/BREF/LCP_D1_June2013_online.pdf

CESNL13784 End Report 43
Secondly, the power plant operation is influenced by the seasonal variations in demand for electricity
and heat resulting in a load profile. Data from ENTSO-E (2013)13 gives an impression on how load
varies over the months for different generation technologies. The dataset by ENTSO-E includes
country specific production of electricity by fuel source, on a monthly basis. With this information it is
possible to estimate an annual load curve for the various types of power plants. The level of data
coverage across the EU is not consistent, however. Data is not always available per fuel source which
limits assessing accurately and consistently the (difference in) annual load profile for natural gas, coal
and biomass fired power plants.
The figure below shows an example for the annual production profiles of different types of power
plants in the UK, differentiated based on their main fuel input. To guide interpretation: the graph
clearly shows that oil fired capacity was use was concentrated in only part of the year: mostly in the
winter months (January, February and March) when the system margin price (demand related) is
sufficiently high enough to cover the high cost of oil.
Figure 21 Example of production profiles for different power plants based on the fuel used varying over the year.
This graph shows for each month the percentage of the total annual production for the different type
of power plants for the UK in 2010 and is based on data provided by ENTSO-E.
http://www.environment-agency.gov.uk/static/documents/Business/UKTWG2_Final_mid_merit.pdf
http://eur-lex.europa.eu/LexUriServ/LexUriServ.do?uri=OJ:L:2010:334:0017:0119:EN:PDF 13 https://www.entsoe.eu/data/data-portal/production/
0%
5%
10%
15%
20%
25%
30%
35%
40%
Jan Feb Mar Apr May Jun Jul Aug Sep Oct Nov
Sh
are
of
ann
ual p
rod
ucti
on
Biomass and waste
Hard coal
Natural gas
Lignite
Nuclear
Oil
Pro
du
ctio
n p
er
mo
nth
as %
of
tota
l year
pro
du
ctio
n
per
type o
f p
lant
CESNL13784 End Report 44
6.2 Key factors governing cooling water use in the power sector
The water requirement in a power plant can be divided into process and cooling water. For water
cooled plants, the gross use of cooling water surpasses the use for boiler make-up water significantly.
Nonetheless, water use in other systems (such as wet ash transport or flue gas desulfurization) may
require volumes of water that are significant in the overall water use characteristics of a plant.
Cooling water intake and discharge is based on the required heat discharge of the power plant. The
most important factor that dominates the specific cooling need is the thermal efficiency of the power
plant as this determines how much heat is not being converted into a valuable product. Most plant
operators regard the thermal efficiency value for their plant as commercially sensitive information.
The second important parameter is the share of waste heat being discharged into the air and into the
cooling water, which is influenced by the installed cooling system at a site and by the type of power
plant. A detailed description and definition of the different types of cooling systems discerned in this
study are provided in section 3. Beside the cooling system, the export of heat or combined heat and
power configuration has a profound effect on the waste heat discharge. In these cases the waste heat
from the power plant is put to productive use, for example as input in industrial processes or for
district heating purposes. This lowers the amount of heat being discharged at the site and lowers the
cooling need.
The selection of the type of cooling system typically depends on geographical and seasonal effects.
The geographical situation of a power plant determines the access to sufficient cooling water in the
form of fresh or salt (or brackish) water. The amount and temperature of the intake water and its
temperature are likely to vary from year to year or over the course of the seasons. Other seasonal
effects are the temperature and humidity which affects the cooling capacity of the cooling system.
The cooling system design needs to accommodate these annual and seasonal variations in order not
to reduce its capacity to operate within the limits of the permit and also to ensure plant efficiency is
not compromised unduly.
In some cases, power plants may have multiple cooling systems installed at the site and have the
ability to switch from one cooling system to the other when meteorological circumstances allow. For
example, a power plant may operate using once-through cooling if water availability is unconstrained
and switch to operating a recirculating cooling system with cooling towers when cooling water
availability is limited. However, such arrangements may not always be technically feasible and come
at additional costs that affect economic viability of a plant.
Next to technological, geographical and seasonal effects there are also market effects that influence
the specific cooling water need of power plants. Thus, the cooling water need as measured in
m3/MWh tends to increase when the power plant runs at partial load due to decrease in conversion
efficiency. However, the volume of cooling water in absolute terms (m3) does tend to be lower with
lower power production.
In summary, the type of power plant, plant efficiency, heat export and configuration of the cooling
system as the main factors determining the specific cooling need of a power plant. This in turn affects
consumption of cooling water, i.e. not being discharged back into a water body.
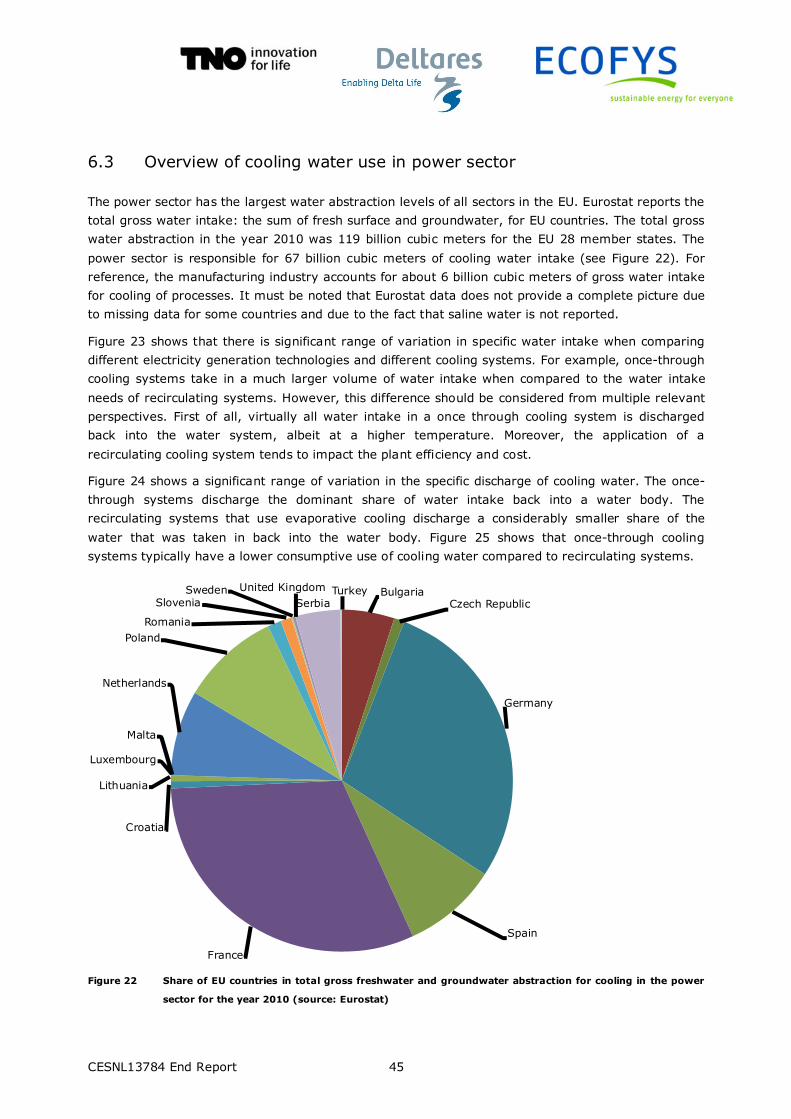
CESNL13784 End Report 45
6.3 Overview of cooling water use in power sector
The power sector has the largest water abstraction levels of all sectors in the EU. Eurostat reports the
total gross water intake: the sum of fresh surface and groundwater, for EU countries. The total gross
water abstraction in the year 2010 was 119 billion cubic meters for the EU 28 member states. The
power sector is responsible for 67 billion cubic meters of cooling water intake (see Figure 22). For
reference, the manufacturing industry accounts for about 6 billion cubic meters of gross water intake
for cooling of processes. It must be noted that Eurostat data does not provide a complete picture due
to missing data for some countries and due to the fact that saline water is not reported.
Figure 23 shows that there is significant range of variation in specific water intake when comparing
different electricity generation technologies and different cooling systems. For example, once-through
cooling systems take in a much larger volume of water intake when compared to the water intake
needs of recirculating systems. However, this difference should be considered from multiple relevant
perspectives. First of all, virtually all water intake in a once through cooling system is discharged
back into the water system, albeit at a higher temperature. Moreover, the application of a
recirculating cooling system tends to impact the plant efficiency and cost.
Figure 24 shows a significant range of variation in the specific discharge of cooling water. The once-
through systems discharge the dominant share of water intake back into a water body. The
recirculating systems that use evaporative cooling discharge a considerably smaller share of the
water that was taken in back into the water body. Figure 25 shows that once-through cooling
systems typically have a lower consumptive use of cooling water compared to recirculating systems.
Figure 22 Share of EU countries in total gross freshwater and groundwater abstraction for cooling in the power
sector for the year 2010 (source: Eurostat)
BulgariaCzech Republic
Germany
Spain
France
Croatia
Lithuania
Luxembourg
Malta
Netherlands
Poland
Romania
SloveniaSweden United Kingdom
SerbiaTurkey

CESNL13784 End Report 46
Figure 23 Specific water intake for various combinations of electricity generating technologies and cooling
system. Source: Macknick et al (2012)
Figure 24 Specific water discharge for various combinations of electricity generating technologies and cooling
systems. Source: Macknick et al (2012)
0
50
100
150
200
250
Nucle
ar-R
ecirc
ula
ting
Nucle
ar-O
nce
-thro
ugh
Nucle
ar-P
ond
Natu
ral g
as co
mbin
ed c
ycle
-Recirc
ula
ting
Natu
ral g
as ste
am
boile
r-Rec
ircula
ting
Natu
ral g
as co
mbin
ed c
ycle
-Once-th
rough
Natu
ral g
as s
team
boile
r-Once
-thro
ugh
Natu
ral g
as co
mbin
ed cy
cle-P
ond
Natu
ral g
as co
mbin
ed c
ycle
-Dry
Hard
coal g
eneric-R
ecircu
latin
g
Hard
coal su
bcritica
l-Recircu
latin
g
Hard
coal s
upercritica
l-Recircu
latin
g
Hard
coal g
eneric-O
nce
-thro
ugh
Hard
coal s
ubcritica
l-Once
-thro
ugh
Hard
coal s
upercritica
l-Once
-thro
ugh
Hard
coal g
eneric-P
ond
Hard
coal su
bcritic
al-P
ond
Hard
coal s
upercritica
l-Pond
Bio
mass a
nd w
aste
-Recircu
latin
g
Bio
mass a
nd w
aste
-Once
-thro
ugh
Bio
mass a
nd w
aste
-Pond
m3/
MW
h
Intake
min
median
max
0
50
100
150
200
250
Nucle
ar-R
ecircu
latin
g
Nucle
ar-O
nce-th
rough
Nucle
ar-P
ond
Natu
ral g
as co
mbin
ed c
ycle
-Recircu
latin
g
Natu
ral g
as ste
am
boile
r-Recircu
latin
g
Natu
ral g
as co
mbin
ed cy
cle
-Once
-thro
ugh
Natu
ral g
as ste
am
boile
r-Once
-thro
ugh
Natu
ral g
as co
mbin
ed c
ycle
-Pond
Natu
ral g
as co
mbin
ed c
ycle
-Dry
Hard
coal g
eneric-R
ecircu
latin
g
Hard
coal su
bcritica
l-Recircu
latin
g
Hard
coal su
percritic
al-R
ecircu
latin
g
Hard
coal g
eneric-O
nce
-thro
ugh
Hard
coal su
bcritica
l-Once
-thro
ugh
Hard
coal su
percritic
al-O
nce
-thro
ugh
Hard
coal g
eneric-P
ond
Hard
coal su
bcritica
l-Pond
Hard
coal su
percritic
al-P
ond
Bio
mass a
nd w
aste
-Recircu
latin
g
Bio
mass a
nd w
aste
-Once
-thro
ugh
Bio
mass
and w
aste
-Pond
m3
/M
Wh
Discharge
min
median
max

CESNL13784 End Report 47
Figure 25 Specific water consumption for various combinations of electricity generating technologies and cooling
systems. Source: Macknick et al (2012)
0
1
2
3
4
5
Nucle
ar-Recircula
ting
Nucle
ar-Once-th
rough
Nucle
ar-Pond
Natu
ral gas co
mbin
ed cy
cle-R
ecircu
latin
g
Natu
ral gas steam
boiler-R
ecirculatin
g
Natu
ral gas co
mbin
ed cy
cle-O
nce-th
rough
Natu
ral gas steam
boiler-O
nce-thro
ugh
Natu
ral gas co
mbin
ed cycle-Po
nd
Natu
ral gas co
mbin
ed cy
cle-Dry
Hard
coal ge
neric-R
ecircula
ting
Hard
coal su
bcritica
l-Recircu
lating
Hard
coal su
percritica
l-Recircula
ting
Hard
coal ge
neric-O
nce
-thro
ugh
Hard
coal su
bcritica
l-Once
-thro
ugh
Hard
coal su
percritica
l-Once-th
rough
Hard
coal g
eneric-P
ond
Hard
coal sub
critical-P
ond
Hard
coal su
percritica
l-Pond
Bio
mass an
d w
aste-R
ecirculatin
g
Bio
mass an
d w
aste-O
nce-throug
h
Bio
mass a
nd w
aste-Po
nd
m3/
MW
h
Consumption
min
median
max

CESNL13784 End Report 48
6.4 Identification of cooling system
As the type of cooling system may make an order of magnitude difference in the cooling water
intake, the identification of the correct cooling system for any individual plant is essential. To the
extent available, the type of cooling system was identified based on feedback from the
questionnaires. However, this data was far from complete while the type of cooling system does have
a major impact on the cooling water intake volumes. Therefore, information on the cooling system
per facility was gathered through the survey, through GIS modelling and by visual recognition using
geographical mapping software, i.e. Google Earth for the selected list of power plants.
An example of the visual recognition is presented in Figure 26. During the visual recognition we made
a distinction where possible between a natural draft and force draft cooling tower. The results from
the visual survey are presented in Figure 27. This clearly indicates that the largest share of power
plants is equipped with a cooling tower. We assumed a recirculating cooling system when a cooling
tower was present and a once-through cooling system when no cooling tower was observed.
There are two important sources of inaccuracies in this assessment that have to be carefully
considered when interpreting the results from this pilot study:
1. The method will probably yield good results for identifying power plants with a large natural or
mechanical draught cooling tower in place. However, the accuracy in identifying plants with
cell-type mechanical draught cooling towers (e.g. many CCGT) or air cooling devices (e.g.
biomass and waste plants or open cycle gas turbines) is likely to be much less as these may be
mistaken for or mixed-up with other plant installations such as storage tanks or waste water
treatment facilities.
2. Secondly, if a cooling tower is observed, this does not necessarily mean that it is actually being
used as the predominant cooling technology for all power generating units. It also does not
mean that the cooling tower is used during the year - in some cases the cooling tower is only
used in high temperature periods – or that is was operational for the entire assessment period
of this study (2001-2012).
This visual recognition exercise decreased thus to some extent the uncertainty of the estimates for
the specific and total cooling water use for those facilities where the cooling system is unknown. This
approach was suggested by the JRC-IET, who have developed and used it for a JRC project in the
past. A follow-up analysis of the results of the consortium and the JRC showed that they are
comparable, as discussed in section 0.
If no information was received through either the survey or visual recognition then a cooling system
has been assumed depending on the nearby type of water body using a GIS modelling approach. At
this stage, the following assumption has been applied: if a power plant is situated at a fresh water
body then recirculated cooling is assumed. If the power plant is located nearest to the coast then it is
assumed that the power plant operates using a once-through cooling system. This assumption is
approximate in the sense that there are known areas where this does not hold very well, for example
along some of the major European rivers, where once-through cooling systems are not uncommon.
The procedure of allocating a water body to a facility is explained in more detail in section 5.

CESNL13784 End Report 49
Figure 26 Example of visual check for a power plant, in this case a nuclear power plant with natural draft cooling
tower.
Figure 27 The visual check of the power plants in the sample suggests that largest share of EU power plants is
not equipped with a cooling tower.
34%
51%
15%
Power plants with cooling tower
Power plants without cooling
towerUnknown/unclear

CESNL13784 End Report 50
6.5 Approach to quantifying cooling water use in power sector
Cooling water use for the selected power plants has been quantified based on an approach that was
agreed upon with the Power Sector representatives during the Interim Workshop in February 2014,
described below.
The values presented in the database for cooling water intake, discharge and consumption are based
on (in order of precedence) the following approach:
1. Data received for the specific plant received in the data gathering phase of this project. In
these cases, a single value for cooling water intake, discharge and consumption is included in
the database.
If no direct data is available use a water use function to estimate cooling water use:
2. Estimated values based on the pigeonholing approach, where values have been derived from a
sample of comparable power plants for which we received data in this project. In some cases
this was complemented with information from literature. For these facilities a low estimate and
a high estimate are presented. These have been derived from the available data as first
quartile and third quartile values, not minimum or maximum values. This is elaborated in more
detail in the following sections.
3. Default values from literature, in case no value could be estimated from the data collected as
part of the project. Again a low and a high estimate are presented in this case.
6.6 Direct data gathering power sector
The purpose of direct data gathering is to acquire specific information on cooling water intake,
discharge and consumption for power plants, beside key plant characteristics. The following
parameters were included in a customised questionnaire for the power sector:
▪ Basic information on facility
- IDs and basic parameters based on E-PRTR
- Geographic location
- Type of power plants, dominant fuel and installed capacity
- Annual production of electricity– as a reference value that may be used in estimating
cooling water use for those plants where no direct data is available.
▪ Information on cooling system and heat export
- Type of cooling system and presence of (type of) cooling tower
- Annual sums of cooling water volumes intake, consumption and discharge
- Export of heat
▪ Water body information for cooling water intake and discharge
▪ Water body type (surface or ground water and its salinity)
A more detailed overview of the parameters and definitions are provided in Appendix II Database
description & manual.

CESNL13784 End Report 51
Due to the practical limitations of clarity in the questionnaire and while considering willingness of
respondents to invest time in completing the questionnaire, the year 2010 was used as base year. If
for any reason no data was available for 2010, or 2010 is considered an atypical year in relation with
cooling water use, then respondents were allowed to choose one of the years closest to the base year
(2009 or 2011). Although monthly data is reported in the database, annual data is requested during
data gathering to ease the data gathering process. Annual data is used to estimate monthly data, see
section 6.1.
If respondents were unwilling to provide plant-specific information, as an alternative it was possible
to fill in an anonymous questionnaire with information about cooling water use of some specific yet
unidentified power plants. In this case the information could be used not to provide information about
individual power plant, but it was used as input in the pigeonholing approach that is elaborated in the
next section.
During direct data gathering the following organisations have been approached:
▪ Eurelectric and national sector organisations, including key contact persons provided by
Eurelectric.
▪ National government bodies responsible for cooling water regulation.
The questionnaire for the power sector was discussed and aligned with representatives from
Eurelectric at regular intervals, for example to ensure the clarity of definitions used and set-up and
data prioritization within the questionnaire. The questionnaire plus an accompanied guidance
document for filling in the questionnaire is included in Appendix III Data gathering .
National contact persons were sent questionnaires. In first instance the questionnaire was pre-filled
only with a list of facilities. Based on the initial data received and, as part of a validation cycle,
questionnaires pre-filled with estimate cooling water use quantities were subsequently distributed in
a second round.
6.7 Specific cooling water use estimates based on pigeonholing approach and literature
Actual cooling water use depends on plant characteristics and thus varies from location to location
even for comparable plants as can be seen in Figure 23. In cases where no specific information on
cooling water use is available, the present study assumes, as a first approximation, that on average
comparable plants use a comparable amount of cooling water. Based on this principle, simplified
specific cooling water use factors (in m3/MWh) were derived from the list of plants for which specific
data was available, the so-called pigeonholing approach. This information was complemented and
validated with data from literature in case of any gaps. These were used to estimate the cooling
water use (intake, consumption and discharge) for those facilities where specific data on cooling
water were not available.

CESNL13784 End Report 52
This provides us with specific cooling water use factors:
▪ Specific cooling water intake (in m3/ MWh)
▪ Specific cooling water discharge (in m3/ MWh)
▪ Specific cooling water consumption (in m3/ MWh)
Based on the results of the survey categories of power plants according to their dominant fuel type
and installed cooling technology were identified. In this study power plants and their dominant fuel
type are characterised originally into 11 categories of power plants, as listed in Table 6.
Table 6 Types of power plants characterised in this study
Fuel and type of power plant Description
Biomass and waste Biomass and waste fired power plant
Hard coal subcritical Hard coal fired power plant with subcritical steam parameters
Hard coal supercritical Hard coal power plant with supercritical steam parameters
Hard coal generic Hard coal power plant with unknown steam parameters
Natural gas combined cycle Natural gas fired combined cycle power plant
Natural gas steam boiler Natural gas fired steam boiler
Lignite subcritical Lignite fired power plant with subcritical steam parameters
Lignite supercritical Lignite fired power plant with supercritical steam parameters
Lignite generic Lignite fired power plant with unknown steam parameters
Nuclear Nuclear
Oil Oil
This list was simplified into 7 categories of plants as often complete information was not provided
about steam parameters of the power plants (sub- versus supercritical). This yielded the following list
of types of power plants (according to fuel type):
▪ Natural gas combined cycle
▪ Natural gas steam boiler
▪ Hard coal
▪ Lignite
▪ Nuclear
▪ Oil
▪ Biomass and waste
In section 3.4, seven types of cooling systems are defined. Within the pigeonholing approach this list
of cooling systems was further simplified to create a manageable set of combinations of cooling
systems and power plant types for the approach that could be populated based on the available data.
The set of simplified cooling systems for which water use factors were derived are:
▪ Open: once-through
▪ Open: recirculating wet cooling system
▪ Closed circuit (wet/dry)
▪ Hybrid (wet/dry)

CESNL13784 End Report 53
For every category of plant or pigeonhole (i.e. combination of fuel type and cooling system) a range14
of values for cooling water use was estimates based on the available dataset. Next to the median the
values for the first and third quartile were derived from the available dataset. As mentioned before,
the use of first and third quartile values was preferred over a wide range from minimum to maximum
range found in the dataset, as it became clear that the sometimes very wide range of values
observed in data from actual plants would render such a range not very meaningful. Statistically, one
would expect some 50% of the actual values to fall within this range between first quartile and third
quartile. This also means that some 25% of plants are expected to have a cooling water intake /
discharge / consumption greater than the high estimate and likewise some 25% of plants would have
values lower than the low estimate.
Values on specific water use were considered to be suitable for use in the overall calculations if the
values are based on the reported data from 5 or more plants that fall within a category of plant, or
pigeonhole. When fewer data points were available per pigeonhole the range was estimated based on
literature, taking into account values in comparable adjacent pigeonholes.
Table 7 provides specific information on the methodology that has been used to derive the estimates
for each plant category, or pigeonhole. An overview of key results for the specific cooling water use
(intake, discharge and consumption) for the pigeonholes in this approach can be found in Table 8 and
in additional tables in Appendix VIII Supplemental tables (Table 33, Table 34 and Table 35). In
these tables the minimum, maximum, first quartile, third quartile and median values for specific
water use are reported, when available. The specific water use factors derived from the pigeonholing
approach report all values; where the estimated specific water use factors from a combination of
literature and expert judgement show only the values for first and third quartile.
The resulting ranges for cooling water use are relatively wide in some cases. This is a direct result of
the observed variability in cooling water intake in the population of plants within the respective
pigeon-hole. It underlines the fact that site-specific conditions, the details of design and operation of
cooling systems and the way in which plants operate can lead to important differences in cooling
water use. However, given the inherent trade-offs in terms of economics and environmental aspects
depending on local circumstances (as discussed in section 3.4), the ranges observed do not
necessarily point to best practices that would be appropriate to implement in other plants.
14 The range represents the 25% and 75% quartile of the data.

CESNL13784 End Report 54
Table 7 Overview of categories of plants (combinations of power plant and fuel type and cooling system) and the methodology applied.
Fuel type Cooling system Cooling tower N Methodology applied to estimate specific water use
Biomass and waste
Open: recirculating wet cooling system
Yes 0 Water use is estimated based on ranges found for other technologies within pigeonholing approach
Open: once-through No 3 Water use is estimated based on ranges reported in literature Closed circuit Yes 1 Water use is estimated based on ranges found for other technologies within pigeonholing approach
Hard coal Open: recirculating wet cooling system
No 0 Water use is estimated based on ranges found for other technologies within pigeonholing approach Yes 6 Estimates for water use taken from pigeonholing
Open: once-through No 18 Yes 3 Water use is estimated based on ranges found for other technologies within pigeonholing approach
Hybrid (wet/dry) Yes 1 Closed circuit Yes 15 Estimates for water use taken from pigeonholing
Lignite Open: recirculating wet cooling system
Yes 9 Estimates for water use taken from pigeonholing
Open: once-through No 5 Closed circuit Yes 3 Water use is estimated based on ranges found for other technologies within pigeonholing approach
Natural gas combined cycle
Open: recirculating wet cooling system
No 0 Assumed equal to “Natural gas combined cycle-Open: once-through-No cooling tower” Yes 6 Estimates for water use taken from pigeonholing
Open: once-through No 37 Yes 5
Hybrid (wet/dry) No 0 Assumed equal to NGCC Hybrid with a Cooling Tower Yes 8 Estimates for water use taken from pigeonholing
Closed circuit No 5 Yes 25
Natural gas steam boiler
Open: recirculating wet cooling system
Yes 0 Water use is estimated based on ranges found for other technologies within pigeonholing approach
Open: once-through No 6 Estimates for water use taken from pigeonholing Closed circuit Yes 0 Assumed equal to Coal-Closed-circuit - wCT
Nuclear Open: recirculating wet cooling system
Yes 2 Water use is estimated based on ranges reported in literature
Open: once-through No 2 Open: once-through Yes 2 Closed circuit Yes 1
Oil Open: recirculating wet cooling system
No 1 Water use is estimated based on ranges found for other technologies within pigeonholing approach Yes 0 Water use is estimated based on ranges reported in literature
Open: once-through No 15 Estimates for water use taken from pigeonholing Closed circuit No 0 Water use is estimated based on ranges found for other technologies within pigeonholing approach
Yes 0 Assumed equal to a coal fired plant with a closed circuit cooling system and a cooling tower
*Literature used to refine cooling water estimates: Macknick et al 2012 and RWE Npower review 2013.

CESNL13784 End Report 55
Table 8 Specific cooling water intake for power plants as assumed in the calculations (gross volumes, not yet accounting for cooling water discharge).
Fuel type Cooling system Cooling tower Min Max 1st quartile 3rd quartile Average Median N
m3/MWh m3/MWh m3/MWh m3/MWh m3/MWh m3/MWh #
Biomass and waste
Open: recirculating wet cooling system Yes 0.2 5.5 Open: once-through No 75.7 189.3 Closed circuit Yes 0.1 5.5
Hard coal Open: recirculating wet cooling system No 0.0 0.0 Yes 2.3 6.5 2.7 5.7 4.3 4.5 6
Open: once-through No 13.2 250.0 110.1 194.1 145.7 146.7 18 Yes 98.0 147.5
Hybrid (wet/dry) Yes 3.5 5.2 Closed circuit Yes 0.2 5.0 1.6 2.7 2.2 2.2 15
Lignite Open: recirculating wet cooling system Yes 0.2 3.5 2.0 2.6 2.3 2.4 9 Open: once-through No 142.2 526.6 148.2 184.4 234.8 172.8 5 Closed circuit Yes 2.4 2.8
Natural gas combined cycle
Open: recirculating wet cooling system No 89.3 156.5 Yes 1.5 5.8 1.7 3.2 2.8 2.1 6
Open: once-through No 0.1 394.2 89.3 156.5 130.7 129.5 37 Yes 0.0 286.6 1.0 173.9 93.6 6.5 5
Hybrid (wet/dry) No 0.1 2.1 Yes 0.0 12.5 0.1 2.1 2.5 1.4 8
Closed circuit No 0.0 4.7 0.0 0.0 1.0 0.0 5 Yes 0.0 5.2 0.4 2.0 1.5 1.3 25
Natural gas steam boiler
Open: recirculating wet cooling system Yes 1.9 5.0 Open: once-through No 114.6 796.7 137.7 225.1 277.3 201.6 6 Closed circuit Yes 1.6 2.7
Nuclear Open: recirculating wet cooling system Yes 3.0 9.8 Open: once-through No 94.6 227.1 Open: once-through Yes 3.0 227.1 Closed circuit Yes 3.0 9.8
Oil Open: recirculating wet cooling system No 123.7 310.5 Yes 1.4 5.0
Open: once-through No 0.3 1027.4 56.5 412.4 282.2 217.1 15 Closed circuit No 1.2 3.1
Yes 1.6 2.7
CESNL13784 End Report 56
6.8 Cooling water use functions for power sector
If no direct information is available about the water use of a power plant then the water use function
is used to calculate the monthly water use for the full time period under study: 2001-2012. The water
use is calculated using two fundamental factors:
▪ Activity level expressed in MWh of electricity production per month
▪ Specific water use (intake, discharge and consumption)
Activity level
The activity level of the power plant depends on the net installed capacity and the amount of monthly
full load hours that the power plant runs.
The load profile, or the profile of full load hours over a year, will be influenced by the seasonal
variations in demand for electricity and heat. The number of full load hours is distributed over the
months using information from ENTSO-E (2013)15. The dataset by ENTSO-E includes country specific
production of electricity by fuel source, on a monthly basis covering the full period under study (i.e.
2001-2012). With this information it is possible to estimate an annual load curve for the various
types of power plants.
The level of data coverage across the EU is not consistent, however. Data is not always available per
fuel source which limits assessing accurately and consistently the (difference in) annual load profile
for natural gas, coal and biomass fired power plants. If no information was available for a specific
category of power plants then the average annual load hours for fossil fuels were taken. If no annual
load profile was known then an equal distribution of load hours over the year was assumed.
Despite the uncertainties mentioned above this approach allows for capturing long term trends and
country specific annual profiles. This is important as the demand for electricity and heat depends
strongly on season and geographical location.
15 https://www.entsoe.eu/data/data-portal/production/

CESNL13784 End Report 57
Estimating total water use
Knowing the category of power plant and cooling systems allows selecting the most likely specific
water use associated with that power plant. With the use of the activity level and specific water use
from the pigeonholing approach and literature we then calculate the monthly water intake, discharge
and consumption.
Clearly, there are limitations to the accuracy that may be expected from this approach. There is a
variety of factors that influence the actual operation of any particular power plant and variations
therein and this will impact the cooling water need. Key factors not captured by this approach include
for example:
▪ Differences in plant efficiency within a technology category;
▪ Differences in ambient air and water temperatures;
▪ Differences in design within a cooling system category;
▪ Partial load versus full-load operation16;
▪ Maintenance schedule, planned shutdowns or major faults;
▪ Commercial position of the plant in the electricity market merit order and / or the portfolio of a
power generation company;
These will result in a degree of scatter of actual specific cooling water use values. The aim of the
pigeonholing approach and presented bandwidth between a low and a high estimate is to reflect this
scatter.
16 For example, there is likely to be a difference in the yearly sum of cooling water use between a plant which operates full load for 6 months
and is off for the rest of the year and a plant which operates all its units at around 50% load factor through the entire year. This is caused,
amongst others by plant effic iency varying with load factor and ramp-up or ramp-down rates.

CESNL13784 End Report 58
7 Cooling water use iron and steel sector
7.1 Plant characteristics iron and steel sector
Some 180 million tonnes of crude steel is produced in the European Union annually. Two thirds of this
is primary steel production by integrated iron and steel plants from raw materials: iron ore and coal.
The remaining third is produced by recycling scrap material in secondary steel production.
Primary iron and steel production
An integrated iron and steel plant requires a series of process steps. Coke is produced through
pyrolysis of coal in a coke oven. The gaseous pyrolysis products are processed into fuel gas and
various chemical products. Pulverized iron ore is agglomerated in a sinter plant before it can be fed to
a blast furnace. A less common alternative to sintering is pelletisation. The reduction process to
elemental iron is carried out in a blast furnace, which typically involves a water-cooled vessel lined
with refractory material. Coke and sinter are added in this vessel from the top, while hot air is blown
in from the bottom. Molten iron is tapped periodically. The molten iron is then transferred to a basic
oxygen furnace where carbon and silicon present in the molten iron are oxidized and removed by
injecting pure oxygen. The resulting product is hot liquid steel. This liquid steel is cast into rough
shapes in a continuous caster. Up to this point integrated iron and steel plants are all similar in
process layout. Some intermediate products or inputs may also be procured externally instead of
produced on site, for example coke, sinter, pellets and pig iron. Along the same lines, the significant
quantities of electrical power that an integrated iron and steel plant requires may also be procured
from outside, or produced on site, however, these are considered under this heading. After the basic
process steps, there are a series of shaping processes to make a range products and semi-products.
These shaping processes vary significantly from plant to plant, depending on the type of products the
plant specializes in (construction, packaging, automotive, forgings, wire etc.). To ensure consistency
in the definitions for cooling water use and the scope of facilities considered, the upstream processes
up to and including the continuous casting process are considered as part of the iron and steel plant.
This, however, is not to say that the use cooling water is negligible. The BREF document mentions
that hot and cold rolling mills and annealing and pickling lines are significant cooling water users as
well, with specific primary requirements up to several tens of m3/ton. The majority of this is used for
direct cooling and since these streams require treatment before discharge the recirculation rate is
usually higher than for processes upstream of continuous casting.
Integrated iron and steel plants require cooling water. A fundamental parameter determining water
use is the degree of cooling water recirculation. Typically, this is related to the local availability of
water that can be used for cooling. Plants located close to the sea often use seawater for a significant
share of their cooling needs, in particular where this relates to indirect cooling (no direct product
contact) in once-though systems. For direct cooling (direct contact of the water with hot metal) and
when no seawater or brackish water is available fresh water is used, which may be available to
varying degrees.

CESNL13784 End Report 59
According to the 2012 BREF document on Best Available Techniques (BAT) for iron and steel
production, the overall water intake for integrated plants may vary between a few m3/ton steel to
100-200 m3/ton steel for the entire plant, depending on the type of cooling and the degree of water
recirculation. These values indicate that there is a wide range of variation in water intake, reflecting
differences in cooling systems and scope of facilities on site (see Table 9).
Typically, plants have been designed with local circumstances in mind. For example, plants situated
along the coast with ample supply of sea water, may well take in significant volumes of sea water for
once-through cooling. However, if at the same location fresh water supply is constrained, that part of
the cooling system that relies on fresh water is likely to be designed with a recirculating system,
requiring a much smaller volume of fresh water intake. Although some water may be used for other
purposes, typically, the majority of intake water is used for cooling purposes, either via direct contact
or indirect cooling. In case of direct cooling the cooling water is usually send to a waste water
treatment plant on site before discharge.
Typically, the integrated complex that makes up a steel plant includes a number of different cooling
systems that may rely on different water bodies for intake and some of which may be recirculating,
while others are once-through cooling systems.
Table 9 Scope of processes taken into account when estimating water use
Processes within scope Processes outside scope
Coke Ovens (incl. COG proc.) Hot and Cold Rolling
Sinter/Pellet Plants Pickling
Blast Furnaces Annealing
Basic Oxygen Furnaces Coating
Continuous Casting
Secondary iron and steel production
About one third of the total steel production in Europe is secondary. The most commonly used
smelting process is the electric arc furnace (EAF). Ferrous scrap is melted in the EAF and
subsequently treated in one or more secondary metallurgical processes to bring the melt further to
specification. The liquid steel is most often continuously cast as a next step, which may be followed
by a variety of shaping processes. These tend to vary from plant to plant. Similar to the scope
delineation used in the production of primary steel we will only consider continuous casting and
processes upstream. Cupola furnaces are also not considered in this study.
Production of secondary steel requires large volumes of cooling water. However the degree of
recirculation is typically relatively high, resulting in a much smaller volume intake of cooling water.
Cooling water is used for cooling the wall panels and the roof and for spraying the electrodes.
Secondary metallurgical processes and continuous casting also require significant volumes of cooling
water.

CESNL13784 End Report 60
7.2 Approach to quantifying cooling water use in iron & steel sector
The intended approach to quantifying cooling water use for the iron and steel sector consisted of 2
steps:
1. Attempted direct data gathering based on a questionnaire to collect specific information per
plant. This, however, did not result in obtaining plant-specific data.
2. Cooling water use functions that allow estimating cooling water use in cases where no specific
data was available.
Feedback from the iron and steel sector indicated that they could not reach consensus in terms of
willingness to disclose certain information on cooling water use at a plant-specific level. Instead the
sector proposed that the Iron and Steel BREF document be used as a basis for estimating cooling
water use. In the end, this provided the basis for estimating water use values, but not before
developing a customised questionnaire and discussing this with the iron and steel sector.
7.3 Direct data gathering iron and steel sector
The aim of direct data gathering was to acquire specific data on a set of key parameters that
characterise cooling water use for the selected list of iron and steel plants. A customised
questionnaire for the iron and steel sector was developed, inviting feedback from representatives
from Eurofer. Amongst others definitions, scope and data prioritization within the questionnaire were
discussed. In separate documentation the questionnaire plus accompanied guidance document for
filling in the questionnaire is provided (see Appendix III Data gathering ).
Eurofer has discussed the request for data with their membership and subsequently concluded that
no plant-specific data would be provided and no completed questionnaires were received. However,
as part of the data validation process, this questionnaire was later pre-filled and submitted for review
with estimated water use values based on water use functions. The questionnaire included the
following data elements:
Basic information on facility
▪ IDs and basic parameters based on E-PRTR
▪ Geographic location
▪ Type of steel production (primary or secondary) and installed capacity
▪ Production / output – as a reference value that may be used in estimating cooling water use for
those plants where no direct data is available.
Information on cooling system
▪ Type of cooling system(s) – especially related to the cooling system applied for the blast
furnace where the required cooling capacity tends to be greatest.
▪ Annual and monthly sums of cooling water volumes intake, consumption and discharge
▪ Annual and monthly average temperature of cooling water intake and discharge – as a
reference value that may be used in estimating cooling water use for those plants where no
direct data is available.

CESNL13784 End Report 61
Water body information for cooling water intake and discharge
▪ Water body ID from ECRINS database.
▪ Water body type
▪ Location of intake and discharge points
In their feedback, Eurofer proposed that the information on total water use based on available
information in the BREF documents for the Iron and Steel sector, summarised in Table 10 be used as
a basis for the cooling water use functions. These values indicate that there is a very wide range of
variation in water intake. This reflects wide ranging differences in cooling systems and scope of
facilities on site. Typically, plants have been designed with local circumstances in mind. For example,
plants situated along the coast with ample supply of sea water, may well take in significant volumes
of sea water for once-through cooling with relatively little impact on the environment. However, if at
the same location fresh water supply is constrained, that part of the cooling system that relies on
fresh water is likely to be designed with cooling system with a high rate of recirculation, requiring a
much smaller volume of fresh water intake.
As the cooling water values in Table 10 covers two orders of magnitude, this was deemed
insufficiently informative to use as the sole basis for establishing cooling water use functions.
Subsequently, an approach was used that aims to distinguish subsets of these ranges depending on
local water availability.
Table 10 Ranges of water use in iron and steel making in BREF documents, as summarised by Eurofer.

CESNL13784 End Report 62
7.4 Literature cooling water use iron and steel sector
Cooling water use functions were prepared to estimate the cooling water use (intake, consumption
and discharge) as a basis for estimating cooling water use for specific plants.
There are several literature sources that provide a detailed overview of the primary cooling water
requirement per sub-process (coke production, sinter production etc.). In Brown et al. 1996 a
comprehensive and consistent energy analysis for a typical iron and steel plant during the 1980s was
performed. All sub-processes mentioned above are covered (15 processes in total). For these
processes the cooling water flow and temperature increase was estimated.
When summed, all primary cooling water requirements upstream of continuous casting amount to a
total of approximately 60 m3/ton steel, when assuming a standard 10 °C cooling water temperature
rise. This is the primary cooling requirement, with no recirculation taken into account, thus
representing a case with water intake at the high end of the range. The main users of cooling water
are (in order of descending magnitude) the blast furnaces (wall cooling), the coke oven gas
processing plant, continuous casting and the oxygen converters.
The BREF 2012 document also provides cooling water requirement per sub-process. Table 10 shows
ranges for either the once-through only requirement (without taking possible recirculation into
account) or alternatively, the range in the overall net intake (recirculating vs. once-through systems)
for each process in the industry’s hot-side operations. For BOFs and EAFs both an overall range and
ranges for specific process steps are given concurrently. For blast furnaces and coke ovens process
water requirement is listed as well (which we do not considered as cooling water). The table does
not include the cooling water data for an integrated plant as a whole. However, this information is
presented in the water management section of BREF 2012, possibly because these data include cold-
side operations as well.
Figure 28 Primary cooling water requirement per sub-process (m3/ton steel) for an integrated iron and steel
plant upstream and including the continuous casting process (average of literature data).
Figure 28 shows the approximate values for the distribution of the specific cooling water requirement
as found in literature. With an assumed 0.52 tonne coke and 1.6 tonne sinter to be required for the
production of 1 tonne steel, and adding the cooling water requirement listed in Table 10 for coke
ovens, add coke quenching losses and use the overall intake range for BOFs and EAFs, an
approximate overall cooling water intake for primary iron and steel plants was derived. By summing
the all bottom and all top values from the quoted ranges, an apparent overall range of about 1.5 to
11
32
12
6 Coke ovens (incl.
COG processing)
Blast furnace
Basic oxygen
furnace
Continuous
casting

CESNL13784 End Report 63
100 m3/tonne is obtained. For the secondary iron and steel industry 1 – 43 m3/tonne steel results. As
mentioned before, these are wide ranges that depend amongst others on the degree of recirculation
applied. The higher end of the range is likely to be representative for plants with mainly once-through
cooling systems. Specific cooling water requirements per sub-process vary between less than 1 to a
few tens of m3/ton steel. This information again shows that blast furnace, converters, continuous
casting and coke oven gas processing again are the steps that have the greatest cooling demand.
According to the BREF 2012 document the primary cooling water requirement of an EAF is about 15
m3/ton steel (furnace only). For the treatment of the melt directly after the EAF (so-called secondary
metallurgical processes) and continuous casting in total a range of 6 to about 50 m3/ton steel
(assumed average is 12) is suggested (without recirculation). According to the BREF document all
cooling water is usually recycled to a high degree because of the inland location of most EAFs but it is
difficult to give guiding numbers for the overall intake.
The BREF document from 2001 mentions approximately the same values, except that the primary
requirement of the blast furnace alone could potentially be as high as 50 m3/ton. This higher value
was confirmed by recorded intake for a specific plant with mainly once-through cooling for the blast
furnace (information supplied by Van Hoorn, 2013). Other exemplarily data for the overall primary
requirement given in the 2012 BREF document (e.g. Table 2.8 in that document) indicate about 100
m3/ton steel but this value might include some cold-side operations as well.
Table 11 presents a summary overview of available cooling water intake data for the hot-side
operations in the iron and steel industry. Both Brown et al. and the BREF document give an indication
of the fraction of the total cooling water requirement that is used for direct cooling (referring to
primary use without recirculation; cooling with direct contact with hot steel)). An overall fraction
around 20% is estimated for all processes upstream of the continuous casting step, but this fraction
would be quite variable. Usually, water used for direct cooling is sent to a wastewater plant before
discharge. Water lost by evaporation (mainly from coke quenching and blast furnaces) is reported to
be in the order of 0.5-1 m3/ton steel, depending on the availability of fresh water (Brown et al. and
BREF 2012).
Table 11 Summary of water intake as reported in literature.
Overall total plant cooling water intake:
1-2 to 100-200 BREF 2012 Figure 2.12 Total general range
2.5 - 98 BREF 2012 Table 2.8 "Extensive recirculation" vs. "Mainly once-through"
Sum of primary requirements individual processes upstream of CC:
≈ 60 Brown et al. 1996
≈ 60 BREF 2012
≈ 70 BREF 2001
Actual overal intakes (partly) recirculating plants:
31 Van Hoorn 2013 IJmuiden plant (80% BF once-through, saline)
5 - 15 Chew et al. 2008 Based on 3 data sources
≈ 10 Van Hoorn 2013 General indication, no use of once-through systems
3.5 Chew et al. 2008 Highly recirculating plant
3.2 BREF 2012 Highly recirculating plant
No recirculation; includes coke, sinter, BF, BOF and
CC
Water intake as reported in literature

CESNL13784 End Report 64
7.5 Cooling water use functions primary steel production
Specific cooling water use: primary steel production
Cooling water use functions as reported in literature provided the basis for estimated values on
cooling water use per plant for implementation in the in the final database. These functions were
derived based on information on water use in in the BREF 2013 and 2001 documents, complemented
with scientific and technical literature, as summarised in Table 11.
As a key refinement, values were differentiated according to the local water availability. We
distinguished plants with unlimited supply of either fresh or fresh and saline/brackish water, plants
with unlimited supply of saline/brackish water but limited supply of fresh water and plants located
inland with no access to saline/brackish and a constrained supply of fresh water. Saline and fresh
water availability in turn was used to influence the degree of cooling water recirculation.
Secondly, ranges were defined around a best estimates for cooling water use depending on the
plant’s location (inland location, coastal location and high, low and unknown fresh water availability)
and the plant’s cooling system (primarily once-through, primarily recirculating, highly recirculating
and unknown).
In the case when the cooling water system and freshwater availability are not known the location
remains the only parameter on which an assumption about specific water use is based. The cooling
system of the iron & steel plants is mostly unknown. Therefore the dominant type of cooling system
and associated water use were estimated based on the location of the plant as known from the
database. For plants that have easy access to salt/brackish water we will assume that the processes
are primarily once-through cooled if possible as a default situation. For plants located inland the value
derived for dominantly recirculating systems for fresh water may be used.
Given the large uncertainty in this estimate a range is indicated within which the cooling water intake
and consumption most likely falls. These ranges are the result of an interpretation of literature
information and assumptions that are based on expert judgement. Results of these best estimates
with uncertainty ranges are reported in Table 12. The results of these estimates fit within the wide
ranges reported in the BREF reports (see Table 10) and must be considered as a rough approximation
for location specific estimation of the water use.
In the table a distinction is made where possible between saline and fresh water use. To derive a
total water use figure from the estimates in the table the saline and fresh water use can be added
using the following logic:
▪ Best estimates for saline and fresh water use can be added to derive total water use.
▪ Min and max values cannot be added, i.e. max use of saline water implies minimum use of
fresh water.
▪ The total water use is not higher than the highest estimate for fresh water use reported in the
table.
More details about these assumptions are discussed in the following sections.

CESNL13784 End Report 65
Saline water use
Plants located close to sea can use sea water for cooling in once-through systems. Once-through
systems with sea water can only partially fulfil the plant’s cooling water requirement because of the
salts content. By default we assume for coastal plants that only the blast furnace is cooled using sea
water, at a rate of 30 m3/ton (based on data from industry experts). Other processes might also be
cooled by sea water and moreover the requirements for the blast furnace may reach 50 m3/ton in
some cases (BREF 2001). Together this results in our estimated upper boundary of 50 m3/ton and 70
m3/ton of saline water for primarily recirculating plants (only blast furnace cooled by seawater) and
plants primarily using once-through systems (blast furnace and 20 m3/ton for other processes)
respectively, while the lower boundary is 0 (no cooling by seawater).
Fresh water use – coastal locations
If no saline water is used for once-through cooling, fresh water is used, either in once-through or
recirculating cooling systems. At most this will be between 100 and 200 m3/ton (BREF 2012,
maximum for a whole plant with mainly once-through cooling, either with saline or fresh water). The
value of 150 m3/ton was adopted here. Up to about half of this demand could be replaced by saline
water.
If fresh water is available in unlimited quantities then it is considered unlikely that sea water will be
used. In this case, our central estimate is 70 m3/ton for plants using once-through systems and no
sea water (based on the upper range in the BREF, see Table 10 and Table 11). The lower boundary
for primarily once-though is estimated to be 40 m3/ton. Any lower value would be classified as
primarily recirculating. In case the plant uses mainly recirculating cooling systems in spite of a high
availability of fresh water, our central estimate of the intake is 15 m3/ton (data by Chew and Van
Hoorn, see Table 11). The minimum fresh intake for recirculating systems is estimated at 5 m3/ton in
case fresh water is available in high quantities (data by Chew and BREF 2012).
If saline water is available in unlimited quantities while fresh water is not (as is the case with many
coastal plants) it is expected that sea water is used for once-through cooling systems, with a
maximum intake of 70 m3/ton and a central estimate of 30 m3/ton (e.g. for the blast furnace, see
above). A corresponding central estimate for the required fresh water intake would be 10 to 40
m3/ton, depending on the degree of cooling water recirculation. Note that there is always concurrent
use of sea water for coastal plants with limited fresh water availability.
When the cooling system and fresh water availability is unknown the uncertainty of water use the
highest, rendering a large range for the water use estimate. For the central estimate for such a plant
it was assumed that it recirculates fresh water by default.
Fresh water use – inland locations
Inland locations are assumed to rely on fresh water only for cooling. With unlimited fresh water
availability, the central value for the intake is estimated to vary between 15 and 70 m3/ton,
depending on the degree of recirculation (BREF 2013, Chew and Van Hoorn). The lowest and highest
value would be 5 and 150 m3/ton, as earlier discussed. In case fresh water availability is low it is
assumed that plants will be highly recirculating cooling water, with an average intake of 5 m3/ton
(BREF, Chew and Van Hoorn).

CESNL13784 End Report 66
For these type of plants the intake can be as low as 1 m3/ton (BREF 2013) which would represent the
lower bound of the technically feasible intake. With low fresh water availability once-through systems
are unlikely, but the degree of recirculation may vary. For the average recirculating plant we estimate
the intake to be between 5 and 40 m3/ton, with a central estimate of 15 m3/ton.
Resulting values for the key situations distinguished here are summarised in Table 12.
7.6 Cooling water use functions secondary steel production
Most electric arc furnaces have recirculating cooling systems (BREF 2013), as a result of their location
and the larger share of direct cooling. A central value for the cooling water intake is subject to
substantial uncertainty, but the value of about 5 m3/ton mentioned earlier was adopted here. Without
specific data to substantiate this in detail, we estimate that some 10 m3/ton be an upper limit for
recirculating plants. If the cooling system is unknown then theoretically a once-through system would
be possible with a maximum intake of 57 m3/ton (BREF 2012). The BREF 2012 reports that there are
also plants that have a fully closed cooling system with a negligible intake. The BREF document
suggests that water consumption is around 1 m3/ton if we assume the reported lower boundary of
the intake equals the amount evaporated.
Resulting values are summarised in Table 12.
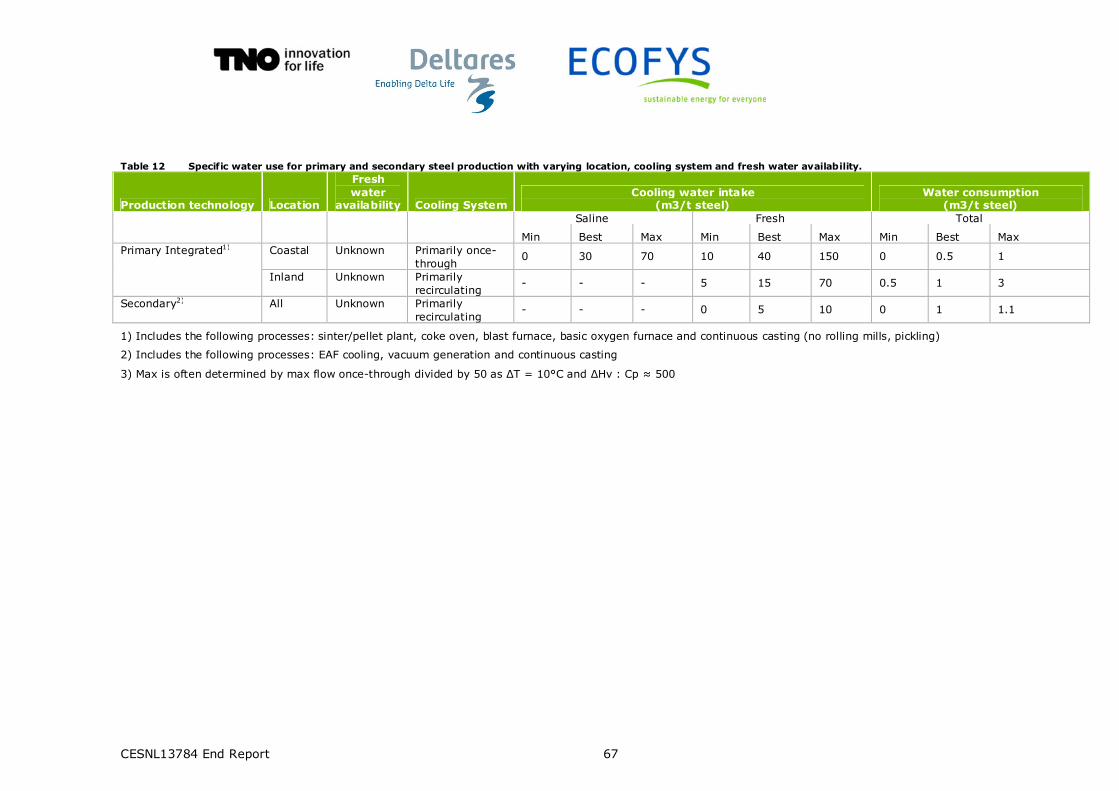
CESNL13784 End Report 67
Table 12 Specific water use for primary and secondary steel production with varying location, cooling system and fresh water availability.
Production technology Location
Fresh
water availability Cooling System
Cooling water intake (m3/t steel)
Water consumption (m3/t steel)
Saline Fresh Total
Min Best Max Min Best Max Min Best Max
Primary Integrated1) Coastal Unknown Primarily once-through
0 30 70 10 40 150 0 0.5 1
Inland Unknown Primarily recirculating
- - - 5 15 70 0.5 1 3
Secondary2) All Unknown Primarily recirculating
- - - 0 5 10 0 1 1.1
1) Includes the following processes: sinter/pellet plant, coke oven, blast furnace, basic oxygen furnace and continuous casting (no rolling mills, pickling)
2) Includes the following processes: EAF cooling, vacuum generation and continuous casting
3) Max is often determined by max flow once-through divided by 50 as ∆T = 10°C and ∆Hv : Cp ≈ 500
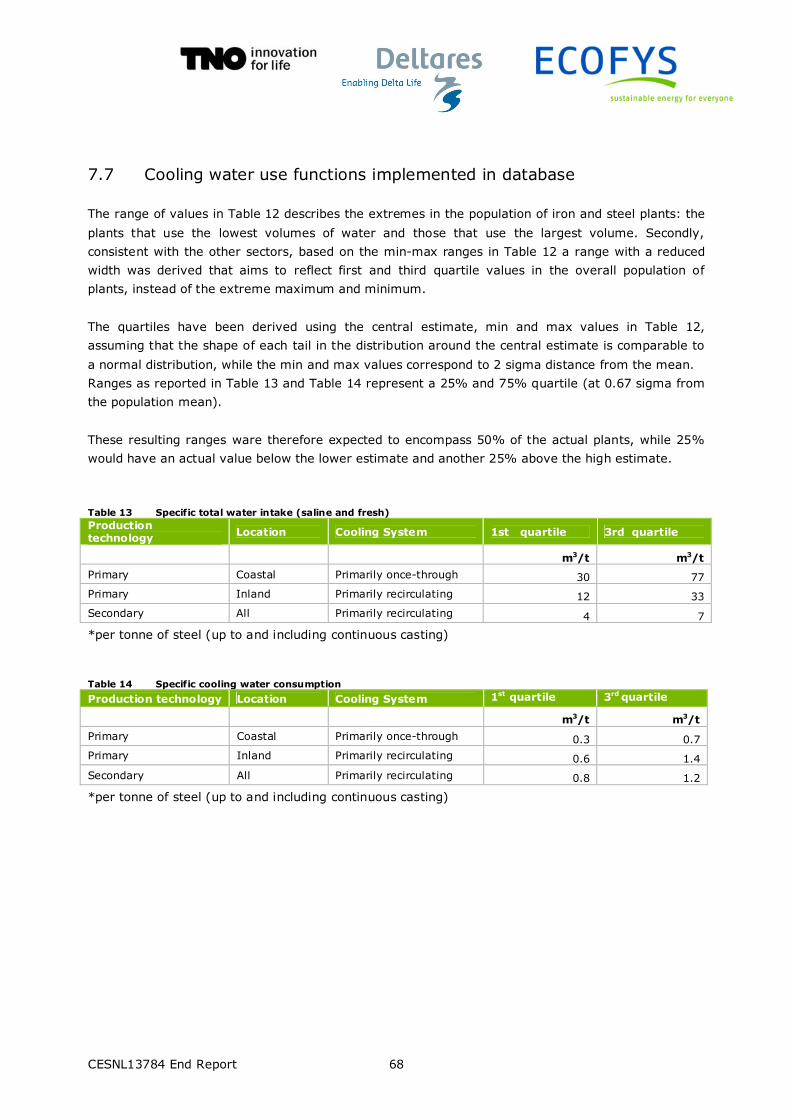
CESNL13784 End Report 68
7.7 Cooling water use functions implemented in database
The range of values in Table 12 describes the extremes in the population of iron and steel plants: the
plants that use the lowest volumes of water and those that use the largest volume. Secondly,
consistent with the other sectors, based on the min-max ranges in Table 12 a range with a reduced
width was derived that aims to reflect first and third quartile values in the overall population of
plants, instead of the extreme maximum and minimum.
The quartiles have been derived using the central estimate, min and max values in Table 12,
assuming that the shape of each tail in the distribution around the central estimate is comparable to
a normal distribution, while the min and max values correspond to 2 sigma distance from the mean.
Ranges as reported in Table 13 and Table 14 represent a 25% and 75% quartile (at 0.67 sigma from
the population mean).
These resulting ranges ware therefore expected to encompass 50% of the actual plants, while 25%
would have an actual value below the lower estimate and another 25% above the high estimate.
Table 13 Specific total water intake (saline and fresh)
Production technology
Location Cooling System 1st quartile 3rd quartile
m3/t m3/t
Primary Coastal Primarily once-through 30 77
Primary Inland Primarily recirculating 12 33
Secondary All Primarily recirculating 4 7
*per tonne of steel (up to and including continuous casting)
Table 14 Specific cooling water consumption
Production technology Location Cooling System 1st quartile 3rd quartile
m3/t m3/t
Primary Coastal Primarily once-through 0.3 0.7
Primary Inland Primarily recirculating 0.6 1.4
Secondary All Primarily recirculating 0.8 1.2
*per tonne of steel (up to and including continuous casting)

CESNL13784 End Report 69
Production versus Plant Capacity
The resulting ranges are used to estimate annual water use per facility by multiplying the name plate
capacity by an assumed production-factor of 0.7 as an estimate for the annual steel production.
Time dimension
Next, the water use over the timeframe spanning 2001-2012 is estimated based on yearly sector
production index as reported in the World steel statistical yearbooks, see Table 15. Furthermore, it is
assumed that the annual production is equally distributed over the months (see also 12.5).
Table 15 Annual production index (source: World steel statistical yearbook 2010,2013)
type of plant 2001 2002 2003 2004 2005 2006 2007 2008 2009 2010 2011 2012
Primary 108% 109% 111% 117% 113% 120% 122% 115% 81% 100% 103% 98%
Secondary 101% 100% 102% 109% 106% 117% 119% 116% 86% 100% 107% 99%
CESNL13784 End Report 70
8 Cooling water use refineries sector
8.1 Sector characteristics refineries sector
Petroleum refineries are complexes that combine a series of processes. There is a significant variation
in the character and degree of complexity of refineries. This variation is related to the set of
processes in use, the range of products produced and the type of feedstock. These influence the
corresponding cooling needs:
▪ basic refineries producing a modest set of products;
▪ specialty refineries that are geared towards producing specialty products;
▪ complex integrated refineries producing a wide range of products, typically at a large scale.
Petroleum refineries can be significant users of water. Water is used both for processing and for
cooling. In Brown et al. 1997 a comprehensive energy analysis for a typical medium complexity
American petroleum refinery during the 1980s was performed. Fourteen sub-processes are
distinguished representing the main of the unit operations taking place at an average oil refinery. For
all refinery sub-processes where water cooling is applied the cooling water flow and temperature
increase is estimated and all data are normalized to the mass of refinery feedstock processed. When
summed all primary cooling water requirements amount to a total of about 40 m3/ton crude oil,
when assuming a standard 10°C cooling water temperature increase. This is the primary
requirement, irrespective of possible recirculation, thus representing an upper case of cooling water
intake.
More recent data is available from the 2013 BREF document on refining of mineral oil and gas.
Primary specific cooling water requirement is specified for most refinery sub-processes in this
document. The BREF data is not normalized to total refinery crude throughput - which hampers the
interpretation somewhat - but when estimated, the high-case primary cooling water requirements per
ton refinery feed is more or less comparable to the data by Brown et al., notwithstanding the fact
that processes have changed considerably since the 1980s. However, typical values for the upper
case may not be representative for specific actual refineries just because of the fact that by
recirculating cooling water, overall intake decreases radically. This will become evident when
considering the range of variation observed in actual recorded water intakes of individual European
refineries.
8.2 Key factors governing cooling water use
The local availability of water typically determines the cooling system of a refinery, ranging from fully
once-through systems in case of effectively unlimited water supply, to highly recirculating in case of
constrained water availability. In addition to the water availability there are other reasons why
cooling water requirements may vary. The refineries covered by CONCAWE range from small bitumen
or lubricant plants to large complex refineries with some even having a petrochemical plant/process
integrated. These plants have different specific cooling requirements.

CESNL13784 End Report 71
Plants may not be operating to full capacity or continuous. Depending on economics of feedstock and
products, plants may operate with a different combination of processes. Furthermore, maintenance
periods or de-bottlenecking projects would result in periods with standstill of (parts of) refineries.
Furthermore a significant part of the cooling needs can be fulfilled by means other than cooling
water, such as air cooling. Furthermore, the temperature of the water intake varies from region to
region, as does the maximum allowed temperature of the discharge.
All of these factors suggest that cooling water use of refineries is expected to display a considerable
range of variation.
8.3 Anonymous cooling water data provided by refineries sector
The availability and willingness to disclose data on cooling water use from refineries was discussed
with CONCAWE. In turn CONCAWE has discussed this question with its membership - the owners of
specific refineries. Their feedback indicated that no location specific data could be provided, however
an existing detailed yet anonymised dataset could be used as a basis.
In CONCAWE’s 2010 Effluent Quality and Water Use Survey (CONCAWE, 2013) the total water intake,
discharge and consumption is reported per refinery, based on self-reported data by the companies.
This data was presented anonymously, but the refinery annual crude oil throughput is included. This
enables us to derive the specific water use expressed in m3/ tonne throughput17. Variation in specific
water intake from plant to plant is considerable, spanning more than 2 orders of magnitude.
For about 86 out of the total number of 100 refineries in the EU the cooling water intake is given by
CONCAWE. Cooling water intake is differentiated into “once-through” and “other” cooling water
(which we interpreted as “recirculating”). A further distinction is made in saline/brackish water and
fresh water. Half of the 86 refineries that reported cooling water intake seem to use a once-through
system as primary means of water cooling. Twenty of these use salt/brackish water for this purpose.
The anonymous data provided by CONCAWE was used as a basis for estimating cooling water use for
specific plants – through cooling water use functions. This data was analysed, while distinguishing the
following parameters
a. Type of cooling system: either once-through or other – assumed to include recirculation.
b. Type of cooling water: either salt/brackish or fresh water.
c. Refinery complexity: using refinery complexity index or class.
The results from this initial analysis are summarised in Figure 29. These figures clearly shows that
the median specific cooling water intake for the refineries that use once-through with salt/brackish
water is much higher compared to those refineries using fresh water for once-through cooling. The
same holds for refineries that use recirculating cooling with saline/brackish water: specific water use
is higher compared to refineries that are recirculating cooled using fresh water. The Nelson
complexity index (NCI), and associated Nelson Complexity Class (NCC) as used by CONCAWE, was
suggested as a possible explaining variable for the specific water use. After careful analysis we have
found no significant correlation between the NCI or NCC and specific water use (also exemplified in
17 Cooling water intake values have been expressed in relation total feedstock intake in as m3 per ton intake. This intake tonnage is directly
related to output tonnage, which would inc lude a range of different products.

CESNL13784 End Report 72
Figure 29 along the horizontal axes. It was therefore decided not to consider refinery complexity
further as part of the methodology to estimate cooling water use.
Figure 29 Specific water intake of refineries, disaggregated according to cooling system and type of water
intake. Note that the complexity class on the horizontal axes was used to identify the possibility for
further characterising refineries and provide an additional explanatory parameter for the specific
water intake. The numbers in the headings represent the number of refineries in the sample.
8.4 Cooling water use estimates – refineries sector
In estimating cooling water use for specific plants, no data was available on the type of cooling
system and degree of recirculation. However, the anonymous data from CONCAWE does suggest that
once-through cooling is the dominant cooling system for facilities located at or near the coast (sea or
estuarine waters). Furthermore, recirculating cooling are likely to be the dominant cooling system for
refineries that only use fresh water. Subsequently, the location of the refinery was used as a proxy
for the type of cooling system in place. For refineries that have easy access to salt/brackish water a
once-through cooling system was assumed as the default situation. For refineries located close to
very large fresh water bodies the value derived for recirculating systems for fresh water may be
used.
The anonymous data from CONCAWE was analysed accordingly, identifying the range of cooling
water intake values for coastal (using salt water) and inland (using fresh-water) plants. Minimum and
maximum, as well as first and third quartile values were identified in the population of plants,
summarised in the subsequent tables. These latter values represent a 25% and 75% quartile range,
meaning that we expect that 50% of the refineries fall within the estimated range.

CESNL13784 End Report 73
The ranges are used to estimate annual cooling water use per facility by multiplying the name plate
capacity by the annual production index (see Table 18). The annual production index indicates the
amount of annual throughput divided by the available capacity.
Cooling water use functions - Time dimension
The cooling water use is estimated for the period 2001-2012 on a monthly basis, where it is assumed
that the annual production is equally distributed over the months (see also section 12.5). Capacity
changes over time at individual sites have not been taken into account in the calculations.
Table 16 Specific cooling water intake
Cooling system Location Water
type Min Max
1st
quartile
3rd
quartile
m3/t m3/t m3/t m3/t
Cooling system: once-through Coastal Saline 1 107 5 35
Cooling system: recirculating Inland Fresh 0.0 15 0.1 1
*per tonne of crude oil throughput
Table 17 Specific cooling water consumption as reported by CONCAWE
Minimum Maximum 1st quartile 3rd quartile
m3/t m3/t m3/t m3/t
Fresh water consumption1 -42.9 51.6 0.1 0.7
Saline water consumption2 -8.7 124.5 -0.4 0.1
Total water consumption3 -42.9 126.6 0.0 0.6 1 Fresh water Intakes minus discharges into Fresh water bodies 2 Intakes minus discharges 3 Total-intakes minus all discharges
Table 18 Annual production index (source: BP statistics)
2001 2002 2003 2004 2005 2006 2007 2008 2009 2010 2011 2012
Throughput as share of installed capacity
88% 86% 87% 89% 89% 88% 87% 87% 81% 82% 80% 81%
CESNL13784 End Report 74
9 Cooling water use chemical sector
9.1 Chemical sector characteristics and key factors governing cooling water use
The chemical sector is an important user of water (BREF 2001). But the chemical sector is very
diverse and includes numerous types of products produced and processes in use. Multiple production
facilities are often co-located and are integrated. Examples are petrochemical complexes across
Europe where often refineries are co-located with numerous chemical facilities. These sites may
produce multiple products, but may share to some extent cooling water infrastructure or have some
level of heat integration. Specific cooling water use when producing chemicals very much depends on
the type of product, production process, process efficiency and cooling system (or heat integration)
at a certain site. This poses several challenges in relation to reporting or estimating cooling water use:
▪ High level of integration and complexity makes it difficult to report and allocate specific cooling
water use for a specific product.
▪ Installed production technology and specific design of cooling system and heat integration with
other processes and facilities makes it difficult to assess water use based on generic specific
water use factors (i.e. m3 / tonne of product).
▪ Confidentiality of sharing production and cooling water use data: cooling water use and
production data might provide insight in the level of activity and efficiency of production
processes across Europe. This type of information is typically commercially sensitive and
cannot be shared easily.
▪ Risk of double counting or missing facilities: due to co-siting of chemical facilities with
refineries.
9.2 Attempted data gathering in chemical sector
With the support of the overall European Chemical sector association CEFIC, a set of key
organisations representing different branches of the chemical sector were contacted. However, as
was observed in some other sectors, no plant-specific data was shared by these branches of the
chemical sector.
CESNL13784 End Report 75
As part of the data validation process, the chemical sector did emphasize the following
considerations. These have been described and taken into account in the relevant sections of this
report:
1. Cooling water use is a complex issue and cannot be easily reduced to a water function (t/m3)
per product;
2. Cooling water depends on installed production technology; specific design of cooling system;
heat integration;
3. Impacts can vary very much depending on the geographic location of the site;
4. Confidentiality of the data, due to it being related to commercially sensitive aspects of plant
performance.
5. Estimating the water use based on plant capacity is a generic approach, which is not
necessarily applicable to each site. A substantial range of variation between the sites is likely.
9.3 Cooling water use function for 3 chemical subsectors
Cooling water use functions were prepared to estimate the cooling water use (intake, consumption
and discharge) to be used in those cases where direct data is not available. These functions are
specific to each of the selected subsectors considered in the present study.
The following production processes were assumed for each of the three sectors under study:
▪ Ammonia: Gas reforming
▪ Ethylene: Ethylene (Steam cracking of Naphtha)
▪ Hydrogen: Steam reforming
The intake of cooling water, its discharge and the consumption (net difference between intake and
consumption) were considered separately. The corresponding quantities were estimated based on:
▪ The cooling water requirement of the production process;
▪ The assumption that a wet recirculating cooling system is installed18.
▪ The recirculation ratio of the cooling water (typically ranges between 3 and 7 cycles)
▪ A central estimate of consumptive use of cooling water as share of the circulating flow.
Consumption is assumed to take into account evaporation from the system.19
▪ Annual production based on installed capacity and annual capacity factor
The cooling water requirement of the production process
Based on information gathered from literature (mainly the IPPC BREF documents) the cooling water
requirement for the three processes was estimated. This represents the gross amount of cooling
water that is needed to cool the respective processes.
For ethylene which is assumed to be produced by steam cracking of naphtha, we assumed a cooling
water requirement of 200 m3 of water per tonne product (source: BREF 2003)20. Ranges reported in
literature range show also values as high as approximately 450 m3/tonne.
18 Note that based on feedback from the sector representative it was possible to spec ific the cooling system for some indiv idual plants in the
ethylene production sector. For some fac ilities it was stated that these are once-through cooled. 19 Based on IPPC 2001 Reference Document on the application of Best Available techniques to Industrial Cooling Systems. 20 http://eippcb.jrc.ec.europa.eu/reference/BREF/lvo_bref_0203.pdf page 174

CESNL13784 End Report 76
For ammonia which is assumed to be produced using gas reforming we have estimated the cooling
water requirement, after interaction with sector experts, at of 200 m3 of water per tonne product.
The range reported in literature varies between approximately 100 and 260 m3/tonne product
(ThyssenKrupp UHDE 2013 and Brown et al. 1997)
For hydrogen production we assumed the steam reforming production process. This process requires
a gross amount of cooling water of about 2000 m3 of water per tonne product. It should be noted
that the ranges found in literature are not uniform in their definition of cooling water use (i.e. a
distinction between gross use, intake or consumption. Hence, this assumption comes with
uncertainty.
Recirculation rate of cooling system installed
The recirculation rate varies very strongly with the cooling system installed and the operating regime.
The number of times the cooling water passes the heat exchanger to cool the process was used as
definition for the recirculation rate. Hence, a recirculation rate of 1 corresponds to a once-through
cooling system. A rate of 10 indicates that a highly recirculating cooling system. The gross cooling
water requirement together with the recirculation rate determines the amount of water that needs to
be refreshed, i.e. the intake of cooling water. Given the uncertainty related to the installed cooling
system and circulation rate we have assumed a circulating rate between 3 and 7 to account for this
uncertainty in our cooling water use estimates.
Estimate of consumptive use of cooling water
The IPPC BREF reports the following:
“To compensate for the blow-down and evaporation, water is added and this is the so-called
make-up. Generally, the make-up water flow used by an open recirculating system is about 1-
3% of the flow of a once-through system with the same cooling capacity. For the power
industry this can be 1-5%. This is equal to a requirement of approximately “0.25% x cooling
range”, which is the make-up water quantity as a percentage of the circulating water flow.”
This central assumption is used to estimate the level of water consumption. The central estimate is
that 2% of the circulating flow is consumed. This is confirmed by other literature that states “The
water consumption rate in cooling towers is typically less than 2% of the water circulation rate.” 21;
related to the production of hydrogen.
The specific water intake and consumption are then used to calculate the specific water discharge.
The results of specific cooling water use are shown in Table 19 and provide the basis for estimated
cooling water use values in the database.
Annual production based on installed capacity and annual capacity factor
The installed capacity (in kTonne product/year) and an annual capacity factor22 of 80% at a certain
site are then used to calculate annual cooling water use per facility. The list and capacity of plants is
taken from literature and where possible updated with information from sector representatives.
▪ Ammonia: list of plants and production capacity is taken from the IPPC BREF 2003.
21 https://e-reports-ext.llnl.gov/pdf/384852.pdf 22 A standard capac ity factor of 80% is assumed, meaning that annual production equals about 80% of nameplate capac ity.
CESNL13784 End Report 77
▪ Ethylene: list of plants and production capacity is taken from the Petro Chemicals Europe
website: http://www.petrochemistry.eu/about-petrochemistry/facts-and-figures.html .
▪ Hydrogen: list of plants and production capacity is taken from “Hydrogen plants in the EU”
(roads2hycom 2007).
Table 19 Estimates for specific cooling water use for the production of Ammonia, Ethylene and Hydrogen.
Product Cooling water
requirement
cooling water
recirculation
ratio
specific
cooling
water
intake
specific cooling
water
consumption
specific
cooling water
consumption
specific
cooling
water
discharge
m3/t # m3/t % of circulating
flow m3/t m3/t
Ammonia
Low 200 7 29 2% 4 25
High 200 3 67 2% 4 63
Ethylene
Low 200 7 29 2% 4 25
High 200 3 67 2% 4 63
Hydrogen
Low 2000 7 286 2% 40 246
High 2000 3 667 2% 40 627

CESNL13784 End Report 78
10 Database design
10.1 Outline
This section describes the design of the database for four selected sectors. For a selection of the most
important facilities within these sectors, geo-specific information on volume and temperature of water
intake, water consumption and water discharge will be quantified. The most relevant information
deals then with the facility linking with a water body (or bodies). This data will be made available,
where possible, for the period 2001-2012 on a monthly basis.
The goal of this section is to provide insight into the parameters that are going to be included in the
database and for which input is going to be gathered, either by estimation/calculation or direct data
gathering. Furthermore the structure of the database is presented to show how parameters are
linked. This will allow stakeholders, EEA in particular, to assess whether the database is designed
properly to allow future integration in the WISE work flow.
10.2 Development process and alignment with EEA
In MS Access an iterative draft versions of the Water Use Database was built. Currently, in version
1.0 of the database the structure has been finalised in alignment with EEA. The remaining step is to
update the quantitative information in the database based on the final validated cooling water use
dataset.
Earlier versions of the database have been shared with EEA and DG Environment to verify that the
proposed structure meets the requirements and to allow the parallel development of an interfacing
system by EEA that allows importing the values including in the database in the Nopolu tool for water
accounts.
The team has aligned with EEA on a shortened water accounts study that commenced at the end of
2013 and was completed by March / April 2014. The team has provided providing the specifications
document of the Cooling Water database for Naldeo – the company implementing this Water
Accounts study - to be able to setup a way of importing the data on cooling water use in their Water
Accounts analysis. Based on this document and an example – empty – database file, Naldeo should
be able to design the way to import the cooling water intake and discharge values based on
geographic coordinates.
A recent version of the database has been provided to EEA including database documentation for a
final review of the database structure. EEA has provided detailed comments. Subsequent
communication between the team and EEA has led to a final agreed database structure discussed
here.

CESNL13784 End Report 79
Figure 30 gives an overview of the Database Design, information about the relations between the
different tables in the database. More detailed information on the content of the tables and
description of the parameters can be found in Appendix II Database description & manual. The focus
of this document is to show the structure of the database: the individual tables, the fields of which
the tables consist and the relations between the tables.
Figure 30 Database design Water Use database version 1.0.

CESNL13784 End Report 80
10.3 Handover of database to EEA
EEA will become the custodian of the final database deliverable of this pilot study. Building on the
earlier review of draft versions of the database and the feedback that was incorporated, the final
hand-over process takes place along the following basic steps:
1. Version 1.0 of the database will be sent to EEA digitally, together with the accompanying
documentation and this End Report.
2. EEA will confirm having received these in deliverables and takes over ownership in a letter.
10.4 Database use
The purpose of the data on cooling water use in the database can be used by EEA as input their water
accounts modelling, building on the link to ECRINS water bodies and catchment areas included. As
part of this process, EEA will also have to consider how the quantitative information on cooling water
use is imported. In particular, for facilities where the database presents a range (made up of a low
estimate and a high estimate of the relevant cooling water use parameter) instead of a single value,
a selection will have to be made what value from within this range to use. This process is best guided
by the considering the combination of:
▪ the purpose of the specific water accounts study,
▪ the uncertainties and bandwidths of the values included in the database,
▪ the inherent variability of cooling water use due to variations in plant operation over time for
example due to market conditions and planned or unexpected maintenance periods.
10.5 Database updating
Secondly, plant specifications or operation, cooling systems or other relevant parameters may change
over time. A procedure should be put in place by EEA to allow updating of the database to reflect
such changes, building on EEA’s established data management procedures and practices. It is
recommended that this includes procedures for change management that allows tracking of
modifications and quality assurance of any new information imported.
Secondly, as part of the feedback from the validation phase, some parties requested that there be
the possibility to review and update the information in the database at a later stage, if inaccuracies
are identified or the actual cooling water use values change over time.

CESNL13784 End Report 81
11 Data gathering
11.1 Data gathering methodology
A comprehensive data gathering effort was carried out covering all 4 sectors and EU28 countries. The
approach has been aligned with the relevant sector organisations, represented in the Steering
Committee. For the respective sectors, the following approach was pursued, based on the results
from the February 2014 interim workshop and subsequent interaction with the sector organisations:
▪ Power sector: national contact persons were provided by EURELECTRIC for a subset of
countries: Austria, Belgium, Cyprus, Finland, France, Germany, Norway, Poland, Portugal,
United Kingdom, Spain, Sweden and The Netherlands. EURELECTRIC had requested contact
persons from the other countries from their colleagues, however these did not respond. For
these remaining countries contact persons were sought independently by the consultant, with
very limited success. In a number of these countries, the contact persons provided specific
data for a significant number of power plants. In some countries, only anonymous data was
provided that could be used in a pigeonholing approach. This approach was subsequently used
to estimate values for other countries.
▪ Chemical sector: in coordination with CEFIC the relevant subsector organisations were
requested to seek data from their members to cover the sectors Hydrogen, Ammonia and
Ethylene. However, the sectors did not provide specific data.
▪ Refineries: CONCAWE provided a detailed, yet anonymous list with cooling water use from
European Refineries. The sector was not willing to provide plant-specific data. Some effort was
made to contact individual refineries, however these consistently related to CONCAWE.
▪ Iron & steel sector: EUROFER indicated that their members were generally not willing to
provide plant-specific cooling water data, despite repeated efforts to find a way in which this
would be acceptable.
In addition, the main national Government bodies responsible for water management were contacted
to seek supplemental data. Generally, these parties either did not have such data available and/or
were not allowed to disclose such data due to confidentiality commitments in place.
11.2 Data gathering questionnaire
A comprehensive data gathering questionnaire and corresponding guidance document were prepared.
These went through multiple revision cycles, based on interaction with the various sector
organisations.
An example of the resulting questionnaire is included in Appendix III Data gathering questionnaire.
For other sectors, the corresponding sector-specific content of the questionnaire was discussed in the
previous sector-specific chapters.

CESNL13784 End Report 82
11.3 Overview results from data gathering
The current status of the database and coverage of parameters is shown in Table 20 and Table 21.
The Table 22 presents an overview of the coverage of actual plant-specific data (in some cases
anonymised) that was received at country level. Anonymised information has been received for the
power sector from the following countries:
▪ France: summary of cooling water use in French power plants with a focus on the nuclear
plants. Average values for specific water use are reported.
▪ UK: anonymised set of power plants with detailed information about cooling water use
▪ Germany: anonymised set of lignite fired power plants with detailed information about cooling
water use
Table 20 Current coverage of the geographic specific cooling water inventory database.
Power Iron & steel Refineries Chemical
Number of facilities 953 35 primary steel
36 secondary steel
Oil refineries: 109 Ammonia: 38
Ethylene: 33
Hydrogen: 77
Estimated share of
cooling water use
in sector covered
>90% ~95% for primary
~30% for secondary
~90% total
~95% n/a
Most important
date coverage
(only estimated or
calculated
parameters are
highlighted italic)
▪ Geographic info
▪ Dominant water
body (intake and
discharge)
▪ Cooling system
▪ Installed production
capacity
▪ Annual production
and production
profile (2010)
▪ Specific water use
(intake, discharge &
consumption)
▪ Geographic info
▪ Dominant water
body (intake and
discharge)
▪ Cooling system
▪ Installed production
capacity
▪ Annual production
and production
profile (2010)**
▪ Specific water use
(intake, discharge &
consumption)
▪ Geographic info
▪ Dominant water
body (intake and
discharge)
▪ Cooling system
▪ Installed production
capacity
▪ Annual production
and production
profile (2010)**
▪ Specific water use
(intake, discharge &
consumption)
▪ Geographic info
▪ Dominant water
body (intake and
discharge)
▪ Cooling system*
▪ Installed production
capacity
▪ Annual production
and production
profile (2010)**
▪ Specific water use
(intake, discharge &
consumption)
*For some ethylene production facilities we have received information on the installed cooling system.
**for a limited number of facilities we have received the annual water use and annual profile, see for details
section 12.5.

CESNL13784 End Report 83
Table 21 Overview of specific coverage on cooling water use data gathered.
11.4 Screening and processing of data received
The data received from direct data gathering has been screened to check for irregularities. The
following checks have been applied:
▪ Logical combination of cooling system and cooling tower. Visual checking of cooling systems
has been used in some cases to verify installed cooling system.
▪ Logical level of production (activity level) and specific cooling water use. This is mainly checked
using the installed capacity and by calculating the specific cooling water use and compare this
to values found in literature.
▪ Annual cooling water use. The final calculations for the annual cooling water use must result in
a value that falls within a range deemed logical for a facility in that sector; most dominantly
related to its installed production capacity.
Processing of data received
The following rules have been applied when receiving data from direct data gathering:
▪ Information received from direct data gathering overrules data estimated from existing
databases and literature
▪ When incomplete questionnaires have been received then data is complemented by data from
existing databases and literature.
Country Power Iron and Steel Refineries Chem ical
Approxim atenum ber of plants
953 71 109 148
Austria 0 0 0 0Belgium 0.766666667 0 0 0Bulgaria 0 0 0 0Croatia 0 0 0 0Cyprus 0.333333333 0 0 0Czech Republic 0 0 0 0Denmark 0.3 0 0 0Estonia 0 0 0 0Finland 0.020408163 0 0 0 Share of plants for w hichFrance 0.372881356 0 0 0 actual data w as submittedGermany 0.039548023 0 0 0 on cooling w ater use.Greece 0 0 0 0 0 0%Hungary 0.75 0 0 0 0.1 < 25%Ireland 0.9375 0 0 0 0.3 25% - 50%Italy 0.783333333 0 0 0 0.6 50% - 75%Latvia 0 0 0 0 0.8 75% - 100%Lithuania 0 0 0 0Luxembourg 0 0 0 0Malta 1 0 0 0Netherlands 0.340909091 0 0 0Poland 0.571428571 0 0 0Portugal 0.9 0 0 0Romania 0.258064516 0 0 0Slovakia 0.3 0 0 0Slovenia 0.875 0 0 0Spain 0.709302326 0 0 0Sw eden 0.304347826 0 0 0United Kingdom 0.75 0 0 0
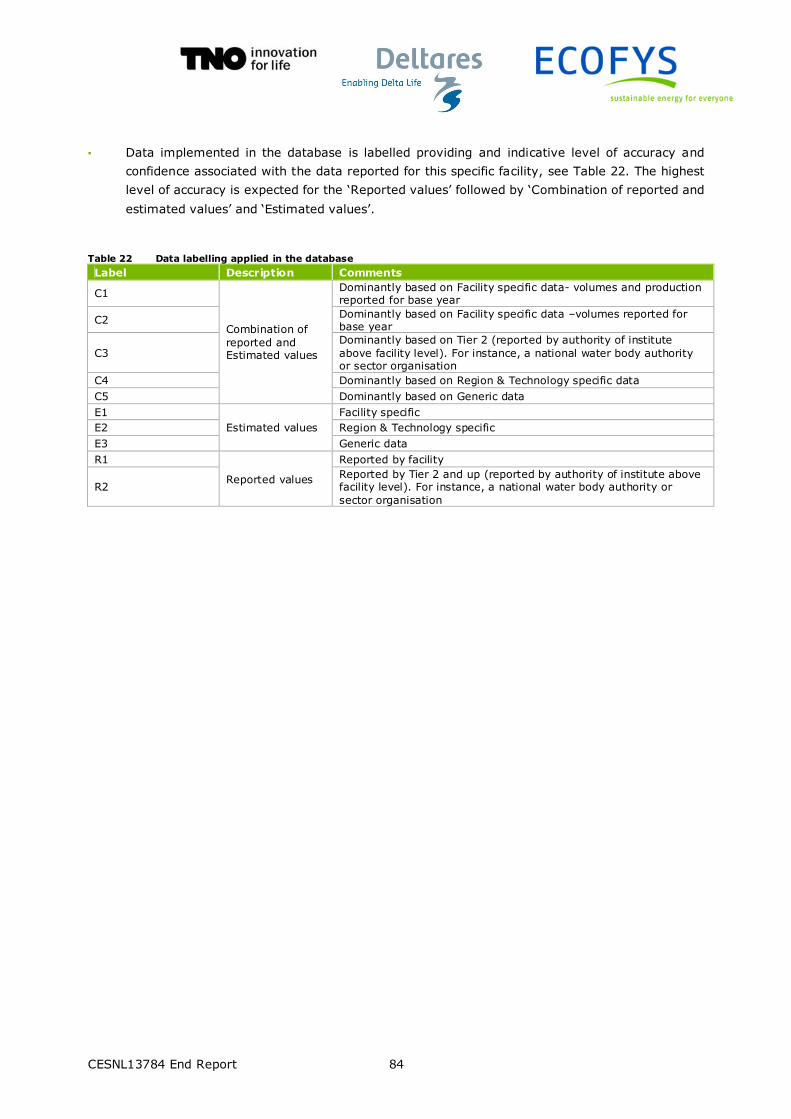
CESNL13784 End Report 84
▪ Data implemented in the database is labelled providing and indicative level of accuracy and
confidence associated with the data reported for this specific facility, see Table 22. The highest
level of accuracy is expected for the ‘Reported values’ followed by ‘Combination of reported and
estimated values’ and ‘Estimated values’.
Table 22 Data labelling applied in the database
Label Description Comments
C1
Combination of reported and Estimated values
Dominantly based on Facility specific data- volumes and production reported for base year
C2 Dominantly based on Facility specific data –volumes reported for base year
C3 Dominantly based on Tier 2 (reported by authority of institute above facility level). For instance, a national water body authority or sector organisation
C4 Dominantly based on Region & Technology specific data
C5 Dominantly based on Generic data
E1
Estimated values
Facility specific
E2 Region & Technology specific
E3 Generic data
R1
Reported values
Reported by facility
R2 Reported by Tier 2 and up (reported by authority of institute above facility level). For instance, a national water body authority or sector organisation

CESNL13784 End Report 85
12 Data validation
12.1 Data validation approach
The gathered data on cooling water use was organised, reviewed and analysed. Subsequently,
cooling water use values were estimated for all plants in the database where no specific cooling water
data was available, based on the approach described in Chapters 6 through 9. The resulting dataset
was subjected to a data validation process. This process consists on of the following steps:
1. Consistency check of the cooling water data with expected values based on literature.
2. Checking of country sums for total cooling water intake with Eurostat statistical data.
3. Sending out a comprehensive data validation sheets with plant-specific cooling water use
values to all national and European sector organisations with which contact has been
established, requesting a review of the data and to provide feedback, quantified to the extent
possible and primarily on plant-specific values.
4. Sending out a comprehensive country specific dataset with plant-specific cooling water use
values to all national and water management Government bodies were contacted and
requested review of the data and to provide feedback both on national totals and plant-specific
values.
Further details on the feedback received are presented in Appendix IX Overview data gathering and
validation contacts. These results from the data validation feedback were incorporated in the results
as follows:
▪ Updating list of facilities based on feedback on list of plants;
▪ Where relevant, correction of quantitative information for individual facilities based on plant-
specific feedback received, e.g. cooling systems and other main parameters affecting cooling
water use
▪ Refining of water use functions to reflect updated dataset.
12.2 Power sector data validation based on country sums
The reported total fresh water abstraction by Eurostat for the year 2010 is compared with the total
fresh water abstraction covered as part of the present pilot project in Figure 31. For reference also
the total cooling water use (fresh and saline) is reported in Figure 32.
Total fresh and groundwater abstraction for (a subset of) the EU28 countries is reported at 67 billion
m3. The total of fresh water intake for the sample of power plants in the database sums to 57 - 99
billion m3. Total water abstraction (salt and fresh water) sums to 122 - 225 billion m3, which cannot
be compared to Eurostat data due to absence of data for saline water; according to our estimates
saline water abstraction forms a substantial part (i.e. 66-126 billion m3) of total gross water
abstraction in Europe.

CESNL13784 End Report 86
Overall, there is fair correlation between the data reported by Eurostat and the data estimated in the
database. The following three observations emerge:
▪ Countries for which the estimates are within the estimated range are: France, Germany,
Sweden and Slovenia.
▪ Estimates for Spain, Poland, Portugal, Netherlands, Belgium23, Hungary and are lower than
reported numbers by Eurostat.
▪ The countries for which estimates are higher compared to reported data by Eurostat are:
United Kingdom, Romania, Finland and Czech Republic, Bulgaria and Austria.
The difference between estimated water abstraction in this pilot project and reported water
abstraction by Eurostat must be considered in relation to the range of uncertainties in the
assumptions that were made when estimating the cooling water use as described in previous
chapters. In summary, the most important sources of this uncertainty are:
▪ Number and capacity of power plants per country.
▪ Use of saline or fresh water source when no information was received during direct data
gathering.
▪ Assessment of cooling system when no information was received during direct data gathering.
▪ EU wide specific water use factors for categories of plants as used in the calculations do not
accurately take into account country or location specific circumstances such as the climate,
regulatory framework and trends in operation over the year.
▪ The total estimate for electricity production per category of power plant is based on statistics
from ENTSO-E. The data is not complete for all countries in the EU and thus assumptions on
operating hours and thus electricity production had to be made.
It is important to note that this validation step only provides limited information about the accuracy
of estimated water use per individual power plant. Insights into the reached level of accuracy for
individual power plants are the subject of section 12.5.
23 Note that for substantial part of the sample of power plants in Belgium the estimated water use data did not pass validation and no
estimate has been entered in the database.

CESNL13784 End Report 87
Figure 31 Validation of cooling water abstraction estimates for the power sector with reported total fresh water
abstraction by Eurostat for the year 2010. Data for United Kingdom includes data for England and
Wales as reported by Eurostat. Note that for the following countries data was not available for the
year 2010 and alternative years are shown for reference: Austria, Denmark, Finland, Greece, Hungary
and Romania. The light blue bars in the figure indicate the data retrieved by direct data gathering and
hence provide a high level of confidence for this estimate. The dark blue bar added to this estimate
indicates the lower end of the estimate for power plants for which no direct information was received.
The sum of the light and dark blue bars represent the lower estimate for total fresh cooling water
intake. The right end of the orange bars indicate the higher end of the cooling water estimate for
intake.

CESNL13784 End Report 88
Figure 32 Estimate of total saline and fresh cooling water intake and consumption by selected power plants
included in the database, covering the EU28 and ultra-peripheral regions.

CESNL13784 End Report 89
12.3 Power sector – validation with existing database developed by JRC
The JRC-IET in Petten has been developing a database with information on EU power plants including
their cooling systems, independent from the present study. Amongst others, cooling systems as a key
parameter in cooling water use have been visually identified and characterised using Google Earth,
i.e. similar to what was discussed in section 6.4. A comparison between the results of both the
database developed by JRC and the dataset from this pilot project provides valuable insight in terms
of validation.
A comparison was made between the results from the two databases first by establishing the
breakdown in fuel use and regrouping of the cooling systems so that comparison was possible. Table
23 below shows the comparison between values in the JRC database and the database obtained
through the present pilot project (PP).
Table 23 Comparison between results in pilot project (PP) and JRC database (source JRC-IET).
plants>100Mwe Total installed capacity
(GWe) Number of plants Comments
Cooling system1 PP JRC % diff. PP JRC % diff. PP JRC
Air cooling (type D) 19 19.4 1% 46 50 9% closed circuit (dry) approximated as air cooling
systems
Hybrid (type A+B with cooling tower)
15 0.0 100% 16 0 100%
Once-through (type A+B without cooling tower)
251 305.3 22% 471 499 6%
approximated as once-through (direct + indirect) without
cooling tower
Recirculating w Cooling tower (type C)
210 223.8 6% 328 216 -34%
approximated as closed circuit (wet) + hybrid (closed and open) +
open recirculating wet cooling system
approximated as cooling
tower
Undefined 55 10.1 -82% -311 55 -40%
TOTAL 550 558.6 1% 953 820 -14%
1 See definitions used in section 3.4

CESNL13784 End Report 90
The main results from this comparison are:
▪ Although the total capacity was similar in both databases (see Figure 33), the JRC database
included 27% higher capacity running on oil and 33% less capacity running with biomass and
waste; Total installed capacity distribution appears to match well.
▪ The JRC and the PP databases yielded similar results for the installed capacity of recirculating
systems and for air cooled systems. For once-through cooled systems, the JRC database
yielded a higher capacity by 22% than the PP database.
▪ The installed power generation capacity differs considerably for some countries, notably:
Croatia, Denmark Hungary, and Norway with differences at least of 50% of installed capacity.
However, the differences relate to only 2% of the total capacity captured in the PP database
and therefore should not affect greatly the results.
▪ Given differences in definitions and characterisation of water types it was not possible to
provide a detailed comparison for the type of water being used (e.g. fresh versus saline).
▪ An important observation when comparing the databases was that the JRC database on cooling
systems considered plants with a capacity higher than 100MWe, plus that it is based on a lower
resolution of types of cooling systems and sources of water intake.
Overall, both databases seem to indicate a fair comparison which provides some additional
confidence in the estimated values. However, differences in assumed cooling systems indicate that
further scrutiny in the future might be needed to further refine the definitions, characterisation and
identification of cooling systems.
Figure 33 Validation of capacity distribution of power plants >100 MWe in the JRC database and the database
developed in the pilot project (PP) (source JRC-IET).
0
50
100
150
200
250
0 1000 2000 3000 4000 5000 6000
Nu
mb
er
of
pla
nts
Capacity MWe
PP
JRC

CESNL13784 End Report 91
12.4 Industrial sectors data validation based on country sums
According to Eurostat the manufacturing industry accounts for about 6 billion m3 of gross water
(fresh surface water and groundwater) abstraction for cooling of processes. It must be noted that
Eurostat data does not provide a complete picture due to missing data for countries and due to the
fact that saline water is not reported. Another important limitation is that data as reported by
Eurostat covers more sectors than the sectors (or sub-sectors) studied in this pilot project.
Figure 34 below shows the reported total fresh water (including ground water) abstraction by
Eurostat for the year 2010, shown by the grey bars. This is compared with the total fresh water
abstraction as calculated in the pilot project, shown by the orange and blue bars. The blue bar
represents the lower bound of the estimate; the orange bar shows the higher estimate.
For reference the total water (fresh and saline) intake and consumption for the selected facilities is
shown in Figure 35.
The most important observations when comparing reported numbers are:
▪ Missing data for countries as reported by Eurostat renders comparison difficult and limited for
the EU as a whole.
▪ Estimates for Sweden, Netherlands, Belgium, Poland, Bulgaria and France are within range or
very close to the estimated value for the manufacturing industry total.
▪ For the Czech Republic the (higher) estimates is higher than reported cooling water use.
▪ For some countries we find that our estimate is too low: for Austria and Germany the higher
estimate is much lower than the reported numbers by Eurostat. A possible explanation could be
the assumption on installed cooling system being not accurate for these countries or the fact
the we are assessing only a subset of the manufacturing industry.
For the industrial sectors the same underlying causes of uncertainty that were discussed for the
power sector (section 12.2) when comparing the results from Eurostat with the numbers from this
pilot project. The most probable cause is the inaccurate assessment of cooling systems for the
industry as well as the limited scope of the industries considered. With rare exceptions, no detailed
information on the installed cooling system for the facilities were available. This rendered accurate
estimates of cooling water use difficult.
Another important cause of discrepancy is the difference in coverage of sectors: Eurostat covers a
broader range sectors than studied here. Therefore, the number and production output of plants is
another source of uncertainty. Finally, the rough way in assessing specific water use per tonne
product or input is a very important source of uncertainty. Taking this into account it is not possible
to draw firm conclusions regarding the data quality of the water use estimates in the database. The
results suggest that estimates are within the right order of magnitude while the range in the cooling
water use estimate is broad. The values reported by Eurostat provide some hint that water intake
values may be overestimated in this study and that the upper estimates for facilities can be regarded
as conservative. Further it is important to note that this validation step does not provide information
that would allow an assessment of the accuracy of estimated cooling water use for any individual
power plant.
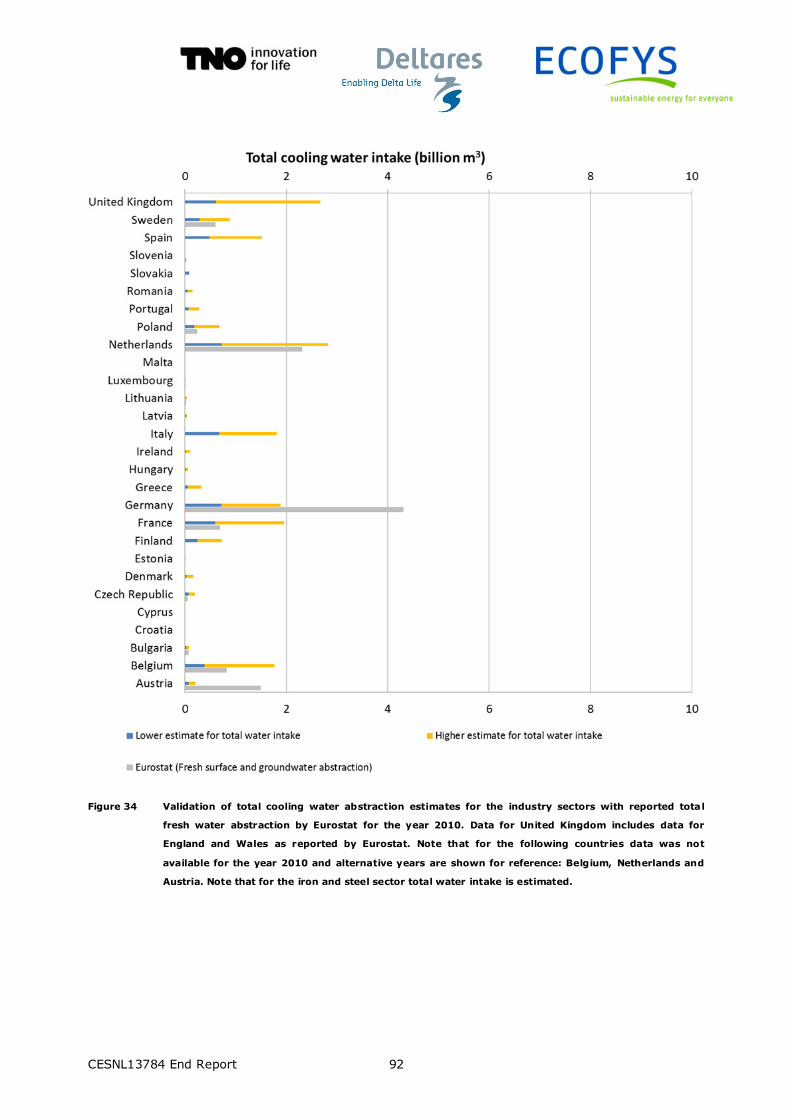
CESNL13784 End Report 92
Figure 34 Validation of total cooling water abstraction estimates for the industry sectors with reported total
fresh water abstraction by Eurostat for the year 2010. Data for United Kingdom includes data for
England and Wales as reported by Eurostat. Note that for the following countries data was not
available for the year 2010 and alternative years are shown for reference: Belgium, Netherlands and
Austria. Note that for the iron and steel sector total water intake is estimated.

CESNL13784 End Report 93
Figure 35 Estimate of total saline and fresh cooling water intake and consumption by selected industrial facilities
within the industry sectors under study (Refineries, Chemical and the Iron and Steel sector) in the
EU28. Note that for the iron and steel sector total water intake and consumption is estimated.
The total estimated cooling water use for the three industry sectors is provided in Figure 35. The total
of water intake for cooling24 ranges between 5.4 and 18.4 billion m3. The consumption is estimated to
be between 0.3 and 1 billion m3. Again, it is important to stipulate that there are challenges in
discerning saline and freshwater use for cooling in the three industry sectors while saline water
abstraction is not included in the Eurostat data.
12.5 Results data validation based on direct feedback
As part of the data validation phase, both sector organisations and national water institutes were
invited to quantitative feedback to the extent possible for cooling water use values for the year 2010.
A comprehensive data validation template and corresponding guidance document were prepared and
distributed. These are included in Appendix IV Data validation documents.
24 Note that for the Iron and Steel sector total water use (inc luding cooling) is estimated.

CESNL13784 End Report 94
Reviewers were requested to select one of the following categories when reviewing the quantitative
data on cooling water intake and discharge:
▪ Much too high, actual value is less than 20% of single value or low estimate
▪ Too high, actual value is less than 50% of single value or low estimate
▪ Actual value is close to estimate or within range
▪ Too low, actual value is more than 200% of single value or high estimate
▪ Much too low, actual value is more than 500% of single value or high estimate
Table 24 provides an overview of the feedback that had been received by the recent deadline. The
feedback received will be processed and evaluated. The final version of this report will include a
summary of the validation results.
Table 24 Overview of data validation results.
From the data validation that were send out, specific feedback was received from the power sector in
eight countries (Belgium, Finland, France, Germany, Spain, Sweden, The Netherlands and The United
Kingdom).Furthermore, three validation sheets were received from water authorities (Austria, Finland
and Ireland). The feedback included reviews of both the quantitative and qualitative data.
In total, feedback (either quantitative or qualitative) was received for almost 200 facilities. This is
approximately 20% of the facilities included in the selection. It should be noted that the majority of
the received feedback related to power plants. For the quantitative part, we received feedback on
water intake for 64 facilities and on water discharge on 60 facilities, which is about 6% of the total
number of power facilities included in this project. Table 25 shows the results of the data validation.
Country
Power
Sector
Iron and
Steel
Sector
Refineries
Sector
Chemical
Sector
Water
authorities
AustriaBelgiumBulgariaCroatiaCyprus *Czech RepublicDenmarkEstoniaFinlandFrance Comprehensive dataset f rom questionnaireGermany Data validation feedback receivedGreece No data validation information returnedHungary Validation based only on statistical sums onlyIreland *ItalyLatviaLithuaniaLuxembourgMalta *PolandPortugalRomaniaSlovakiaSloveniaSpainSw edenThe NetherlandsThe United Kingdom
Percentage of facilities included in validation phase 93% 88% 97% 88%
* Here we did not do data validation for the sector as we received actual data on (almost) all selected power plants
Data validation by:

CESNL13784 End Report 95
This summary only relates to data validation of estimated values, while plants for which specific data
had been received before (which was screened independently) are not part of this sample.
Table 25 Results of quantitative data validation
Category Cooling water
intake
Cooling water
discharge
Much too high, actual value is less than 20% of single value or low
estimate
14 12% 11 11%
Too high, actual value is less than 50% of single value or low estimate
6 5% 7 7%
Actual value is close to estimate or within range
90 76% 77 75%
Too low, actual value is more than 200% of single value or high
estimate
5 4% 4 4%
Much too low, actual value is more than 500% of single value or high
estimate
4 3% 3 3%
Based on the results it can be concluded that the major part of the validated estimations is within
range. If not within range, then in most cases results tend to be an overestimate of the actual value.
Besides feedback on the quantities, feedback was received on the facility details (e.g. cooling system,
facility name, type of water bodies, etc.). Some preliminary findings from this feedback include:
▪ The way in which Combined heat and power systems (CHP) needs to be improved. According to
feedback from the Northern European countries and Germany in particular, the water use for
cooling of CHP-plants were overestimated. In many cases the actual CHP plants did not use
cooling water at all;
▪ In the Northern European countries, CHPs are mainly used for heat production, especially
during the winter months. During the summer months, plants are only used for emergency or
not at all. This seasonal influence had not yet been adequate reflected in the load hour
distribution that is used to calculate the monthly water intake and discharge;
▪ For several facilities the name of the facility and/or the operator of the plant included errors. In
some cases correction were made, which were incorporated in the database;
▪ Some facilities were missing from the selection. In case we received data on these facilities,
they will be added to the selection.
Power sector
Feedback from the power sector included quantitative information for some countries and corrections
of data on plant characteristics for some countries.
Eurelectric flagged an overall concern that estimated data appear to contain errors, uncertainties and
wrong estimates and that such information on individual plants. It underlined the importance of
putting in place a procedure to allow plants’ operators to correct any mistake they may have
identified in the database.
Furthermore, based on both the quantitative feedback and feedback on the report, it was concluded
that there is room for improvement in adequately accounting in the cooling water use estimates for

CESNL13784 End Report 96
power plants that export part of their heat (for example Combined Heat and Power Plants and / or
plants that are linked to district heating systems). This issue is a source of uncertainty in the cooling
water use values included in the database for these types of power plants. There are two problems
that drive this uncertainty:
▪ Many of these plants have no cooling tower, which – in the absence of more specific
information – could result in an assumed once-through cooling system leading to a substantial
overestimate of the cooling water intake volumes.
▪ The extent to which heat is exported is a key driver for cooling water use, as any heat exported
need not be discharged through a cooling system. However, heat export systems may operate
only part-time or at partial capacity. Furthermore, plant operating modes may be power-
generation-driven or heat-export driven.
Adequately reflecting cooling water use of power plants with CHP and / or heat-export systems thus
requires detailed information on the type of system and the mode of operation. Such data was not
shared and could therefore not be taken into account. As a consequence, estimated cooling water use
values for these plants in the database at this time come with a significant uncertainty margin.
Iron and steel sector
The irons & steel sector indicated in a letter dated 6th June 2014 that their membership were not
willing to confirm or comment on the quantitative information provided in data validation sheets.
Separately, monthly water intake was received for a single integrated iron and steel plant in Slovakia,
shown in Figure 36. The reported data covers cooling water and other water use, although this is not
defined in detail. The figure shows a relative stable water intake over the months, in line with our
estimate for iron and steel plants. The annual total as reported for this facility ranges between 22 and
33 million m3 in the period 2004-2013. The estimated value for the year 2010 ranged between 34
and 97 million m3. The estimated value, or range, is thus too high for this specific facility, albeit that
the lower end of the estimated range is actually close to the range reported for the facility.
Figure 36 Water intake for an integrated iron and steel facility in Slovakia. The blue area shows the minimum
and maximum values reported for monthly water intake in the period 2004-2013. Note that this graph
covers surface water intake only as information on groundwater intake on a monthly basis was not
provided.

CESNL13784 End Report 97
Refineries sector
Concawe provided high-level feedback, confirming that the approach followed was appropriate, given
the lack of location-specific data.
For one refinery we have received detailed information during the validation phase. For this inland
located refinery we have received information on the monthly water intake, shown in the Figure 37.
The figure shows clearly the seasonal influence on the annual intake profile for this refinery. This
provides interest insight especially with regards to our estimate that the annual profile of cooling
water intake is stable over the year. The data for this single refinery suggests that this intake is not
stable over the year. Alone this information does not provide enough significance to discard our
assumption, but should not be ignored when reviewing monthly data contained in the database.
The total annual cooling water intake is reported between 43 and 61 million m3. Our estimate for this
facility ranged between 0.1 and 203 million m3. The actual value is thus within this wide range of
values.
Figure 37 Cooling water intake for a refinery in Slovakia. The blue area shows the minimum and maximum
values reported for monthly cooling water intake in the period 2004-2013. Note that this graph covers
surface water intake only as information on groundwater intake on a monthly basis was not provided.
Chemical sector
From the ethylene production sector we have received feedback on our estimates. This includes
feedback regarding the installed cooling system for various facilities, next to information on the type
(seawater) that was taken in for cooling purposes. Based on this feedback it was possible to refine
the estimated cooling water use for those facilities to some extent, although still large uncertainties
remain in the estimated cooling water use. A specific note was included coming from experts in the
sector that the “estimations are too far from BREFS estimations for cooling water”.
Estimates on the cooling water use for ammonia production have been reviewed by experts from
members from Fertilizers Europe. The time constraint of this project posed some limitations on the
level of detail that experts review and validation could bring, but general comments on the approach

CESNL13784 End Report 98
has yielded valuable insights and refinement of the approach. The experts have made the general
comment that our initial estimate of cooling water use for ammonia production was in some cases too
low (2 times) and in others too high (2-5 times). Our first central estimate was 150 m3/t, but based
on the feedback it was assumed that 200 m3/t as a general number for the current installed capacity
would be more appropriate. For new plants a rate of 160-165 m3/ t could be assumed. As for the
ethylene sector the estimates are thus refined where possible, but also here large uncertainties
remain in the presented estimates of cooling water use.
For an ammonia production facility in Slovakia we have received information covering water use,
although it is not specific whether this reflects cooling water use or total water use. The annual
cooling water use was estimated with the approach detailed in section 9 to be between 5 and 47
million m3. The value reported ranges between 8 and 10 million m3/year. Based on this limited
information no firm conclusions can be drawn, but it suggests that order of magnitude is correct and
that the estimated value can be seen as a fair proxy.
Figure 38 Water intake for an ammonia production plant in Slovakia. The blue area shows the minimum and
maximum values reported for monthly water intake in the period 2004-2013.
For Poland we have received the statistics on total cooling water use in the Polish chemical sector in
2012. This amounts to an intake of 352 million m3 and a discharge of 338 million m3 . The estimate
for cooling water intake in our study ranges between 50 and 116 million m3. This most obvious
reason for this underestimation is the fact that this pilot study aims to only cover the production of
ammonia, ethylene and hydrogen. Other subsectors within the chemical sector are excluded and may
be responsible for the remaining cooling water use.

CESNL13784 End Report 99
12.6 Other comments received
Supplemental to the discussion on quantitative feedback in the previous section, the following
supplemental comments are highlighted:
a. Service Public de Wallonie expressed concern that some values appeared to be incorrect and
inconsistent on first review. However, they were not able they were not able to provide specific
quantitative feedback within the available timeframe. Because of this SPW indicated it opposes
the publication of this non-validated data included in the database. Following this remark it was
decided not to include quantitative values on cooling water use for the plants in Wallonie.
b. EDF France indicated that it is not in favour of producing real data on each plant considering
that huge variations on water intake, discharge and consumption in any given year related to
several factors. EDF has therefore proposed to consider the average values of intake, discharge
and consumption of each type of power plant and each type of cooling system. Fleet-average
values were submitted based on several years of operation. These provided the basis for
estimated cooling water use.
c. For Germany, BDEW indicated that the cooling water use values are falling within the estimated
range, albeit on the HIGH end of the estimate. It expressed concern that this might raise the
impression that the German power plants are inefficient in their cooling water use, which does
not match reality according to BDEW.
d. Energia from Finland and Svensk Energie from Sweden underscored the importance of
Combined Heat and Power plants in their countries and the need to ensure that the
corresponding cooling water use (or lack thereof) be adequately addressed.
e. Various parties requested that they would be allowed to review the data on cooling water use
in the future, that they wanted be able to provide updated or corrected values to be included in
the database.

CESNL13784 End Report 100
13 Catalogue of Measures to reduce vulnerability
13.1 Introduction
This chapter provides a first outline in identify measures to mitigate the vulnerability of facilities to
limitations in the availability of cooling water supply. Based on the interaction with the sectors and
the limited data received it was not feasible to prepare an appropriate full catalogue of measures.
However, a structure for a database is proposed in the first section of this chapter to allow for the
identification and characterisation of mitigation measures in future work on this topic.
During discussions with sector representatives and experts it became clear that the nature, focus and
duration of this study does not allow for a detailed and well supported set of mitigation measures for
a number of reasons:
1. It would require more a BREF like approach seeking input and validation by multiple industrial
sectors and experts to allow for creating a balanced set of mitigations measures with agreed
characteristics.
2. There will be site-specific trade-offs between cooling water use, efficiency of the plant, other
environmental impacts and costs that need to be considered in a coherent way.
3. There is a broad variety of plants and cooling systems, which tend to be designed for specific
local circumstances. This means that measures for reducing vulnerability would have to be site
specific.
It was therefore decided to focus on conceptual measures, based on the contents of existing BREF
documents. Secondly, the chapter discusses the kind of considerations are important to take into
account when considering new cooling approaches (or alterations in them) within industrial and
power sector a viable option or even Best Available Technology. This chapter builds on BREF
documents for the sectors under study and the horizontal BREF on industrial cooling systems.
13.2 Vulnerability indicators
An analysis of existing vulnerability indicators for water scarcity was carried out, included in Appendix
VI Vulnerability and water risk indicators earlier used. Secondly, a tentative definition is proposed
for a vulnerability indicator that could be applied when considering cooling water use, reported in
Appendix VII Vulnerability indicators.

CESNL13784 End Report 101
13.3 Proposed outline for Catalogue of Measures
For every measure certain data elements are to be assessed where possible. The data elements are
described below, providing guidance when analysing and expanding the set of measures in the
catalogue.
Table 26 Overview of database elements proposed in the ‘Catalogue of measures database‘
Element in the database Description and guidance for filling in this element of
the database
Measure_ID Unique identifier for the measure
Measure (short name) Short name for the measure for reference
Measure (description) Description of the measure, how it works and how it can be applied
Applicable sector Indicates per sector under study (Iron & steel, Power, Refinery and chemical) whether the mitigation measure is applicable
Applicable facility Indicates whether certain facilities or type of facilities are included or excluded. For example, building a cooling tower has limited use when the facility already has a cooling tower on site.
Region of application Indicates whether mitigation measures are restricted to certain locations or regions in the EU.
Type of measure Indicates whether the mitigation measure is of technical, operational, regulatory or financial nature
Owner of measure Indicates the legal person (public / private/ both) that is responsible for the measure.
Target of measure Indicates whether the target of the measure is the facility of the water body. Typically a measure focusses on one of both.
Type of mitigation
Indicates the type of mitigation the measure aims for: the user can select from a pre-defined list of type of mitigations. For example, the measure can aim for reducing the water intake volume or for reducing the total heat load of the discharge.
Effectiveness Assesses where possible in quantitative terms the effectiveness of the measure.
Maturity Assesses the maturity of the measure: lab/ pilot, emerging or mature.
Costs & Feasibility Assesses the costs and feasibility of the measure. Where possible quantitative estimates of the costs are provided.
Side effects Identifies possible environmental and economic side effects of implementing the measures. See guidance in BREF Economics and Cross media effects.
Reference(s) A reference to more background information on the measure. This links to the sheet 'References' where detailed bibliographic information is provided.
13.4 Selection of cooling approaches and techniques
A variety of applications and combinations of cooling systems can be found on industrial sites and
power plants, based on process, site, environmental and economic requirements and constraints. The
selection of the type of cooling system typically depends on several factors, including temperature
difference that needs to be cooled, the size of process (in MWth cooling need), local site configuration
and space availability, geographical and seasonal effects. The geographical situation of a facility
determines the access to sufficient cooling water in the form of fresh or salt (or brackish) water. The
quantity and temperature of the intake water and its temperature is likely to vary from year to year
and over the course of the seasons. Other seasonal effects are related to the temperature and
humidity of the air, also affecting the cooling capacity of the cooling system.

CESNL13784 End Report 102
The cooling system design needs to accommodate these annual and seasonal variations in order to
provide adequate cooling capacity to allow operation to continue within the limits of the permit and
also to ensure plant efficiency is not compromised unduly.
When selecting a cooling system configuration for a plant, it is important to understand that there are
environmental and economic trade-offs and that these are site-specific. Some key aspects are
presented in Figure 39 and were discussed earlier in section 3.4. An integrated approach is needed
that takes into account all these aspects when considering an optimised cooling system and site-
specific trade-offs that are inherent to this. A full discussion of such an evaluation and how to
consider these trade-offs is beyond the scope of this pilot study. Reference is made to the relevant
BREF documents where these are discussed.
Merely as an illustration, some such trade-offs are mentioned that occur when comparing a highly
recirculating system with a once-through cooling system are described below:
▪ The recirculating system would typically result in lower volumes of cooling water intake.
▪ Cooling water consumption, however, would be higher for recirculating system due to
evaporation, while in a once-through system in many cases all of the intake water is returned
to the water body.
▪ Cooling water temperature in the recirculating system (upstream of the process) may well be
above that of the intake water in a once-through system. Typically, this reduces the overall
plant efficiency and may thus lead to extra cost in terms of energy and higher emissions.
▪ The construction of a recirculating cooling system could come at higher cost, affecting the
overall economics of the facility.
▪ The recirculation circuit requires the injection of small quantities of chemicals into the cooling
circuit to assure a proper operation of the cooling process to prevent amongst others algae
growth, corrosion or scaling. These substances, however, are eventually released to the
environment.
When considering these kind of trade-offs, it is not surprising that the BREF points to the fact that
once-through cooling systems are a best practice solution, notwithstanding the relatively high cooling
water intake volumes for such systems. This illustrates the fact that an integrated approach is
required when aiming for and optimal cooling water system design. Such an integrated evaluation is
also warranted when considering measures to change such system or to minimise the vulnerability of
facilities to limitations in the availability of cooling water supply.

CESNL13784 End Report 103
Figure 39 Key aspects to consider when evaluating a site specific best available technology solution for industrial
cooling
13.5 Conceptual mitigation measures
This section provides a summary of conceptual measures to reduce cooling water use and waste heat
discharge into the environment as one potential way to reduce vulnerability. However, this would
require careful evaluation of the trade-offs discussed in the previous section and may not be
desirable. Furthermore, gross and net use of cooling water need to be clearly distinguished in this
process.
Conceptually, measures may consist of:
1. Increase efficiency: with increasing process efficiency less thermal energy needs to be removed
from the process. This reduces the cooling need and with it the need for cooling water use in
the case of cooling with water.
2. Reduction of the level of heat discharge by optimization of internal/external heat integration /
re-use: next to optimizing the primary process, the export and consumption of excess heat can
be a means to reduce the cooling need and water use.
3. Reduce water use and heat discharge. The last step can be broken down into:
- reduction of water requirement and;
- a reduction of heat emissions.
Both ways are discussed in further detail below. They are linked where there are trade-offs
between both approaches.
Site specific
BAT solution
increasing the overall energy
efficiency
effect on investment
and operational
costs
reduction of use of water
and of cooling water
additives
reduction of emissions to air and water
reduction of noise
reduction of entrainment
of aquatic organisms
reduction of biological
risks.

CESNL13784 End Report 104
Reduction of heat emissions
The BREF for industrial cooling systems mentions several options to reduce heat emissions into the
environment, see Table 27. The BREF mentions that in practice, limits to heat discharge were
applicable, the solution was to change from once-through technology to open recirculating cooling
(open wet cooling tower). However, this is site dependent as in some cases space and /or planning
consents would not allow it or because of the drawbacks in terms of efficiency of retrofitting a
different cooling system to the original design. It can therefore not be considered BAT by definition.
Table 27 Applied reduction techniques reducing heat emission (source: BREF 2001)
Measure Description
Cooling approach
and technology ▪ The best way to minimise heat emissions is to reduce the need for
discharge by optimising the primary process or to find consumers for
the excess heat.
▪ The environmental impact of heat discharge can be minimised by
discharging more heat into the atmosphere and less heat into surface
waters at the expense of water loss due to evaporation.
▪ Minimisation of heat discharges to the surface water is linked to the
minimisation of water use and to the overall energy efficiency.
▪ The more heat is discharged by convection and evaporation, the more
energy per discharged MWth is required due to use of fans, unless
natural draught is applied. This generally needs large investments and a
lot of space.
▪ An old practice still in use in Europe, but on a very small scale and
recently attracting fresh attention, is the use of evaporative (spray)
ponds. To assess this technique it should be compared with a cooling
tower of similar capacity.
Reduction of cooling water requirement
An overview of BAT for reducing water requirement in industrial cooling systems is presented in Table
28.
Table 28 Best available technology for reduction of water requirements (source: BREF 2001)
Relevance Criterion Primary BAT approach Remarks All wet cooling systems
Reduction of need of cooling Optimization of heat reuse
Reduction of use of limited sources
Use of groundwater is not BAT
Site-specific in particular for existing systems
Reduction of water use Apply recirculating
Apply recirculating systems
Different demand on water conditioning
Reduction of water use, where obligation for plume reduction and reduced tower height
Apply hybrid cooling system
Accept energy penalty
Where water (make-up water) is not available during (part of) process period or very limited (drought-stricken areas)
Apply dry cooling Accept energy penalty
All recirculating wet and wet/dry cooling systems
Reduction of water use Optimization of cycles of concentration
Increased demand on conditioning of water, such as use of softened make-up water

CESNL13784 End Report 105
13.6 Economics of mitigation measures
Economics of reducing the cooling water use and excess heat discharge tend to be very site-specific.
The BREF therefore provides only rules of thumb. Some examples and cost structures are discussed
to present the reader with basic insights into the cost elements and order of magnitude of costs.
These, however, cannot be applied to any specific plant. Local circumstances including cost of water,
cost of energy, taxes, technical characteristics have a strong influence and should be considered
when drafting a detailed set of mitigation measures for the use of cooling water.
Following the conceptual approach of the three steps presented in the section above, a high level
discussion of associated costs is presented in this section.
1 Increase efficiency
Costs of reducing the vulnerability to availability of cooling water greatly depend on the starting
point, taking into account the primary process that is cooled and energy costs. The net costs may be
negative if savings outweigh costs, but could also come at substantial cost.
2 Reduction of heat discharge by optimization of internal/external heat reuse
Internal use or selling excess heat to consumers, e.g. industrial process heat or district heating, may
be an economically viable solution depending on the local circumstances related to proximity of heat
demand, technical configuration, geographical specifics and the regulatory framework. All such
factors have a strong influence in the cost and benefits of this mitigation measure. Typically, this is a
measure which is part of the station planning stage. Once a power plant is built it may be difficult and
costly to retrofit such a system or exploit a new potential heat load arising.
3 Reduce water use and heat discharge
Table 29 presents indicative costs of industrial cooling systems based on the BREF, for non-power
applications. The cost differences do not indicate a preferential or least expensive variant. The
estimate of what is feasible in the mitigation of water use and heat discharge should be assessed on
a case by case basis and depends on the requirements by (local) authorities and the site specific
limitation and possibilities. Furthermore and as was discussed before (section 3.4), there are
substantial trade-offs to consider, for example in terms of efficiency of the primary process and other
environmental impacts.
Table 30 presents an example from the BREF for the relative cost of alternative cooling systems for
application in the power sector, in this case a relatively small combined cycle power plant.

CESNL13784 End Report 106
Table 29 Indicative cost of industrial cooling systems for non-power applications (source: IPPC BREF 2001)
Cooling system Total investment Operational cost Interest and
depreciation
General total
annual costs
€/MWth €/MWth €/MWth €/MWth
Once-through 77-227 8-16 10-30 18-46
Indirect once-
through
100-269 10-19 13-37 23-56
Recirculating with open
wet cooling tower
89-266 19-41 11-35 30-76
Indirect recirculating with open wet cooling
tower
112 -331 20-43 14-43 34-86
Dry air cooling 105-288 3-9 14-38 17-47
Indirect air
cooling
123-351 5-14 16-46 21-60
Table 30 Relative cost of different cooling systems for a combined cycle unit of 290 MWth (source: IPPC BREF 2001)
Water cooled condenser Air-cooled
condenser
Type of cooling tower None, once-through cooling
Natural draught
Induced draught
Relative cost of cooling
system
0.82 1.1 1 1.54
13.7 Recommended steps in considering mitigation measures
Firm conclusions on mitigation measures cannot be put forward based on this limited set of
information. An optimal cooling system and thus the volume of cooling water use and waste heat
discharge depends very strongly on site specific conditions.
When assessing means to reduce the vulnerability of industry to limitations in cooling water use it is
of high importance to take an overall perspective and also assess important environmental and
economic trade-offs.

CESNL13784 End Report 107
14 Conclusions and Executive Summary
14.1 Role of cooling water
a. Cooling water plays an essential role in the efficient operation of plants in the different sectors
considered in the present study: power sector, iron and steel sector, refineries and chemical
sector.
b. Cooling water intake and discharge usually is subject to specific regulations and permit
requirements that may define limits to the volumes taken in, temperature (or temperature
difference) of the cooling water discharge and reporting on cooling water intake and discharge.
c. There are known cases where plant operation was affected by constraints in cooling capacity,
either associated with high ambient water temperature or low water quantities available. When
considering the potential impacts of climate change, the present study aims to contribute to an
understanding of vulnerability of the European economy by providing quantitative information
on cooling water use.
d. Cooling water use may involve significant quantities of water when compared to other water
uses, particularly in case of once-through cooling systems. However, with these systems
virtually all water that is taken in, is returned to the water system albeit at a slightly higher
temperature. As a consequence the environmental impact of cooling systems tends to be
limited.
e. When selecting a cooling system configuration for a plant, it is important to understand that
there are environmental and economic trade-offs and that these are site-specific. An integrated
approach is needed that takes into account all these aspects when considering an optimised
cooling system and site-specific trade-offs that are inherent to this. A full discussion of such an
evaluation and how to consider these trade-offs is beyond the scope of this pilot study. Merely
as an illustration, some such trade-offs are mentioned that occur when comparing a highly
recirculating system with a once-through cooling system are described below:
- The recirculating system would typically result in lower volumes of cooling water intake.
- Cooling water consumption, however, would be higher for recirculating system due to
evaporation, while in a once-through system in many cases all of the intake water is
returned to the water body.
- Cooling water temperature in the recirculating system (upstream of the process) may
well be above that of the intake water in a once-through system. Typically, this reduces
the overall plant efficiency and may thus lead to extra cost in terms of energy and higher
emissions.
- The construction of a recirculating cooling system could come at higher cost, affecting
the overall economics of the facility.
- The recirculation circuit requires the injection of small quantities of chemicals into the
cooling circuit to assure a proper operation of the cooling process to prevent amongst
others algae growth, corrosion or scaling. These substances, however, are eventually
released to the environment.

CESNL13784 End Report 108
14.2 Definitions and terminology
f. It is essential to ensure detailed understanding and clear definition of terminology used when
considering cooling water use and cooling systems, in order to obtain reliable and consistent
results in data gathering and validation. Key issues in this respect include the delineation of
cooling water versus other process water and the details of cooling system design. Alignment
with the respective sectors is essential in ensuring appropriate definitions. Respondents that
were asked to fill in questionnaires or validate estimated values often used different
interpretations of definitions, especially related to cooling systems. Such misinterpretation of
cooling system risks influencing the ‘pigeonholing’ approach used in this study.
Misinterpretation of the definitions and descriptions of cooling systems used in this study
increases the uncertainty of the specific water use parameters that has been determined by
data analysis and subsequently included in the database.
g. When considering the different types of cooling system it is important to note:
- In many cases plants have more than one cooling system which may be of a different
type and may rely on different sources of cooling water. This may be the result of
different cooling needs, plants having been expanded with new units while technology or
regulations may have changed over time.
- There are two main classes of cooling systems that rely on cooling water: once-through
cooling systems versus recirculating cooling systems. When considering a comparable
cooling need, a once-through cooling system requires and order of magnitude greater
volume of cooling water intake than recirculating systems. However, the almost identical
greater volume of water is discharged again, albeit at a higher temperature. So the
impact of this may well be limited.
14.3 Availability of data
h. It was expected that it would be a challenge to gather actual data on cooling water use.
However, a shortage of willingness to share plant specific data was encountered more broadly
than expected. Some sectors indicated that they were not willing to provide detailed and plant-
specific data on cooling water use due to commercial sensitivity. However, some of these were
willing to provide detailed cooling water data for anonymous plants and basic characteristics for
all plants on a non-anonymous basis. It was agreed that the best approach would be to use the
anonymous data to prepare differentiated estimates for cooling water use values for the plants
of a comparable type. The term “pigeonholing approach” was introduced to refer to this
method.
i. Specific information on cooling water temperatures (inlet and discharge) could not obtained
from the sectors and it was subsequently decided not to consider this as part of the present
pilot study.
j. In parts, the resulting quantitative information is based on plant-specific data while other parts
rely on estimated values. There will be a substantial difference in accuracy of these respective
types of information. It was therefore decided to show results in terms of a bandwidth in case
these were based on estimates and to present a low-estimate and a high-estimate in the
cooling water database that aim to represent first and third quartile values for a population of
comparable plants. In this way, one would expect that 50% of the actual values fall within the

CESNL13784 End Report 109
estimated range, while 25% of cases would have a water use greater than the high estimate
and 25% of cases with a water use lower than the low estimate.
k. As mentioned before, that in order to consider measures for reducing cooling water intake
would require detailed considerations of the design of the plant, the water availability at the
site and the trade-offs in costs, plant efficiency and environmental impacts that this would
involve. Such plant-specific information could not be acquired by the project team from the
sectors. It was therefore decided to limit that part of the pilot study to a conceptual description
of measures based on information available in the BREF.
l. It did not provide practical to obtain direct data at the same 12-year timespan and 1-month
time resolution that the output information required. Firstly, companies were not willing to
share such detailed information due to commercial sensitivity and secondly this would have
required a prohibitive amount of time in completing the questionnaire. As a consequence, it
was decided to use the year 2010 as a base year. Subsequently, estimates for cooling water
use for the 12-year timespan and 1-month time resolution were derived from this base year
based on sector production statistics. It was noted 2010 may be considered an atypical year for
some sectors due to the economic downturn that had started just before. However, this should
be adequately compensated for through the sector production statistics used.
14.4 Key factors governing cooling water use
m. The main factors that govern average cooling water use by a plant include:
- The primary processes in place (including their scope and range of sub-processes), plant
efficiency, heat integration (waste heat), and associated need for cooling.
- Configuration of the cooling system, in particular with respect to the question if this is a
once-through or recirculating system, with an associated recirculation rate. This in turn
affects consumption of cooling water, i.e. not being discharged back into a water body.
- Heat discharge and export by other means, including heat export for productive use
elsewhere or air cooling. The export of heat to other processes or outside the facility for
useful purposes decreases the need for cooling, e.g. combined heat and power
generation with district heating. The presence and amount heat export significantly
affects the amount of heat being discharged into the environment and the specific water
use of facilities. Furthermore, in the power sector the operational mode of facilities
equipped with heat export differs from those aimed at solely power production.
Information on the presence and amount of heat export is currently incomplete. More
exact location specific information on the presence and amount of heat export could
further improve the water use estimates.
n. Beside average cooling water use, there tends to be substantial variation in cooling water use
over time that can only partly be assessed without detailed plant-specific data. These may be
associated with:
- New plants being commissioned or old plants being decommissioned or mothballed.
- Trends in plant production, associated with economic activity and developments in the
sector.
- Seasonal patterns associated with changes in demand for plant output over the year.
- Seasonal patterns associated with air and water temperatures.
CESNL13784 End Report 110
- Transient changes in plant operation due to temporary shut-downs, turn-arounds for
maintenance or plant debottlenecking projects.
14.5 Use of geo-localised database on cooling water use
o. This pilot project has delivered a database that provides a comprehensive dataset on cooling
water use in 4 key sectors for the EU28 countries: power generation, iron & steel, refineries
and chemical sector. The resulting database is intended to be used as input in water accounts
modelling work by EEA.
p. The dataset includes collected actual data from numerous plants but also estimated values for
those plants where no direct data could be obtained. However, given the inferences made, this
level of accuracy decreases when using the data at a more detailed temporal and geographical
scope. In part, this is related to the way in which cooling water values were estimated where
no actual data is available. However, the typical variations in plant operation for operational or
economic reasons are also key in this respect. Thus, monthly data are more uncertain than the
yearly data and the plant specific data are more uncertain than the country or sector
estimates.
q. As such the database can be used to inform industry and governments with a fair
approximation of average cooling water use in different sectors and regions. It is suitable for
aggregated assessments on the level of river basin, country or region, without detailed
temporal resolution or doing plant-specific analysis.
r. The varying degrees of accuracy of the data in the database due to their different origins
should be duly taken into account when using this data. In particular, the users of the database
should carefully consider the origin (reported or estimated) of information as reported in the
database.
s. Local and plant-specific design, natural environment and specific circumstances can have a
strong influence on actual cooling water use. As a consequence the estimated cooling water
use values considered in this pilot study can only be considered a preliminary estimate in case
of an average situation. Actual cooling water use by specific plants should be expected to
deviate substantially from such average values and will vary over time.
t. Because of this, the cooling water use values presented cannot be used for comparing or
benchmarking plants or to consider plant-specific measures for optimising cooling water use.

CESNL13784 End Report 111
References
Brown, H.L., B.B. Hamel, B.A. Hedman, Energy analysis of 108 industrial processes, as prepared by
Drexel University Philadelphia, U.S. Department of Energy, Published by The Fairmond Press, Inc.,
Distributed by Prentice-Hall, 1996
Best Available Techniques (BAT) Reference Document for the Refining of Mineral Oil and Gas,
Prepared under the Industrial Emissions Directive 2010/75/EU, JRC Institute for Prospective
Technological Studies - Sustainable Production and Consumption Unit, European IPPC Bureau,
European Commission PB/EIPPCB/BREF_Final_Draft July 2013
CONCAWE 2010 Effluent Quality and Water Use Survey, A factual summary for the IED-TWG that
elaborates the revision of the Refinery Best Available Techniques Reference Document V4, CONCAWE
Brussels, January 2013
Best Available Techniques (BAT) Reference Document for the Production of Iron and Steel, Prepared
under the Industrial Emissions Directive 2010/75/EU, JRC Institute for Prospective Technological
Studies - Sustainable Production and Consumption Unit, European IPPC Bureau, European
Commission EUR 25521 EN, 2013
EEA 2012 Catchments and Rivers Network System - ECRINS v1.1 Rationales, building and improving
for widening uses to Water Accounts and WISE applications, European Environment Agency.
http://www.eea.europa.eu/publications/eea-catchments-and-rivers-network/download
Edwards 2013, The Power Sector Use of Water & the Blueprint ad hoc Modelling Group
(ENV/485/2012 version 2), Neil Edwards, (RWE Npower, Eurelectric Nominee - Blueprint ad hoc
Modelling Group).
http://www.eurelectric.org/events/blueprint-for-europe%27s-waters-the-role-of-the-power-
sector/proceedings/
Pöyri and VITO 2012, Development of Prevention Activities to halt desertification in Europe, Service
Contract to contribute to the building of Water and Ecosystem accounts at EU level -for DG
Environment. Water Ecosystem Account.
http://ec.europa.eu/environment/water/blueprint/pdf/WaterEcosystemAccount1.pdf
http://ec.europa.eu/environment/water/blueprint/pdf/WaterEcosystemAccount2.pdf
http://ec.europa.eu/environment/water/blueprint/pdf/WaterEcosystemAccount3.pdf
http://ec.europa.eu/environment/water/blueprint/pdf/WaterEcosystemAccount4.pdf
‘BREF Cooling’ , 2001, Integrated Pollution Prevention and Control (IPPC) Reference Document on the
application of Best Available Techniques (BAT) to Industrial Cooling Systems, December 2001
BREF LCP (June 2013), Best Available Techniques (BAT) Reference Document for the Large
Combustion Plants Industrial Emissions Directive 2010/75/EU Joint Research Centre, Institute for
Prospective Technological Studies Sustainable Production and Consumption Unit, European IPPC
(Integrated Pollution Prevention and Control) Bureau. Draft 1 June 2013

CESNL13784 End Report 112
UK Environment Agency, 2011 Best available techniques, “Mid-merit plant operation for existing
plants” Paper for the UK BREF working group comprising DEFRA, SEPA, NIO, ENVIRONMENT AGENCY,
INDUSTRY AND NGO. Available at: http://www.environment-
agency.gov.uk/static/documents/Business/UKTWG2_Final_mid_merit.pdf
Van Hoorn, 2013, personal communication.
ENTSO-E (2013) E DETAILED MONTHLY PRODUCTION (IN GWh) (Database: 30.10.2013)
https://www.entsoe.eu/data/data-portal/production/
Macknick et al (2012). Operational water consumption and withdrawal factors for electricity
generating technologies: a review of existing literature. Environmental Research Letters. (7) (10pp)
doi:10.1088/1748-9326/7/4/045802
Eurelectric, Power Statistics 2010 http://www.eurelectric.org/powerstats2011/
IEA 2005 IEA Energy statistics manual. OECD/IEA, 2005
Ecofys 2013 International comparison of fossil power efficiency and CO2 intensity
IEA Clean Coal Centre, 2012, Clean Coal Technology for Power: Global Status and Prospects
,John Topper, IEA Clean Coal Centre, London, presented at: “Cleaner and more efficient
coal technology in Russia”, Moscow, 10 December, 2012
Concawe, 2010, CONCAWE’s 2010 Effluent Quality and Water Use Survey, accessed 2013.
Oil and Gas Journal’s (OGJ) Worldwide Refining Survey www.ogj.com
Koch and Vögele, 2009, Dynamic modelling of water demand, water availability and adaptation
strategies for power plants to global change, Ecol. Econ. (68) 2031–9
Van Vliet et al, 2013, Water constraints on European power supply under climate change: impacts on electricity prices, Environmental Research Letters (8) (10pp) doi:10.1088/1748-9326/8/3/035010
Rübbelke and Vögele, 2011, Impacts of climate change on European critical infrastructures: the case
of the power sector Environ. Sci. Policy (14) 53–63
WEI (Water Exploitation Index), information available at: http://www.eea.europa.eu/data-and-
maps/indicators/use-of-freshwater-resources/use-of-freshwater-resources-assessment-2
Wikipedia List of Nuclear Power Stations (retrieved April 2014),
http://en.wikipedia.org/wiki/List_of_nuclear_power_stations
WRI, 2013, Aqueduct METADATA document - AQUEDUCT GLOBAL MAPS 2.0
World Resource Institute, Working paper,
http://www.wri.org/sites/default/files/pdf/aqueduct_metadata_global.pdf

CESNL13784 End Report 113
Appendix I Definitions
I1 POWER SECTOR
Facility
A facility, or power plant, is defined as one or multiple electricity production units that are located at
one site. The level of reporting is the power plant, and not the individual generating unit. If multiple
units (either fired with the same fuel or not) are operating at one site than aggregated values should
be reported.
Main fuel type
For simplicity it is assumed that the power plant uses one primary fuel and conversion technology.
Eleven combinations of main fuel type and conversion technology are discerned: Biomass and waste,
Hard coal subcritical, Hard coal supercritical, Hard coal generic, Natural gas combined cycle, Natural
gas steam boiler, Lignite subcritical, Lignite supercritical, Lignite generic, Nuclear and Oil. Co-firing of
fuels (e.g. biomass) is not taken into account. If there are multiple units fired with different primary
fuels (e.g. a gas fired unit and a coal fired unit) then please state primary fuel and conversion
technology of the largest unit. If the plant fuel mix and mix of operating units is such that cooling
water use is variable depending on this mix then please comment.
Cooling system & cooling tower
Seven types of cooling systems are discerned using the definitions as provided in the Industrial
Cooling System BREF. Please select the most appropriate pre-defined cooling system. Site specific
situations that do not match the pre-defined descriptions can be noted in the comment box. If
multiple cooling systems are operational, then please report the dominant cooling system.
Cooling System (see example schematics below A-G))
Open: once-through direct
The coolant (i.e. water) is pumped from a source (e.g. sea, river, lake, groundwater), it passes through a heat exchanger (where heat is transferred from the process to the coolant through a partition wall), then it optionally passes through a cooling tower (where the heated water is cooled, through sensible heat loss, by contact with air) and, finally, it is discharged back to the receiving water.
A
Open: once-through indirect
The primary coolant (i.e. water) is pumped from a source (e.g. sea, river, lake, groundwater), it passes through a heat exchanger (where heat is transferred from the secondary cooling circuit to the primary coolant through a partition wall), then it optionally passes through a cooling tower (where the heated water is cooled through sensible heat loss by contact with air) and, finally, it is discharged back to the receiving water. In the secondary circuit, there is another heat exchanger (where heat is transferred from the process to the secondary coolant through the partition wall). Please note that, in a plant, there may be tertiary, quarterly, etc. cooling circuit(s).
B
Open: recirculating wet cooling system
The coolant (i.e. water) is pumped from a reservoir, it passes through a heat exchanger (where heat is transferred from the process to the coolant through a partition wall), then it passes through a cooling tower and, finally, it is collected back in the reservoir.
C

CESNL13784 End Report 114
Cooling System (see example schematics below A-G))
Closed circuit: dry
The primary coolant (i.e. air) passes through a heat exchanger (where heat is transferred from the secondary cooling circuit to the primary coolant through a partition wall) and is released to the atmosphere. In the secondary circuit, there is another heat exchanger (where heat is transferred from the process to the secondary coolant through the partition wall). Please note that, in a plant, there may be tertiary, quarterly, etc. cooling circuit(s). Example: air radiators.
D
Closed circuit: wet
The primary coolant (i.e. water) is pumped from a reservoir, it passes through a heat exchanger (where heat is transferred from the secondary cooling circuit to the primary coolant through a partition wall, which causes sensible and latent heat losses) and is collected back in the reservoir. In the secondary circuit, there is another heat exchanger (where heat is transferred from the process to the secondary coolant through the partition wall). Please note that, in a plant, there may be tertiary, quarterly, etc. cooling circuit(s).
E
Hybrid (wet/dry): open circuit
The heated cooling water first passes through a dry section of the cooling tower, where part of the heat load is removed by an air current. Afterwards, water is further cooled in the wet section of the tower. The heated air from the dry section is mixed with vapour from the wet section, thus lowering the relative humidity before the air current leaves the cooling tower, which reduces plume formation. Combined cooling systems can be operated either as a pure wet cooling tower or as a combined wet/dry cooling tower, depending on the ambient temperature.
F
Hybrid (wet/dry): closed circuit G
Cooling Tower type Description
Natural draught cooling tower Tower where the heated water is cooled through, depending on the cooling system, sensible and latent heat losses by contact with air
Mechanical draught cooling tower
Tower where the heated water is cooled through, depending on the cooling system, sensible and latent heat losses by contact with air. Mechanical cooling towers use fans to create the airflow
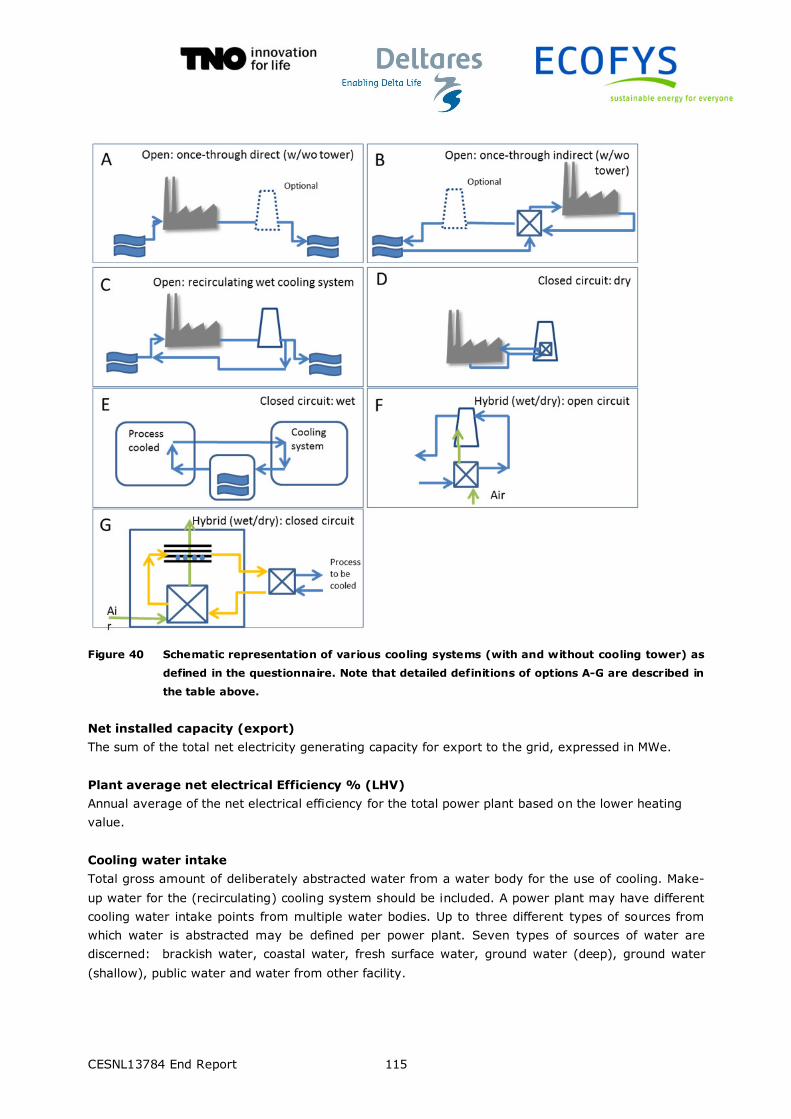
CESNL13784 End Report 115
Figure 40 Schematic representation of various cooling systems (with and without cooling tower) as
defined in the questionnaire. Note that detailed definitions of options A-G are described in
the table above.
Net installed capacity (export)
The sum of the total net electricity generating capacity for export to the grid, expressed in MWe.
Plant average net electrical Efficiency % (LHV)
Annual average of the net electrical efficiency for the total power plant based on the lower heating
value.
Cooling water intake
Total gross amount of deliberately abstracted water from a water body for the use of cooling. Make-
up water for the (recirculating) cooling system should be included. A power plant may have different
cooling water intake points from multiple water bodies. Up to three different types of sources from
which water is abstracted may be defined per power plant. Seven types of sources of water are
discerned: brackish water, coastal water, fresh surface water, ground water (deep), ground water
(shallow), public water and water from other facility.

CESNL13784 End Report 116
Cooling water discharge
Total gross amount of deliberately released liquid water used for cooling that is being discharged into
the aquatic environment. Water that leaves the power plant in gaseous form or bound into waste and
(secondary) products is not regarded as having been discharged. A power plant may have different
discharge points and may discharge into multiple water bodies. Up to three different types of water
bodies in which discharge occurs may be defined per power plant. Seven types of water bodies are
discerned into which discharge may occur: brackish water, coastal water, fresh surface water,
ground water (deep), ground water (shallow), public water, water to other facility. Leaks, losses and
rainfall are not taken into account in this study.
Cooling water consumption
Consumptive use of cooling water is calculated as the total amount of cooling water intake minus the
total amount of cooling water discharge. It is the portion of withdrawn water that is consumed
through evaporation, incorporation into a product, or waste materials, such that it is no longer
available for reuse.25
Main operating mode
The power industry is characterised by power plants operating at a range of different load factors.
Both total and specific cooling water use is affected by the mode of operation. Four different
operating modes are discerned based on the annual equivalent full load hours.
Main operating mode Description
Base load ‘base-load’ plant operating in excess of 4000 equivalent full load hours per year
Mid-merit mid-merit' plant operating in excess of 1500 equivalent full load hours per year
Peak load Peak load plant operating less than 1500 equivalent full load hours per year
Emergency Plants for emergency use that operate less than 500 hours per year
Other (please specify in
comment box) Please define in the comments field
Export of heat (e.g. district heating, heat transfer to other facility)
The capacity to export or transfer heat - not converted into electricity or discharged into the (aquatic
and atmospheric) environment - to another facility or system, e.g. a district heating system. The
default unit of reporting is MWth.
25 See also http://www.wri.org/sites/default/files/pdf/aqueduct_metadata_global.pdf

CESNL13784 End Report 117
I2 IRON AND STEEL SECTOR
Facility & scope
A facility, or iron and steel plant, includes all processes and units up to and including the continuous
casting process. Coke, sinter, pellets and pig iron may be procured externally instead of produced on
site. If these (half)products are produced on-site then those process are considered to be within the
scope of the facility. Downstream processes such as rolling and forging are assumed to be outside the
scope of the facility. Data requests always apply to the full scope of the facility as defined above.
Any combination of mentioned processes located on one site is considered one integrated plant, even
if the sub-processes each have different legal owners. This has the consequence that in the list of
Iron and Steel plants there are multiple E-PRTR IDs (column D in sheet Base Data IS) for one unique
Project ID (column C in sheet Base Data IS). Please report the requested information using the E-
PRTR codes of the facility name as main reference.
The present definition of cooling includes (if this step takes place on the site):
• Quenching of cokes
• Cooling of blast furnaces
• Cooling of machinery
• Water used for direct contact cooling of product (sometimes referred to as process water).
Dominant type of steel making
In this study a distinction is made between primary and secondary steel making. The process to
produce steel is categorised into three options: basic oxygen furnace (BOF), electric arc furnace
(EAF) and open hearth furnace (OHF). ‘Dominant type of steel making’ is defined here as the steel
making type with the highest production capacity on an annual basis.
Cooling water intake
Total gross amount of deliberately abstracted water from a water body for the purpose of cooling. A
facility may have multiple cooling water intake points from multiple water bodies. Two main
categories of sources from which water is abstracted are distinguished per facility:
salt or brackish water intake for cooling
fresh water intake for cooling
A further refinement of the types of sources of water is possible in the questionnaire: brackish water,
coastal water, fresh surface water, ground water (deep), ground water (shallow), public water and
water from other facility.
Cooling water discharge
Total gross amount of deliberately released liquid water used for cooling that is being discharged into
the aquatic environment. Water that leaves the facility in gaseous form or bound into waste and
(secondary) products is not regarded as part of this. A facility may have different discharge points
and may discharge into multiple water bodies.
Seven main types of water bodies are distinguished into which discharge may occur: brackish water,
coastal water, fresh surface water, ground water (deep), ground water (shallow), public water, water
to other facility. Leaks, losses and rainfall are not taken into account in this study.

CESNL13784 End Report 118
Cooling water consumption
Consumptive use of cooling water is calculated as the total amount of cooling water intake minus the
total amount of cooling water discharge. It is the portion of withdrawn water that is consumed
through evaporation, incorporation into a product, such that it is no longer available for reuse.26
Cooling system & cooling tower
Seven types of cooling systems are discerned using the definitions as provided in the Industrial
Cooling System BREF. Please select the most appropriate pre-defined cooling system. Site specific
situations that do not match the pre-defined descriptions can be noted in the comment box. If
multiple cooling systems are operational, and if applicable, then please report the dominant cooling
system for both salt/ brackish water intake as the fresh water intake. ‘Dominant cooling system’ is
defined here as the cooling system that takes in (not necessarily consumes !) the highest volume of
water on an annual basis.
Installed capacity
The total installed production capacity of steel making; expressed in the net output of tons of steel up
to and including the continuous casting process.
Export of heat (e.g. district heating, heat transfer to other facility)
The capacity to export or transfer heat - not converted into electricity or discharged into the (aquatic
and atmospheric) environment - to another facility or system, e.g. a district heating system. The
default unit of reporting is MWth. Please also report in the comment box whether or not a power and
heat production facility is installed at the site that is fed with fuel gases produced during the
steelmaking process, e.g. blast furnace gas (BFG), coke oven gas (COG) and basic oxygen
steelmaking (BOS) gas.
26 See also http://www.wri.org/sites/default/files/pdf/aqueduct_metadata_global.pdf
CESNL13784 End Report 119
I3 REFINERIES SECTOR AND CHEMICAL INDUSTRY
Facility
A facility is defined as one or multiple production units that are located at one site. The level of
reporting is at facility level, same level as E-PRTR reporting, and not the individual generating unit. If
multiple units are operating at one site than aggregated values should be reported.
Feedstock and production process
Several feedstock and production processes are indicated in the questionnaire. This allows easy filling
of the questionnaire. However, if one of the options on the predefined list does not accurately
matches the feedstock or production process at the site then please specify this in the comment field.
Cooling system & cooling tower
Seven types of cooling systems are discerned using the definitions as provided in the Industrial
Cooling System BREF. Please select the most appropriate pre-defined cooling system. Site specific
situations that do not match the pre-defined descriptions can be noted in the comment box. If
multiple cooling systems are operational, then please report the dominant cooling system. The
dominant cooling system is that cooling system that provides the highest cooling load.
Name plate capacity
The sum of the total capacity expressed in kilotonne production per year.
Cooling water intake
Total gross amount of deliberately abstracted water from a water body for the use of cooling. Make-
up water for the (recirculating) cooling system should be included. A facility may have different
cooling water intake points from multiple water bodies. Seven types of sources of water are
discerned: brackish water, coastal water, fresh surface water, ground water (deep), ground water
(shallow), public water and water from other facility. If separate reporting is not possible then please
report the total cooling water intake and mention the dominant type of cooling water intake in the
comment box.
Cooling water discharge
Total gross amount of deliberately released liquid water used for cooling that is being discharged into
the aquatic environment. Water that leaves the facility in gaseous form or bound into waste and
(secondary) products is not regarded as having been discharged. A facility may have different
discharge points and may discharge into multiple water bodies. Seven types of water bodies are
discerned into which discharge may occur: brackish water, coastal water, fresh surface water,
ground water (deep), ground water (shallow), public water, water to other facility. Leaks, losses and
rainfall are not taken into account in this study.
If separate reporting is not possible then please report the total cooling water discharge and mention
the dominant type of cooling water discharge in the comment box.
Cooling water consumption
Consumptive use of cooling water is calculated as the total amount of cooling water intake minus the
total amount of cooling water discharge. It is the portion of withdrawn water that is consumed

CESNL13784 End Report 120
through evaporation, incorporation into a product, or pollution, such that it is no longer available for
reuse.27
Export of heat (e.g. district heating, heat transfer to other facility)
The capacity to export or transfer heat to another facility or system, e.g. process heat or district
heating system. The default unit of reporting is MWth.
27 See also http://www.wri.org/sites/default/files/pdf/aqueduct_metadata_global.pdf

CESNL13784 End Report 121
Appendix II Database description & manual
II-1 Database Design
In MS Access 2010 a draft version of the Water Use Database is built. This document refers to the
version 1.0 of the database.
This version 1.0 of the database has a draft content yet. The focus of this document is to show the
structure of the database: the individual tables, the fields of which the tables consist and the
relations between the tables. Figure 41 gives an overview of the Database Design, and information
about the relations between the different tables in the database. A larger image can be found in the
final section of this appendix: II-3. More detailed information on the content of the tables and
description of the parameters can be found in Section 3.
Figure 41 Database design Water Use database version 1.0.

CESNL13784 End Report 122
II-2 Overview dataset tables
In this chapter all tables of the database are described. The main table columns (capital letters) are
mentioned in a section, the supporting tables in a subsection.
II-2-1 FACILITYREPORT
Definition
The table gives general information about the facilities reported in the cooling water database,
including the location of the facility. The information in this table will be important for the
identification of the facilities and the linking of data from other sources to the right facilities. All
facilities get a new unique code for this project. Most information is taken from the E-PRTR database,
for that reason the facilityID from the E-PRTR database has been included in the table
FACILITYREPORT.
Table FACILITYREPORT
Field Name Field Type
Origin data Status Description
FacilityID Number Project Mandatory ID of the facility in this project
EPRTR_FacilityID Number E-PRTR Optional
ID of the facility covered by the E-
PRTR
NationalID Text E-PRTR Mandatory ID used in the Member State
ParentCompanyName Text E-PRTR Mandatory Name of the parent company
FacilityName Text E-PRTR Mandatory Name of the facility
StreetName Text E-PRTR Mandatory Facility street address
BuildingNumber Text E-PRTR Mandatory Building number
City Text E-PRTR Mandatory Town/village
PostalCode Text E-PRTR Mandatory Postal code
CountryCode Text E-PRTR Mandatory Two digit code of the country
CountryName Text E-PRTR Mandatory Name of the country
Lat Number E-PRTR Mandatory Latitude coordinates (ETRS89_LAEA_Europe)
Long Number E-PRTR Mandatory Longitude coordinates (ETRS89_LAEA_Europe)

CESNL13784 End Report 123
II-2-2 WATERUSELOCATION
Definition
The table WATERUSELOCATION contains information about the intake and discharge points of the
facilities. Information is given about multiple intake/discharge points and the type of cooling water
that is used. The exact coordinates of the intake and discharge points are optional and need to be provided by the facility itself.
Table WATERUSELOCATION
Field Name Field type Origin data Status Definition FacilityID Number Project Mandatory ID of the facility in this project
WaterUseParameter Text Project Mandatory Location for the parameter intake, or discharge (see 0)
WaterUseParameterNumber Text Project Mandatory With a maximum of 3 intake or discharge points. For consumption there is only one ParameterNumber.
WaterTypeCode Text Project Mandatory
Water type of intake water: Groundwater - deep (GD), Groundwater - shallow (GS), Surface water (SW), Public water (PB), Water from/to other facility (WF/WT) or not applicable (NI) (see 0)
WaterSalinityCode Text Project Mandatory
Water salinity of the intake water: Brackish (BR), Fresh surface water (FR), Salt (SA) or Not applicable (NI) (see 0)
Lat Number Project Optional
Latitude coordinates of discharge point or intake point, not the facility coordinates. Information provided by the facility (ETRS89_LAEA_Europe).
Long Number Project Project Optional
Longitude coordinates of discharge point or intake point, not the facility coordinates. Information provided by the facility (ETRS89_LAEA_Europe).
Watername Number Project Optional Discharge/intake location name, provided by the facility
WaterType
Definition
This table contains the Watertype code used in the table WaterUse with its description. In the
database a referential integrity is forced.
Table Watertype
WatertypeCode WaterTypeDescription
GD Ground water - deep
GS Ground water - shallow
NI Not applicable
PB Public water
SW Surface water
WF Water from other facility
WT Water to other facility

CESNL13784 End Report 124
WaterUseParameter
Definition
The description for the WaterUseParameter used in the table WaterUse is given in this table. In the
database a referential integrity is forced.
Table WaterUseParameter
WaterUseParameter
WaterConsumption
WaterDischarge
WaterIntake
II-2-3 WATERUSE
Definition
Water use functions covers quantities of cooling water for the intake, consumption and discharge of
cooling water. The table is filled, where possible, with monthly data for a period of 12 years (2001-
2012). With the current table structure, it is possible to include multiple parameters such as
temperature and MW discharge. Table WATERUSE
Field Name Field Type Origin data Status Description
FacilityID Number Project Mandatory ID of the facility in this project
WaterUseParameter Number Project Mandatory Intake, consumption, discharge or MW discharge, see 0
WaterUseParameterNumber Text Project Mandatory With a maximum of 3 intake or discharge points. For consumption there is only one ParameterNumber.
Year Number Project Mandatory Year (2000 – 2011/2012) in four digits
Month Number Project Mandatory Month in 1 or 2 digits
Value Number Project Optional Actual value, provided by the facility
ValueLow Number Project Optional Calculated or estimated lowest value
ValueHigh Number Project Optional Calculated or estimated highest value
ParameterUnit Text Project Mandatory Unit is dependent on the used parameter
ParameterMethod Text Project Mandatory Estimated, reported or a combination, see ParameterMethod
WaterUseParameter
Definition
In this table the description for the WaterUseParameter used in the table WATERUSELOCATION is
mentioned. A referential integrity is forced.
Table WaterUseParameter
WaterUseParameter
WaterConsumption
WaterDischarge
WaterIntake

CESNL13784 End Report 125
ParameterMethod
Definition
For every parameter in table WATERUSE it is important how the value is established. Is the value
estimated, reported or a combination of estimated and reported. For every possible method a
separate code is created, with a forced referential integrity.
Table ParameterMethod
ParameterMethodCode MethodDescription MethodDesciptionComment
C1
Combination of reported and Estimated
Dominantly based on Facility specific data (reported by e.g. RWE) - volumes and production reported for base year
C2 Dominantly based on Facility specific data (reported by e.g. RWE) –volumes reported for base year
C3 Dominantly based on Tier 2 (reported by authority of institute above facility level).can be national water body authority or sector organisation
C4 Dominantly based on Region & Technology specific data
C5 Dominantly based on Generic data
E1
Estimated
Facility specific
E2 Region & Technology specific
E3 Generic data
R1
Reported
Reported by facility
R2 Reported by Tier 2 and up (reported by authority of institute above facility level).can be national water body authority or sector organisation

CESNL13784 End Report 126
II-2-4 TECHNICALSPECS_POWER
Definition
A table showing the general information about the sector “Power”. For the facilities information like
capacity, load hours, efficiency and district heating are mentioned in the table. Besides this
information, factors are mentioned with which the intake, consumption and discharge can be
calculated. Thereby three different factors can be distinguished; to calculate the actual amount of
cooling water and to calculate the range with a low and a high factor for the amount of cooling water.
Table TECHNICALSPECS_POWER
Field Name Field Type Origin data Status Description
FacilityID Number Project Mandatory ID of the facility in this project
NACE Text E-PRTR Mandatory Default: NACE code 3511, production of electricity
Process Text Project Mandatory Default code “Power”
FuelTypeCode* text Project / existing databases
Mandatory Main type of fuel used (see section FuelType)
CoolingSystemCode text Project Mandatory Type of cooling (section CoolingSystem)
CoolingTowerCode text Project Mandatory Type of used cooling tower (see section CoolingTower)
YearIn Number Project / existing databases
Mandatory Year in service
YearOut Number Project / existing databases
Mandatory Year out service
Capacity Number Existing /public dbase
Mandatory MWe net installed capacity
CapacityUnit text Project Mandatory Definition of the unit for 'Capacity' default is MWe
LoadHours Number Entso-E, Eurelectric
Mandatory Annual full load hours
MWh** Number Entso-E, Eurelectric
Mandatory Monthly net production of MWh (electricity)
Efficiency Number Project / existing databases
Mandatory Net electric efficiency: defined as 'electricity out / primary energy in (fuel)'
HeatExport Yes/No Project / existing databases
Mandatory Variable to indicate whether the power plant provides district heating
DeltaTemperatureMax Number Project Mandatory The allowed maximum temperature difference of cooling water
DeltaTemperatureMaxUnit text Project Mandatory Default: Deg Celc
DischargeTemperatureMax Number Project
Mandatory The allowed maximum temperature of cooling discharge water
DischargeTemperatureMaxUnit text
Project Mandatory Default: Deg Celc
WaterDischargeMax Number Project
Mandatory The maximum total discharge of cooling water
WaterDischargeMaxUnit text Project Mandatory Default: m3
WaterIntakeMax Number Project
Mandatory The maxium total intake of cooling water
WaterIntakeMaxUnit text Project Mandatory Default: m3
FactorIntakeCw text Project
Mandatory Factor defining the specific cooling water intake per MWh production
FactorIntakeCwUnit text Project Mandatory Default: m3/ MWh
FactorIntakeCwLow Number Project
Mandatory Factor defining the low estimate cooling water intake per MWh production
FactorIntakeCwLowUnit text Project Mandatory Default: m3/ MWh
FactorIntakeCwHigh Number Project Mandatory Factor defining the high estimate

CESNL13784 End Report 127
Field Name Field Type Origin data Status Description
cooling water intake per MWh production
FactorIntakeCwHighUnit text Project Mandatory Default: m3/ MWh
FactorConsumptionCw text Project
Mandatory Factor defining the specific cooling water consumption per MWh production
FactorConsumptionCwUnit text Project Mandatory Default: m3/ MWh
FactorConsumptionCwLow Number Project
Mandatory Factor defining the low estimate cooling water consumption per MWh production
FactorConsumptionCwLowUnit text Project Mandatory Default: m3/ MWh
FactorConsumptionCwHigh Number Project
Mandatory Factor defining the high estimate cooling water consumption per MWh production
FactorConsumptionCwHighUnit
text Project
Mandatory Default: m3/ MWh
FactorDischargeCw text Project
Mandatory Factor defining the specific cooling water discharge per MWh production
FactorDischargeCwUnit text Project Mandatory Default: m3/ MWh
FactorDischargeCwLow Number Project
Mandatory Factor defining the low estimate cooling water discharge per MWh production
FactorDischargeCwLowUnit text Project Mandatory Default: m3/ MWh
FactorDischargeCwHigh Number Project
Mandatory Factor defining the high estimate cooling water discharge per MWh production
FactorDischargeCwHighUnit text Project Mandatory Default: m3/ MWh
*Main fuel type is the dominant fuel type used in the facility.
**MWh always refers to net delivered electricity.
FuelType
Definition
A table with the kinds of fuel used in het Power plant sector. There is a forced referential integrity
with the FuelTypeCode in table TECHNICALSPECS_POWER.
Table FuelType
FuelTypeCode FuelTypeDescription
BIOMASS Biomass and waste
GAS_COMB Natural gas combined cycle
GAS_STEAM Natural gas steam boiler
HARDCOAL_GEN Hard coal generic
HARDCOAL_SUB Hard coal subcritical
HARDCOAL_SUP Hard coal supercritical
LIGNITE_GEN Lignite generic
LIGNITE_SUB Lignite subcritical
LIGNITE_SUP Lignite supercritical
NUCLEAR Nuclear
OIL Oil
NI No information
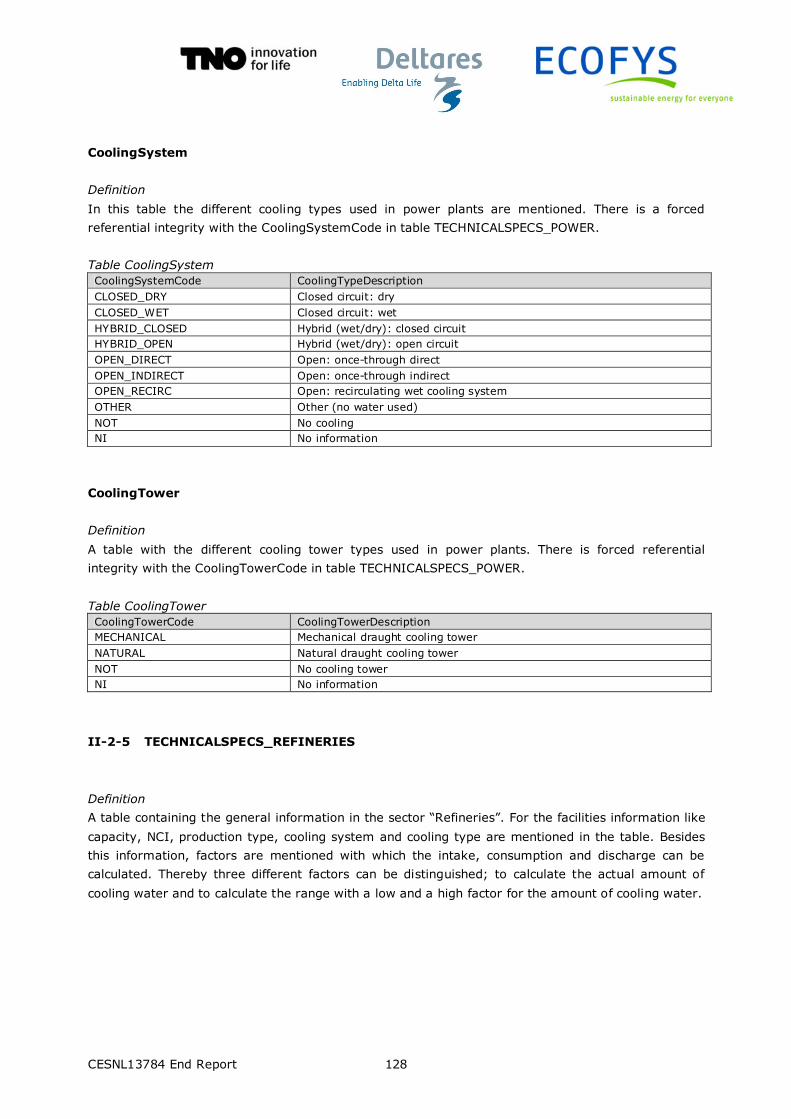
CESNL13784 End Report 128
CoolingSystem
Definition
In this table the different cooling types used in power plants are mentioned. There is a forced
referential integrity with the CoolingSystemCode in table TECHNICALSPECS_POWER.
Table CoolingSystem
CoolingSystemCode CoolingTypeDescription
CLOSED_DRY Closed circuit: dry
CLOSED_WET Closed circuit: wet
HYBRID_CLOSED Hybrid (wet/dry): closed circuit
HYBRID_OPEN Hybrid (wet/dry): open circuit
OPEN_DIRECT Open: once-through direct
OPEN_INDIRECT Open: once-through indirect
OPEN_RECIRC Open: recirculating wet cooling system
OTHER Other (no water used)
NOT No cooling
NI No information
CoolingTower
Definition
A table with the different cooling tower types used in power plants. There is forced referential
integrity with the CoolingTowerCode in table TECHNICALSPECS_POWER.
Table CoolingTower
CoolingTowerCode CoolingTowerDescription
MECHANICAL Mechanical draught cooling tower
NATURAL Natural draught cooling tower
NOT No cooling tower
NI No information
II-2-5 TECHNICALSPECS_REFINERIES
Definition
A table containing the general information in the sector “Refineries”. For the facilities information like
capacity, NCI, production type, cooling system and cooling type are mentioned in the table. Besides
this information, factors are mentioned with which the intake, consumption and discharge can be
calculated. Thereby three different factors can be distinguished; to calculate the actual amount of
cooling water and to calculate the range with a low and a high factor for the amount of cooling water.

CESNL13784 End Report 129
Table TECHNICALSPECS_REFINERIES
Field Name Field Type Origin data Status Description
FacilityID Number Project Mandatory Own facility ID
NACE text E-PRTR / Project
Mandatory Default: NACE code 1920, manufacture of refined petroleum products
Process text Project Mandatory Default value "Refineries"
SubProcessCode text Project Mandatory Type of Subprocess (see 0 )
NCI text Project Mandatory Nelson complexity index class (NCI)
CoolingSystemCode text Project Mandatory System of cooling: dry, recirculating, hybrid, open loop or pond cooling (see 0 )
CoolingTowerCode text Project Mandatory Type of used cooling tower, mechanical, natural or no tower (see 0 )
YearIn Number Project Mandatory Year in service
YearOut Number Project Mandatory Year out service
Capacity Number Project Mandatory Production capacity in metric tonnes per year (mt/yr)
CapacityUnit text Project Mandatory Default : kton/year
LoadFactor Number BP statistics
Mandatory Annual production/capacity (Default is 0.7)
HeatExport Yes/No Project Mandatory Variable to indicate whether the power plant provides district heating
DeltaTemperatureMax Number Project
Mandatory The allowed maximum temperature difference of cooling water
DeltaTemperatureMaxUnit text Project Mandatory Default: Deg Celc
DischargeTemperatureMax Number Project
Mandatory The allowed maximum temperature of cooling discharge water
DischargeTemperatureMaxUnit
text Project
Mandatory Default: Deg Celc
WaterDischargeMax Number Project
Mandatory The maximum total discharge of cooling water
WaterDischargeMaxUnit text Project Mandatory Default: mln m3
WaterIntakeMax Number Project Mandatory The maxium total intake of cooling water
WaterIntakeMaxUnit text Project Mandatory Default: mln m3
FactorIntakeCwUnit text Project Mandatory Default: m3/ t
FactorIntakeCwLow Number Project
Mandatory Factor defining the lowest cooling water intake per ton production
FactorIntakeCwLowUnit text Project Mandatory Default: m3/ t
FactorIntakeCwHigh Number Project
Mandatory Factor defining the highest cooling water intake per ton production
FactorIntakeCwHighUnit text Project Mandatory Default: m3/ ton
FactorConsumptionCw text Project
Mandatory Factor defining the specific cooling water consumption per ton production
FactorConsumptionCwUnit text Project Mandatory Default: m3/ ton
FactorConsumptionCwLow Number Project
Mandatory Factor defining the lowest cooling water consumption per MWh production
FactorConsumptionCwLowUnit text Project Mandatory Default: m3/ ton
FactorConsumptionCwHigh Number Project
Mandatory Factor defining the highest cooling water consumption per MWh production
FactorConsumptionCwHighUnit
text Project
Mandatory Default: m3/ ton
FactorDischargeCw text Project
Mandatory Factor defining the specific cooling water discharge per ton production
FactorDischargeCwUnit text Project Mandatory Default: m3/ ton
FactorDischargeCwLow Number Project
Mandatory Factor defining the lowest cooling water discharge per ton production
FactorDischargeCwLowUnit text Project Mandatory Default: m3/ ton
FactorDischargeCwHigh Number Project
Mandatory Factor defining the highest cooling water discharge per ton production
FactorDischargeCwHighUnit text Project Mandatory Default: m3/ ton

CESNL13784 End Report 130
Subprocess
Definition
The different sub processes for industrial processes are mentioned in the table below. There is only
one sub process for the Refineries.
Table Subprocess
SubProcessCode SubProcessDescription Sector
PETROLEUM Petroleum refining process Refineries
CoolingSystem
Definition
In the table the different ways for the cooling system are mentioned. A referential integrity is forced.
Table CoolingSystem
CoolingSystemCode CoolingTypeDescription
CLOSED_DRY Closed circuit: dry
CLOSED_WET Closed circuit: wet
HYBRID_CLOSED Hybrid (wet/dry): closed circuit
HYBRID_OPEN Hybrid (wet/dry): open circuit
OPEN_DIRECT Open: once-through direct
OPEN_INDIRECT Open: once-through indirect
OPEN_RECIRC Open: recirculating wet cooling system
OTHER Other (no water used)
NOT No cooling
NI No information
CoolingTower
Definition
A table for the different cooling tower types used in power plants. There is forced referential integrity
with the CoolingTowerCode in table TECHNICALSPECS_POWER.
Table CoolingTower
CoolingTowerCode CoolingTowerDescription
MECHANICAL Mechanical draught cooling tower
NATURAL Natural draught cooling tower
NOT No cooling tower
NI No information
II-2-6 TECHNICALSPECS_IRON_STEEL
Definition
A table containing the general information in the sector “Iron and steel”. For the facilities information
like sub process, production type, capacity, load factor, cooling system are mentioned in the table.
Besides this information, factors are mentioned with which the intake, consumption and discharge
can be calculated. Thereby three different factors can be distinguished; to calculate the actual
amount of cooling water and to calculate the range with a low and a high factor for the amount of
cooling water.

CESNL13784 End Report 131
Table TECHNICALSPECS_IRON_STEEL
Field Name Field Type Origin data Status Description
FacilityID Number Project Mandatory Own facility ID
NACE text E-PRTR / Project Mandatory NACE Code activity; 2410, 2420, 2451, 2452 or 2591
Process text Project Mandatory Default value "Iron and steel"
ProductionTypeCode text Project Mandatory Type of production, primary, secondary or combined (see ProductionType)
SubProcessCode text Project Mandatory Type of Sub process (see SubProcess )
CoolingSystemCode text Project Mandatory System of cooling: (see CoolingSystem )
CoolingTypeCode text Project Mandatory Type of cooling: direct or indirect cooling (see CoolingType)
CoolingTowerCode text Project Mandatory Type of used cooling tower (see CoolingTower )
YearIn Number Project /existing databases
Mandatory Year in service
YearOut Number Project /existing databases
Mandatory Year out service
Capacity Number Project /existing databases
Mandatory Production capacity in metric tonnes per year (mt/yr)
CapacityUnit text Project Mandatory mt product /yr
LoadFactor Number Project Mandatory Annual prodution/capacity (Default is 0.7)
HeatExport Yes/No Project Mandatory Variable to indicate whether the power plant provides district heating
DeltaTemperatureMax Number Project Mandatory The allowed maximum temperature difference of cooling water
DeltaTemperatureMaxUnit text Project Mandatory Default: Deg Celc
DischargeTemperatureMax Number Project Mandatory The allowed maximum temperature of cooling discharge water
DischargeTemperatureMaxUnit text Project Mandatory Default: Deg Celc
WaterDischargeMax Number Project Mandatory The maximum total discharge of cooling water
WaterDischargeMaxUnit text Project Mandatory Default: m3
WaterIntakeMax Number Project Mandatory The maxium total intake of cooling water
WaterIntakeMaxUnit text Project Mandatory Default: m3
FactorIntakeCwUnit text Project Mandatory Default: m3/ t
FactorIntakeCwLow Number Project Mandatory Factor defining the lowest cooling water intake per m3 production
FactorIntakeCwLowUnit text Project Mandatory Default: m3/ t
FactorIntakeCwHigh Number Project Mandatory Factor defining the highest cooling water intake per ton production
FactorIntakeCwHighUnit text Project Mandatory Default: m3/ t
FactorConsumptionCw text Project Mandatory Factor defining the specific cooling water consumption per ton production
FactorConsumptionCwUnit text Project Mandatory Default: m3/ t
FactorConsumptionCwLow Number Project Mandatory Factor defining the lowest cooling water consumption per ton production
FactorConsumptionCwLowUnit text Project Mandatory Default: m3/ t
FactorConsumptionCwHigh Number Project Mandatory Factor defining the highest cooling water consumption per ton production
FactorConsumptionCwHighUnit
text Project Mandatory Default: m3/ t
FactorDischargeCw text Project Mandatory Factor defining the specific cooling water discharge per ton production
FactorDischargeCwUnit text Project Mandatory Default: m3/ t
FactorDischargeCwLow Number Project Mandatory Factor defining the lowest cooling water discharge per ton production
FactorDischargeCwLowUnit text Project Mandatory Default: m3/ t
FactorDischargeCwHigh Number Project Mandatory Factor defining the highest cooling water discharge per ton production
FactorDischargeCwHighUnit text Project Mandatory Default: m3/ t
FactorIntakeCwUnit text Project Mandatory Default: m3/ t

CESNL13784 End Report 132
NACE
Definition
For the Iron and steel sector 6 different NACE codes are of interest.
Table NACE
NACECode NACE Sector
2410 Manufacture of basic iron and steel and of ferro-alloys Iron and Steel
2420 Manufacture of tubes, pipes, hollow profiles and related fittings, of steel Iron and Steel
2451 Casting of iron Iron and Steel
2452 Casting of steel Iron and Steel
2591 Manufacture of steel drums and similar containers Iron and Steel
ProductionType
Definition
Auxiliary table for the different production types used in Iron and Steel making facilities. A referential
integrity is forced
Table ProductionType
ProductionType ProductionType
Primary Primary steel making
Secundary Secondary steel making
Combined Combination of both primary and secondary steel making
Subprocess
Definition
The different sub processes for industrial processes are mentioned in the table below.
Table Subprocess
SubProcessCode SubProcessDescription Sector
INGOT_CASTING Ingot casting Iron and Steel
PICKLE_LINE Pickle line Iron and Steel
OHF Open hearth furnace Iron and Steel
CONTINUOUS_CASTING Continuous casting Iron and Steel
COKE_OVEN Coke oven Iron and Steel
BOF Basic oxygen furnace Iron and Steel
BLAST_STOVE Blast stove Iron and Steel
BLAST_FURNACE Blast furnace Iron and Steel
EAF Electric arc furnace Iron and Steel

CESNL13784 End Report 133
CoolingSystem
Definition
In the table the different ways for system cooling are mentioned. A referential integrity is forced.
Table CoolingSystem
CoolingSystemCode CoolingTypeDescription
CLOSED_DRY Closed circuit: dry
CLOSED_WET Closed circuit: wet
HYBRID_CLOSED Hybrid (wet/dry): closed circuit
HYBRID_OPEN Hybrid (wet/dry): open circuit
OPEN_DIRECT Open: once-through direct
OPEN_INDIRECT Open: once-through indirect
OPEN_RECIRC Open: recirculating wet cooling system
OTHER Other (no water used)
NOT No cooling
NI No information
CoolingType
Definition
In the table the different cooling types are mentioned. A referential integrity is forced.
Table CoolingType
CoolingTypeCode CoolingTypeDescription
DIRECT_DISCHARGE Direct cooling and cooling water is discharged
DIRECT_WASTEWATER Direct cooling and cooling water goes to waste water treatment
INDIRECT_DISCHARGE Indirect cooling and cooling water is discharged
NI No information
CoolingTower
Definition
Table for the different cooling tower types used in power plants. There is forced referential integrity
with the CoolingTowerCode in table TECHNICALSPECS_POWER.
Table CoolingTower
CoolingTowerCode CoolingTowerDescription
MECHANICAL Mechanical draught cooling tower
NATURAL Natural draught cooling tower
NOT No cooling tower
NI No information
II-2-7 TECHNICALSPECS_CHEMICAL
Definition
A table containing the general information in the sector “Chemical”. For the facilities information like
sub process, production type, capacity, load factor, cooling system are mentioned in the table.
Besides this information, factors are mentioned with which the intake, consumption and discharge
can be calculated. Thereby three different factors can be distinguished; to calculate the actual
amount of cooling water and to calculate the range with a low and a high factor for the amount of
cooling water.

CESNL13784 End Report 134
Table TECHNICALSPECS_CHEMICAL
Field Name Field Type Origin data Status Description
FacilityID Number Project Mandatory Own facility ID
NACE text E-PRTR/ project
Mandatory NACE Code activity (see NACE)
Process text Project Mandatory Default value "Chemical"
SubProcessCode text Project Mandatory Type of Sub process (see Subprocess)
CoolingSystemCode text Project Mandatory System of cooling: dry, recirculating, hybrid, open loop or pond cooling (Default is once-through) (see CoolingSystem)
CoolingTowerCode text Project Mandatory Type of used cooling tower, mechanical, natural or no tower (see CoolingTower)
YearIn Number Existing database
Mandatory Year in service
YearOut Number
Mandatory Year out service
Capacity Number Existing database
Mandatory Production capacity in metric tonne per year (mt/yr)
CapacityUnit text Project Mandatory Metric t product /yr
LoadFactor Number Sector statistics / Project
Mandatory Annual production/capacity (Default is 0.7)
HeatExport Yes/No Project Mandatory Variable to indicate whether the power plant provides district heating
DeltaTemperatureMax Number Project Mandatory The allowed maximum temperature difference of cooling water
DeltaTemperatureMaxUnit text Project Mandatory Default: Deg Celc
DischargeTemperatureMax Number Project Mandatory The allowed maximum temperature of cooling discharge water
DischargeTemperatureMaxUnit text Project Mandatory Default: Deg Celc
WaterDischargeMax Number Project Mandatory The maximum total discharge of cooling water
WaterDischargeMaxUnit text Project Mandatory Default: m3
WaterIntakeMax Number Project Mandatory The maxium total intake of cooling water
WaterIntakeMaxUnit text Project Mandatory Default; m3
FactorIntakeCw text Project Mandatory Factor defining the specific cooling water intake per m3 production
FactorIntakeCwUnit text Project Mandatory Default: m3/ t
FactorIntakeCwLow Number Project Mandatory Factor defining the lowest cooling water intake per m3 production
FactorIntakeCwLowUnit text Project Mandatory Default: m3/ t
FactorIntakeCwHigh Number Project Mandatory Factor defining the highest cooling water intake per ton production
FactorIntakeCwHighUnit text Project Mandatory Default: m3/ t
FactorConsumptionCw text Project Mandatory Factor defining the specific cooling water consumption per ton production
FactorConsumptionCwUnit text Project Mandatory Default: m3/ t
FactorConsumptionCwLow Number Project Mandatory Factor defining the lowest cooling water consumption per ton production
FactorConsumptionCwLowUnit text Project Mandatory Default: m3/ t
FactorConsumptionCwHigh Number Project Mandatory Factor defining the highest cooling water consumption per ton production
FactorConsumptionCwHighUnit text Project Mandatory Default: m3/ t
FactorDischargeCw text Project Mandatory Factor defining the specific cooling water discharge per ton production
FactorDischargeCwUnit text Project Mandatory Default: m3/ t
FactorDischargeCwLow Number Project Mandatory Factor defining the lowest cooling water discharge per ton production
FactorDischargeCwLowUnit text Project Mandatory Default: m3/ t
FactorDischargeCwHigh Number Project Mandatory Factor defining the highest cooling water discharge per ton production
FactorDischargeCwHighUnit text Project Mandatory Default: m3/ t
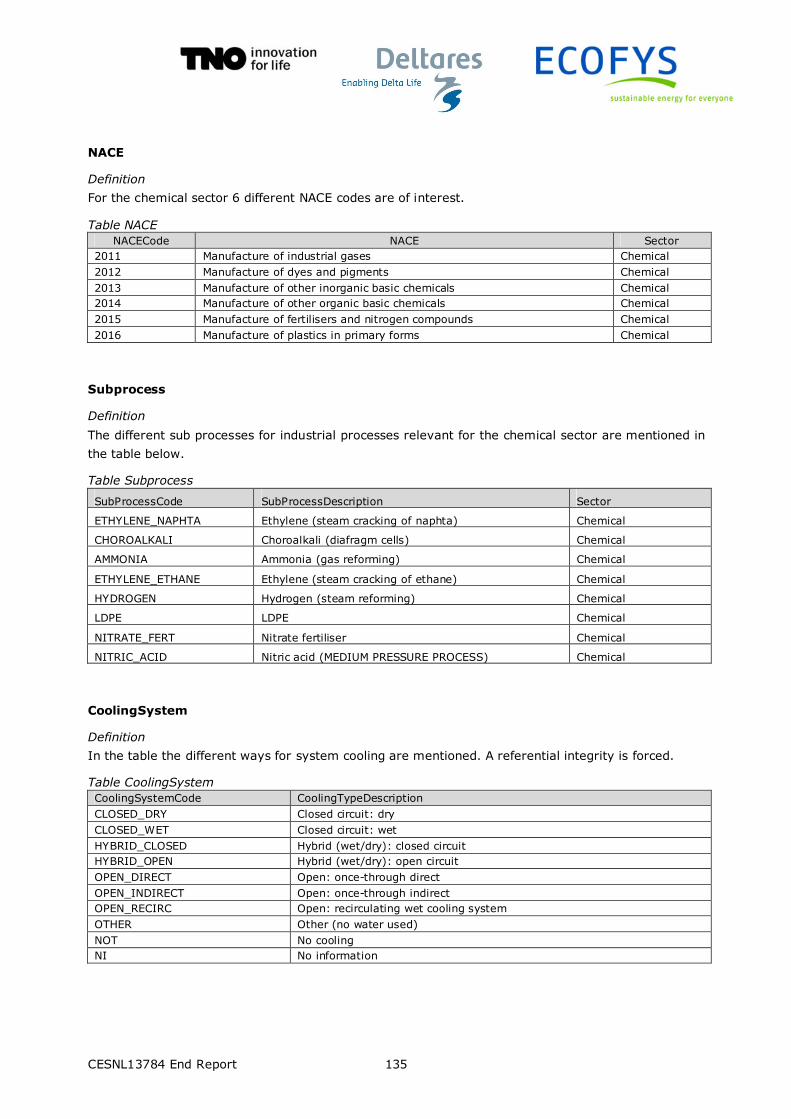
CESNL13784 End Report 135
NACE
Definition
For the chemical sector 6 different NACE codes are of interest.
Table NACE
NACECode NACE Sector
2011 Manufacture of industrial gases Chemical
2012 Manufacture of dyes and pigments Chemical
2013 Manufacture of other inorganic basic chemicals Chemical
2014 Manufacture of other organic basic chemicals Chemical
2015 Manufacture of fertilisers and nitrogen compounds Chemical
2016 Manufacture of plastics in primary forms Chemical
Subprocess
Definition
The different sub processes for industrial processes relevant for the chemical sector are mentioned in
the table below.
Table Subprocess
SubProcessCode SubProcessDescription Sector
ETHYLENE_NAPHTA Ethylene (steam cracking of naphta) Chemical
CHOROALKALI Choroalkali (diafragm cells) Chemical
AMMONIA Ammonia (gas reforming) Chemical
ETHYLENE_ETHANE Ethylene (steam cracking of ethane) Chemical
HYDROGEN Hydrogen (steam reforming) Chemical
LDPE LDPE Chemical
NITRATE_FERT Nitrate fertiliser Chemical
NITRIC_ACID Nitric acid (MEDIUM PRESSURE PROCESS) Chemical
CoolingSystem
Definition
In the table the different ways for system cooling are mentioned. A referential integrity is forced.
Table CoolingSystem
CoolingSystemCode CoolingTypeDescription
CLOSED_DRY Closed circuit: dry
CLOSED_WET Closed circuit: wet
HYBRID_CLOSED Hybrid (wet/dry): closed circuit
HYBRID_OPEN Hybrid (wet/dry): open circuit
OPEN_DIRECT Open: once-through direct
OPEN_INDIRECT Open: once-through indirect
OPEN_RECIRC Open: recirculating wet cooling system
OTHER Other (no water used)
NOT No cooling
NI No information

CESNL13784 End Report 136
CoolingTower
Definition
Auxilary table for the different cooling tower types used in power plants. There is forced referential
integrity with the CoolingTowerCode in table TECHNICALSPECS_POWER.
Table CoolingTower
CoolingTowerCode CoolingTowerDescription
MECHANICAL Mechanical draught cooling tower
NATURAL Natural draught cooling tower
NOT No cooling tower
NI No information
II-2-8 ECRINSLOCATION
Definition
The table gives information about the facilities and the surface water the cooling water is taken from
or discharged in. With this information, summations of the cooling water per River Basin District or
catchment area can be made. In appendix A the assignment of the facilities to ECRINS version 1.1 is
described.
Table ECRINSLOCATION
Field Name Field Type Origin data Status Description FacilityID Number Project Mandatory Own facility ID
EcrinsRBD text ECRINS Mandatory ECRINS code of the River Basin District
EcrinsFEC text ECRINS Mandatory Code ot het catchment from the C_ZHYD layer in ECRINS.
EcrinsTR text ECRINS Optional Code of the river segment
EcrinsLake text ECRINS Optional Code of the lake or river in Ecrins
EcrinsLayer text ECRINS Mandatory Layer used from ECRINS, C_tr (river segements) or C_lak (lakes)
EcrinsDistance text Project Mandatory Distance from a facility to a river segment, lake, transtiional water or coast.
EcrinsDistanceUnit Number Project Mandatory Default : meter
TypeSurfaceWater text Project Mandatory The type of waterbody the facility is inked to in ECRINS: lake, river segment, coast or transitional water.
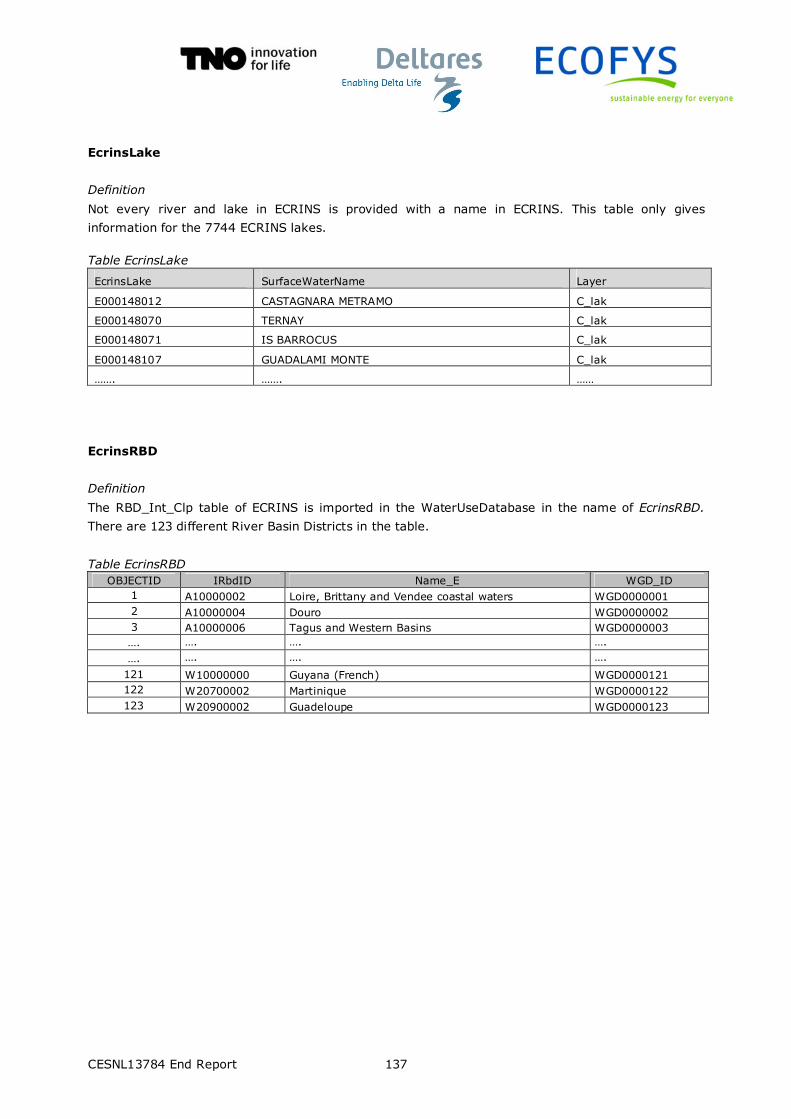
CESNL13784 End Report 137
EcrinsLake
Definition
Not every river and lake in ECRINS is provided with a name in ECRINS. This table only gives
information for the 7744 ECRINS lakes.
Table EcrinsLake
EcrinsLake SurfaceWaterName Layer
E000148012 CASTAGNARA METRAMO C_lak
E000148070 TERNAY C_lak
E000148071 IS BARROCUS C_lak
E000148107 GUADALAMI MONTE C_lak
……. ……. ……
EcrinsRBD
Definition
The RBD_Int_Clp table of ECRINS is imported in the WaterUseDatabase in the name of EcrinsRBD.
There are 123 different River Basin Districts in the table.
Table EcrinsRBD
OBJECTID IRbdID Name_E WGD_ID 1 A10000002 Loire, Brittany and Vendee coastal waters WGD0000001 2 A10000004 Douro WGD0000002 3 A10000006 Tagus and Western Basins WGD0000003 …. …. …. ….
…. …. …. ….
121 W10000000 Guyana (French) WGD0000121 122 W20700002 Martinique WGD0000122 123 W20900002 Guadeloupe WGD0000123

CESNL13784 End Report 138
II-3 Database design WaterUseDatabase version 1.0

CESNL13784 End Report 139
Appendix III Data gathering questionnaire
III-1 Example data gathering questionnaire – Power Sector

CESNL13784 End Report 140
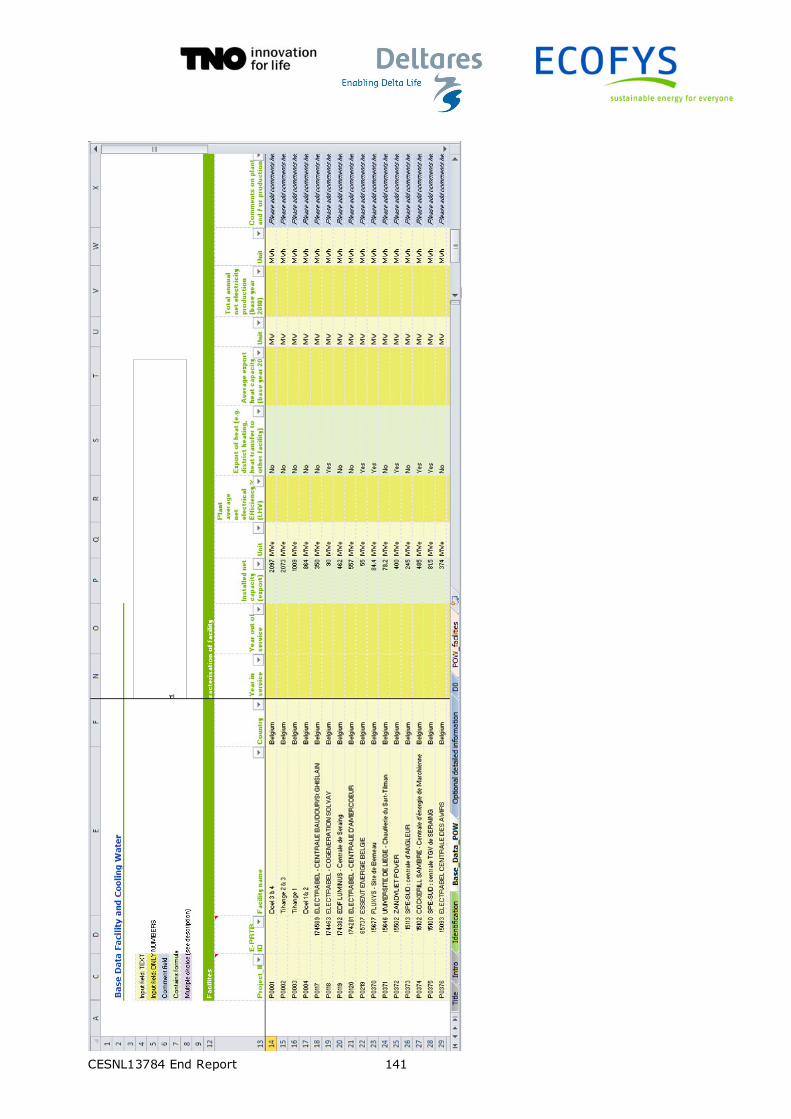
CESNL13784 End Report 141

CESNL13784 End Report 142

CESNL13784 End Report 143

CESNL13784 End Report 144
III-2 Example data gathering guidance document – Power sector
Questionnaire for a pilot study collecting plant-specific data on cooling water availability, use
and sustainability
INSTRUCTIONS & DEFINITIONS
This document includes instructions and definitions that can be used as a guideline to complete the
questionnaire. The first part includes general instructions and definitions, applicable to all parts of the
questionnaire. This will be followed with specific instructions (if needed).
Table of Contents
General Instructions 2
Definitions 5
Facility 5
Main fuel type 5
Cooling system & cooling tower 5
Net installed capacity (export) 7
Plant average net electrical Efficiency % (LHV) 7
Cooling water intake 7
Cooling water discharge 8
Cooling water consumption 8
Main operating mode 8
Export of heat (e.g. district heating, heat transfer to other facility) 8
Sheet ‘Identification’ 9
Sheet ‘Base Data POW’ 10
Sheet ‘D0’ – Detailed information on the facilities 13

CESNL13784 End Report 145
GENERAL INSTRUCTIONS
Sheets included in the questionnaire
Sheet Content
Identification Identification of the person filling in the questionnaire
Base Data POW General information about the activities, among which cooling water system, capacity of
the power plant. Furthermore, data on cooling water intake, discharge, temperature is
required for base year 2010.
D0 Basic information about the facility
In this sheet information taken from E-PRTR database are presented for verification.
Title Title sheet providing the title and consortium information
Intro Background and guidance regarding the project and this questionnaire
Contact Sheet for sharing contact information for potential validation and follow-up actions.
Cooling systems Information sheet regarding definitions of cooling systems discerned in this study
List of facilities This sheet contains the actual questionnaire regarding the list of facilities
For our study, the green sheet is the most important to complete. In this sheet questions on the
facility and the cooling water use are asked for. Preferably information is asked for the base year of
our analysis: 2010.
Color-codes
The cells in the questionnaire are color-coded, indicating what type of information should be filled in.
The legend can be found in the top left corner of each work sheet:
Base year 2010
In this study, 2010 is set as base year. It is important to share data of this year as it will allow us to
make the results as consistent as possible. If for any reason no data is available for 2010, or 2010 is
considered an atypical year in relation with cooling water use, then please choose one of the years
closest to the base year (2009 or 2011). Please indicate in the comment fields which year is taken as
base year and why.
Comment fields
In each table a comment field is added at the beginning or end of the table. Please use these
comment fields to add descriptions or clarifications on the shared data. In some cases (see below), it
will be requested to put comments in the comment field, for instance when choices in a drop-down
menu are not sufficient to answer a question. The information from the comment fields will be very
helpful when analysing and verifying the information.
Input f ield: TEXT
Input f ield: ONLY NUMBERS
Comment f ield
Contains formula
Multiple choice (see description)
CESNL13784 End Report 146
Drop-down menus
When applicable, drop-down menus are used to simplify the completion and analysis of the
questionnaire. However, it can occur that the choices reflected do not match the situation. In such
case, please use the following guideline:
• In case none of the choices reflects the situation, please select the option that most closely
resembles the situation and use comment box to describe where it differs;
• If more than one choice is applicable to the situation, please choose the option that comes
closest or is most dominant (depending on the question). Please add a comment in the
nearest comment field.
Data availability
Case Instruction
No data availability When data is not available, please leave the cells blank
Part of data available Please complete the data elements that are available, leave others blank.
Data not applicable If data is not applicable, please indicate with ‘n/a’
Data not public If data is not available or cannot be shared, please leave the cells blank and indicate
in the comment field.
Data source and uncertainty
Collected data might not be completely accurate due to the source of data. Some data might be
based on exact flow measurements, other data might be deduced (e.g. pump characteristics or
operation) or estimated. Therefore please state the source (Measured/Calculated/Estimated) of the
data and estimated level of uncertainty (e.g. ± 10%) in the appropriate comment field.
Data check and corrections on pre-completed values
In some sheets data is already pre-completed (e.g. based on data available in E-PRTR). If data is not
correct, please overwrite the data in these cells and indicate in the comment field.
Use of alternative units
When numbers are requested, a default unit is pre-defined. In case the unit is not sufficient, please
overwrite the unit and add comment in the nearest comment field.
Adding facilities
A pre-defined set of facilities have been included in this questionnaire. The selection of facilities is
based on the most recent E-PRTR database (2012). If facilities are missing from the list, please add
these in the worksheet ‘Base Data Pow’. Under the pre-defined facilities you find 10 rows in which
facilities can be added. Please fill as much information (Facility name is required).
Important: If you would like to add more than 10 facilities, please contact us.
Coordinates
To map the facility, water intake and water discharge points, information on the location is requested
in the form of coordinates. If available, the information is already included in the questionnaire. In
case the information is not available or erroneous, please provide the coordinates in WGS84 format
(as used in Google Earth).
CESNL13784 End Report 147
If the coordinates are not readily available, Google Earth can be used to retrieve them:
▪ Open Google Earth;
▪ Lookup facility, water intake or discharge point visually;
▪ Zoom in as far as possible;
▪ Put the object in centre of screen;
▪ Right click and select "What’s here "
▪ Copy coordinates from box on left.
Permits and regulations
For various aspects of cooling water use permits have been granted. Please fill in the requested
maximum or minimum as permitted. If the limit has changed in the period between 2001 and 2012,
please report the most recent and indicate the change in the nearest comment field.
Average temperature
If average (monthly or annual) temperature is requested, please report the non-weighed averages.
For example, see an annual average based on a range of monthly temperatures of cooling water
discharge for a hypothetical facility below.
Jan Feb Mar Apr May Jun Jul Aug Sep Oct Nov Dec Annual
average
17 18 18 20 22 23 24 24 20 18 17 17 20
Average temperatures are thus not corrected or weighed for the flow of cooling water.
In the case of discharge (or withdrawal) from multiple water bodies, please report averages for
dominant water body (water body with highest volume of discharge or withdrawal).
Multiple intake/discharge points and water bodies
In the case of discharge (or withdrawal) from multiple water bodies, please report values for
dominant water body (water body with highest volume of discharge or withdrawal). Please indicate
this by adding a comment in the comment field in which is mentioned:
▪ How much water bodies the data is representing;
▪ A rough division of shares between water bodies (in %). Please use 2010 as a base year.
Other water use
In this study we are focusing on cooling water. Therefore, if possible, reporting should be limited to
cooling water. If this is not possible (e.g. when water intake for cooling is combined with intake of
process water), please estimate the share of water (in volume) that is used for other purposes than
cooling.
DEFINITIONS
Facility
A facility, or power plant, is defined as one or multiple electricity production units that are located at
one site. The level of reporting is the power plant, and not the individual generating unit. If multiple
units (either fired with the same fuel or not) are operating at one site than aggregated values should
be reported.

CESNL13784 End Report 148
Main fuel type
For simplicity it is assumed that the power plant uses one primary fuel and conversion technology.
Eleven combinations of main fuel type and conversion technology are discerned: Biomass and waste,
Hard coal subcritical, Hard coal supercritical, Hard coal generic, Natural gas combined cycle, Natural
gas steam boiler, Lignite subcritical, Lignite supercritical, Lignite generic, Nuclear and Oil. Co-firing of
fuels (e.g. biomass) is not taken into account. If there are multiple units fired with different primary
fuels (e.g. a gas fired unit and a coal fired unit) then please state primary fuel and conversion
technology of the largest unit. If the plant fuel mix and mix of operating units is such that cooling
water use is variable depending on this mix then please comment.
Cooling system & cooling tower
Seven types of cooling systems are discerned using the definitions as provided in the Industrial
Cooling System BREF. Please select the most appropriate pre-defined cooling system. Site specific
situations that do not match the pre-defined descriptions can be noted in the comment box. If
multiple cooling systems are operational, then please report the dominant cooling system.
Table 31 Definitions of cooling systems characterised in this study (source: BREF 2001).
Type Cooling System Description
A Open: once-through direct
The coolant (i.e. water) is pumped from a source (e.g. sea, river, lake, groundwater), it passes through a heat exchanger (where heat is transferred from the process to the coolant through a partition wall), then it optionally passes through a cooling tower (where the heated water is cooled, through sensible heat loss, by contact with air) and, finally, it is discharged back to the receiving water.
B Open: once-through indirect
The primary coolant (i.e. water) is pumped from a source (e.g. sea, river, lake, groundwater), it passes through a heat exchanger (where heat is transferred from the secondary cooling circuit to the primary coolant through a partition wall), then it optionally passes through a cooling tower (where the heated water is cooled through sensible heat loss by contact with air) and, finally, it is discharged back to the receiving water. In the secondary circuit, there is another heat exchanger (where heat is transferred from the process to the secondary coolant through the partition wall). Please note that, in a plant, there may be tertiary, quarterly, etc. cooling circuit(s).
C Open: recirculating wet cooling system
The coolant (i.e. water) is pumped from a reservoir, it passes through a heat exchanger (where heat is transferred from the process to the coolant through a partition wall), then it passes through a cooling tower and, finally, it is collected back in the reservoir.
D Closed circuit: dry The primary coolant (i.e. air) passes through a heat exchanger (where heat is transferred from the secondary cooling circuit to the primary coolant through a partition wall) and is released to the atmosphere. In the secondary circuit, there is another heat exchanger (where heat is transferred from the process to the secondary coolant through the partition wall). Please note that, in a plant, there may be tertiary, quarterly, etc. cooling circuit(s). Example: air radiators.
E Closed circuit: wet The primary coolant (i.e. water) is pumped from a reservoir; it passes through a heat exchanger (where heat is transferred from the secondary cooling circuit to the primary coolant through a partition wall, which causes latent heat losses) and is collected back in the reservoir. In the secondary circuit, there is another heat exchanger (where heat is transferred from the process to the secondary coolant through the partition wall). There may be tertiary, quarterly, etc. cooling circuit(s) in a plant.
F Hybrid (wet/dry): open circuit
The heated cooling water first passes through a dry section of the cooling tower, where part of the heat load is removed by an air current. Afterwards, water is further cooled in the wet section of the tower. The heated air from the dry section is mixed with vapour from the wet section, thus lowering the relative humidity before the air current leaves the cooling tower, which reduces plume formation. Combined cooling systems can be operated either as a pure wet cooling tower or as a combined wet/dry cooling tower, depending on the ambient temperature.
G Hybrid (wet/dry):
closed circuit

CESNL13784 End Report 149
Cooling Tower type Description
Natural draught cooling tower Tower where the heated water is cooled through, depending on the cooling system, sensible and latent heat losses by contact with air
Mechanical draught cooling tower
Tower where the heated water is cooled through, depending on the cooling system, sensible and latent heat losses by contact with air. Mechanical cooling towers use fans to create the airflow
Figure 42 Schematic representation of various cooling systems (with and without cooling tower) as
defined in the questionnaire. Note that detailed definitions of options A-G are described in the table
above.
Net installed capacity (export)
The sum of the total net electricity generating capacity for export to the grid, expressed in MWe.
Plant average net electrical Efficiency % (LHV)
Annual average of the net electrical efficiency for the total power plant based on the lower heating
value.
optional optional

CESNL13784 End Report 150
Cooling water intake
Total gross amount of deliberately abstracted water from a water body for the use of cooling. Make-
up water for the (recirculating) cooling system should be included. A power plant may have different
cooling water intake points from multiple water bodies.
Up to three different types of sources from which water is abstracted may be defined per power
plant. Seven types of sources of water are discerned: brackish water, coastal water, fresh surface
water, ground water (deep), ground water (shallow), public water and water from other facility.
Cooling water discharge
Total gross amount of deliberately released liquid water used for cooling that is being discharged into
the aquatic environment. Water that leaves the power plant in gaseous form or bound into waste and
(secondary) products is not regarded as having been discharged. A power plant may have different
discharge points and may discharge into multiple water bodies. Up to three different types of water
bodies in which discharge occurs may be defined per power plant. Seven types of water bodies are
discerned into which discharge may occur: brackish water, coastal water, fresh surface water,
ground water (deep), ground water (shallow), public water, water to other facility. Leaks, losses and
rainfall are not taken into account in this study.
Cooling water consumption
Consumptive use of cooling water is calculated as the total amount of cooling water intake minus the
total amount of cooling water discharge. It is the portion of withdrawn water that is consumed
through evaporation, incorporation into a product, or waste materials, such that it is no longer
available for reuse.28
Main operating mode
The power industry is characterised by power plants operating at a range of different load factors.
Both total and specific cooling water use is affected by the mode of operation. Four different
operating modes are discerned based on the annual equivalent full load hours.
Main operating mode Description
Baseload ‘base-load’ plant operating in excess of 4000 equivalent full load hours per year
Midmerit mid-merit' plant operating in excess of 1500 equivalent full load hours per year
Peak load Peak load plant operating less than 1500 equivalent full load hours per year
Emergency Plants for emergency use that operate less than 500 hours per year
Other (please specify in
comment box)
Please define in the comments field
Export of heat (e.g. district heating, heat transfer to other facility)
The capacity to export or transfer heat - not converted into electricity or discharged into the (aquatic
and atmospheric) environment - to another facility or system, e.g. a district heating system. The
default unit of reporting is MWth.
28 See also http://www.wri.org/sites/default/files/pdf/aqueduct_metadata_global.pdf

CESNL13784 End Report 151
SHEET ‘IDENTIFICATION’
Data element Description
Company name: Name of the company and the mother company (if applicable)
Contact person completing
the questionnaire:
Name and surname
Job title: Job title
E-mail: E-mail address
Telephone: Mobile number and landline
General Comments Please fill in any comment related to company information
Sheet ‘Base Data POW’
Below you find an overview of the requested data elements, where they can be found in the sheet
and a description of the type of information that is requested.
Data element Column Description
Project_ID C Project ID, only used for this study , do not change
E-PRTR ID D Please check value
Facility name E Please check value
Country F Please check value
Main Fuel type H Please make a selection from the drop down menu: • Biomass and waste • Hard coal subcritical • Hard coal supercritical • Hard coal generic • Natural gas combined cycle • Natural gas steam boiler • Lignite subcritical • Lignite supercritical • Lignite generic • Nuclear • Oil
Cooling system I Please make a selection from the drop down menu: • Open: once-through direct • Open: once-through indirect • Open: recirculating wet cooling system • Closed circuit: dry • Closed circuit: wet • Hybrid (wet/dry): open circuit • Hybrid (wet/dry): closed circuit • Other (no water used) • No cooling
Cooling Tower J Please make a selection from the drop down menu: • Natural draught cooling tower • Mechanical draught cooling tower • No cooling tower
Main operating mode K Please make a selection from the drop down menu: • Baseload • Midmerit • Peak load • Emergency • Other (please specify in comment box)
Definitions of these options are included in the ‘Definitions’ section.

CESNL13784 End Report 152
Data element Column Description
Dominant type of cooling water at intake
L Please make a selection from the drop down menu: • Not applicable • No information • BW brackish water • CW coastal water • FW fresh surface water • GD ground water - deep • GS ground water - shallow • PB Public water • WF Water from other facility
Dominant type of water body into which cooling water is discharged
M Please make a selection from the drop down menu: • Not applicable • No information • BW brackish water • CW coastal water • FW fresh surface water • GD ground water - deep • GS ground water - shallow • PB Public water • WT Water to other facility
Year in service N Please fill in year of taken into service. In case of multiple units, please fill in most recent year and mention the range in the comment field.
Year out of service O Please fill in year of taken out of service. Only use if the plant or a part of the plant has been shut down within the period 2001 – 2012 or if there are specific plans for taking it out of service in the immediate future. Please specify in comment field.
Installed net capacity (export) P Please fill in name-plate capacity of the power plant. In case there are multiple units, please fill in the sum.
Unit Q Default is MWe
Plant average net electrical Efficiency % (LHV)
R Please fill in net efficiency of the power plant.
Export of heat (e.g. district heating, heat transfer to other facility)
S Please indicate if heat is transferred and exported for use outside the facility, for example to adjacent facilities or centralised heat distribution systems.
Average export of heat capacity (base year 2010)
T Please indicate the heat export capacity Use 2010 as a base year for the average
Unit U Default is MWth
Total annual net electricity production (base year 2010)
V Please fill in the annual net electricity production.
Unit X Default is MWh/year
Comments on plant and / or production
Y If you have comments or remarks, please use this field
Total cooling water intake for base year 2010 (SUM of all points)
Z Please fill in total amount of cooling water intake.
Unit AA Default is m3/year
Average share of cooling water used for other than cooling (process, etc.) for base year 2010
AB In this study we are focusing on cooling water. Therefore, if possible, reporting should be limited to cooling water. If this is not possible (e.g. when water intake is combined with process water), please estimate the share of water (in % of volume) that is used for other purposes than cooling. If all water is used for cooling, please fill in “0”
Maximum allowed total annual cooling water intake as per permit / regulations
AC Please report the total annual permitted cooling water intake. If more limits (i.e. limits per month or time independent) apply please note in the comment field
Unit AD Default is m3/year
Total cooling water discharge to water body for base year 2010 (SUM of all points)
AE Please fill in total amount of cooling water discharge.

CESNL13784 End Report 153
Data element Column Description
Unit AF Default is m3/year
Average cooling water intake temperature for base year 2010
AG Please fill in average temperature of cooling water at intake.
Unit AH Default is °C
Average cooling water discharge temperature for base year 2010
AI Please fill in average temperature of cooling water at discharge.
Unit AJ Default is °C
Maximum allowed cooling water discharge temperature as per permit / regulations
AK Please report the maximum permitted discharge temperature. If more limits apply, please note in the comment field
Unit AL Default is °C
Comments on cooling water AM If you have comments or remarks, please use this field
Sheet ‘D0’ – Detailed information on the facilities
Below you find an overview of the requested data elements, where they can be found in the sheet
and a description of the type of information that is requested. In this sheet information taken mainly
from the E-PRTR database is presented for verification. If the data are erroneous, please overwrite
the current value(s) and make note in the comment field (column G).
Data element Column Description
Comment field G If you have comments or remarks, please use this field
Project ID H This value is used by the project team as a unique ID for this facility
and is not to be changed
National ID I This value can be used for identification of this facility
Company name J This value can be used for identification of this facility, if erroneous,
please change
Sector K If erroneous, please select different sector
Facility name L If erroneous, please type different name
Street M This value can be used for mapping the location of this facility
Number N This value can be used for mapping the location of this facility
City O This value can be used for mapping the location of this facility
Postal/Zip code P This value can be used for mapping the location of this facility
Country code Q This value can be used for mapping the location of this facility
Country R This value can be used for mapping the location of this facility
Coordinates: Latitude (X) S Please check value - if erroneous, please correct (see ’general
instructions’)
Coordinates: Longitude (Y) T Please check value - if erroneous, please correct (see ’general instructions’)

CESNL13784 End Report 154
Appendix IV Data validation documents
IV-1 Example data validation template – Power sector

CESNL13784 End Report 155

CESNL13784 End Report 156
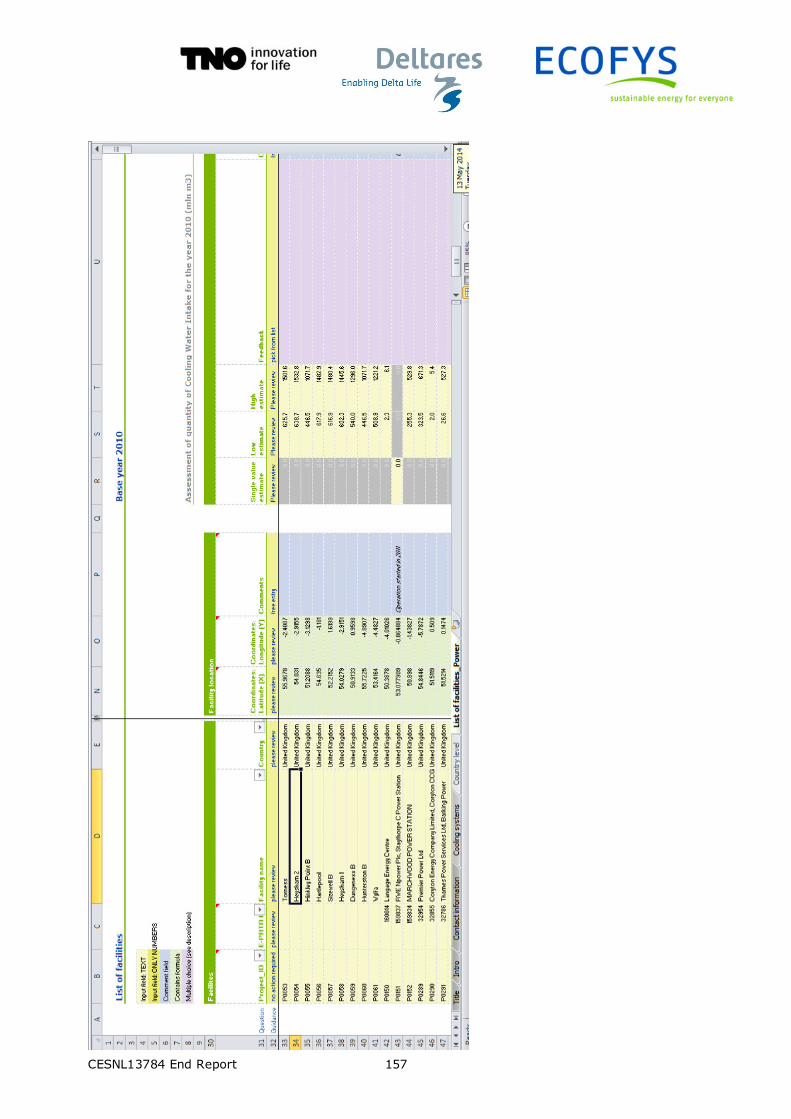
CESNL13784 End Report 157

CESNL13784 End Report 158

CESNL13784 End Report 159
IV-2 Example data validation guidance document – Power sector
MEMO
Pilot study collecting plant-specific data on cooling water availability, use and
sustainability – validation of estimates
Background
DG Environment contracted ECOFYS together with TNO and Deltares to carry out a pilot study to
build a geo-localised inventory of cooling water use for power production and three key industrial
sectors. Feeding into the on-going work on water accounts, this inventory will enable further
assessment by the European Commission and the European Environment Agency (EEA) of the impact
of energy and industrial use of water on water resources and the vulnerability of the former to
changes in water resources availability. The scope of the inventory is the entire EU territory
(including ultra-peripheral regions). Key sectors covered as part of this pilot study include thermal
power plants (including nuclear) and three industrial sectors: refineries, iron & steel and the chemical
sector.
In the past weeks, we have gathered data of individual facilities in different EU-countries. The project
has now entered the data validation phase. Together with this memo, we share with you reported
and/or estimated values for annual cooling water intake, discharge and consumption for the year
201029. For those facilities for which no data was gathered directly, estimations of the cooling water
use are provided.
Goal of sharing reported and estimated data
This memo and adjoined data set is shared with you with the request to compare the reported and
estimated data with your experience or data. This part of the project is of high importance as it
allows for validation of our results. For the estimated values we share cooling water use (intake,
discharge and consumption) in the form of a range (low and high estimates). We provide information
per facility in a detailed list in the attached MS Excel file. For ease of review we have also included
the total sum of water use per country.
Your feedback
Please review the information in this memo and the attached database (in MS Excel) carefully and
provide us with feedback on how well our estimates match with your in-house information. Depending on your access to information and time available please review:
▪ Country estimates
▪ Estimate per individual facility
Please use the following guidance in providing feedback on the cooling water estimates for individual
plants:
29 Note that the database will inc lude content for the time period spanning from 2001-2012. For ease of review we only provide values for
the year 2010. Date for the entire period is available upon request.

CESNL13784 End Report 160
� Much too high, actual value is less than 20% of single value or low estimate
� Too high, actual value is less than 50% of single value or low estimate
� Actual value is close to estimate or within range
� Too low, actual value is more than 200% of single value or high estimate
� Much too low, actual value is more than 500% of single value or high estimate
NOTE: For those facilities where we have received non-anonymous data through data gathering we
report a single value. For those facilities where we have not received plant specific information we
report a range.
Timeline
Moving to this phase in the project allows us to finalise the project in time (scheduled Q2 of 2014).
We kindly ask you to send back your findings and comments before May-30-2014.
How were the cooling water use values in the validation sheet derived?
The values presented on cooling water intake, discharge and consumption are based on (in order of
priority):
1. Data received for the specific plant received in the data gathering phase of this project. In
these cases, a single value for cooling water intake, discharge and consumption is included.
2. Estimated values based on the pigeonholing approach, where values have been derived from
a sample of comparable power plants for which we received data in this project. In some
cases this was complemented with information from literature. Here, a low estimate and a
high estimate are presented. These have been derived from the available data as first quartile
and third quartile values, not minimum or maximum values. This is elaborated further in the
next paragraph.
3. Default values from literature, in case no value could be estimated from the data collected as
part of the project. Again a low and a high estimate are presented in this case.
As part of the pigeonholing approach (item 2 in the list above), data from a set of plants was used to
derive a likely range for actual cooling water intake, discharge or consumption for a comparable
plant. It was decided to present this range as first-quartile to third-quartile range. This narrower
range was used instead of a minimum to maximum range, as it became clear that the sometimes
very wide range of values observed in data from actual plants would render such a range not very
meaningful.
Statistically, one would expect some 50% of the actual values to lie within this range between first
quartile and third quartile. This also means that some 25% of plants are expected to have a cooling
water intake / discharge / consumption greater than the high estimate and likewise some 25% of
plants would have values lower than the low estimate.
The present validation approach serves to validate these resulting values. The feedback sought and
the tick-box categories defined above can serve to fine-tune these ranges and correct any individual
plant, if outside of this range.
Approach to estimate cooling water use when no specific data are available
Cooling water use functions are prepared to estimate the cooling water use (intake, consumption and
discharge) for those facilities where specific data on cooling water were not available (item 2 and 3 in
list above).

CESNL13784 End Report 161
Although water use is site specific and dependent on many parameters, the current water use
function is based on simplified specific cooling water use factors, expressed in m3/MWh. Specific
cooling water use (intake, consumption and discharge) is estimated based on literature review and a
survey across stakeholders within the European power sector, covering:
▪ Specific cooling water intake (in m3/ MWh)
▪ Specific cooling water discharge (in m3/ MWh)
▪ Specific cooling water consumption (in m3/ MWh)
From the results of the survey we have deducted categories of power plants according to their
dominant fuel type and installed cooling technology, the so called pigeonholing approach. In this
study power plants and their dominant fuel type are characterised into 11 categories of power plants,
see Table 6.
Table 32 Types of power plants characterised in this study
Fuel and type of power plant Description
Biomass and waste Biomass and waste fired power plant
Hard coal subcritical Hard coal fired power plant with subcritical steam parameters
Hard coal supercritical Hard coal power plant with supercritical steam parameters
Hard coal generic Hard coal power plant with unknown steam parameters
Natural gas combined cycle Natural gas fired combined cycle power plant
Natural gas steam boiler Natural gas fired steam boiler
Lignite subcritical Lignite fired power plant with subcritical steam parameters
Lignite supercritical Lignite fired power plant with supercritical steam parameters
Lignite generic Lignite fired power plant with unknown steam parameters
Nuclear Nuclear
Oil Oil
Next to the type of power plant the type of cooling system is a key parameter. Seven types of cooling
systems are discerned using the definitions as provided in the Industrial Cooling System BREF (see
Figure 43). Information on the installed cooling system per facility was gathered through the survey
and by visual recognition using geographical mapping software. If no information was received
through this approach then a cooling system has been assumed. At this stage, the following
assumption has been applied: if a power plant is situated at a fresh water body then recirculated
cooling is assumed. If the power plant is located nearest to the coast then it is assumed that the
power plant operates using a once-through cooling system.
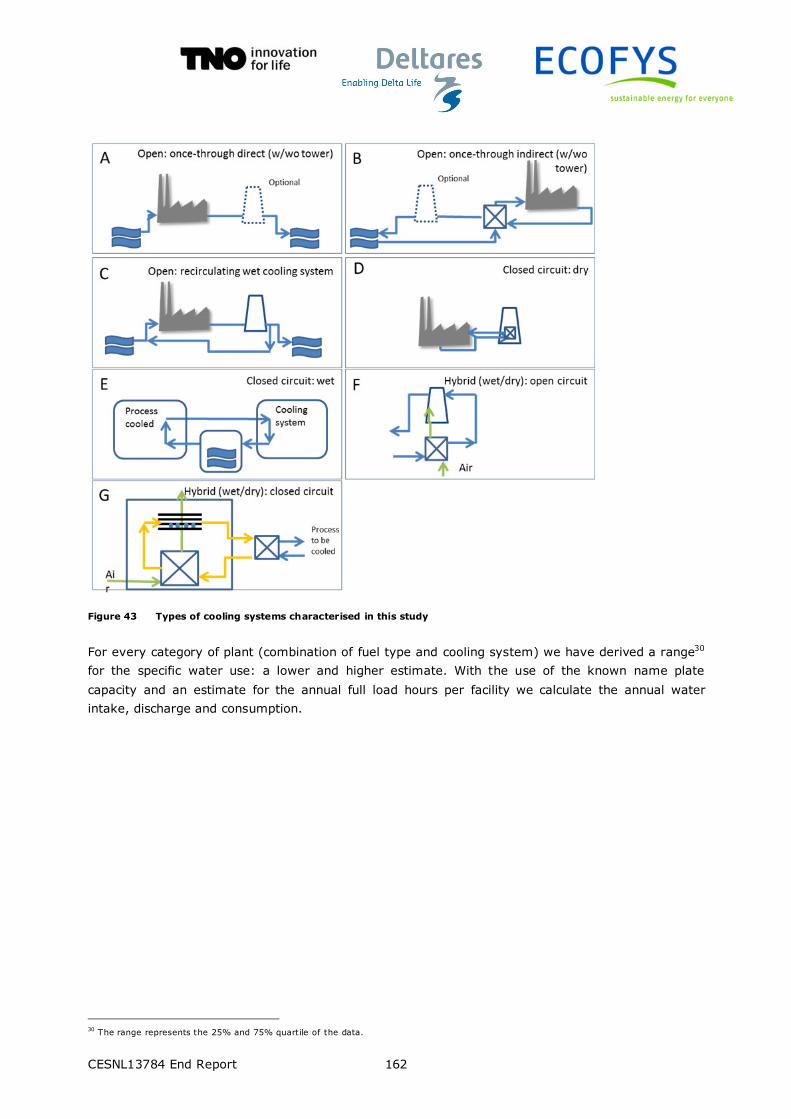
CESNL13784 End Report 162
Figure 43 Types of cooling systems characterised in this study
For every category of plant (combination of fuel type and cooling system) we have derived a range30
for the specific water use: a lower and higher estimate. With the use of the known name plate
capacity and an estimate for the annual full load hours per facility we calculate the annual water
intake, discharge and consumption.
30 The range represents the 25% and 75% quartile of the data.

CESNL13784 End Report 163
Appendix VI Vulnerability and water risk
indicators earlier used
This section provides more background information on earlier studies on this topic. Per source the
most relevant information is directly taken from the studies.
Source: van Vliet et al 2013
Short definition of indicator: mean useable capacity versus installed capacity
“A thermoelectric power production model (Koch and Vögele, 2009, Rübbelke and Vögele, 2011) was
used to assess the impacts of projected changes in river flow and water temperature on
thermoelectric water demand and usable power plant capacities. In a first step, the required water
intake (q) of the power plant is calculated based on the installed capacity (KW), efficiency (ƞtotal,
ƞelec) and parameters related to the cooling system (α, β, ω, EZ), water temperature limitations
(Tlmax, ∆Tlmax) and simulated daily water temperature (Tw) at the power plant site. In the second
equation, the maximum usable capacity is calculated based on the daily required water withdrawal
(q), river discharge (Q) and water temperature (Tw), in combination with parameters describing the
maximum fraction of river discharge withdrawn for cooling (ɣ), water temperature limitations (Tlmax,
∆Tlmax) and parameters related to the cooling system (α, β, ω, EZ) (van Vliet et al., 2012b).
Where: KW = installed capacity [MW]; ƞtotal = total efficiency [%]; ƞelec = electric efficiency [%]; α
= share of waste heat not discharged by cooling water [%]; β = share of waste heat released into
the air; ω: correction factor accounting for effects of changes in air temperature and humidity within
a year; EZ = densification factor; λ = correction factor accounting for the effects of changes in
efficiencies; ρw = density fresh water [kg m‐3]; Cp = heat capacity of water [J kg‐1 °C‐1]; Tlmax =
maximum permissible temperature of the cooling water [°C]; ∆Tlmax = maximum permissible
temperature increase of the cooling water [°C]; ɣ = maximum fraction of river discharge to be
withdrawn for cooling of thermoelectric power plants [%]; q = daily cooling water demand [m3s‐1];
Tw = daily mean river temperature [°C]; Q = daily river discharge [m3s‐1]; KWmax = usable
capacity of power plant [MW]. “

CESNL13784 End Report 164
Source: WEI
http://www.eea.europa.eu/data-and-maps/indicators/use-of-freshwater-resources/use-of-
freshwater-resources-assessment-2
“Short definition of indicator: WEI = Total Annual Water Abstraction over Available Long Term
Freshwater Resources
Definitions (all units in mio cubic meters)
Precipitation (P) Total volume of atmospheric wet precipitation (rain, snow, hail, ..). Precipitation is usually measured by meteorological or hydrological institutes
Actual Evapotranspiration (Eta)
Total volume of evaporation from the ground, wetlands and natural water bodies and transpiration of plants. According the definition of this concept in Hydrology, the evapotranspiration generated by all human interventions is excluded, except unirrigated agriculture and forestry. The 'actual evapotranspiration' is calculated using different types of mathematical models, ranging from very simple algorithms (Budyko, Turn Pyke, etc) to schemes that represent the hydrological cycle in detail. Please do not report potential evapotranspiration which is "the maximum quantity of water capable of being evaporated in a given climate from a continuous stretch of vegetation covering the whole ground and well supplied with water".
Internal Flow D ( = P-Eta)
Total volume of river runoff and groundwater generated, in natural conditions, exclusively by precipitation into a territory. The internal flow is equal to precipitation less actual evapotranspiration and can be calculated or measured. If the river runoff and groundwater generation are measured separately, transfers between surface and groundwater should be netted out to avoid double counting.
Actual External Inflow (I) Total volume of actual flow of rivers and groundwater, coming from neighbouring territories.
Total Freshwater Resources Internal Flow (D) + Actual External Inflow (I).
Long Term Annual Average (LTAA) The minimum period of calculation for the LTAA is the latest available 20 year
Gross Water Abstraction
Water removed from any source, either permanently or temporarily. Mine water and drainage water are included. Water abstractions from groundwater resources in any given time period are defined as the difference between the total amount of water withdrawn from aquifers and the total amount charged artificially or injected into aquifers. Water abstractions from precipitation (e.g. rain water collected for use) should be included under abstractions from surface water. The amounts of water artificially charged or injected are attributed to abstractions from that water resource from which they were originally withdrawn. Water used for hydroelectricity generation is an in-situ use and should be excluded.
WEI traditional Annual Gross Water Abstraction / LTAA Freshwater Resources

CESNL13784 End Report 165
Short definition of indicator: WEI+ = Total Water Abstraction over Renewable Water Availability
Definitions (all units in mio cubic meters). The definitions in red differ from the EUROSTAT definitions
used so far for the calculation of WEI, or refer to the newly introduced parameters of WEI+
Precipitation (P) Total volume of atmospheric wet precipitation (rain, snow, hail, ..). Precipitation is usually measured by meteorological or hydrological institutes
Actual Evapotranspiration (Eta)
Total volume of evaporation from the ground, wetlands and natural water bodies and transpiration of plants. According the definition of this concept in Hydrology, the evapotranspiration generated by all human interventions is excluded, except unirrigated agriculture and forestry. The 'actual evapotranspiration' is calculated using different types of mathematical models, ranging from very simple algorithms (Budyko, Turn Pyke, etc) to schemes that represent the hydrological cycle in detail. Please do not report potential evapotranspiration which is "the maximum quantity of water capable of being evaporated in a given climate from a continuous stretch of vegetation covering the whole ground and well supplied with water".
Internal Flow D ( = P-Eta)
Total volume of river runoff and groundwater generated, in natural conditions, exclusively by precipitation into a territory. The internal flow is equal to precipitation less actual evapotranspiration and can be calculated or measured. If the river runoff and groundwater generation are measured separately, transfers between surface and groundwater should be netted out to avoid double counting.
Actual External Inflow (I) Total volume of actual flow of rivers and groundwater, coming from neighbouring territories (e.g. RBDs) within or outside the country.
Water Requirements (WR) Minimum volume of water that needs to be sustained: for environmental purposes and/or treaties (e.g. intransboundary rivers)
Returned Water (R)
Volume of abstracted water that is discharged to the fresh water resources of the hydrological unit (e.g RBD, RB) either before use (as losses) or after use (as treated or non-treated effluent). It includes water that was directly discharged from a user (e.g. domestic, industrial etc. including cooling water, mining, and water used for hydropower generation), and water lost from the waste water collection system (as overflow or leakage). Artificial groundwater recharge is also considered as returned water for the current purposes of calculation of WEI+. Discharges to the sea are excluded.
Renewable Water Availability (RWA) Internal Flow (D) + Actual External Inflow (I) + Returned Water (R) - Water Requirements (WR)
Total Water Abstraction (TWA)
Freshwater removed from any source, either permanently or temporarily. Mine water and drainage water are included. Water used for hydropower generation is included (although in-situ it is considered a use). Water abstractions from precipitation (e.g. rain water collected for use) should be included under abstractions from surface water.
WEI+ Total Water Abstraction / Renewable Water Availability
Calculation of WEI+:
WEI+ = TWA / RWA
Where :
RWA = D + I - WR + R
D = P – Eta
Source: Scanlon et al 2013
http://iopscience.iop.org/1748-9326/8/4/045033
Short definition of indicator: reduced electricity generation
“The concept of vulnerability in the context of this study refers to a system’s susceptibility
to reduced electric generation or brownouts or blackouts when subjected to drought-related water
shortages.”

CESNL13784 End Report 166
Source: WRI et al 2013
http://www.wri.org/sites/default/files/pdf/aqueduct_metadata_global.pdf
http://docs.wri.org/aqueduct/freshwater_sustainability_analyses.pdf
Short definition of indicator: compound weighed indicator based on 8 risk indicators most relevant
for the power sector.
1 Baseline water stress
Description: Baseline water stress measures total annual water withdrawals (municipal, industrial,
and agricultural) expressed as a percent of the total annual available flow. Higher values indicate
more competition among users. Arid areas with low water use are shown in gray, but scored as high
stress when calculating aggregated scores.
Calculation: Water withdrawals (2010) divided by mean available blue water (1950–2008). Areas
with available blue water and water withdrawal less than 0.03 and 0.012 m/m2 respectively are
coded as “arid and low water use”.
2 AVAILABLE BLUE WATER (Ba)
Description: Available blue water (Ba) is the total amount of water available to a catchment before
any uses are satisfied. It is calculated as all water flowing into the catchment from upstream
catchments plus any imports of water to the catchment (Eim(i)) minus upstream consumptive use
plus runoff in the catchment.
Calculation: Ba(i) = R(i) + Eim(i) + Σ Qout(iup) where Qout is defined as the volume of water
exiting a catchment to its downstream neighbor: Qout(i) = max(0, Ba(i) – Uc(i) – L(i) – Ex(i)), Uc(i)
are the consumptive uses, L(i) are the in-stream losses due to reservoirs and other infrastructure,
and Ex(i) are the exports of water from catchment i. Negative values of Qout are set to zero. In first-
order catchments ΣQout(j) is zero, so available blue water is runoff plus imports.
3 Inter-annual Variability
Description: Inter-annual variability measures the variation in water supply between years.
Calculation: Standard deviation of annual total blue water divided by the mean of total blue water
(1950–2008).
4 Seasonal Variability
Description: Seasonal variability measures variation in water supply between months of the year.
Calculation: Standard deviation of monthly total blue water divided by the mean of monthly total
blue water
(1950–2008). The means of total blue water for each of the 12 months of the year were calculated,
and the variances estimated between the mean monthly values.
5 Drought Severity
Description: Drought severity measures the average length of droughts times the dryness of the
droughts from 1901 to 2008.

CESNL13784 End Report 167
Calculation: Drought severity is the mean of the lengths times the dryness of all droughts occurring
in an area. Drought is defined as a contiguous period when soil moisture remains below the 20th
percentile. Length is measured in months, and dryness is the average number of percentage points
by which soil moisture drops below the 20th percentile. Drought data is resampled from original
raster form into hydrological catchments.
6 Upstream Storage
Description: Upstream storage measures the water storage capacity available upstream of a
location relative to the total water supply at that location. Higher values indicate areas more capable
of buffering variations in water supply (i.e. droughts and floods) because they have more water
storage capacity upstream.
Calculation: Upstream storage capacity divided by the mean of total blue water (1950–2008).
7 Groundwater Stress
Description: Groundwater stress measures the ratio of groundwater withdrawal relative to its
recharge rate over a given aquifer. Values above one indicate where unsustainable groundwater
consumption could affect groundwater availability and groundwater-dependent ecosystems.
Calculation: Groundwater footprint divided by the aquifer area. Groundwater footprint is defined as
A[C/(R − E)], where C, R, and E are respectively the area-averaged annual abstraction of
groundwater, recharge rate, and the groundwater contribution to environmental stream flow. A is the
areal extent of any region of interest where C, R, and E can be defined.
8 Return Flow Ratio
Description: Return flow ratio measures the percent of available water previously used and
discharged upstream as wastewater. Higher values indicate higher dependence on treatment plants
and potentially lower water quality in areas that lack sufficient treatment infrastructure and policies.
Arid areas with low water use are shown in gray, and scored as low stress when calculating
aggregated scores.
Calculation: Upstream non-consumptive use divided by the mean of available blue water (1950–
2008). Areas with available blue water and accumulated upstream non-consumptive use less than
0.03 and 0.012 m/m2 respectively are coded as “arid and low water use”.

CESNL13784 End Report 168
Appendix VII Vulnerability indicators
Background
Regarding the assessment of vulnerability of cooling water availability, it is important to note that the
abstraction of water for industrial use in general has decreased over the last 15 years, partly because
of the general decline in water-intensive heavy industry but also due to technical developments such
as on-site recycling of wastewater. Water intake for energy production and cooling have also
decreased, primarily due to increased plant efficiency, heat export or the implementation of other
cooling technologies. Still, the water demand for energy production is a significant share of total
water use at around 50%. However, a large share of this water is returned to a water body, this in
contrast to water abstracted for agriculture, which is generally consumed by crops or through
evapotranspiration. In combination with the trade-offs discussed in section 13.4, this underlines the
fact that reducing cooling water intake per se is not necessarily an appropriate goal. Virtually all
water abstractions for energy production and for a significant part of the industrial production
originate from surface water. Due to this dependency, cooling water availability for energy production
is rather time-variable over the year. Especially during summer periods and drought, alternative
sources, operating regimes or cooling methods may be used.
Vulnerability and cooling water – The relevance for the European power sector
The relevance of the balance in cooling water demand and supply has gained interest. An
example is the work by Van Vliet et al, Koch and Rubelke, Koch and Vogele who analysed the
cooling water needs and availability related to the EU power sector, also to assess its
vulnerability to potential future climate change. The central lessons learned from these studies
are that exact data on cooling water use for European power plants is not publicly available and
accessible, and that more frequent drought and heat wave incidents in the future may have
profound effects on the availability and costs of electricity production capacity in the EU.
A vulnerability indicator or multiple indicators need to be defined to allow assessment of the
vulnerability of the four sectors considered in the present study to changes in and constraints to
cooling water availability. This requires capturing the technological, geographical and meteorological
characteristics of facilities and the water system. References to earlier work on this topic are included
in Appendix VI Vulnerability and water risk indicators earlier used. This is used as a basis for
developing a vulnerability indicator in this study.
Next to defining an indicator to allow for the assessment of vulnerability also mitigation measures will
be identified to allow for temporal or structural reduction in vulnerability of the four sectors to the
availability of cooling water.
Vulnerability indicator
In essence, the service of cooling water use is its heat carrying and transferring capacity. Cooling
water intake and discharge is based on the need for heat discharge of a certain facility. A water body
supplies this service in the form of consumptive water use (evaporation of the water, make-up of
water in the cooling system) or non-consumptive water use (only heating of the water). The facility is
vulnerable if it is likely that the relevant water body is not able to fulfil the service of supplying water
for consumptive and non-consumptive use for cooling processes. The impact on the facility might be
reduced operating time or operation at reduced load.

CESNL13784 End Report 169
This affects the production and financials of the facility if it does not have mitigating measures in
place to cope with (temporarily) reduced cooling water supply. Anything that limits or influences the
heat carrying capacity of the water body influences the vulnerability of the facility.
Two key factors in the demand and supply of cooling water are the temperature and the volume of
water, which jointly determine the heat load. Vulnerability then relates to quantity and temperature
of cooling water need (demand) versus availability (supply). This is clear in the case of once through
cooling systems. In the case of tower-cooling systems, however, more complex considerations and
the trade-offs discussed in section 13.4 have to be considered where the proportion of heat load
which is to be lost through evaporation is a key driver.
The indicator should meet the following conditions:
▪ Distinguish between consumptive and non-consumptive use of cooling water
▪ Take into account both temperature and flow of cooling water need and availability
▪ Take into account the fact that cooling water use affects heat carrying capacity of water body,
by water consumption and/or by heat discharge.
▪ Should align with WEI+ , (see for details Appendix VI Vulnerability and water risk indicators
earlier used).
▪ Should include a time dimension (e.g. take into account seasonal and annual variability)
▪ Should include a geographical dimension (i.e. for a water body or section of a water body)
The following indicators are proposed:
▪ ‘Heat discharge demand into water of installed industrial capacity’ over ‘Heat load capacity of a
water body (e.g. catchment area or river basin)’.
This indicator can subsequently be used to also express the vulnerability in potential lost production
or electricity generation of a facility or group of facilities in a certain area. In later vulnerability
assessments this indicator can also be used in conjunction with water exploitation indices (WEI and
WEI+) and with indicators for seasonal variability of temperature and cooling water availability for
regions or water bodies for further refinement.
Details on vulnerability indicator: Heat discharge availability index
We suggest to use an indicative method using colours – compare water body flows (Q) and
temperature (T) per month with monthly cooling requirements.
This requires a three-step assessment:
▪ The heat load capacity of a water body (or a section of it) can be estimated using the following
formula:
Heat load capacity (supply) = (Q-C) x ɣ x max(min (Tlmax – T), δTmax), 0) x Cp x ρ
where:
Q = Flow or throughput of water body (or segment) [m3/month]
C = Consumptive use of cooling water intake
ɣ = Maximum fraction of river flow to be withdrawn for cooling of thermoelectric power
plants [%]
Tlmax = Maximum discharge temperature as set in environmental regulation [°C]

CESNL13784 End Report 170
T = Temperature of water body section (monthly average) [°C]
δTmax = Maximum permissible increase of cooling water temperature [°C]
Cp = Specific heat capacity water [J kg‐1 °C‐1];
ρ = Density of water [kg m‐3]
In this formulation it is important to take into account that heat emitted to discharged to a
water body subsequently emits this heat to its environment gradually, depending amongst
others on wind speed and air temperature. This is relevant in particular, when there are
multiple thermal discharges along the length of a river.
▪ The heat load of the water body can then be compared to the installed heat load of facilities
The heat load of the facility can be calculated using the following formulation:
Heat load capacity (demand) = q x Cp x ρ x δT
where:
q = Cooling water discharge [m3 s-1]
Cp = Specific heat capacity water [J kg‐1 °C‐1]
ρ = Density of water [kg m‐3]
δT = Increase of cooling water temperature [°C] (Tin -Tout)
▪ It is important to note that this indicator relates to local thermal considerations. It does not yet
take into account water resource availability risk, both in terms of gross and net water use.
Thus, the question if there is a sufficient quantity of water available with sufficient reliability to
allow effective operation of the relevant plants would still need to be addressed.
▪ Furthermore, there may be other considerations that may play a role, such as water
requirements for aquatic life, or criteria related to the risk of fish intake with cooling water.
▪ Using a colour code we can show whether the required heat load of a water body and the
actual demand for heat discharge into this water body are critical or not. We suggest using a 5
colour code.
Category of
vulnerability Description
Low <10 % of available heat discharge capacity can be used. There is very likely sufficient
cooling water supply to meet the current and future demand.
Moderate
Installed demand for heat load discharge equals 10-20% of available heat discharge
capacity. There is likely sufficient cooling water supply to meet the current and future
demand.
Medium – high
Installed demand for heat discharge equals 20-40% of available heat discharge
capacity. There seems to be sufficient cooling water supply to meet the current and
future demand, but seasonal and annual variations might pose challenges.
High
Installed demand for heat discharge equals 40-80% of available heat discharge
capacity. There seems to be sufficient cooling water supply to meet the current and
future demand, but seasonal and annual variations might pose significant challenges.
Extremely high
Installed demand for heat load discharge of more than 80% of available heat capacity.
There is a high chance of insufficient cooling water supply to meet the current and
future demand. Seasonal and annual variations might often pose critical challenges.
Inspired by: http://docs.wri.org/aqueduct/freshwater_sustainability_analyses.pdf

CESNL13784 End Report 171
Appendix VIII Supplemental tables
a. Specific cooling water intake for power plants as assumed in the calculations
b. Specific cooling water discharge for power plants as assumed in the calculations
c. Specific cooling water consumption for power plants as assumed in the calculations

CESNL13784 End Report 172
Table 33 cooling water intake for power plants as assumed in the calculations.
Fuel type Cooling system Cooling tower Min Max 1st quartile 3rd quartile Average Median N
m3/MWh m3/MWh m3/MWh m3/MWh m3/MWh m3/MWh #
Biomass and
waste
Open: recirculating wet cooling system Yes 0.2 5.5
Open: once-through No 75.7 189.3
Closed circuit Yes 0.1 5.5
Hard coal Open: recirculating wet cooling system No 0.0 0.0
Yes 2.3 6.5 2.7 5.7 4.3 4.5 6
Open: once-through No 13.2 250.0 110.1 194.1 145.7 146.7 18
Yes 98.0 147.5
Hybrid (wet/dry) Yes 3.5 5.2
Closed circuit Yes 0.2 5.0 1.6 2.7 2.2 2.2 15
Lignite Open: recirculating wet cooling system Yes 0.2 3.5 2.0 2.6 2.3 2.4 9
Open: once-through No 142.2 526.6 148.2 184.4 234.8 172.8 5
Closed circuit Yes 2.4 2.8
Natural gas
combined
cycle
Open: recirculating wet cooling system No 89.3 156.5
Yes 1.5 5.8 1.7 3.2 2.8 2.1 6
Open: once-through No 0.1 394.2 89.3 156.5 130.7 129.5 37
Yes 0.0 286.6 1.0 173.9 93.6 6.5 5
Hybrid (wet/dry) No 0.1 2.1
Yes 0.0 12.5 0.1 2.1 2.5 1.4 8
Closed circuit No 0.0 4.7 0.0 0.0 1.0 0.0 5
Yes 0.0 5.2 0.4 2.0 1.5 1.3 25
Natural gas
steam boiler
Open: recirculating wet cooling system Yes 1.9 5.0
Open: once-through No 114.6 796.7 137.7 225.1 277.3 201.6 6
Closed circuit Yes 1.6 2.7
Nuclear Open: recirculating wet cooling system Yes 3.0 9.8
Open: once-through No 94.6 227.1
Open: once-through Yes 3.0 227.1
Closed circuit Yes 3.0 9.8
Oil Open: recirculating wet cooling system No 123.7 310.5
Yes 1.4 5.0
Open: once-through No 0.3 1027.4 56.5 412.4 282.2 217.1 15
Closed circuit No 1.2 3.1
Yes 1.6 2.7

CESNL13784 End Report 173
Table 34 Specific cooling water discharge for power plants as assumed in the calculations.
Fuel type Cooling system Cooling tower Min Max 1st quartile 3rd quartile Average Median N
m3/MWh m3/MWh m3/MWh m3/MWh m3/MWh m3/MWh #
Biomass and
Open: recirculating wet cooling system Yes 0.2 5.5
Open: once-through No 74.6 188.1
Closed circuit Yes 0.1 5.5
Hard coal Open: recirculating wet cooling system No 0.0 0.0
Yes 0.1 5.0 1.3 3.9 2.6 2.7 6
Open: once-through No 11.8 248.8 110.1 194.1 145.5 146.6 18
Yes 59.7 135.7
Hybrid (wet/dry) Yes 2.1 4.8
Closed circuit Yes 0.2 6.7 0.3 0.7 1.0 0.4 12
Lignite Open: recirculating wet cooling system Yes 0.2 0.9 0.5 0.7 0.6 0.6 8
Open: once-through No 141.6 525.1 148.2 183.8 234.3 172.8 5
Closed circuit Yes 2.2 2.8
Natural gas
combined
cycle
Open: recirculating wet cooling system No 89.3 156.5
Yes 0.3 4.5 0.8 2.3 1.7 1.1 6
Open: once-through No 0.1 394.5 95.1 157.6 134.3 130.4 36
Yes 0.0 286.2 0.2 173.5 93.1 5.7 5
Hybrid (wet/dry) No 0.4 1.1
Yes 0.0 12.5 0.4 1.1 2.3 0.8 7
Closed circuit No 0.0 2.2 0.0 0.0 0.5 0.0 5
Yes 0.0 3.9 0.1 0.9 0.8 0.6 22
Natural gas
steam boiler
Open: recirculating wet cooling system Yes 1.9 5.0
Open: once-through No 114.6 796.7 137.7 225.1 277.3 201.6 6
Closed circuit Yes 0.3 0.7
Nuclear Open: recirculating wet cooling system Yes 0.0 7.6
Open: once-through No 93.1 226.7
Open: once-through Yes 0.0 226.7
Closed circuit Yes 0.0 7.6
Oil Open: recirculating wet cooling system No 32.8 310.5
Yes 0.2 0.8
Open: once-through No 0.3 1027.4 56.5 412.4 281.7 217.1 15
Closed circuit No 0.3 3.1
Yes 0.3 0.7

CESNL13784 End Report 174
Table 35 Specific cooling water consumption for power plants as assumed in the calculations.
Fuel type Cooling system Cooling tower Min Max 1st quartile 3rd quartile Average Median N
m3/MWh m3/MWh m3/MWh m3/MWh m3/MWh m3/MWh #
Biomass and waste
Open: recirculating wet cooling system Yes 1.5 3.7
Open: once-through No 1.1 1.1
Closed circuit Yes 1.5 3.7
Hard coal Open: recirculating wet cooling system No 0.0 0.0
Yes 1.3 2.2 1.5 1.9 1.7 1.7 6
Open: once-through No 0.0 1.4 0.0 0.4 0.3 0.0 18
Yes 2.0 2.2
Hybrid (wet/dry) Yes 0.2 0.6
Closed circuit Yes -5.1 4.2 0.9 2.1 1.2 1.7 12
Lignite Open: recirculating wet cooling system Yes 0.0 2.2 1.5 1.8 1.5 1.6 8
Open: once-through No 0.0 1.6 0.0 0.6 0.6 0.5 5
Closed circuit Yes 2.0 2.2
Natural gas combined cycle
Open: recirculating wet cooling system No 0.0 0.0
Yes 0.7 2.2 0.7 1.2 1.1 0.8 6
Open: once-through No -0.5 2.8 0.0 0.0 0.1 0.0 36
Yes 0.0 0.8 0.4 0.8 0.5 0.4 5
Hybrid (wet/dry) No 0.0 0.6
Yes 0.0 2.3 0.0 0.6 0.6 0.5 7
Closed circuit No 0.0 2.5 0.0 0.0 0.5 0.0 5
Yes 0.0 3.0 0.4 1.2 0.9 0.9 21
Natural gas steam boiler
Open: recirculating wet cooling system Yes 0.7 1.2
Open: once-through No 0.0 0.0 0.0 0.0 0.0 0.0 6
Closed circuit Yes 0.9 2.1
Nuclear Open: recirculating wet cooling system Yes 2.2 3.2
Open: once-through No 0.4 1.5
Open: once-through Yes 0.4 3.2
Closed circuit Yes 2.2 3.2
Oil Open: recirculating wet cooling system No 0.0 0.0
Yes 1.2 4.2
Open: once-through No 0.0 5.1 0.0 0.0 0.5 0.0 15
Closed circuit No 0.0 0.0
Yes 0.9 2.1

CESNL13784 End Report 175
Appendix IX Overview data gathering and
validation contacts

CESNL13784 End Report 176
Organisation Data gathering - POWER sector Data validation power sector - SECTOR ORGANISATION Data validation country level - WATER AUTHORITY
Country Organisation
Quest.
Returned? Details Organisation
Quest.
Returned? Details Organisation
Quest.
Returned? Details
Austria Österreichs Energie
NO Our contact at Österreichs Energie distributed the questionnaire among the Austrian operators. Unfortunately, this did not result in filled-in questionnaires, despite our efforts to remind and contact our contact person.
Österreichs Energie NO No reaction on data validation request
Federal Ministry of Agriculture, Forestry, Environment and Water management
YES Power Power plants were validated on water use. For some power plants we received additional data and information. Refineries Water use of refinery was validated. Chemical Water use of chemical plants were validated. For one plant it was indicated that water intake comes from the neighbouring refinery. Iron and Steel
additional information on power plants.
Belgium Federatie van de Belgische Elektriciteits en Gasbedrijven (FEBEG)
YES Via GDF-Suez we established contact with FEBEG. They contacted the operators, gathered the filled questionnaires and compiled them to a single Belgian database.
Federatie van de Belgische Elektriciteits en Gasbedrijven (FEBEG)
YES From FEBEG we received comments on two specific power plants. For the other power plants we can assume that the estimations or single values are within range.
Send data validation request to several authorities: - Service Public de Wallon (SPW) - De Scheepvaart - Waterwegen en Zeekanaal (WenZ) - Flemish government
YES Service Public de Wallonie indicated that they were not able to provided quantitative feedback within the available timeframe. They did express concern that some values appeared to be incorrect and inconsistent on first review. Because of this SPW indicated it opposes the publication of this non-validated data included in the database. We did receive addit ional information on some power plants, that was included in the database.
Bulgaria Bulgarian Electric Power Association Basin Directorates
YES The approach taken in Bulgaria was mixed approach, combining data gathering and data validation. Based on the estimations, we received feedback either in the form of a validation of the estimated range or we received the actual data.
Bulgarian Electric Power Association Basin Directorates
YES The approach taken in Bulgaria was mixed approach, combining data gathering and data validation. Based on the estimations, we received feedback either in the form of a validation of the estimated range or we received the actual data.
Data validation
based on
statistical data
only.
Croatia Croatian Chamber of Economy
NO We contacted the Croatian Chamber of Economy for support on this topic. Our contact was willing to cooperate, but faced several issues impacting the data gathering process. The main issue was that Croatia does not have
Data validation
based on statistical
data only.
Data validation
based on
statistical data
only.

CESNL13784 End Report 177
Organisation Data gathering - POWER sector Data validation power sector - SECTOR ORGANISATION Data validation country level - WATER AUTHORITY
centralised data on water use, meaning that data must come from operators directly. This should then be evaluated by the Croatian Ministry of Environmental and Nature Protection before it could be shared. Therefore, we agreed to send out a pre-filled questionnaire with our estimations. Unfortunately, due to internal reorganisation at the Chamber of Commerce there was a delay in delivering the number and we did not receive the data.
Cyprus Electricity Authority of Cyprus (EAC)
YES Via a direct contact at EAC, we received the data on Cypriote power plants. Unfortunately, only the questionnaire on cooling systems was filled. We did not receive data on the actual water use.
Data validation
based on statistical
data only.
Water Development Department (WDD)
NO No reaction on data validation request
Czech Republic
Contacted several organisations, among which: - Energy Association - Ministry of Agriculture
NO We established contact with the Energy Association, which started promisingly. They agreed to distribute the questionnaire among operators and assist us with the data gathering. Unfortunately, we lost the contact with the association before we received any data. We tried to gather data via the Ministry, but it turned out that this data is scattered among several Ministries. Therefore, we did not manage to gather data on Czech Republic.
Data validation
based on statistical
data only.
Ministry Agriculture Ministry of the Environment Hydro Metereological Institute
NO No reaction on data validation request
Denmark Danish Ministry of the Environment
YES The Ministry of the Environment has contacted operators with the request to fill in the questionnaire. Due to time constraints, we decided to take a mixed approach and send out pre-filled questionnaire. Several operators responded to this call and some even provided us with the real data. Unfortunately, some of the data could not be submitted in time.
Danish Ministry of the Environment
YES We decided to take a mixed approach here sending out pre-filled questionnaire. Several operators responded to this call and returned the validation format, sometimes reporting the real values.
Danish Ministry of the Environment
NO No reaction on data validation request
Estonia Union of Electricity Industry of Estonia
YES Received data, but only on the cooling systems of the selected power plants. We did not receive the anonymous questionnaire with the actual cooling water figures.
Data validation
based on statistical
data only.
Data validation
based on
statistical data
only.
Finland Energia YES Our contact at Energeia distributed the questionnaire among the operators,
Energia YES The CHP-plants in the list are primarily used for heat production
Ymparisto YES Power Actual data on water use for

CESNL13784 End Report 178
Organisation Data gathering - POWER sector Data validation power sector - SECTOR ORGANISATION Data validation country level - WATER AUTHORITY
but we did only receive feedback from one power plant. In a telephone conversation he explained that most of the power plants included in our selection are CHP, used once-through cooling and have no cooling towers.
(DH and process heat). These plants should be checked.
some power plants. Refineries Water use for Porvoo and Naantali are added Chemical. No cooling water use in Finland in ethylene or hydrogen sectors. Borealis Polymers Fenolit ja aromaatit liiketoimintayksikkö does not use cooling water. Iron and Steel Ruukki Metals Oy, Raahen terästehdas does not use cooling water.
France EDF France YES EDF is not in favour of producing real data on each plant considering that huge variations on water intake, discharge and consumption in a given year is related to several factors. EDF has therefore proposed to consider the average values of intake, discharge and consumption of each type of power plant and each type of cooling system. The values we submitted are based on several years of operation.
EDF France YES EDF commented on the results of the cooling water use estimates, however, considering the relative short period of time given for comments thee comments should be considered as a technical contribution to the study and not as an official EDF’s validation of the methodology and estimated values of the study. Actual 2010 values were used to validate the range presented. However, EDF remains a bit doubtful about the representativeness of a given year to derive generic figures.
French Geological Survey (BRGM)
NO No reaction on data validation request

CESNL13784 End Report 179
Organisation Data gathering - POWER sector Data validation power sector - SECTOR ORGANISATION Data validation country level - WATER AUTHORITY
Germany Bundesverband der Energie- und Wasserwirtschaft (BDEW)
YES The data gathering process in Germany was somewhat differently from other countries. Our contact at BDEW and many of the German operators questioned the unclear relationship of the exercise with the on-going BREF LCP revision process and the upcoming revision of the BREF for industrial cooling systems (BREF ICS). Also the data that was available from E-PRTR database was found to be incomplete and mistakes were made in ownership, capacity etc. In addition, many companies highlighted the availability of publicly available data at the German Statistical offices with respect to cooling water use at regional, sectoral and river basin level. Therefore, our contact at BDEW suggested to not follow the plant-by-plant approach, but follow a different approach in which statistical data was used to calculate the water use in the German power sector in 2010.Furthermore, specific data on water use in lignite plants was shared (anonymously). As BDEW is not allowed to share data on individual power plants, they could not provide data on the errors in the E-PRTR database.
Bundesverband der Energie- und Wasserwirtschaft (BDEW)
YES The water use figures as shared by BDEW are falling within the estimated range, albeit on the HIGH end of the estimate. This might raise the impression that the German power plants are inefficient in their cooling water use. This is refuted by BDEW. According to BDEW, they would expect an underestimation of cooling water use than a overestimation. Furthermore, we received the following specific comments: - For several power plants the name of the facility and/or the owner are not correctly displayed; - The list of nuclear power plants is incomplete; - The specific fuel type of some coal plants was not estimated correctly; - Most of the CHP-plants do not use cooling water; - Cooling towers are only used 1/3 of the year; - Cooling systems are not always correctly estimated; - Cooling water use of waste plants is not included in the German statistical data. As BDEW is not entitled to share information with third parties, they could not help us to improve the database.
Deutscher Verrein des Gas- und Wasserfaches (DVGW)
NO No reaction on data validation request
Greece Hellenic Association of Independent Power Producers
NO We contacted several Greek organisations requesting support on data gathering. We did not received any reaction and did not manage to establish contact.
Data validation
based on statistical
data only.
Ministry of Environment, Energy and Climate Change
NO
Hungary Ministry of Internal Affairs Ministry of Environment Contacted individual companies
YES We established contact with the Hungarian Ministry of Internal Affairs, providing actual figures and background material.
Data validation
based on statistical
data only.
Ministry of Internal Affairs
NO The Ministry did not want to validate the data and referred to the national surveillance authority. Unfortunately, they could not help with validation.
Ireland Electricity Association of
YES EAI gathered data on the Irish power plants and compiled them in a single
Data validation
based on statistical
Environmental Protection
YES Power As a result of changes in the

CESNL13784 End Report 180
Organisation Data gathering - POWER sector Data validation power sector - SECTOR ORGANISATION Data validation country level - WATER AUTHORITY
Ireland (EAI) database covering almost all Irish power plants.
data only. Agency energy market, different operators taking over different plants and larger plants splitting up to secondary plants. In general the locations, types of facilit ies and power generated etc. appear to be correct. Refineries No comments Chemical, Iron and Steel Not included in the selection
Italy Assoelettrica and Energia Concorrente
YES We contacted Assoelettrica and Energia Concorrente to request for data. With Assoelettrica we did not manage to establish contact and Energeia Concorrente replied that they do not have this data. Therefore, EMAS reports were used to gather information on Italian power plants. Almost half of the plants could be covered with this. For the missing power plants, operators were contacted directly in order to obtain the information.
Assoelettrica and Energia Concorrente
NO No reaction on data validation request
National Environmental Agency (ISPRA) Ministry of Environment
NO Via ISPRA and the Ministry of Environment, several persons were contacted, but there was not a single department at either of the two organisations that could do the total validation. So far, we did not receive validation of our dataset.
Latvia Two organisations were contacted: - Latvian Association of Power Engineers and Energy Constructors (LEEA) - Latvian Ministry of Environmental Protection and Regional Development
NO We did contact two organisations, but we did not receive any reaction on our e-mails or telephone calls. We were not able to establish contact.
Data validation
based on statistical
data only.
Data validation
based on
statistical data
only.
Lithuania Nacionalinė Lietuvos Elektros Asociacija (NLEA)
YES Received data, but only on the cooling systems of the selected power plants. We did not receive the anonymous questionnaire with the actual cooling water figures. To complete this, NLEA needs information directly from the operators, who did not want to allocate (more) time to the questionnaire. As there is too little data available on cooling provisions in the IPPC permits, we did not receive the anonymous list.
Data validation
based on statistical
data only.
Data validation
based on
statistical data
only.

CESNL13784 End Report 181
Organisation Data gathering - POWER sector Data validation power sector - SECTOR ORGANISATION Data validation country level - WATER AUTHORITY
Luxembourg Two organisations were contacted: - Organisation des Entreprises d’Electricité du Luxembourg - GDF-Suez
NO We have contacted both Organisation des Entreprises d’Electricité du Luxembourg and GDF-Suez, but we did not manage to establish contact with either one of these organisations
Data validation
based on statistical
data only.
Data validation
based on
statistical data
only.
Malta ENEMALTA Corporation
YES From Enemalta we received cooling water data on all Maltese power plants
Data validation
based on statistical
data only.
Malta Resource Authority
NO No reaction on data validation request
Poland Polish Association of Power Plants
YES From Polish Associations of Power Plants we received cooling water data on water use of more than 50% of the Polish power plants and CHP plants, which represents nearly 80% of total installed electric capacity plants in questionnaire. Plants which did not submit data are generally CHP plants with relatively small water intake.
Polish Association of Power Plants TPGE National Statistics Office
YES We received feedback from TPGE and the Polish National Statistics Office. TPGE provided actual cooling water data for some of the power plants. This data was included in the database. Based on the data from the National Statistics Office, we could verify whether our estimations on water use of the Polish power sector were actually close to or within the estimated range. It turned out that we underestimated the water use; our HIGH value was 15-20% lower than the value reported in statistics. This can partly be explained by the fact that for our study we made a selection, while the statistics include all Polish power plants.
Krajowy Zarzad Gospodarki Wodnej (KZGW) National Statistics Office
YES Power
We underestimated the water intake and discharge by 15-20%. Refineries The value from the statistical office is within range, but this is because the HIGH limit is very high. Chemical The value from the statistics office exceeds the upper limit of our estimations with 35%. Iron and Steel
The values of water use from the statistics office are within range of our estimations.
Portugal EDP Portugal YES From EDP Portugal we received cooling water data of almost all Portuguese power plants.
EDP Portugal YES Based on the results, we received some additional information
Ambiente Portugal
NO No reaction on data validation request
Romania Romanian Energy Association Ministry of Agriculture Ministry of Environment Hydrological Metereological Institute
YES The Romanian energy association was contacted, but was not willing to help on data gathering for Romanian power plants. Secondly, the ministry was approached to request data on cooling water use in the power sector, but it turned out that they do not have this data. Therefore, we made a selection of the largest Romanian power producers and approached them individually.
Data validation
based on statistical
data only.
Data validation
based on
statistical data
only.
Slovakia Slovak Hydro Metereological Institute (SHNU)
YES We received data on several Slovakian power plants
Data validation
based on statistical
data only.
Slovak Hydrometeorology Institute (SHNU)
YES We received detailed information on the water use of a Slovakian steel plant and refinery.
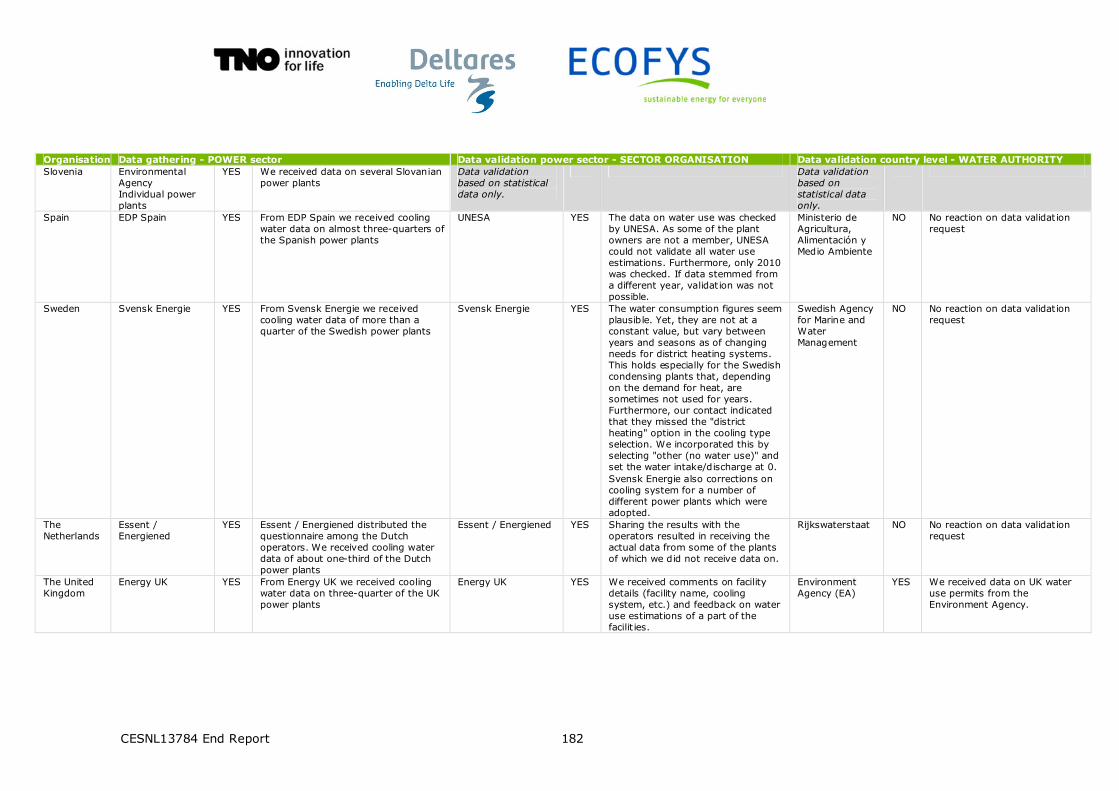
CESNL13784 End Report 182
Organisation Data gathering - POWER sector Data validation power sector - SECTOR ORGANISATION Data validation country level - WATER AUTHORITY
Slovenia Environmental Agency Individual power plants
YES We received data on several Slovanian power plants
Data validation
based on statistical
data only.
Data validation
based on
statistical data
only.
Spain EDP Spain YES From EDP Spain we received cooling water data on almost three-quarters of the Spanish power plants
UNESA YES The data on water use was checked by UNESA. As some of the plant owners are not a member, UNESA could not validate all water use estimations. Furthermore, only 2010 was checked. If data stemmed from a different year, validation was not possible.
Ministerio de Agricultura, Alimentación y Medio Ambiente
NO No reaction on data validation request
Sweden Svensk Energie YES From Svensk Energie we received cooling water data of more than a quarter of the Swedish power plants
Svensk Energie YES The water consumption figures seem plausible. Yet, they are not at a constant value, but vary between years and seasons as of changing needs for district heating systems. This holds especially for the Swedish condensing plants that, depending on the demand for heat, are sometimes not used for years. Furthermore, our contact indicated that they missed the "district heating" option in the cooling type selection. We incorporated this by selecting "other (no water use)" and set the water intake/discharge at 0. Svensk Energie also corrections on cooling system for a number of different power plants which were adopted.
Swedish Agency for Marine and Water Management
NO No reaction on data validation request
The Netherlands
Essent / Energiened
YES Essent / Energiened distributed the questionnaire among the Dutch operators. We received cooling water data of about one-third of the Dutch power plants
Essent / Energiened YES Sharing the results with the operators resulted in receiving the actual data from some of the plants of which we did not receive data on.
Rijkswaterstaat NO No reaction on data validation request
The United Kingdom
Energy UK YES From Energy UK we received cooling water data on three-quarter of the UK power plants
Energy UK YES We received comments on facility details (facility name, cooling system, etc.) and feedback on water use estimations of a part of the facilit ies.
Environment Agency (EA)
YES We received data on UK water use permits from the Environment Agency.

CESNL13784 End Report 183
Intentionally blank.

ECOFYS Netherlands B.V. | Kanaalweg 15G | 3526 KL Utrecht| T +31 (0)30 662-3300 | F +31 (0)30 662-3301 | E [email protected] | I www.ecofys.com
Intentionally blank.

ECOFYS Netherlands B.V.
Kanaalweg 15G
3526 KL Utrecht
T: +31 (0) 30 662-3300
F: +31 (0) 30 662-3301
I: www.ecofys.com
Recommended