Category Report
BusinessIntelligence
NUMBER OF REVIEWS
696NUMBER OF VENDORSEVALUATED
13REPORT GENERATED
March 2018
BOARD
Dundas BI
SAS BI
Tableau
TIBCO Business Intelligence
Oracle BI Solutions
SAP BI
IBM Cognos Platform
Qlik
MicroStrategy BI
Microsoft BI
WebFOCUS
Zoho Reports
Business Intelligence Category Report
Table ofContents
Software Directory.........................................................................................................7
Category Overview ......................................................................................................3
Emotional Footprint................................................................................................. ...5
How to Use the ReportInfo-Tech’s Category Reports provide a comprehensive evaluation of popular products in theBusiness Intelligence market. This buyer’s guide is designed to help prospective purchasers makebetter decisions by leveraging the experiences of real users.
The data in this report is collected from real end users, meticulously verified for veracity,exhaustively analyzed, and visualized in easy to understand charts and graphs. Each product iscompared and contrasted with all other vendors in their category to create a holistic, unbiased viewof the product landscape.
Use this report to determine which product is right for your organization. For highly detailed reportson individual products, see Info-Tech’s Product Scorecard.
2
Business Intelligence Category Report
CategoryOverview
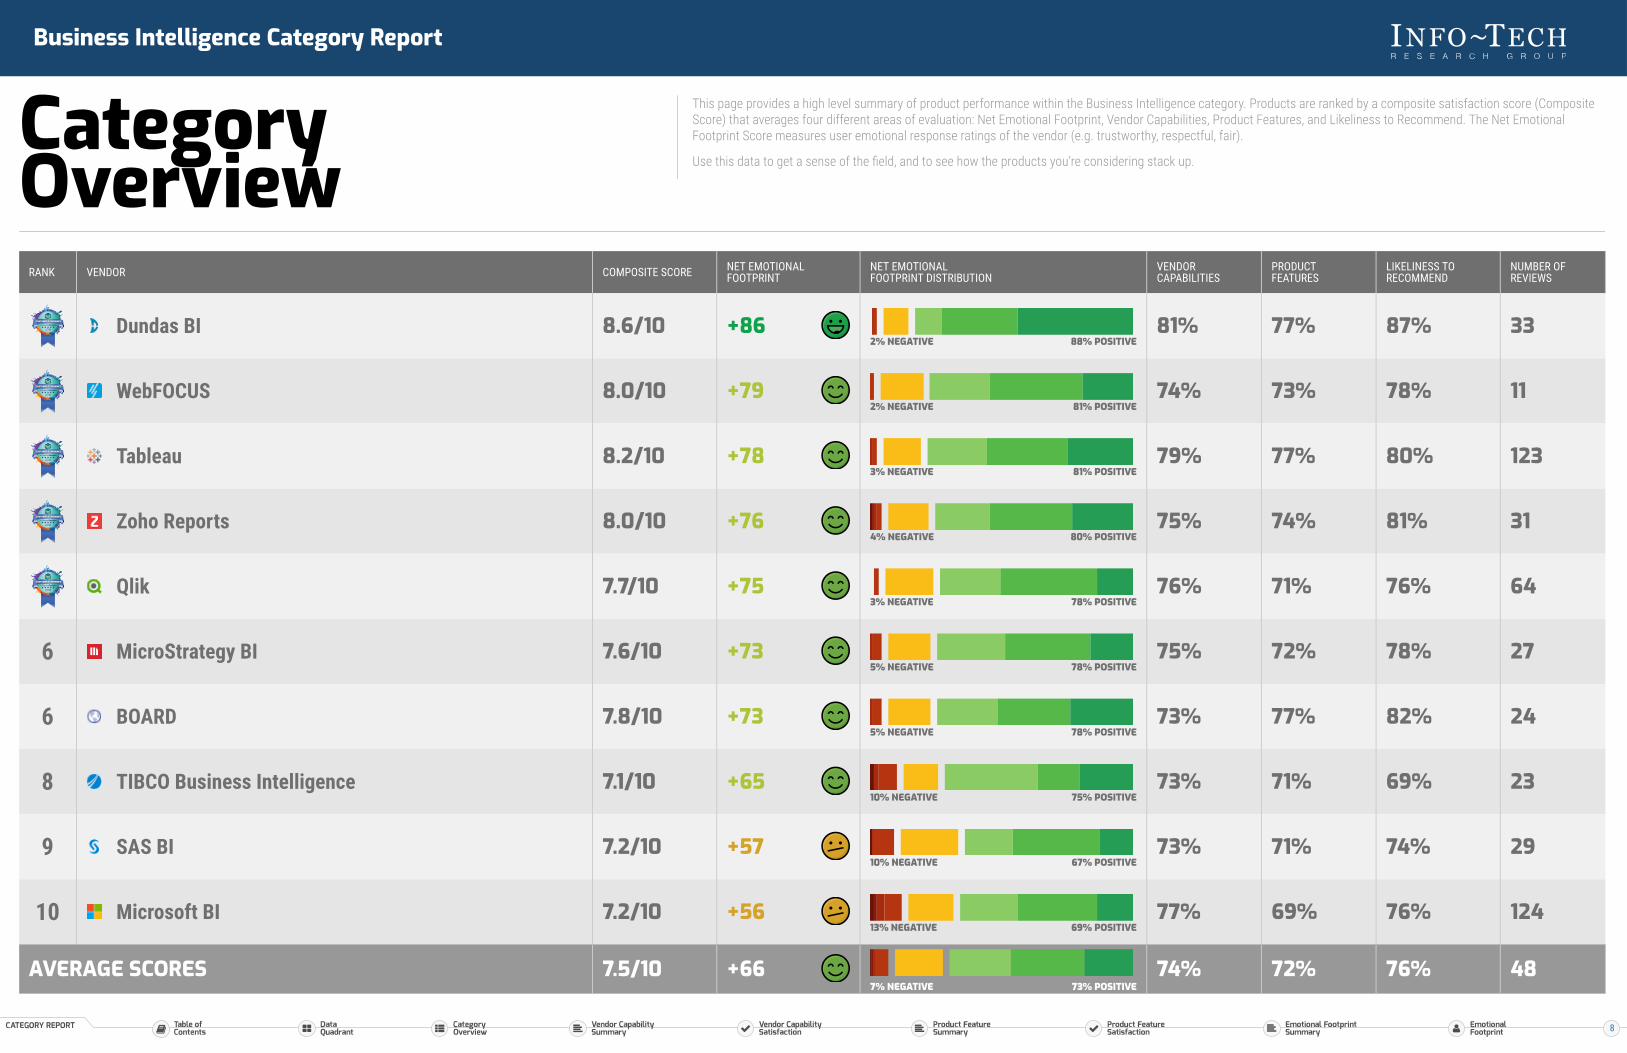
This page provides a high level summary of product performance within the Business Intelligence category. Products are ranked by a composite satisfaction score (CompositeScore) that averages four different areas of evaluation: Net Emotional Footprint, Vendor Capabilities, Product Features, and Likeliness to Recommend. The Net EmotionalFootprint Score measures user emotional response ratings of the vendor (e.g. trustworthy, respectful, fair).
Use this data to get a sense of the field, and to see how the products you’re considering stack up.
RANK VENDOR COMPOSITE SCORE NET EMOTIONALFOOTPRINT
NET EMOTIONALFOOTPRINT DISTRIBUTION
VENDORCAPABILITIES
PRODUCTFEATURES
LIKELINESS TORECOMMEND
NUMBER OFREVIEWS
2018 Dundas BI 8.6/10 +862% NEGATIVE 88% POSITIVE
81% 77% 87% 33
2018 WebFOCUS 8.0/10 +792% NEGATIVE 81% POSITIVE
74% 73% 78% 11
2018 Tableau 8.2/10 +783% NEGATIVE 81% POSITIVE
79% 77% 80% 123
2018 Zoho Reports 8.0/10 +764% NEGATIVE 80% POSITIVE
75% 74% 81% 31
2018 Qlik 7.7/10 +753% NEGATIVE 78% POSITIVE
76% 71% 76% 64
6 MicroStrategy BI 7.6/10 +735% NEGATIVE 78% POSITIVE
75% 72% 78% 27
6 BOARD 7.8/10 +735% NEGATIVE 78% POSITIVE
73% 77% 82% 24
8 TIBCO Business Intelligence 7.1/10 +6510% NEGATIVE 75% POSITIVE
73% 71% 69% 23
9 SAS BI 7.2/10 +5710% NEGATIVE 67% POSITIVE
73% 71% 74% 29
10 Microsoft BI 7.2/10 +5613% NEGATIVE 69% POSITIVE
77% 69% 76% 124
AVERAGE SCORES 7.5/10 +667% NEGATIVE 73% POSITIVE
74% 72% 76% 48
8
Business Intelligence Category Report
CategoryOverview
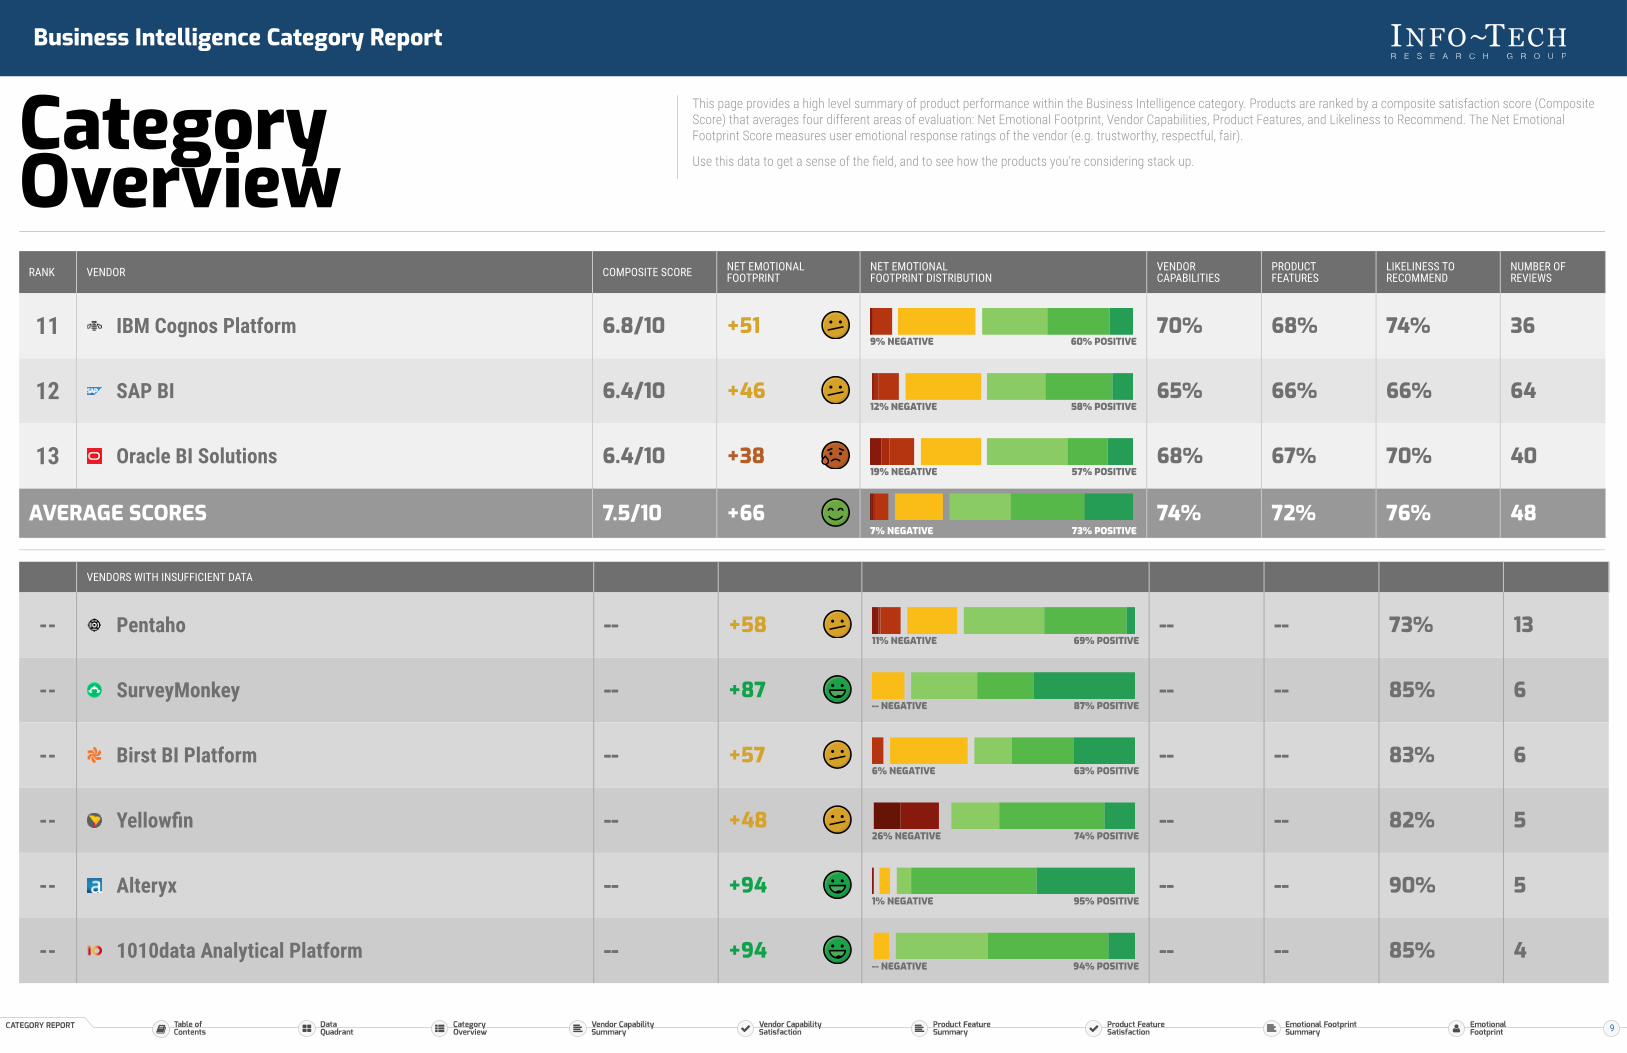
This page provides a high level summary of product performance within the Business Intelligence category. Products are ranked by a composite satisfaction score (CompositeScore) that averages four different areas of evaluation: Net Emotional Footprint, Vendor Capabilities, Product Features, and Likeliness to Recommend. The Net EmotionalFootprint Score measures user emotional response ratings of the vendor (e.g. trustworthy, respectful, fair).
Use this data to get a sense of the field, and to see how the products you’re considering stack up.
RANK VENDOR COMPOSITE SCORE NET EMOTIONALFOOTPRINT
NET EMOTIONALFOOTPRINT DISTRIBUTION
VENDORCAPABILITIES
PRODUCTFEATURES
LIKELINESS TORECOMMEND
NUMBER OFREVIEWS
11 IBM Cognos Platform 6.8/10 +519% NEGATIVE 60% POSITIVE
70% 68% 74% 36
12 SAP BI 6.4/10 +4612% NEGATIVE 58% POSITIVE
65% 66% 66% 64
13 Oracle BI Solutions 6.4/10 +3819% NEGATIVE 57% POSITIVE
68% 67% 70% 40
AVERAGE SCORES 7.5/10 +667% NEGATIVE 73% POSITIVE
74% 72% 76% 48
VENDORS WITH INSUFFICIENT DATA
-- Pentaho -- +5811% NEGATIVE 69% POSITIVE
-- -- 73% 13
-- SurveyMonkey -- +87-- NEGATIVE 87% POSITIVE
-- -- 85% 6
-- Birst BI Platform -- +576% NEGATIVE 63% POSITIVE
-- -- 83% 6
-- Yellowfin -- +4826% NEGATIVE 74% POSITIVE
-- -- 82% 5
-- Alteryx -- +941% NEGATIVE 95% POSITIVE
-- -- 90% 5
-- 1010data Analytical Platform -- +94-- NEGATIVE 94% POSITIVE
-- -- 85% 4
9
Business Intelligence Category Report
EmotionalFootprintSummary
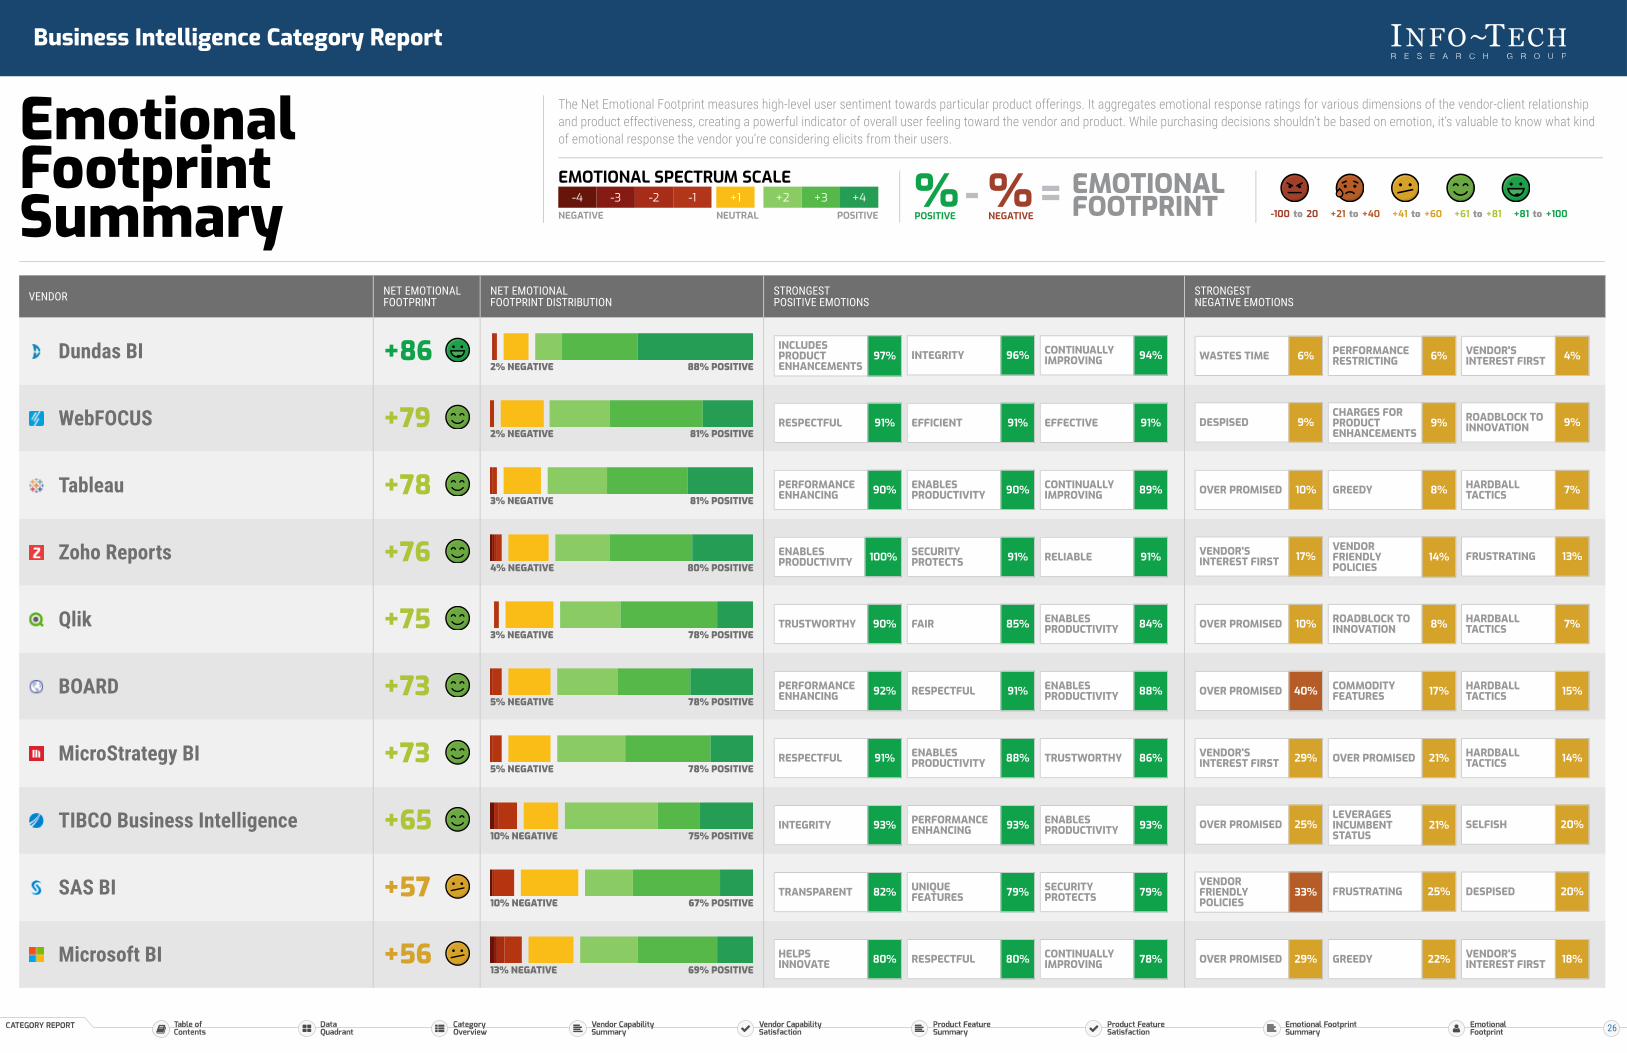
The Net Emotional Footprint measures high-level user sentiment towards particular product offerings. It aggregates emotional response ratings for various dimensions of the vendor-client relationshipand product effectiveness, creating a powerful indicator of overall user feeling toward the vendor and product. While purchasing decisions shouldn’t be based on emotion, it’s valuable to know what kindof emotional response the vendor you’re considering elicits from their users.
-4 -3 -2 -1NEGATIVE
+1NEUTRAL
+2 +3 +4POSITIVE
EMOTIONAL SPECTRUM SCALE %POSITIVE
%NEGATIVE
EMOTIONALFOOTPRINT- =
-100 to 20 +21 to +40 +41 to +60 +61 to +81 +81 to +100
INCLUDESPRODUCTENHANCEMENTS
97% INTEGRITY 96% CONTINUALLYIMPROVING 94% WASTES TIME 6% PERFORMANCE
RESTRICTING 6% VENDOR'SINTEREST FIRST 4%
RESPECTFUL 91% EFFICIENT 91% EFFECTIVE 91% DESPISED 9%CHARGES FORPRODUCTENHANCEMENTS
9% ROADBLOCK TOINNOVATION 9%
PERFORMANCEENHANCING 90% ENABLES
PRODUCTIVITY 90% CONTINUALLYIMPROVING 89% OVER PROMISED 10% GREEDY 8% HARDBALL
TACTICS 7%
ENABLESPRODUCTIVITY 100% SECURITY
PROTECTS 91% RELIABLE 91% VENDOR'SINTEREST FIRST 17%
VENDORFRIENDLYPOLICIES
14% FRUSTRATING 13%
TRUSTWORTHY 90% FAIR 85% ENABLESPRODUCTIVITY 84% OVER PROMISED 10% ROADBLOCK TO
INNOVATION 8% HARDBALLTACTICS 7%
PERFORMANCEENHANCING 92% RESPECTFUL 91% ENABLES
PRODUCTIVITY 88% OVER PROMISED 40% COMMODITYFEATURES 17% HARDBALL
TACTICS 15%
RESPECTFUL 91% ENABLESPRODUCTIVITY 88% TRUSTWORTHY 86% VENDOR'S
INTEREST FIRST 29% OVER PROMISED 21% HARDBALLTACTICS 14%
INTEGRITY 93% PERFORMANCEENHANCING 93% ENABLES
PRODUCTIVITY 93% OVER PROMISED 25%LEVERAGESINCUMBENTSTATUS
21% SELFISH 20%
TRANSPARENT 82% UNIQUEFEATURES 79% SECURITY
PROTECTS 79%VENDORFRIENDLYPOLICIES
33% FRUSTRATING 25% DESPISED 20%
HELPSINNOVATE 80% RESPECTFUL 80% CONTINUALLY
IMPROVING 78% OVER PROMISED 29% GREEDY 22% VENDOR'SINTEREST FIRST 18%
VENDOR NET EMOTIONALFOOTPRINT
NET EMOTIONALFOOTPRINT DISTRIBUTION
STRONGESTPOSITIVE EMOTIONS
STRONGESTNEGATIVE EMOTIONS
Dundas BI +862% NEGATIVE 88% POSITIVE
WebFOCUS +792% NEGATIVE 81% POSITIVE
Tableau +783% NEGATIVE 81% POSITIVE
Zoho Reports +764% NEGATIVE 80% POSITIVE
Qlik +753% NEGATIVE 78% POSITIVE
BOARD +735% NEGATIVE 78% POSITIVE
MicroStrategy BI +735% NEGATIVE 78% POSITIVE
TIBCO Business Intelligence +6510% NEGATIVE 75% POSITIVE
SAS BI +5710% NEGATIVE 67% POSITIVE
Microsoft BI +5613% NEGATIVE 69% POSITIVE
26
Business Intelligence Category Report
EmotionalFootprintSummary
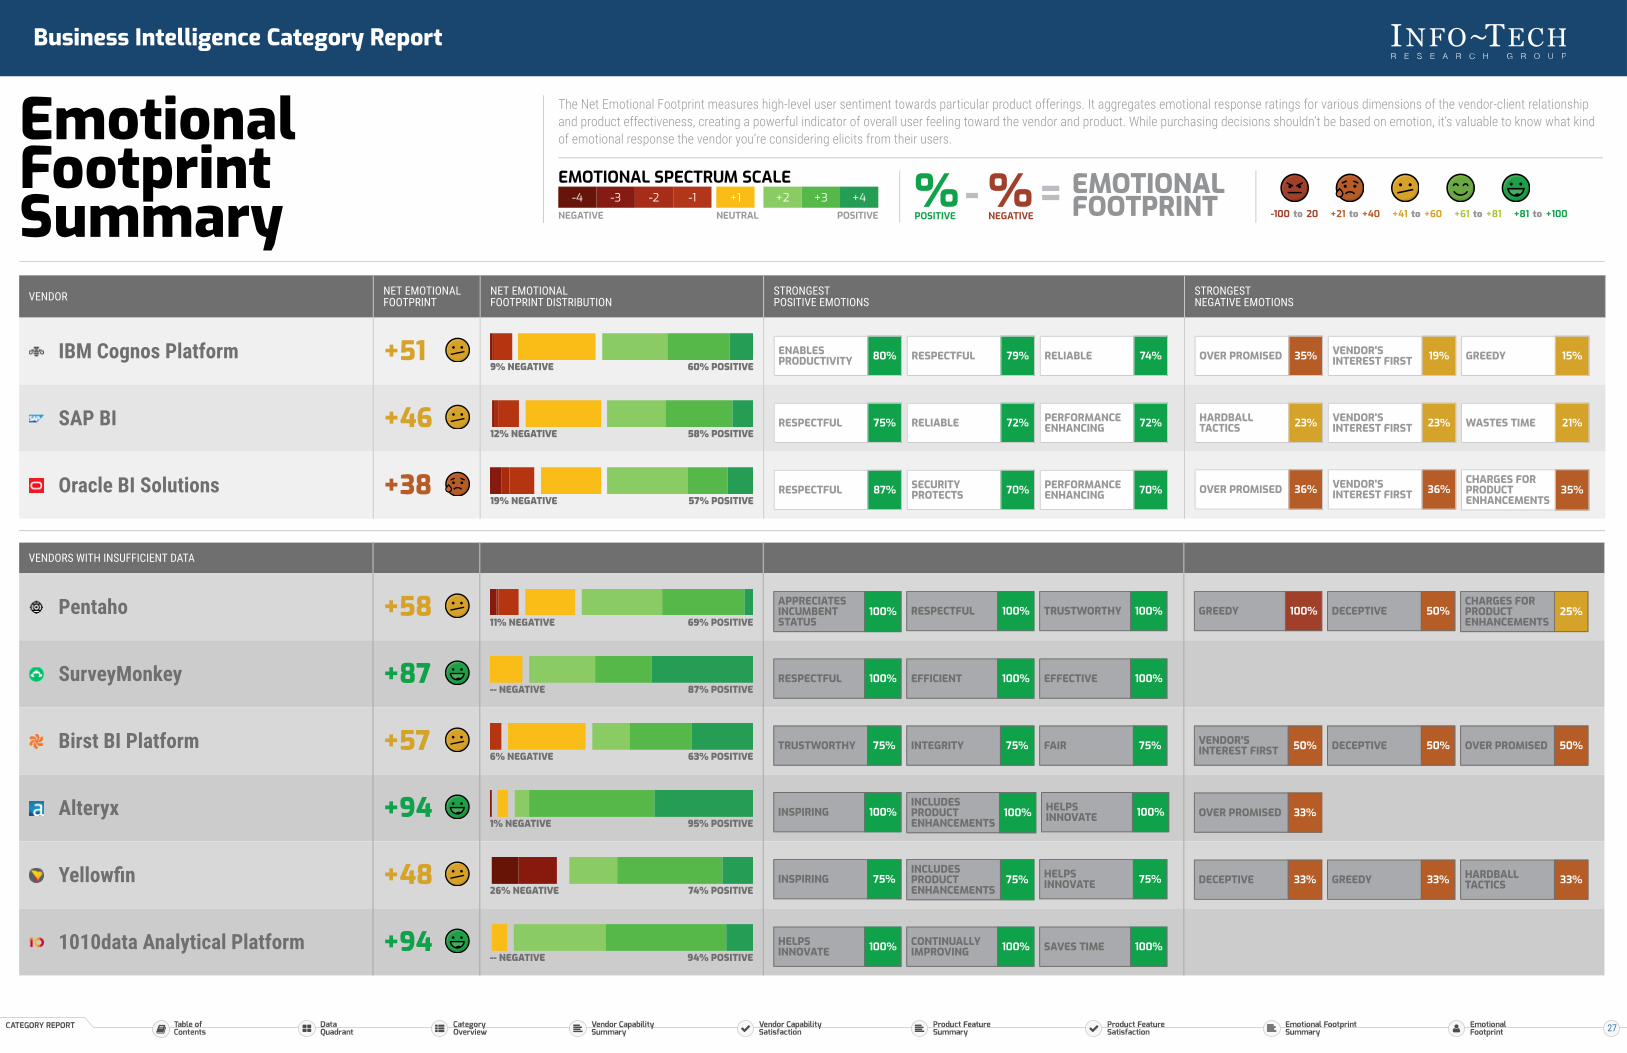
The Net Emotional Footprint measures high-level user sentiment towards particular product offerings. It aggregates emotional response ratings for various dimensions of the vendor-client relationshipand product effectiveness, creating a powerful indicator of overall user feeling toward the vendor and product. While purchasing decisions shouldn’t be based on emotion, it’s valuable to know what kindof emotional response the vendor you’re considering elicits from their users.
-4 -3 -2 -1NEGATIVE
+1NEUTRAL
+2 +3 +4POSITIVE
EMOTIONAL SPECTRUM SCALE %POSITIVE
%NEGATIVE
EMOTIONALFOOTPRINT- =
-100 to 20 +21 to +40 +41 to +60 +61 to +81 +81 to +100
ENABLESPRODUCTIVITY 80% RESPECTFUL 79% RELIABLE 74% OVER PROMISED 35% VENDOR'S
INTEREST FIRST 19% GREEDY 15%
RESPECTFUL 75% RELIABLE 72% PERFORMANCEENHANCING 72% HARDBALL
TACTICS 23% VENDOR'SINTEREST FIRST 23% WASTES TIME 21%
RESPECTFUL 87% SECURITYPROTECTS 70% PERFORMANCE
ENHANCING 70% OVER PROMISED 36% VENDOR'SINTEREST FIRST 36%
CHARGES FORPRODUCTENHANCEMENTS
35%
VENDOR NET EMOTIONALFOOTPRINT
NET EMOTIONALFOOTPRINT DISTRIBUTION
STRONGESTPOSITIVE EMOTIONS
STRONGESTNEGATIVE EMOTIONS
IBM Cognos Platform +519% NEGATIVE 60% POSITIVE
SAP BI +4612% NEGATIVE 58% POSITIVE
Oracle BI Solutions +3819% NEGATIVE 57% POSITIVE
APPRECIATESINCUMBENTSTATUS
100% RESPECTFUL 100% TRUSTWORTHY 100% GREEDY 100% DECEPTIVE 50%CHARGES FORPRODUCTENHANCEMENTS
25%
RESPECTFUL 100% EFFICIENT 100% EFFECTIVE 100%
TRUSTWORTHY 75% INTEGRITY 75% FAIR 75% VENDOR'SINTEREST FIRST 50% DECEPTIVE 50% OVER PROMISED 50%
INSPIRING 100%INCLUDESPRODUCTENHANCEMENTS
100% HELPSINNOVATE 100% OVER PROMISED 33%
INSPIRING 75%INCLUDESPRODUCTENHANCEMENTS
75% HELPSINNOVATE 75% DECEPTIVE 33% GREEDY 33% HARDBALL
TACTICS 33%
HELPSINNOVATE 100% CONTINUALLY
IMPROVING 100% SAVES TIME 100%
VENDORS WITH INSUFFICIENT DATA
Pentaho +5811% NEGATIVE 69% POSITIVE
SurveyMonkey +87-- NEGATIVE 87% POSITIVE
Birst BI Platform +576% NEGATIVE 63% POSITIVE
Alteryx +941% NEGATIVE 95% POSITIVE
Yellowfin +4826% NEGATIVE 74% POSITIVE
1010data Analytical Platform +94-- NEGATIVE 94% POSITIVE
27
Category Report
SoftwareDirectoryBUSINESS INTELLIGENCESOFTWARE
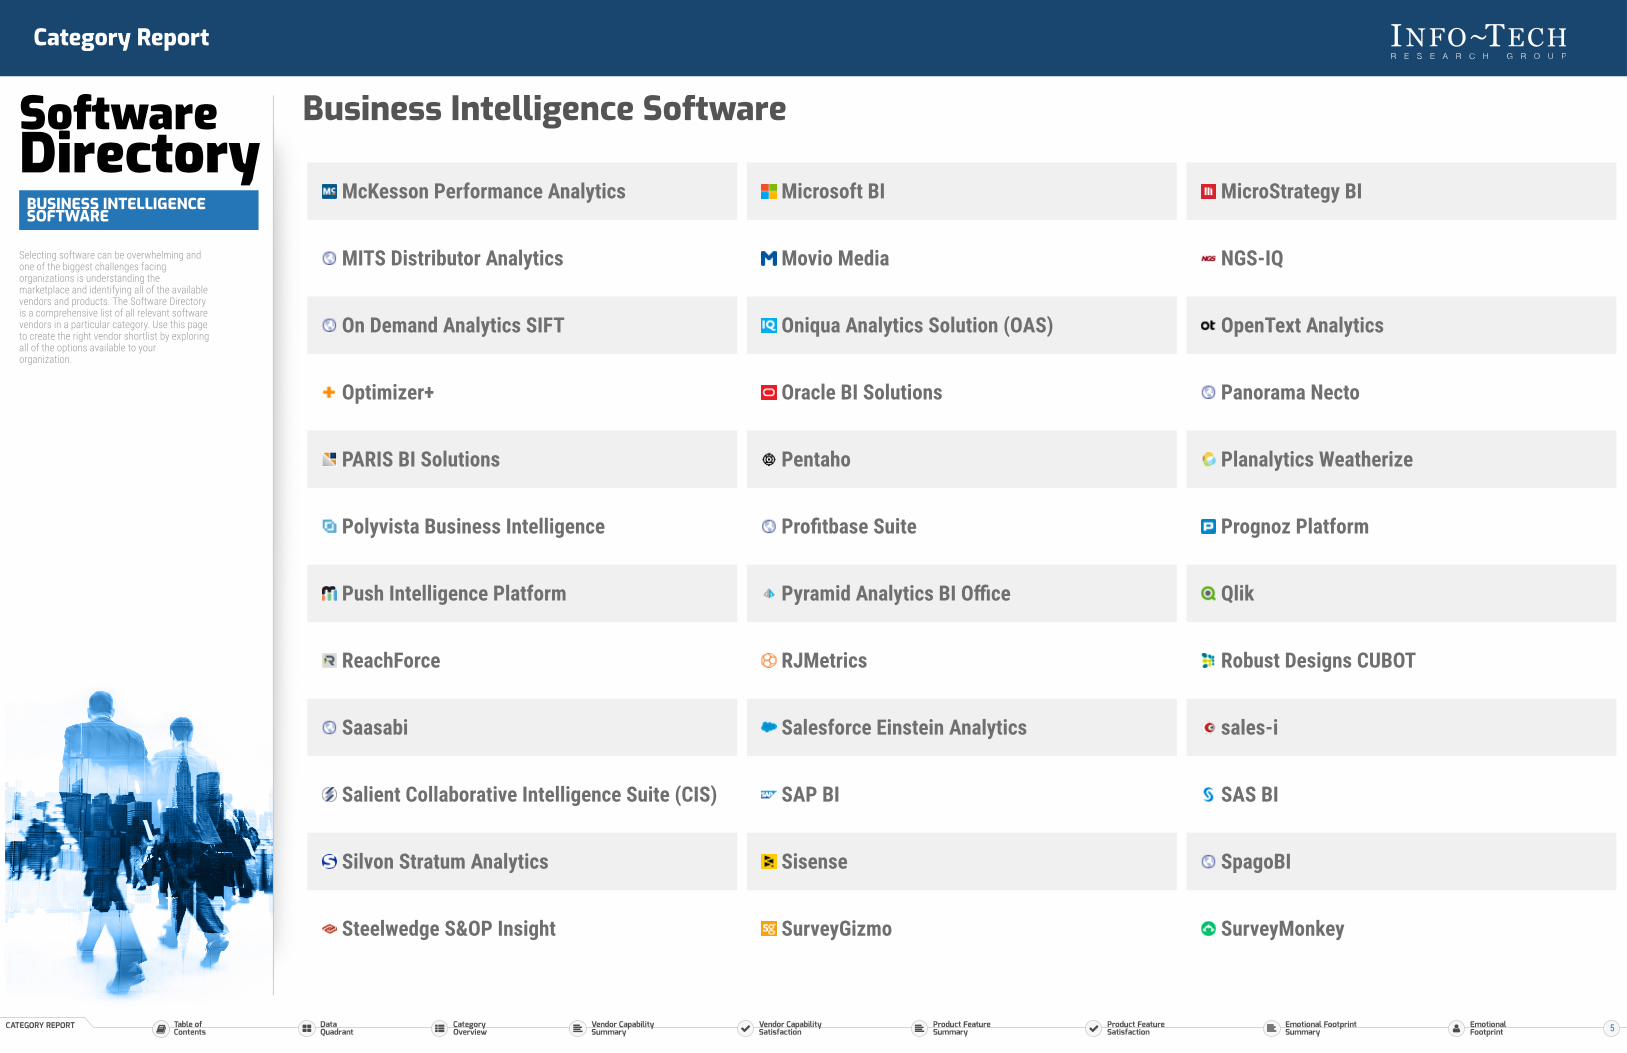
Selecting software can be overwhelming andone of the biggest challenges facingorganizations is understanding themarketplace and identifying all of the availablevendors and products. The Software Directoryis a comprehensive list of all relevant softwarevendors in a particular category. Use this pageto create the right vendor shortlist by exploringall of the options available to yourorganization.
Business Intelligence Software
1010data Analytical Platform 5000fish Inc Yurbi Acorn Performance Analyzer
ActivePivot In-Memory Analytical Platform Adaptive Insights Adaptive Suite Algorithmic Digital Solutions
Alteryx APOS Arcadia Data
Arcplan Enterprise Ascend BI Asset Answers
Attunity Visibility (formerly Appfluent) Balanced Insight Birst BI Platform
BIspoke Bissantz DeltaMaster Bitam Artus
BMC TrueSight BOARD CALUMO
CAMMS Power Data Centrifuge Analytics Coldwater Technology B-Metrics
Collectivei Column Technologies BI comScore Digital Analytix Enterprise
Corvil Cubeware C8 Platform Datapine
Decision Management Suite Dell BI Deltek wInsight Analytics
Domo Dundas BI Dunnhumby PriceStrat
3
Category Report
SoftwareDirectoryBUSINESS INTELLIGENCESOFTWARE
Selecting software can be overwhelming andone of the biggest challenges facingorganizations is understanding themarketplace and identifying all of the availablevendors and products. The Software Directoryis a comprehensive list of all relevant softwarevendors in a particular category. Use this pageto create the right vendor shortlist by exploringall of the options available to yourorganization.
Business Intelligence Software
ElegantJ BI Eloqua Insight Encore Prophix
Enertia Entrinsik Informer E-WorkBook
ExtraHop Platform Factual Enterprise Fulcrum Analytics
Geckoboard GoodData Heap Analytics
Host Analytics EPM suite HP Business Intelligence Solutions IBM Advanced Analytics
IBM Cognos Platform IBM i2 Analyst's Notebook IBM Watson Analytics
InetSoft Style Intelligence Infonea Inovalon INDICES
IronRock Solutions Jack Henry Business Intelligence & FinancialPerformance JDA Business Intelligence
Jedox Jinfonet Software JReport KNIME Analytics Platform
KnowledgeTree Lavastorm Leadspace
Logi Analytics Looker BI Lumina Analytica
Magnitude BI Solutions MammothDB Master Merchant System Overture
4
Category Report
SoftwareDirectoryBUSINESS INTELLIGENCESOFTWARE
Selecting software can be overwhelming andone of the biggest challenges facingorganizations is understanding themarketplace and identifying all of the availablevendors and products. The Software Directoryis a comprehensive list of all relevant softwarevendors in a particular category. Use this pageto create the right vendor shortlist by exploringall of the options available to yourorganization.
Business Intelligence Software
McKesson Performance Analytics Microsoft BI MicroStrategy BI
MITS Distributor Analytics Movio Media NGS-IQ
On Demand Analytics SIFT Oniqua Analytics Solution (OAS) OpenText Analytics
Optimizer+ Oracle BI Solutions Panorama Necto
PARIS BI Solutions Pentaho Planalytics Weatherize
Polyvista Business Intelligence Profitbase Suite Prognoz Platform
Push Intelligence Platform Pyramid Analytics BI Office Qlik
ReachForce RJMetrics Robust Designs CUBOT
Saasabi Salesforce Einstein Analytics sales-i
Salient Collaborative Intelligence Suite (CIS) SAP BI SAS BI
Silvon Stratum Analytics Sisense SpagoBI
Steelwedge S&OP Insight SurveyGizmo SurveyMonkey
5
Category Report
SoftwareDirectoryBUSINESS INTELLIGENCESOFTWARE
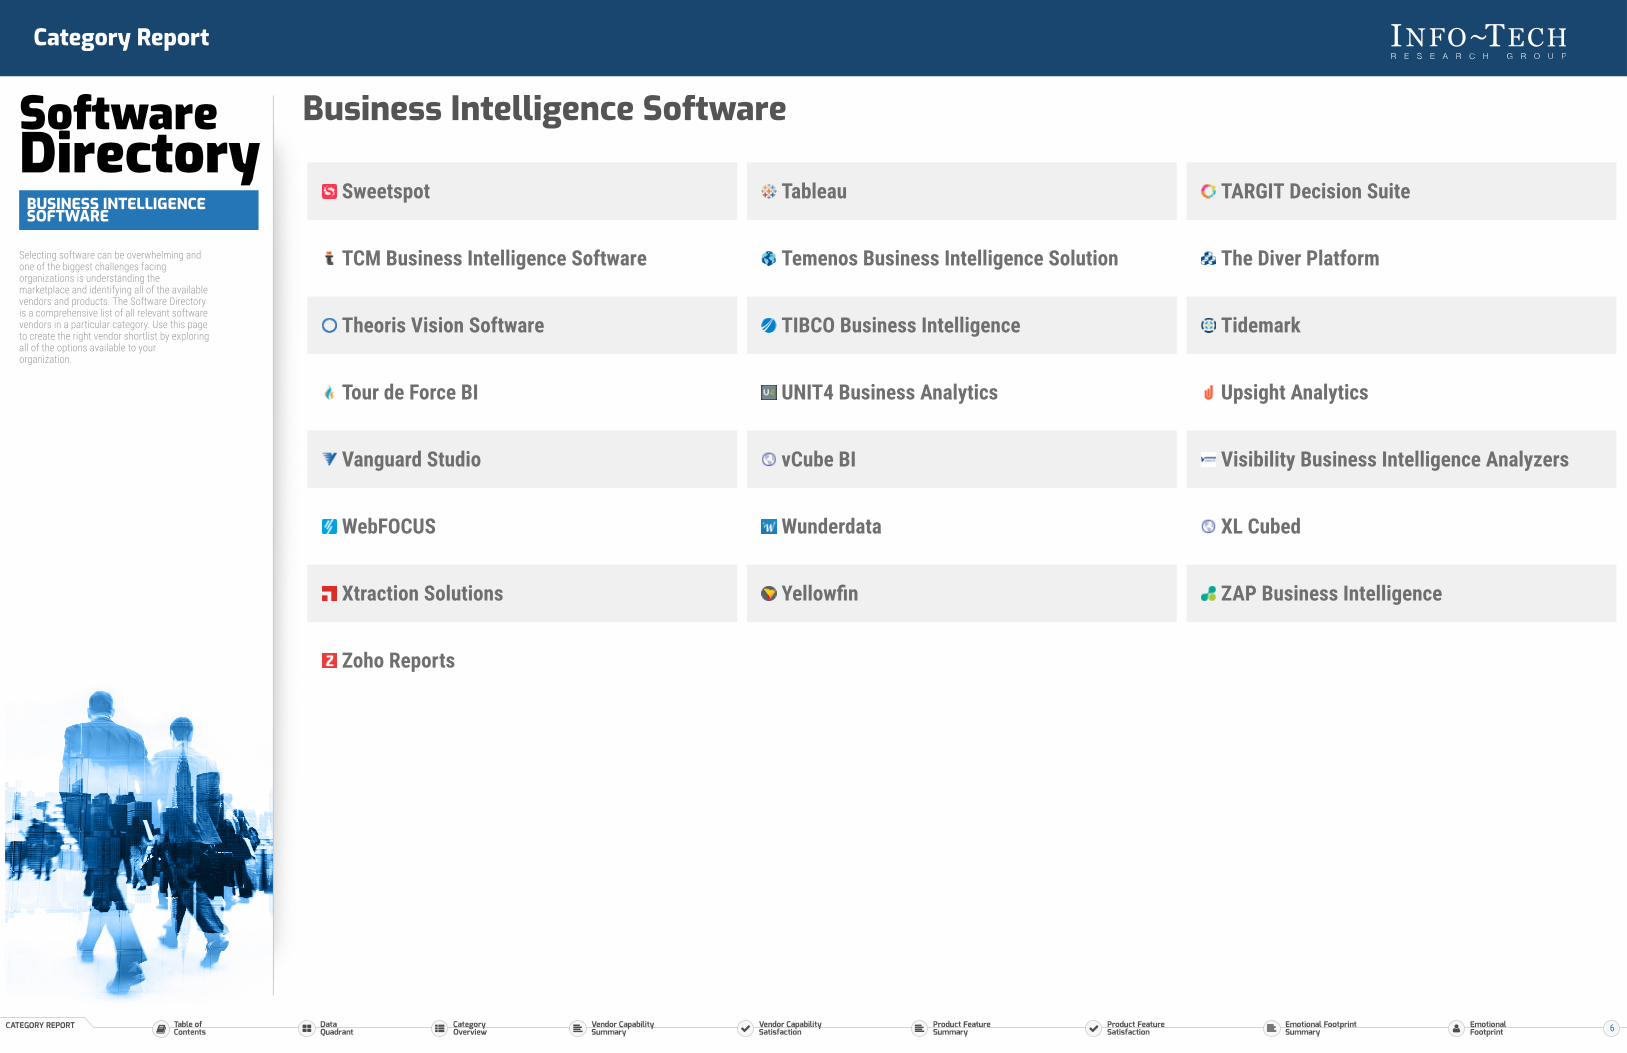
Selecting software can be overwhelming andone of the biggest challenges facingorganizations is understanding themarketplace and identifying all of the availablevendors and products. The Software Directoryis a comprehensive list of all relevant softwarevendors in a particular category. Use this pageto create the right vendor shortlist by exploringall of the options available to yourorganization.
Business Intelligence Software
Sweetspot Tableau TARGIT Decision Suite
TCM Business Intelligence Software Temenos Business Intelligence Solution The Diver Platform
Theoris Vision Software TIBCO Business Intelligence Tidemark
Tour de Force BI UNIT4 Business Analytics Upsight Analytics
Vanguard Studio vCube BI Visibility Business Intelligence Analyzers
WebFOCUS Wunderdata XL Cubed
Xtraction Solutions Yellowfin ZAP Business Intelligence
Zoho Reports
6
Recommended