0
CapitaLand & REITs Corporate Day, Bangkok
CapitaLand Malaysia Mall Trust
Corporate Presentation
17 August 2018
1 CapitaLand & REITs Corporate Day, Bangkok
DisclaimerThese materials may contain forward-looking statements that involve assumptions, risks and uncertainties. Actual
future performance, outcomes and results may differ materially from those expressed in forward-looking statements
as a result of a number of risks, uncertainties and assumptions. Representative examples of these factors include
(without limitation) general industry and economic conditions, interest rate trends, cost of capital and capital
availability, competition from other developments, shifts in expected levels of property rental income, changes in
operating expenses, including reimbursable staff costs, benefits and training, property expenses and governmental
and public policy changes. You are cautioned not to place undue reliance on these forward-looking statements,
which are based on the current view of management on future events.
The information contained in these materials has not been independently verified. No representation or warranty
expressed or implied is made as to, and no reliance should be placed on, the fairness, accuracy, completeness or
correctness of the information or opinions contained in these materials. Neither CapitaLand Malaysia Mall REIT
Management Sdn. Bhd. (the “Manager”) or any of its affiliates, advisers or representatives shall have any liability
whatsoever (in negligence or otherwise) for any loss howsoever arising, whether directly, from any use, reliance or
distribution of these materials or its contents or otherwise arising in connection with these materials.
The past performance of CMMT is not indicative of the future performance of CMMT. Similarly, the past performance
of the Manager is not indicative of the future performance of the Manager.
The value of units in CMMT (“Units”) and the income derived from them may fall as well as rise. Units are not
obligations of, deposits in, or guaranteed by, the Manager or any of its affiliates. An investment in Units is subject to
investment risks, including the possible loss of the principal amount invested. It is intended that holders of Units may
only deal in their Units through trading on Bursa Securities. Listing of the Units on Bursa Securities does not guarantee a
liquid market for the Units.
These materials are for information only and does not constitute an invitation or offer to acquire, purchase or
subscribe for Units.
2 CapitaLand & REITs Corporate Day, Bangkok
Contents
● Introduction
● Key Highlights
● Portfolio Updates
● New Initiatives & Improvement Works
● Marcom, Sustainability & Awards
● Looking Forward
3 CapitaLand & REITs Corporate Day, Bangkok
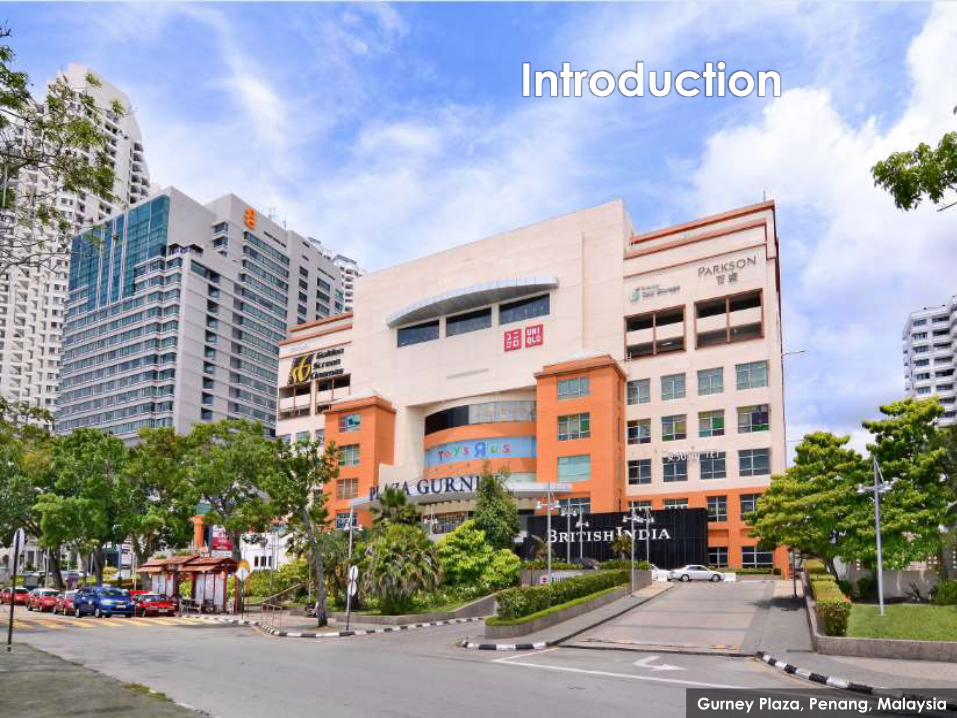
Introduction
Gurney Plaza, Penang, Malaysia
4 CapitaLand & REITs Corporate Day, Bangkok
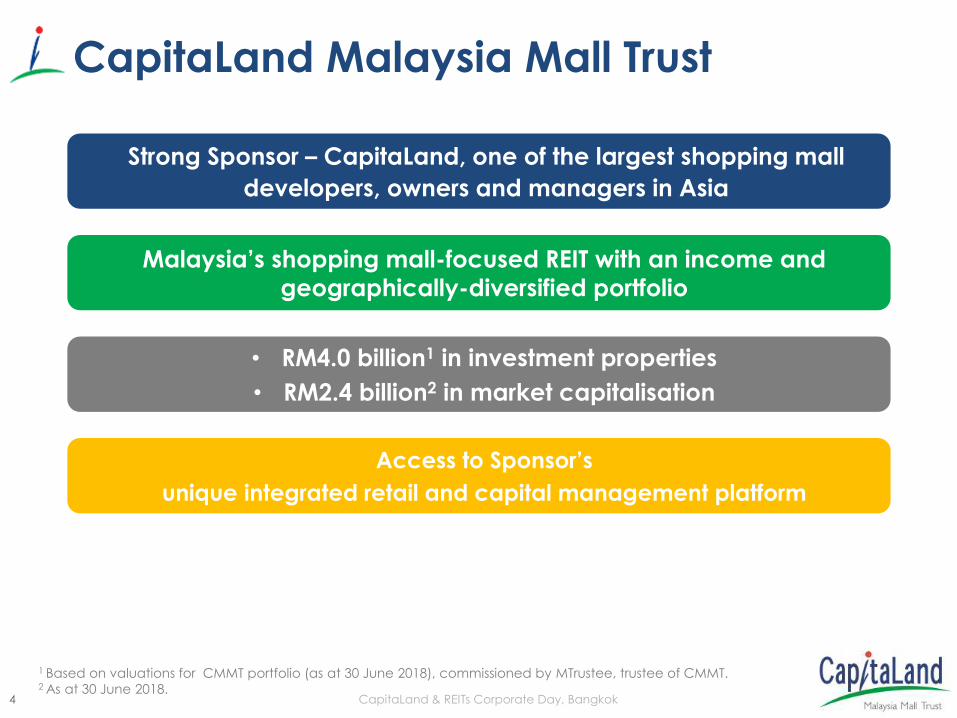
CapitaLand Malaysia Mall Trust
1 Based on valuations for CMMT portfolio (as at 30 June 2018), commissioned by MTrustee, trustee of CMMT.2 As at 30 June 2018.
Strong Sponsor – CapitaLand, one of the largest shopping mall
developers, owners and managers in Asia
Malaysia’s shopping mall-focused REIT with an income and
geographically-diversified portfolio
• RM4.0 billion1 in investment properties
• RM2.4 billion2 in market capitalisation
Access to Sponsor’s
unique integrated retail and capital management platform
5 CapitaLand & REITs Corporate Day, Bangkok
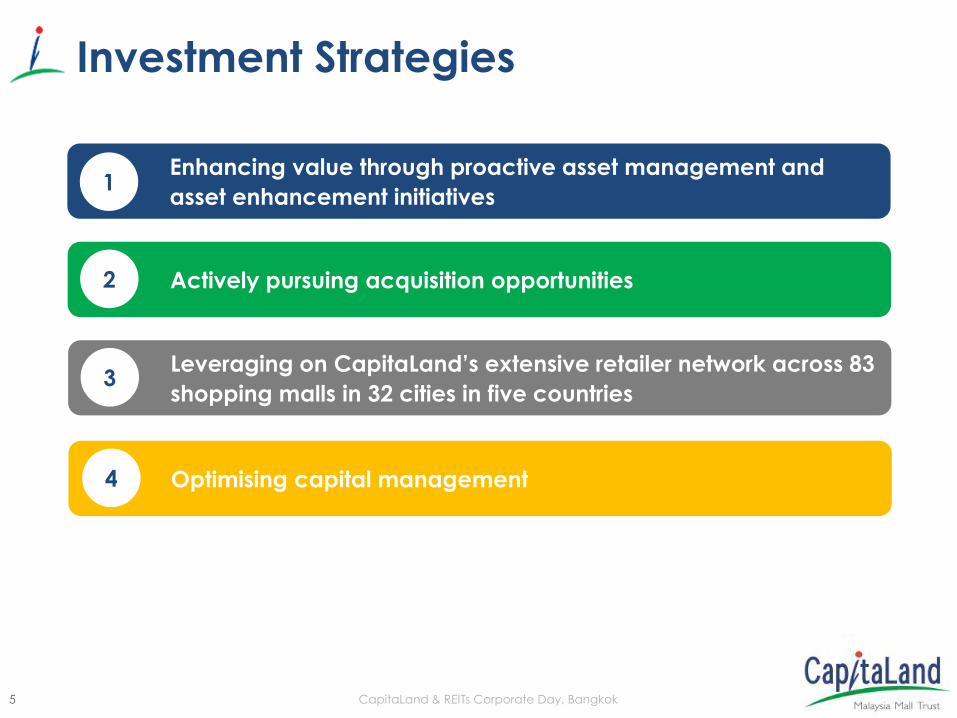
Enhancing value through proactive asset management and
asset enhancement initiatives
Actively pursuing acquisition opportunities
Leveraging on CapitaLand’s extensive retailer network across 83
shopping malls in 32 cities in five countries
1
2
3
Optimising capital management4
Investment Strategies
6 CapitaLand & REITs Corporate Day, Bangkok
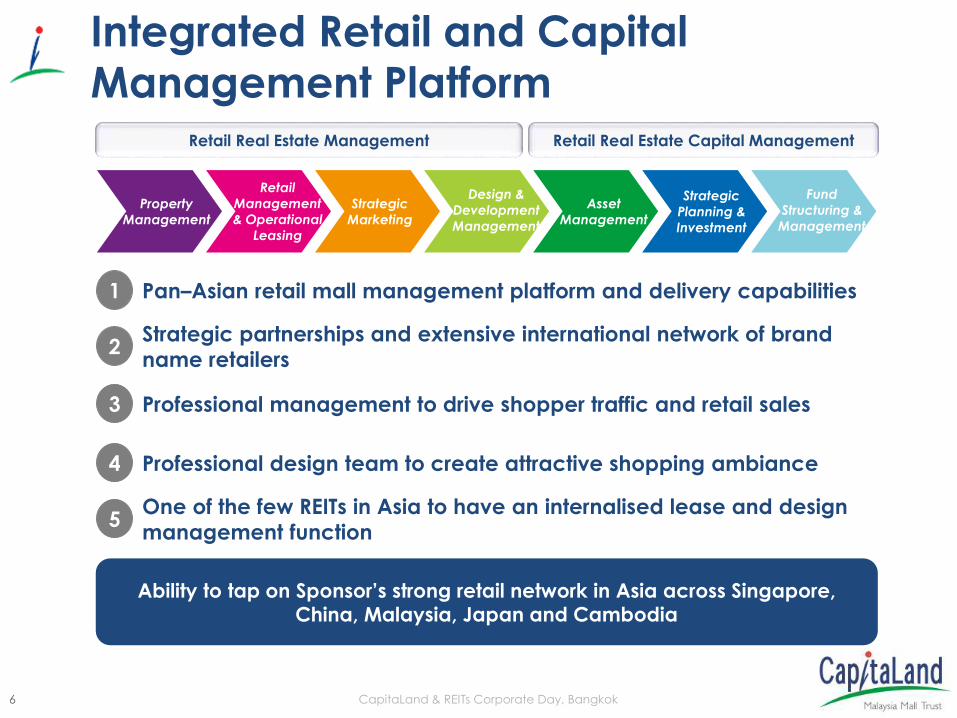
One of the few REITs in Asia to have an internalised lease and design
management function5
1 Pan–Asian retail mall management platform and delivery capabilities
Strategic partnerships and extensive international network of brand
name retailers2
Professional management to drive shopper traffic and retail sales3
Professional design team to create attractive shopping ambiance4
Property
Management
Retail
Management
& Operational
Leasing
Strategic
Marketing
Design &
Development
Management
Asset
Management
Strategic
Planning &
Investment
Fund
Structuring &
Management
Retail Real Estate Management Retail Real Estate Capital Management
Integrated Retail and Capital
Management Platform
Ability to tap on Sponsor’s strong retail network in Asia across Singapore, China, Malaysia, Japan and Cambodia
7 CapitaLand & REITs Corporate Day, Bangkok
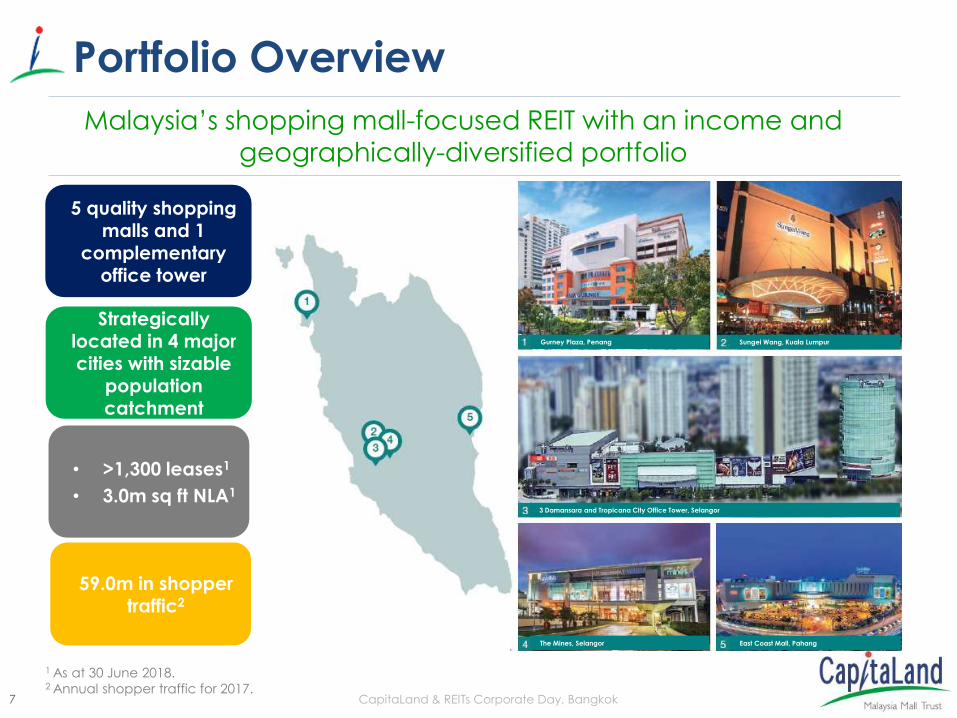
Portfolio Overview
5 quality shopping malls and 1
complementary office tower
• >1,300 leases1
• 3.0m sq ft NLA1
Malaysia’s shopping mall-focused REIT with an income and geographically-diversified portfolio
59.0m in shopper traffic2
1 As at 30 June 2018. 2 Annual shopper traffic for 2017.
Strategically located in 4 major cities with sizable
population catchment
Gurney Plaza, Penang Sungei Wang, Kuala Lumpur
3 Damansara and Tropicana City Office Tower, Selangor
The Mines, Selangor East Coast Mall, Pahang
8 CapitaLand & REITs Corporate Day, Bangkok
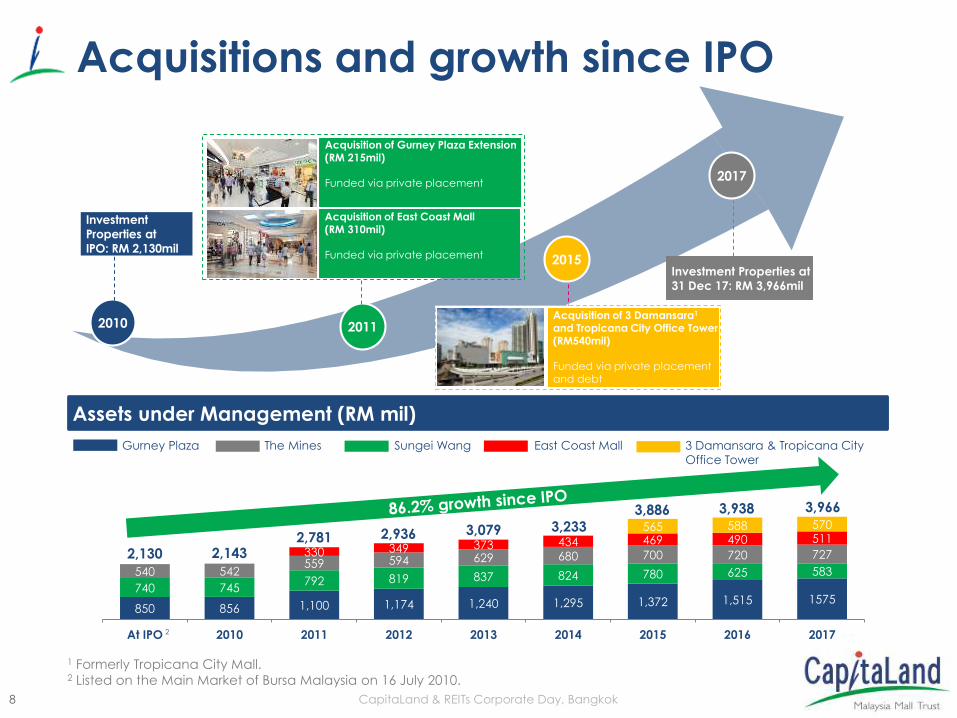
850 856 1,100 1,174 1,240 1,295 1,372 1,515 1575740 745
792 819 837 824 780 625 583540 542559 594 629 680 700 720 727330 349 373 434 469 490 511
565 588 570
At IPO 2010 2011 2012 2013 2014 2015 2016 2017
3,2333,0792,9362,7812,1432,130
3,886
Gurney Plaza Sungei Wang The Mines East Coast Mall 3 Damansara & Tropicana City
Office Tower
2010 2011
2017
2015
Investment
Properties at
IPO: RM 2,130mil
Acquisition of Gurney Plaza Extension (RM 215mil)
Funded via private placement
Acquisition of East Coast Mall(RM 310mil)
Funded via private placement
Investment Properties at
31 Dec 17: RM 3,966mil
Acquisition of 3 Damansara1
and Tropicana City Office Tower (RM540mil)
Funded via private placement and debt
2
Assets under Management (RM mil)
1 Formerly Tropicana City Mall.2 Listed on the Main Market of Bursa Malaysia on 16 July 2010.
Acquisitions and growth since IPO
3,938 3,966
9 CapitaLand & REITs Corporate Day, Bangkok
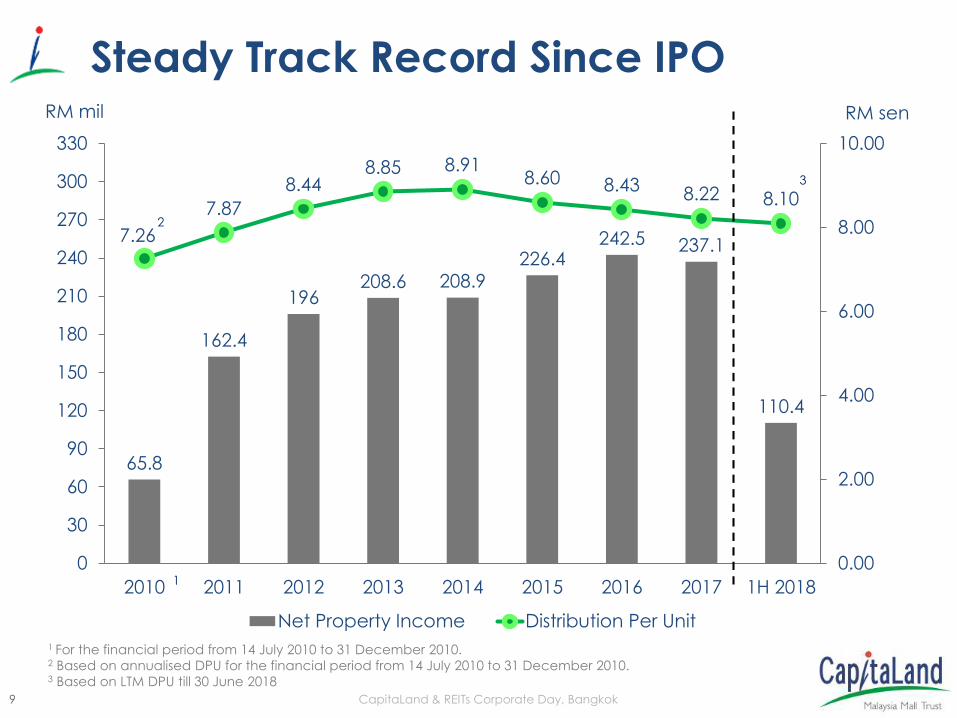
65.8
162.4
196208.6 208.9
226.4242.5 237.1
110.4
7.26
7.87
8.448.85 8.91
8.60 8.43 8.22 8.10
0.00
2.00
4.00
6.00
8.00
10.00
0
30
60
90
120
150
180
210
240
270
300
330
2010 2011 2012 2013 2014 2015 2016 2017 1H 2018
Net Property Income Distribution Per Unit
Steady Track Record Since IPO
1 For the financial period from 14 July 2010 to 31 December 2010.2 Based on annualised DPU for the financial period from 14 July 2010 to 31 December 2010.3 Based on LTM DPU till 30 June 2018
1
RM mil RM sen
3
2
10 CapitaLand & REITs Corporate Day, Bangkok
0
1,000
2,000
3,000
4,000
5,000
6,000
7,000
14,000
15,000
10,000
0 2,000 4,000 6,000 8,000 18,000 12,000
Mark
et capitalis
atio
n(R
Mm
m)
Total assets (RMmm)
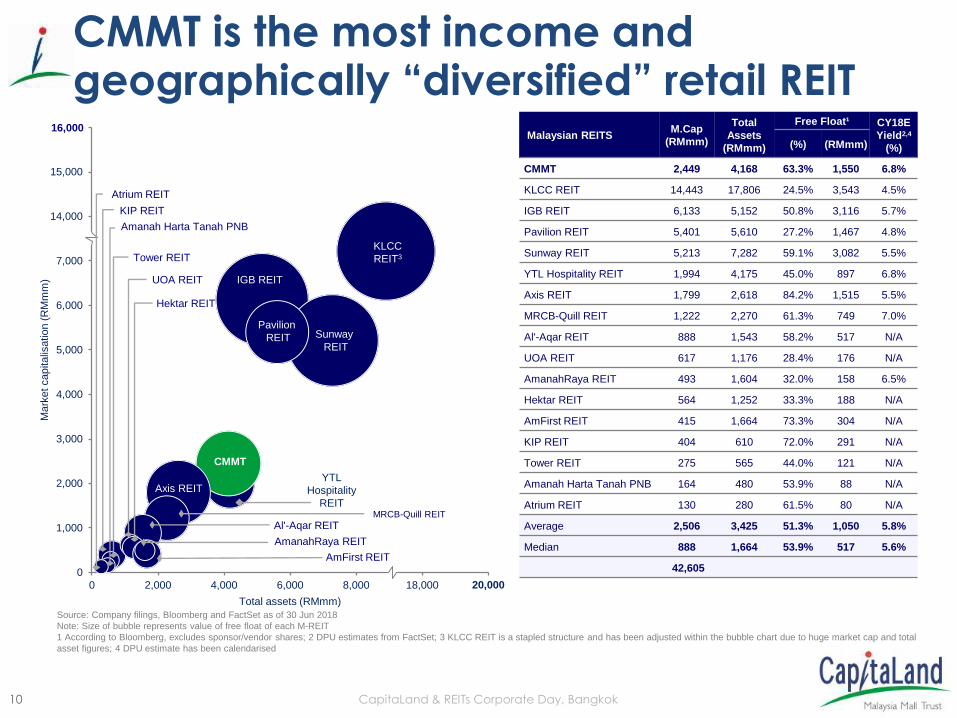
CMMT is the most income and geographically “diversified” retail REIT
Source: Company filings, Bloomberg and FactSet as of 30 Jun 2018
Note: Size of bubble represents value of free float of each M-REIT
1 According to Bloomberg, excludes sponsor/vendor shares; 2 DPU estimates from FactSet; 3 KLCC REIT is a stapled structure and has been adjusted within the bubble chart due to huge market cap and total
asset figures; 4 DPU estimate has been calendarised
16,000
20,000
UOA REIT
Amanah Harta Tanah PNB
Atrium REIT
KIP REIT
Hektar REIT
AmFirst REIT
MRCB-Quill REIT
Al'-Aqar REIT
YTL
Hospitality
REIT
Tower REIT
AmanahRaya REIT
Pavilion
REIT Sunway
REIT
IGB REIT
Axis REIT
KLCC
REIT3
CMMT
Malaysian REITSM.Cap
(RMmm)
Total
Assets
(RMmm)
Free Float¹ CY18E
Yield2,4
(%)(%) (RMmm)
CMMT 2,449 4,168 63.3% 1,550 6.8%
KLCC REIT 14,443 17,806 24.5% 3,543 4.5%
IGB REIT 6,133 5,152 50.8% 3,116 5.7%
Pavilion REIT 5,401 5,610 27.2% 1,467 4.8%
Sunway REIT 5,213 7,282 59.1% 3,082 5.5%
YTL Hospitality REIT 1,994 4,175 45.0% 897 6.8%
Axis REIT 1,799 2,618 84.2% 1,515 5.5%
MRCB-Quill REIT 1,222 2,270 61.3% 749 7.0%
Al'-Aqar REIT 888 1,543 58.2% 517 N/A
UOA REIT 617 1,176 28.4% 176 N/A
AmanahRaya REIT 493 1,604 32.0% 158 6.5%
Hektar REIT 564 1,252 33.3% 188 N/A
AmFirst REIT 415 1,664 73.3% 304 N/A
KIP REIT 404 610 72.0% 291 N/A
Tower REIT 275 565 44.0% 121 N/A
Amanah Harta Tanah PNB 164 480 53.9% 88 N/A
Atrium REIT 130 280 61.5% 80 N/A
Average 2,506 3,425 51.3% 1,050 5.8%
Median 888 1,664 53.9% 517 5.6%
42,605
11 CapitaLand & REITs Corporate Day, Bangkok
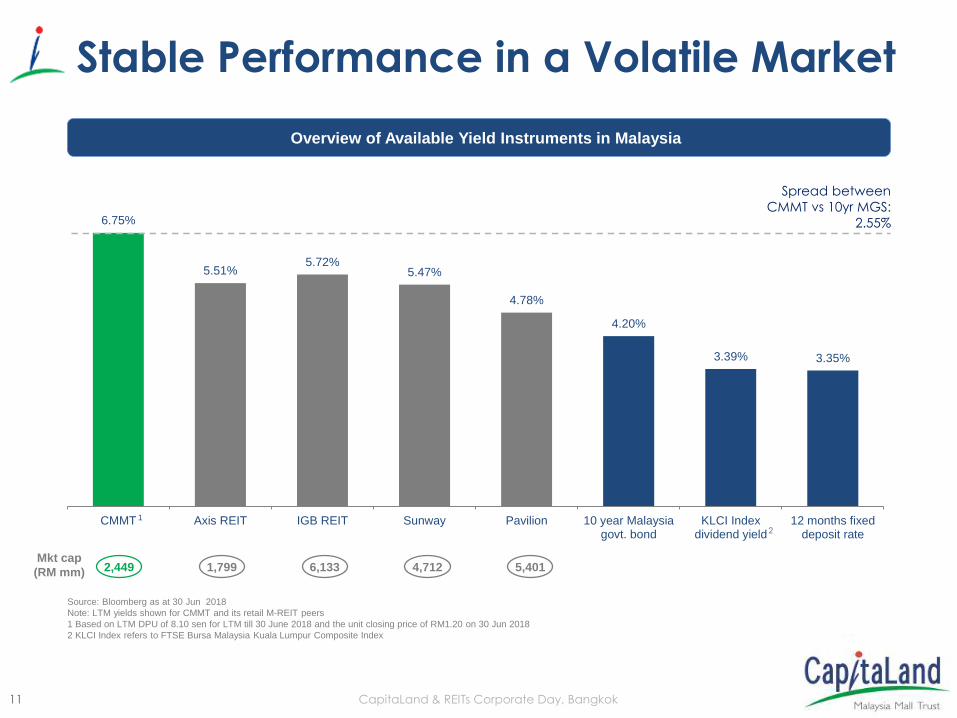
6.75%
5.51%5.72%
5.47%
4.78%
4.20%
3.39% 3.35%
CMMT Axis REIT IGB REIT Sunway Pavilion 10 year Malaysiagovt. bond
KLCI Indexdividend yield
12 months fixeddeposit rate
Overview of Available Yield Instruments in Malaysia
2
Source: Bloomberg as at 30 Jun 2018
Note: LTM yields shown for CMMT and its retail M-REIT peers
1 Based on LTM DPU of 8.10 sen for LTM till 30 June 2018 and the unit closing price of RM1.20 on 30 Jun 2018
2 KLCI Index refers to FTSE Bursa Malaysia Kuala Lumpur Composite Index
2,449Mkt cap
(RM mm) 1,799 6,133 4,712 5,401
1
Stable Performance in a Volatile Market
Spread between
CMMT vs 10yr MGS:
2.55%
12 CapitaLand & REITs Corporate Day, Bangkok
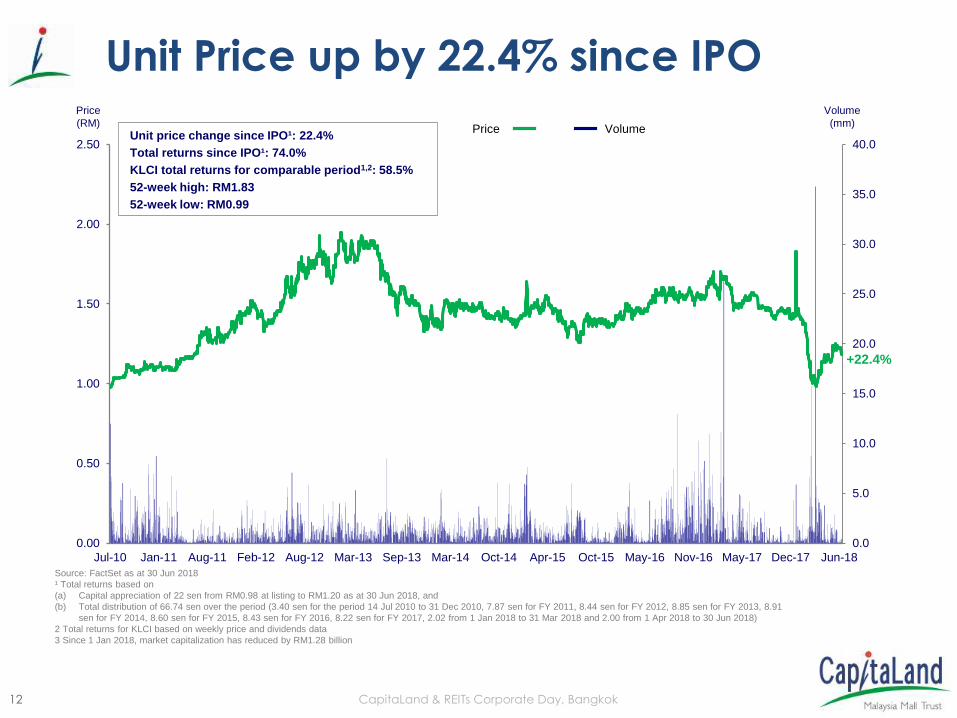
Source: FactSet as at 30 Jun 2018
¹ Total returns based on
(a) Capital appreciation of 22 sen from RM0.98 at listing to RM1.20 as at 30 Jun 2018, and
(b) Total distribution of 66.74 sen over the period (3.40 sen for the period 14 Jul 2010 to 31 Dec 2010, 7.87 sen for FY 2011, 8.44 sen for FY 2012, 8.85 sen for FY 2013, 8.91
sen for FY 2014, 8.60 sen for FY 2015, 8.43 sen for FY 2016, 8.22 sen for FY 2017, 2.02 from 1 Jan 2018 to 31 Mar 2018 and 2.00 from 1 Apr 2018 to 30 Jun 2018)
2 Total returns for KLCI based on weekly price and dividends data
3 Since 1 Jan 2018, market capitalization has reduced by RM1.28 billion
Unit Price up by 22.4% since IPO
0.0
5.0
10.0
15.0
20.0
25.0
30.0
35.0
40.0
0.00
0.50
1.00
1.50
2.00
2.50
Jul-10 Jan-11 Aug-11 Feb-12 Aug-12 Mar-13 Sep-13 Mar-14 Oct-14 Apr-15 Oct-15 May-16 Nov-16 May-17 Dec-17 Jun-18
VolumePrice
+22.4%
Unit price change since IPO¹: 22.4%
Total returns since IPO¹: 74.0%
KLCI total returns for comparable period1,2: 58.5%
52-week high: RM1.83
52-week low: RM0.99
Price
(RM)
Volume
(mm)
13 CapitaLand & REITs Corporate Day, Bangkok
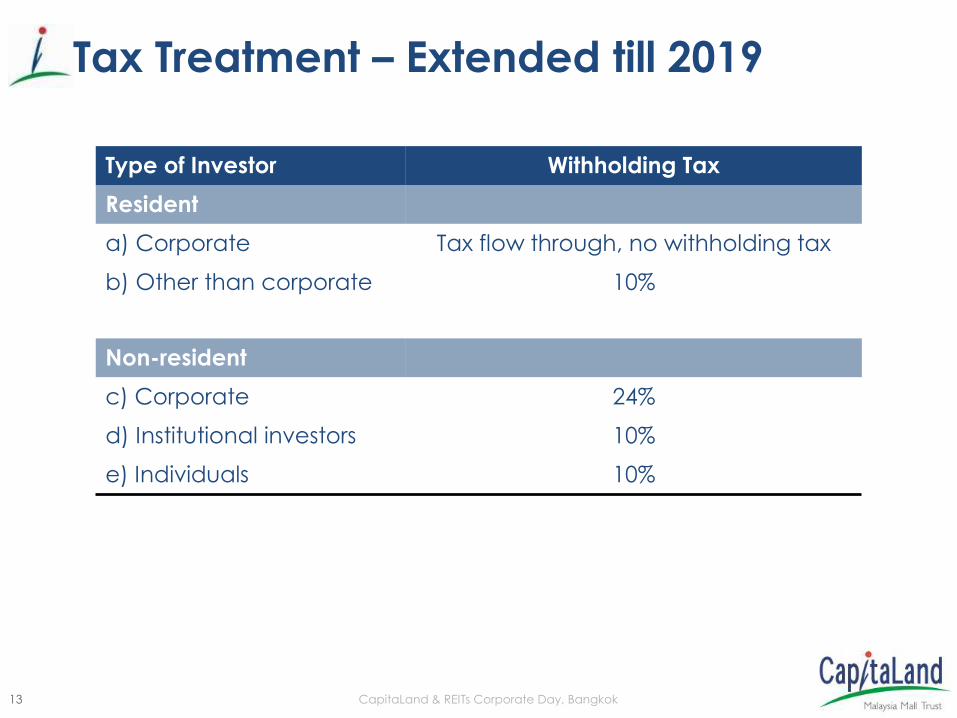
Tax Treatment – Extended till 2019
Type of Investor Withholding Tax
Resident
a) Corporate Tax flow through, no withholding tax
b) Other than corporate 10%
Non-resident
c) Corporate 24%
d) Institutional investors 10%
e) Individuals 10%
14 CapitaLand & REITs Corporate Day, Bangkok
Key Highlights
Sungei Wang Plaza, Kuala Lumpur, Malaysia
15 CapitaLand & REITs Corporate Day, Bangkok
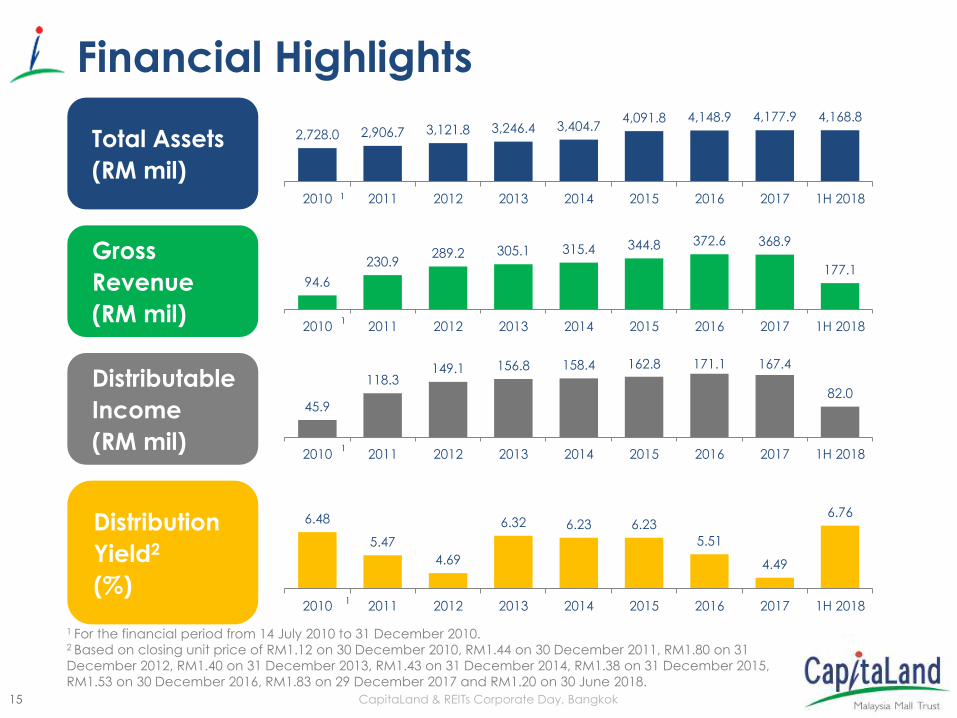
2,728.0 2,906.7 3,121.8 3,246.4 3,404.74,091.8 4,148.9 4,177.9 4,168.8
2010 2011 2012 2013 2014 2015 2016 2017 1H 2018
Total Assets
(RM mil)
94.6
230.9289.2 305.1 315.4 344.8 372.6 368.9
177.1
2010 2011 2012 2013 2014 2015 2016 2017 1H 2018
Gross
Revenue
(RM mil)
45.9
118.3149.1 156.8 158.4 162.8 171.1 167.4
82.0
2010 2011 2012 2013 2014 2015 2016 2017 1H 2018
Distributable
Income
(RM mil)
6.48
5.47
4.69
6.32 6.23 6.23
5.51
4.49
6.76
2010 2011 2012 2013 2014 2015 2016 2017 1H 2018
Distribution
Yield2
(%)
Financial Highlights
1 For the financial period from 14 July 2010 to 31 December 2010. 2 Based on closing unit price of RM1.12 on 30 December 2010, RM1.44 on 30 December 2011, RM1.80 on 31
December 2012, RM1.40 on 31 December 2013, RM1.43 on 31 December 2014, RM1.38 on 31 December 2015,
RM1.53 on 30 December 2016, RM1.83 on 29 December 2017 and RM1.20 on 30 June 2018.
1
1
1
1
16 CapitaLand & REITs Corporate Day, Bangkok
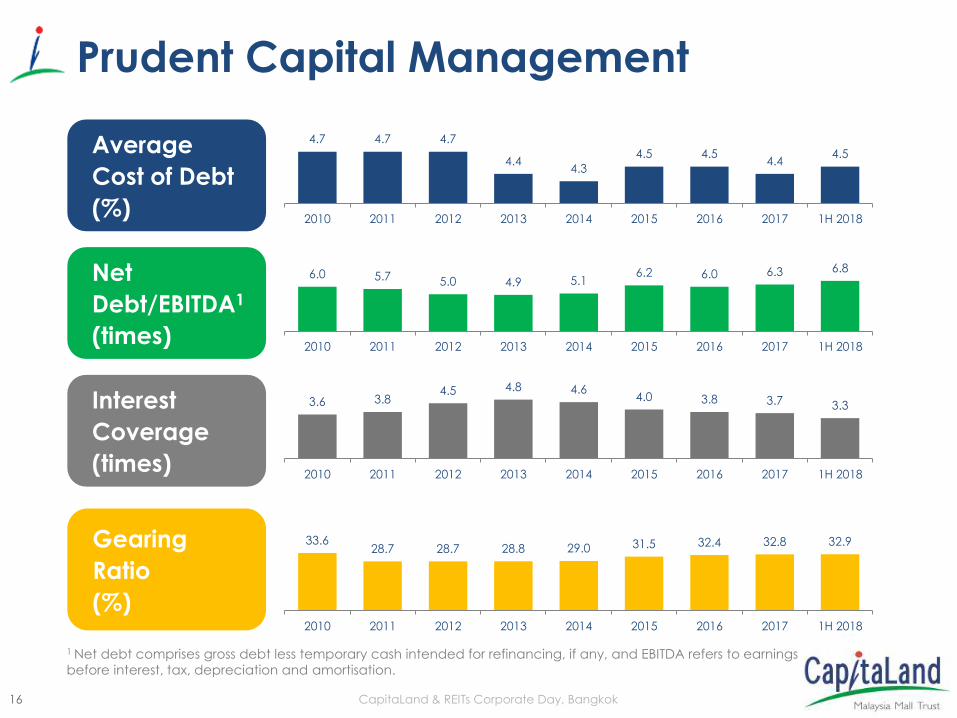
4.7 4.7 4.7
4.44.3
4.5 4.54.4
4.5
2010 2011 2012 2013 2014 2015 2016 2017 1H 2018
Average
Cost of Debt
(%)
6.0 5.7 5.0 4.9 5.16.2 6.0 6.3 6.8
2010 2011 2012 2013 2014 2015 2016 2017 1H 2018
Net
Debt/EBITDA1
(times)
3.6 3.84.5 4.8 4.6
4.0 3.8 3.7 3.3
2010 2011 2012 2013 2014 2015 2016 2017 1H 2018
Interest
Coverage
(times)
33.628.7 28.7 28.8 29.0 31.5 32.4 32.8 32.9
2010 2011 2012 2013 2014 2015 2016 2017 1H 2018
Gearing
Ratio
(%)
Prudent Capital Management
1 Net debt comprises gross debt less temporary cash intended for refinancing, if any, and EBITDA refers to earnings
before interest, tax, depreciation and amortisation.
17 CapitaLand & REITs Corporate Day, Bangkok
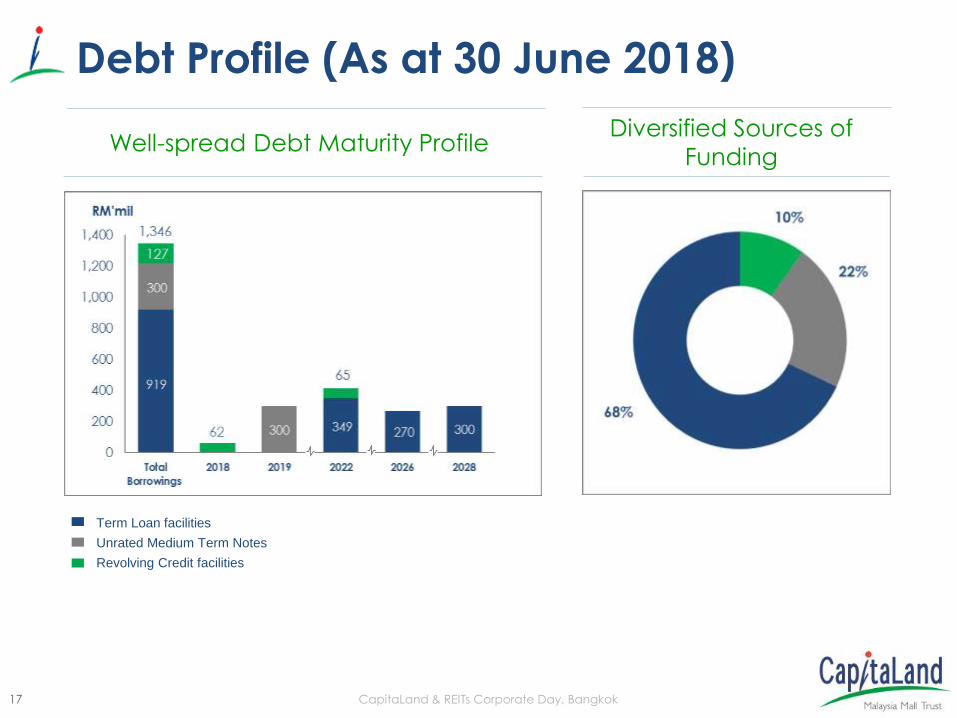
Debt Profile (As at 30 June 2018)
Well-spread Debt Maturity ProfileDiversified Sources of
Funding
Term Loan facilities
Unrated Medium Term Notes
Revolving Credit facilities
18 CapitaLand & REITs Corporate Day, Bangkok
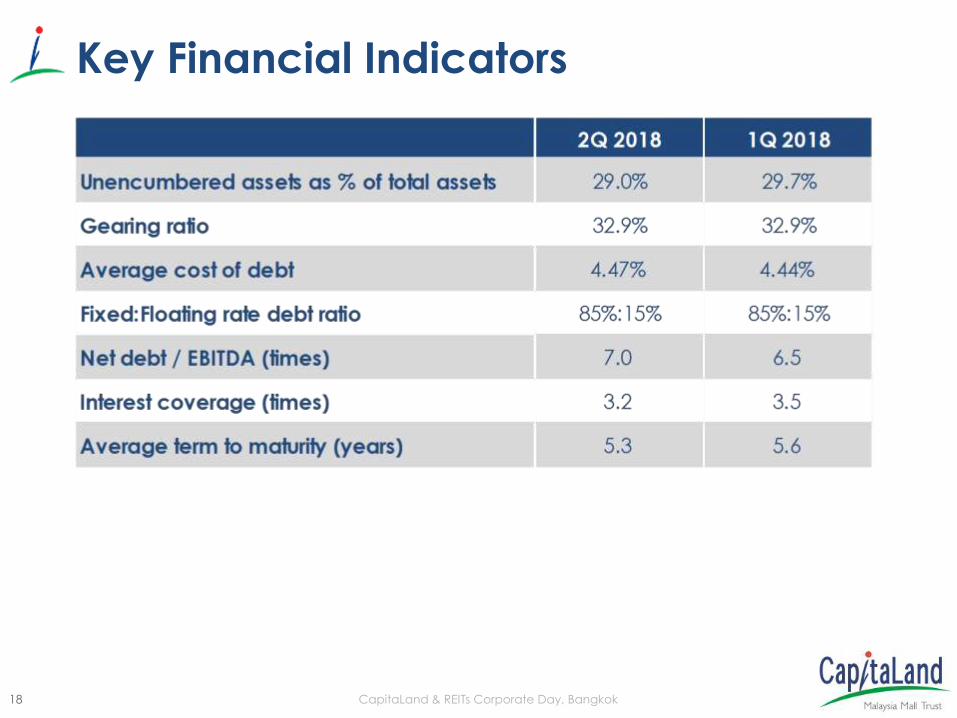
Key Financial Indicators
19 CapitaLand & REITs Corporate Day, Bangkok
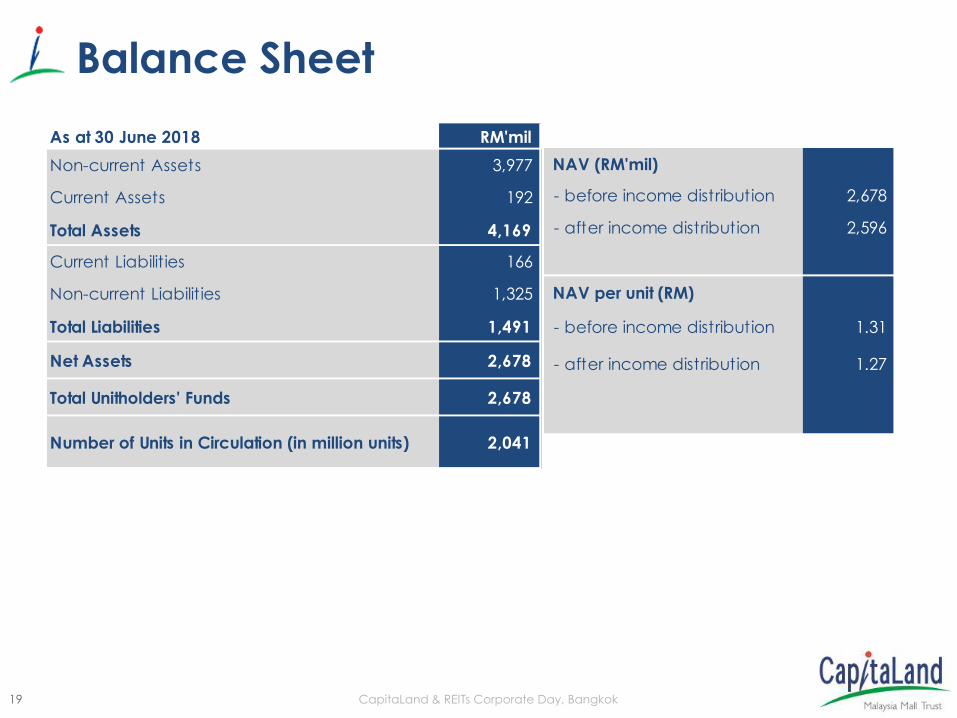
Balance Sheet
As at 30 June 2018 RM'mil
Non-current Assets 3,977
Current Assets 192
Total Assets 4,169
Current Liabilities 166
Non-current Liabilities 1,325
Total Liabilities 1,491
Net Assets 2,678
Total Unitholders' Funds 2,678
Number of Units in Circulation (in million units) 2,041
NAV (RM'mil)
- before income distribution 2,678
- after income distribution 2,596
NAV per unit (RM)
- before income distribution 1.31
- after income distribution 1.27
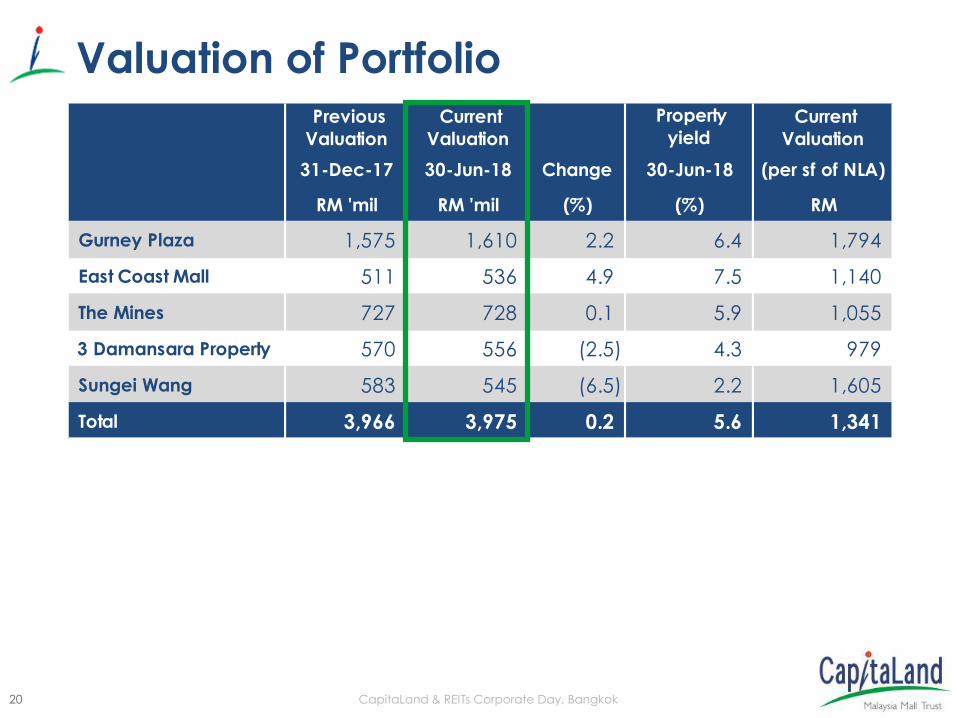
20 CapitaLand & REITs Corporate Day, Bangkok
Previous
Valuation
Current
Valuation
Property
yield Current
Valuation
31-Dec-17 30-Jun-18 Change 30-Jun-18 (per sf of NLA)
RM 'mil RM 'mil (%) (%) RM
Gurney Plaza 1,575 1,610 2.2 6.4 1,794
East Coast Mall 511 536 4.9 7.5 1,140
The Mines 727 728 0.1 5.9 1,055
3 Damansara Property 570 556 (2.5) 4.3 979
Sungei Wang 583 545 (6.5) 2.2 1,605
Total 3,966 3,975 0.2 5.6 1,341
Valuation of Portfolio
21 CapitaLand & REITs Corporate Day, Bangkok
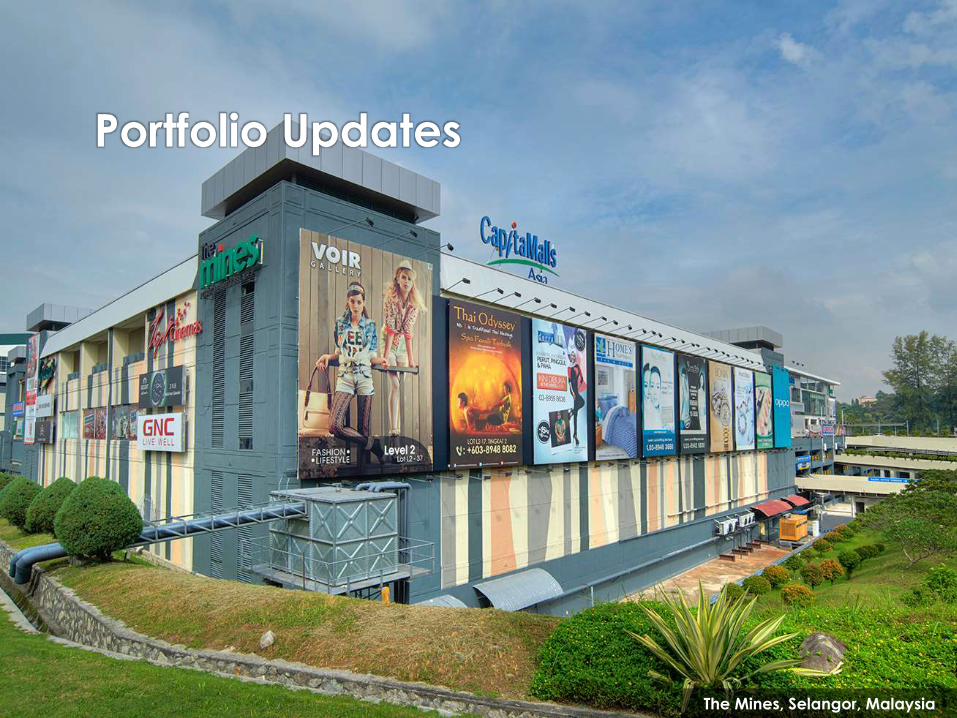
Portfolio Updates
The Mines, Selangor, Malaysia
22 CapitaLand & REITs Corporate Day, Bangkok
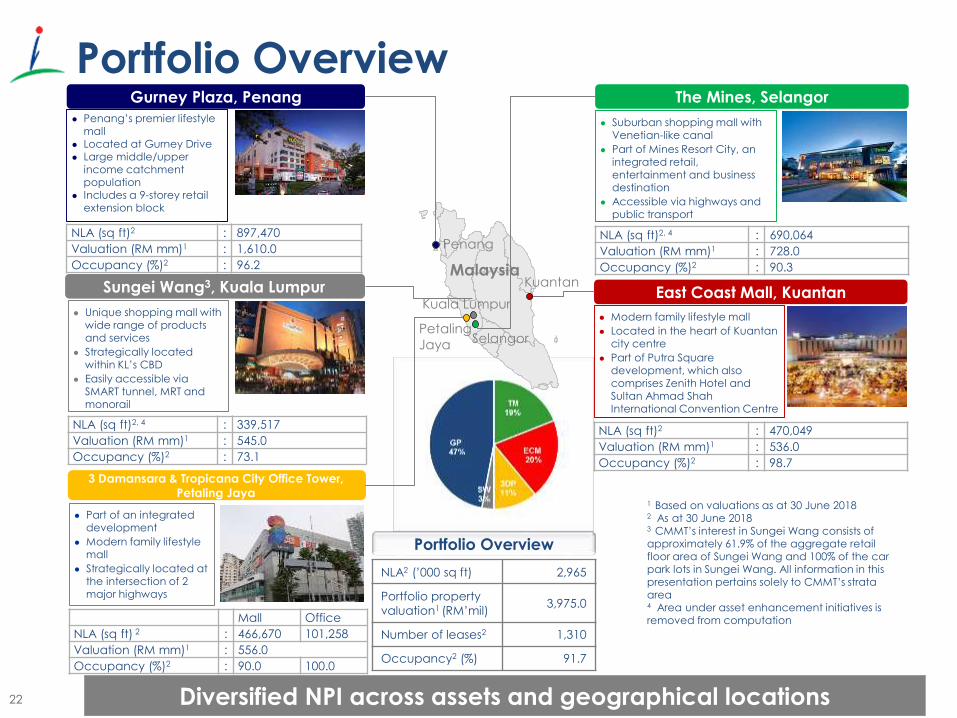
Portfolio Overview
Selangor
Kuala Lumpur
Malaysia
Penang
● Penang’s premier lifestyle
mall● Located at Gurney Drive● Large middle/upper
income catchment population
● Includes a 9-storey retail extension block
● Modern family lifestyle mall
● Located in the heart of Kuantan city centre
● Part of Putra Square development, which also comprises Zenith Hotel and Sultan Ahmad Shah International Convention Centre
East Coast Mall, KuantanSungei Wang3, Kuala Lumpur
● Unique shopping mall with wide range of products and services
● Strategically located within KL’s CBD
● Easily accessible via SMART tunnel, MRT and monorail
NLA (sq ft)2, 4 : 339,517
Valuation (RM mm)1 : 545.0
Occupancy (%)2 : 73.1
NLA (sq ft)2 : 897,470
Valuation (RM mm)1 : 1,610.0
Occupancy (%)2 : 96.2
Gurney Plaza, Penang
● Suburban shopping mall with Venetian-like canal
● Part of Mines Resort City, an integrated retail, entertainment and business destination
● Accessible via highways and public transport
The Mines, Selangor
NLA (sq ft)2, 4 : 690,064
Valuation (RM mm)1 : 728.0
Occupancy (%)2 : 90.3
Kuantan
NLA (sq ft)2 : 470,049
Valuation (RM mm)1 : 536.0
Occupancy (%)2 : 98.7
3 Damansara & Tropicana City Office Tower,
Petaling Jaya
● Part of an integrated development
● Modern family lifestyle mall
● Strategically located at the intersection of 2 major highways
Mall Office
NLA (sq ft) 2 : 466,670 101,258
Valuation (RM mm)1 : 556.0
Occupancy (%)2 : 90.0 100.0
1 Based on valuations as at 30 June 20182 As at 30 June 20183 CMMT’s interest in Sungei Wang consists of approximately 61.9% of the aggregate retail floor area of Sungei Wang and 100% of the car park lots in Sungei Wang. All information in this presentation pertains solely to CMMT’s strata area4 Area under asset enhancement initiatives is removed from computation
Petaling
Jaya
Portfolio Overview
NLA2 (’000 sq ft) 2,965
Portfolio property
valuation1 (RM’mil)3,975.0
Number of leases2 1,310
Occupancy2 (%) 91.7
Diversified NPI across assets and geographical locations
23 CapitaLand & REITs Corporate Day, Bangkok
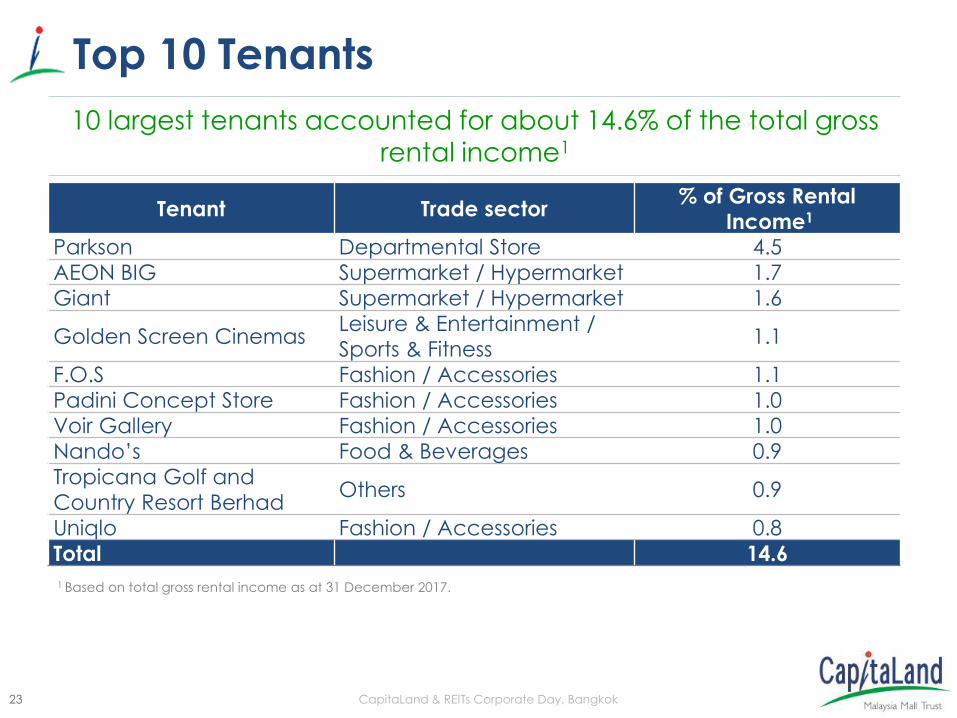
Top 10 Tenants
Tenant Trade sector% of Gross Rental
Income1
Parkson Departmental Store 4.5
AEON BIG Supermarket / Hypermarket 1.7
Giant Supermarket / Hypermarket 1.6
Golden Screen CinemasLeisure & Entertainment /
Sports & Fitness1.1
F.O.S Fashion / Accessories 1.1
Padini Concept Store Fashion / Accessories 1.0
Voir Gallery Fashion / Accessories 1.0
Nando’s Food & Beverages 0.9
Tropicana Golf and
Country Resort BerhadOthers 0.9
Uniqlo Fashion / Accessories 0.8
Total 14.6
1 Based on total gross rental income as at 31 December 2017.
10 largest tenants accounted for about 14.6% of the total gross rental income1
24 CapitaLand & REITs Corporate Day, Bangkok
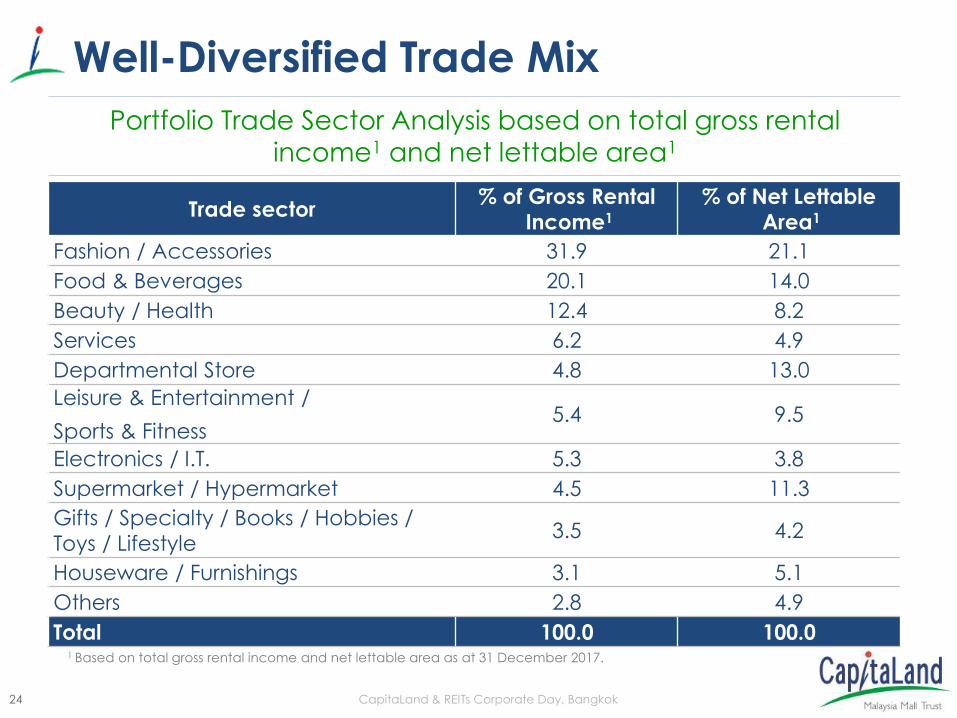
Well-Diversified Trade Mix
1 Based on total gross rental income and net lettable area as at 31 December 2017.
Trade sector% of Gross Rental
Income1
% of Net Lettable
Area1
Fashion / Accessories 31.9 21.1
Food & Beverages 20.1 14.0
Beauty / Health 12.4 8.2
Services 6.2 4.9
Departmental Store 4.8 13.0
Leisure & Entertainment /
Sports & Fitness5.4 9.5
Electronics / I.T. 5.3 3.8
Supermarket / Hypermarket 4.5 11.3
Gifts / Specialty / Books / Hobbies /
Toys / Lifestyle3.5 4.2
Houseware / Furnishings 3.1 5.1
Others 2.8 4.9
Total 100.0 100.0
Portfolio Trade Sector Analysis based on total gross rental income1 and net lettable area1
25 CapitaLand & REITs Corporate Day, Bangkok
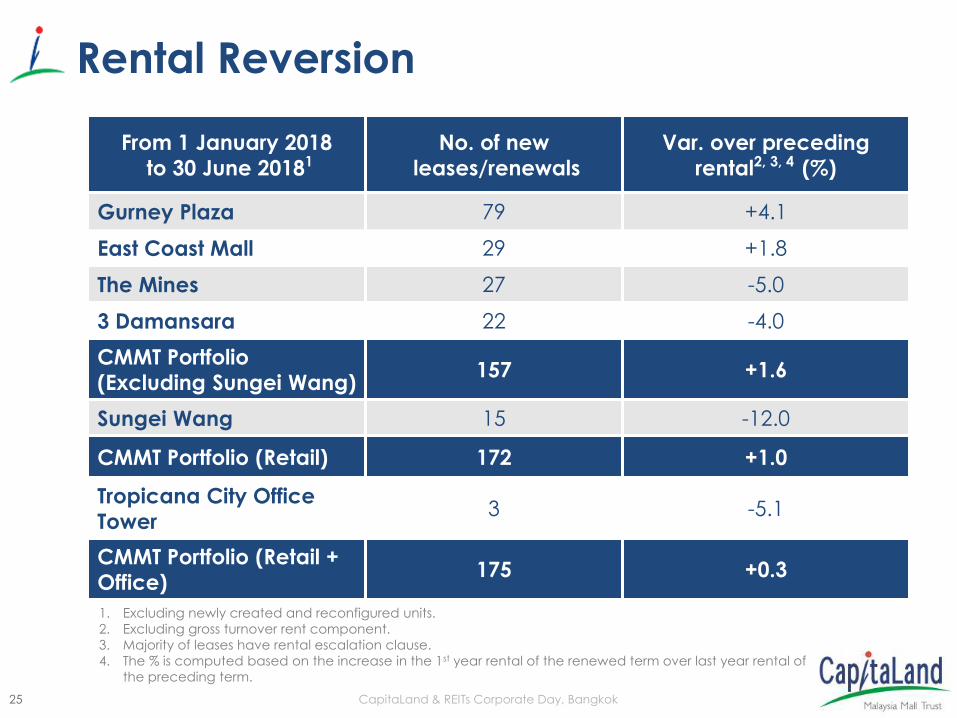
Rental Reversion
1. Excluding newly created and reconfigured units.
2. Excluding gross turnover rent component.
3. Majority of leases have rental escalation clause.
4. The % is computed based on the increase in the 1st year rental of the renewed term over last year rental of
the preceding term.
From 1 January 2018
to 30 June 20181No. of new
leases/renewals
Var. over preceding
rental2, 3, 4 (%)
Gurney Plaza 79 +4.1
East Coast Mall 29 +1.8
The Mines 27 -5.0
3 Damansara 22 -4.0
CMMT Portfolio
(Excluding Sungei Wang)157 +1.6
Sungei Wang 15 -12.0
CMMT Portfolio (Retail) 172 +1.0
Tropicana City Office
Tower3 -5.1
CMMT Portfolio (Retail +
Office)175 +0.3
26 CapitaLand & REITs Corporate Day, Bangkok
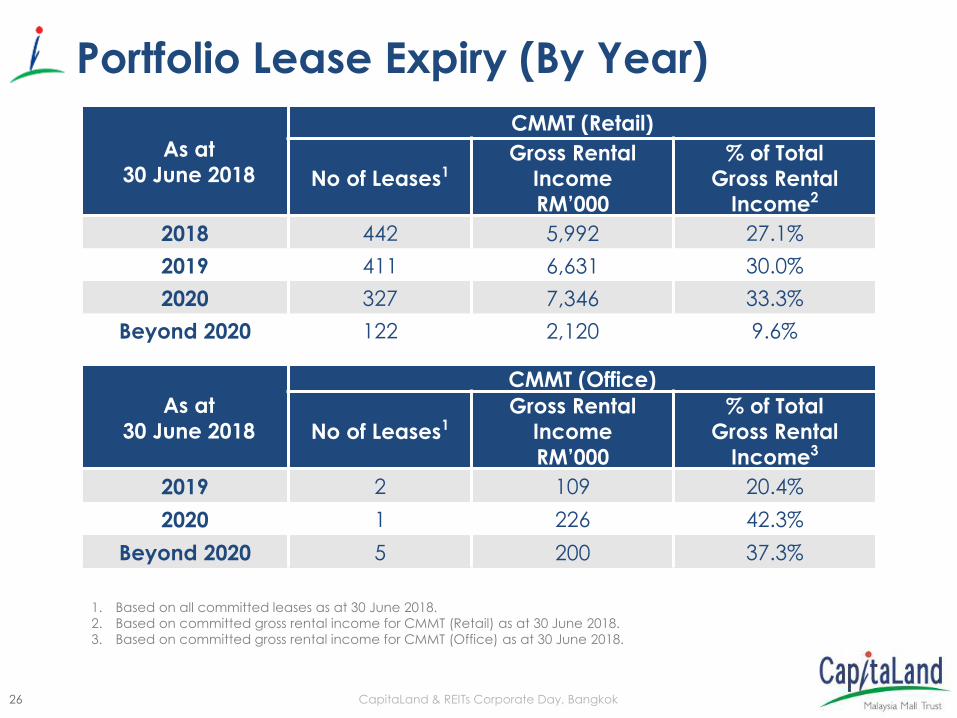
Portfolio Lease Expiry (By Year)
As at
30 June 2018
CMMT (Retail)
No of Leases1Gross Rental
Income
RM’000
% of Total
Gross Rental
Income2
2018 442 5,992 27.1%
2019 411 6,631 30.0%
2020 327 7,346 33.3%
Beyond 2020 122 2,120 9.6%
As at
30 June 2018
CMMT (Office)
No of Leases1Gross Rental
Income
RM’000
% of Total
Gross Rental
Income3
2019 2 109 20.4%
2020 1 226 42.3%
Beyond 2020 5 200 37.3%
1. Based on all committed leases as at 30 June 2018.
2. Based on committed gross rental income for CMMT (Retail) as at 30 June 2018.
3. Based on committed gross rental income for CMMT (Office) as at 30 June 2018.
27 CapitaLand & REITs Corporate Day, Bangkok
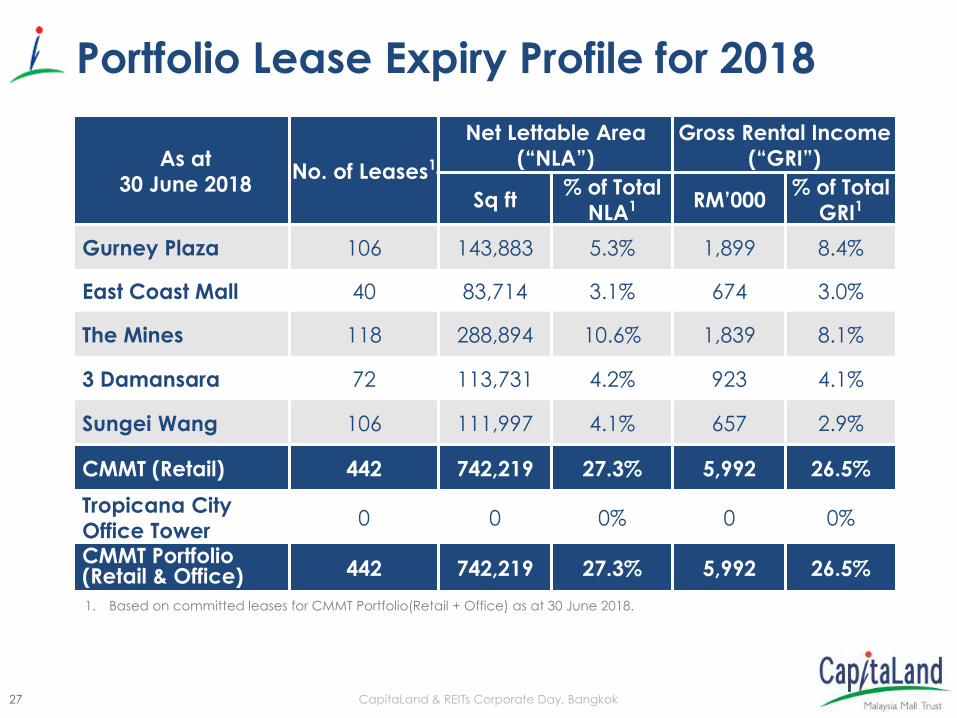
Portfolio Lease Expiry Profile for 2018
As at
30 June 2018No. of Leases1
Net Lettable Area
(“NLA”)
Gross Rental Income
(“GRI”)
Sq ft % of Total
NLA1 RM’000 % of Total
GRI1
Gurney Plaza 106 143,883 5.3% 1,899 8.4%
East Coast Mall 40 83,714 3.1% 674 3.0%
The Mines 118 288,894 10.6% 1,839 8.1%
3 Damansara 72 113,731 4.2% 923 4.1%
Sungei Wang 106 111,997 4.1% 657 2.9%
CMMT (Retail) 442 742,219 27.3% 5,992 26.5%
Tropicana City
Office Tower0 0 0% 0 0%
CMMT Portfolio (Retail & Office) 442 742,219 27.3% 5,992 26.5%
1. Based on committed leases for CMMT Portfolio(Retail + Office) as at 30 June 2018.
28 CapitaLand & REITs Corporate Day, Bangkok
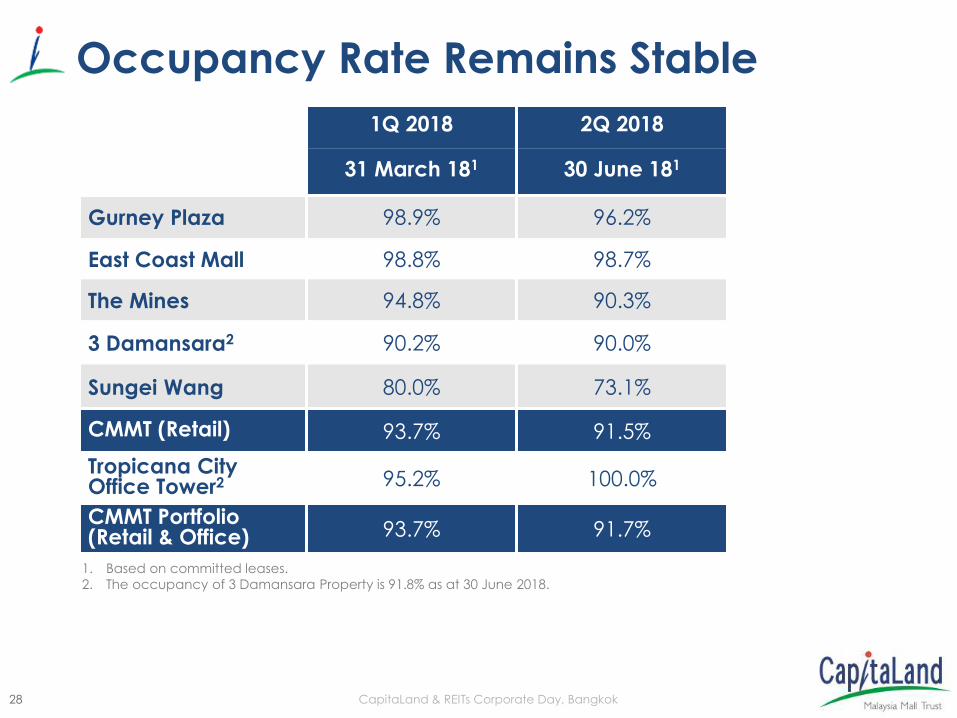
Occupancy Rate Remains Stable
1Q 2018 2Q 2018
31 March 181 30 June 181
Gurney Plaza 98.9% 96.2%
East Coast Mall 98.8% 98.7%
The Mines 94.8% 90.3%
3 Damansara2 90.2% 90.0%
Sungei Wang 80.0% 73.1%
CMMT (Retail) 93.7% 91.5%
Tropicana City Office Tower2 95.2% 100.0%
CMMT Portfolio (Retail & Office) 93.7% 91.7%
1. Based on committed leases.
2. The occupancy of 3 Damansara Property is 91.8% as at 30 June 2018.
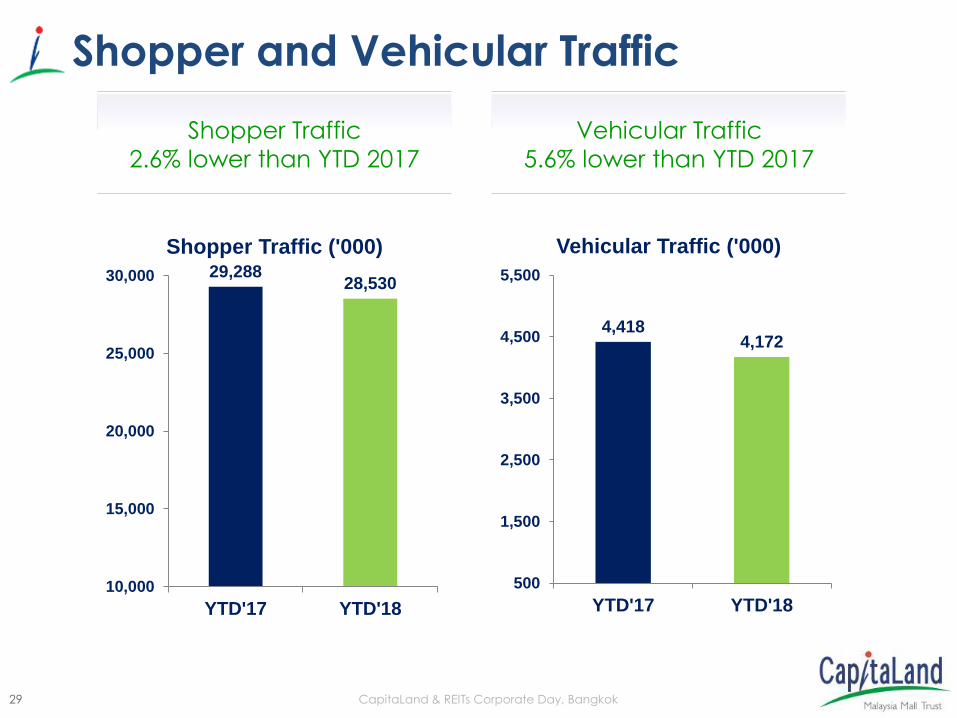
29 CapitaLand & REITs Corporate Day, Bangkok
Shopper Traffic
2.6% lower than YTD 2017
Shopper and Vehicular Traffic
29,28828,530
10,000
15,000
20,000
25,000
30,000
YTD'17 YTD'18
Shopper Traffic ('000)
Vehicular Traffic
5.6% lower than YTD 2017
4,4184,172
500
1,500
2,500
3,500
4,500
5,500
YTD'17 YTD'18
Vehicular Traffic ('000)
30 CapitaLand & REITs Corporate Day, Bangkok
New Initiatives &
Improvement Works
East Coast Mall, Kuantan, Malaysia
3131 CapitaLand & REITs Corporate Day, Bangkok
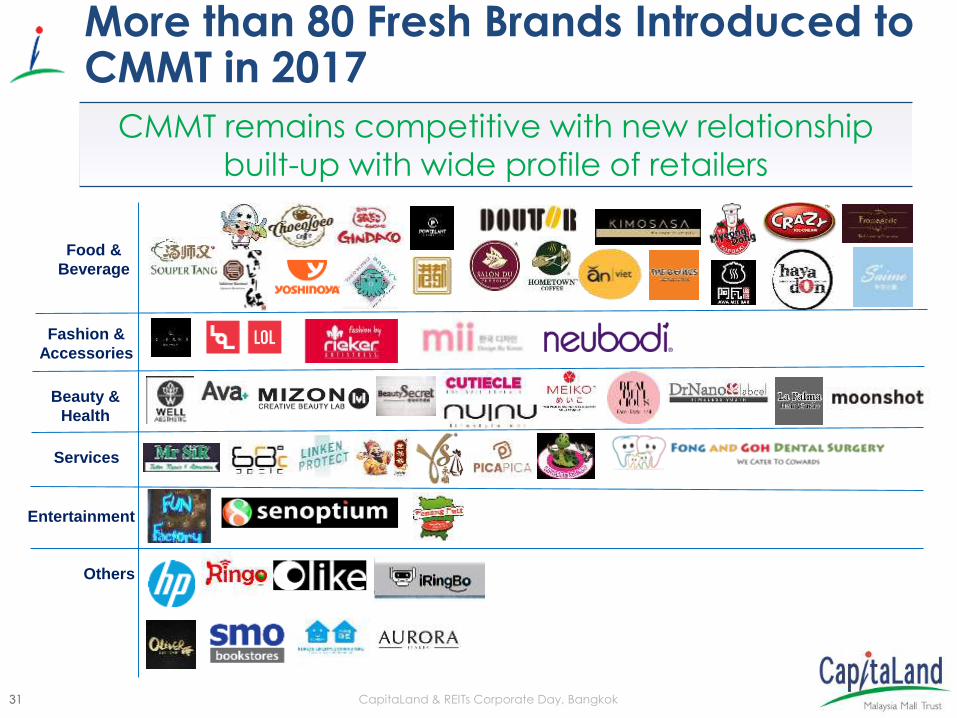
More than 80 Fresh Brands Introduced to CMMT in 2017
CMMT remains competitive with new relationship
built-up with wide profile of retailers
Food &
Beverage
Fashion &
Accessories
Beauty &
Health
Services
Entertainment
Others
3232 CapitaLand & REITs Corporate Day, Bangkok
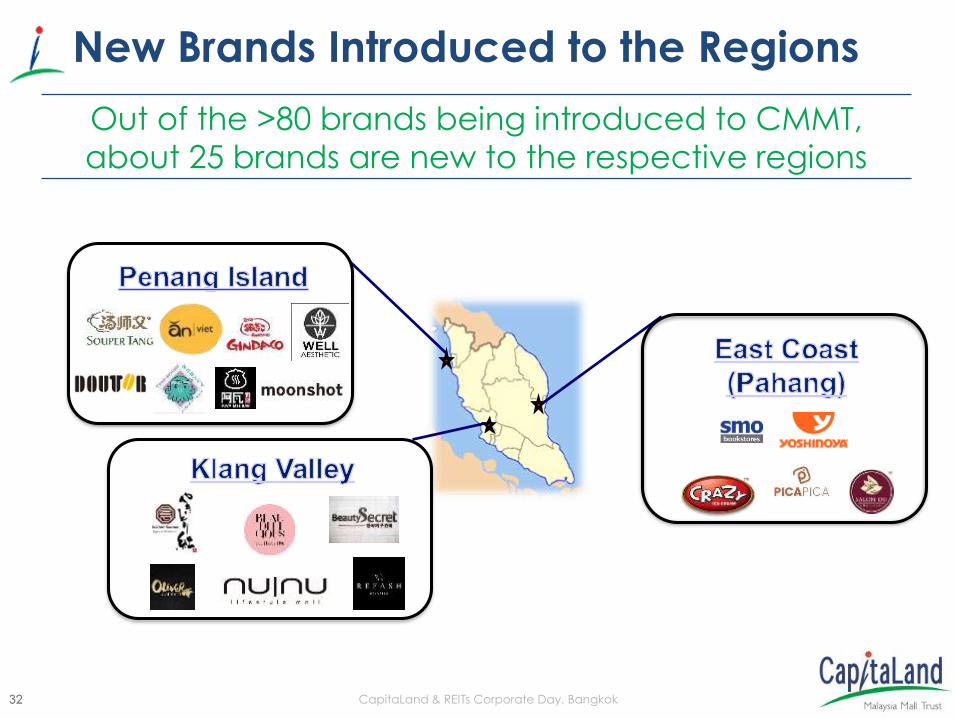
New Brands Introduced to the Regions
Out of the >80 brands being introduced to CMMT,
about 25 brands are new to the respective regions
33 CapitaLand & REITs Corporate Day, Bangkok
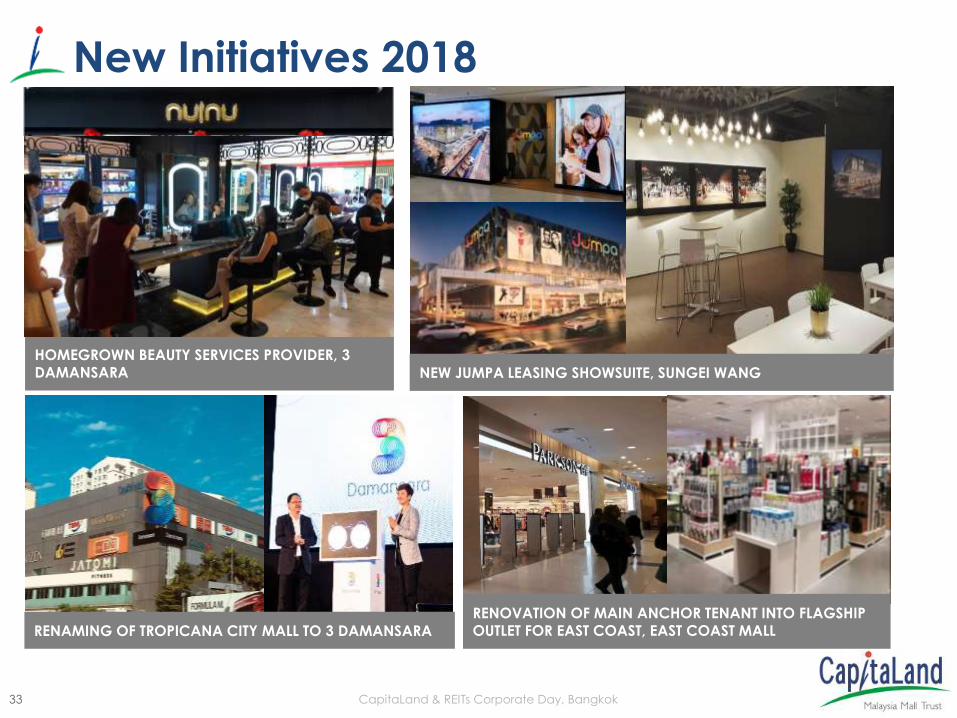
New Initiatives 2018
HOMEGROWN BEAUTY SERVICES PROVIDER, 3 DAMANSARA NEW JUMPA LEASING SHOWSUITE, SUNGEI WANG
RENAMING OF TROPICANA CITY MALL TO 3 DAMANSARA
RENOVATION OF MAIN ANCHOR TENANT INTO FLAGSHIP OUTLET FOR EAST COAST, EAST COAST MALL
34 CapitaLand & REITs Corporate Day, Bangkok
Marcom, Sustainability
& Awards
35 CapitaLand & REITs Corporate Day, Bangkok
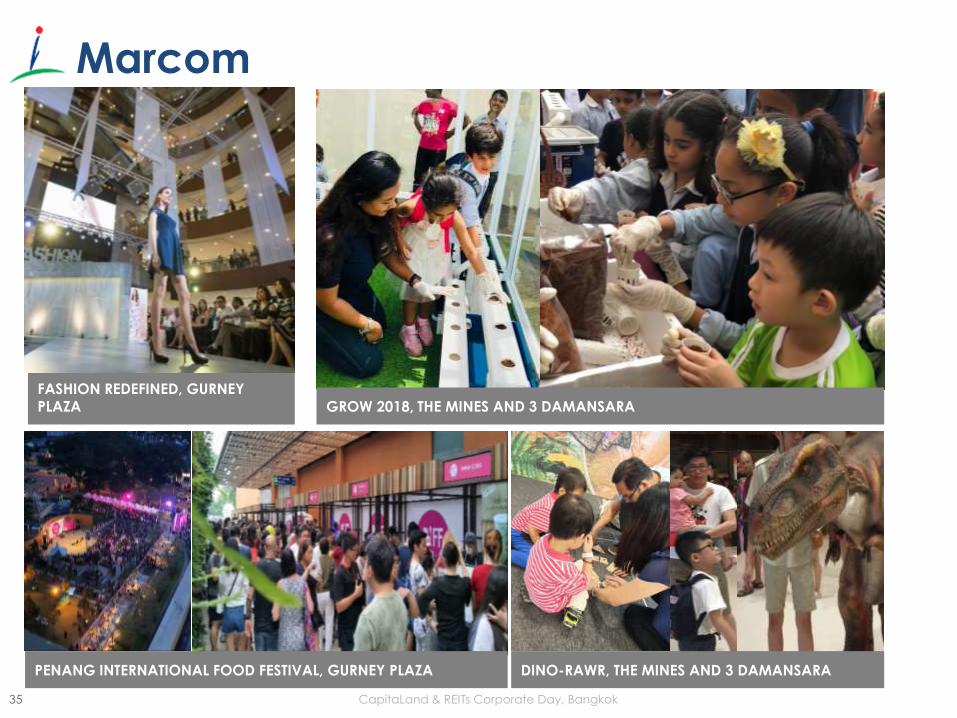
Marcom
FASHION REDEFINED, GURNEY PLAZA
PENANG INTERNATIONAL FOOD FESTIVAL, GURNEY PLAZA
GROW 2018, THE MINES AND 3 DAMANSARA
DINO-RAWR, THE MINES AND 3 DAMANSARA
36 CapitaLand & REITs Corporate Day, Bangkok
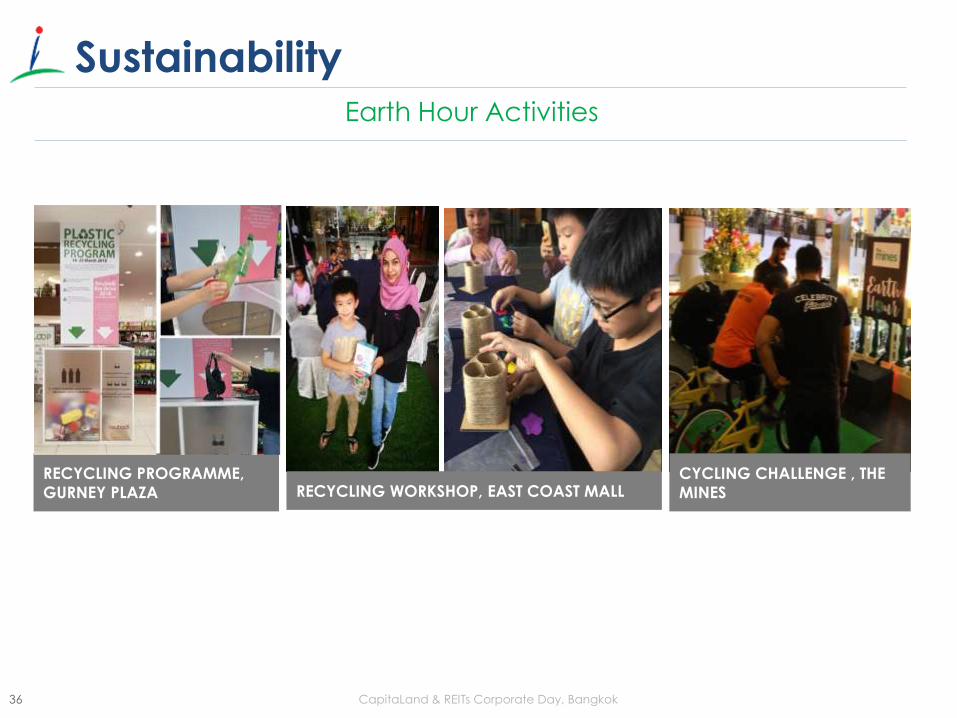
Earth Hour Activities
Sustainability
CYCLING CHALLENGE , THE
MINES
RECYCLING PROGRAMME,
GURNEY PLAZA RECYCLING WORKSHOP, EAST COAST MALL
37 CapitaLand & REITs Corporate Day, Bangkok
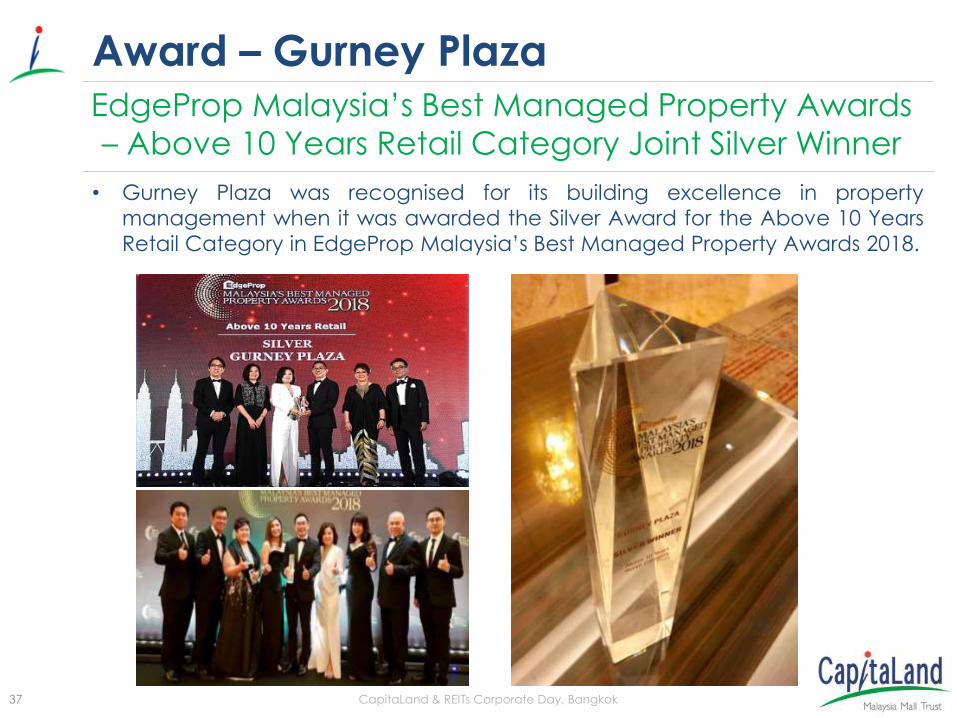
Award – Gurney PlazaEdgeProp Malaysia’s Best Managed Property Awards
– Above 10 Years Retail Category Joint Silver Winner
• Gurney Plaza was recognised for its building excellence in property
management when it was awarded the Silver Award for the Above 10 Years
Retail Category in EdgeProp Malaysia’s Best Managed Property Awards 2018.
38 CapitaLand & REITs Corporate Day, Bangkok
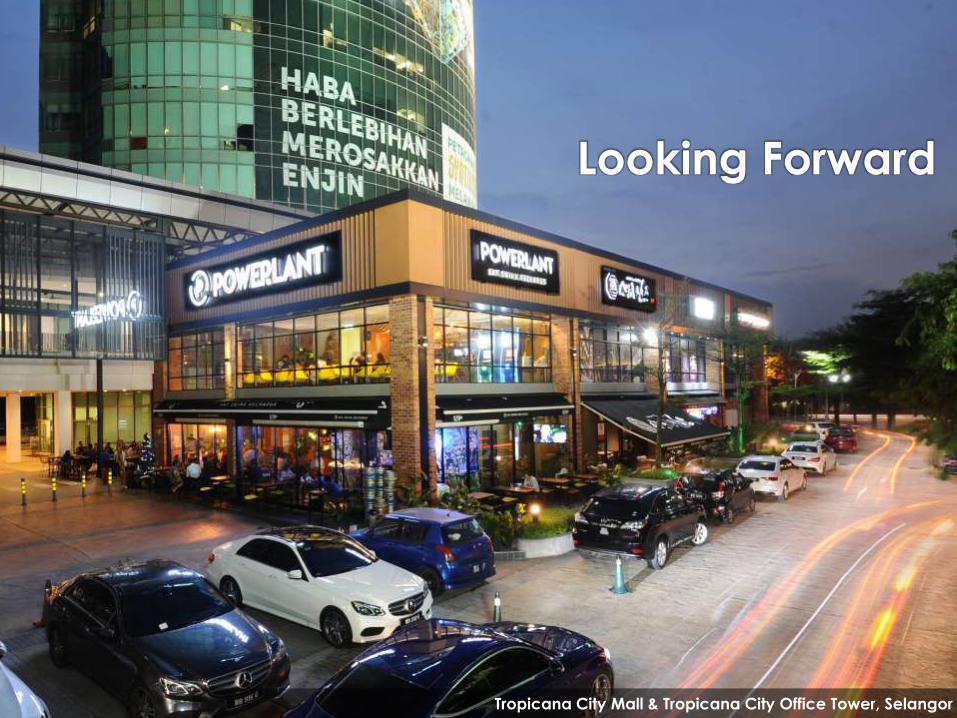
Looking Forward
Tropicana City Mall & Tropicana City Office Tower, Selangor
39 CapitaLand & REITs Corporate Day, Bangkok
(1) Source: Bank Negara Malaysia Annual Report 2017.
(2) Source: Malaysia Retail Industry Report, March 2018 (Retail Group Malaysia).
Looking ForwardProactive Asset and Lease Management to Steer
CMMT Through Economic Cycles
• Retail Outlooko GDP growth 2018 (forecast): 5.5% to 6.0%1
o Retail sales growth 2018: 4.7%2
o Expect consumer and business sentiments to remain cautious due to rising costsenvironment
o Scheduled completion of new retail space supply will intensify the competition levelamong shopping malls
o Rising popularity of e-commerce is reshaping traditional retail and consumer shoppingbehaviour
• Focus on active lease management and introduction of new retail concepts.
• Launch of CapitaStar mobile application to enhance and strengthen shopper engagement.
• Rebranding of Tropicana City Mall to 3 Damansara and enhance its positioning as thepreferred dining and gourmet shopping destination.
• Active lookout for quality acquisition opportunities to strengthen CMMT portfolio.
40 CapitaLand & REITs Corporate Day, Bangkok
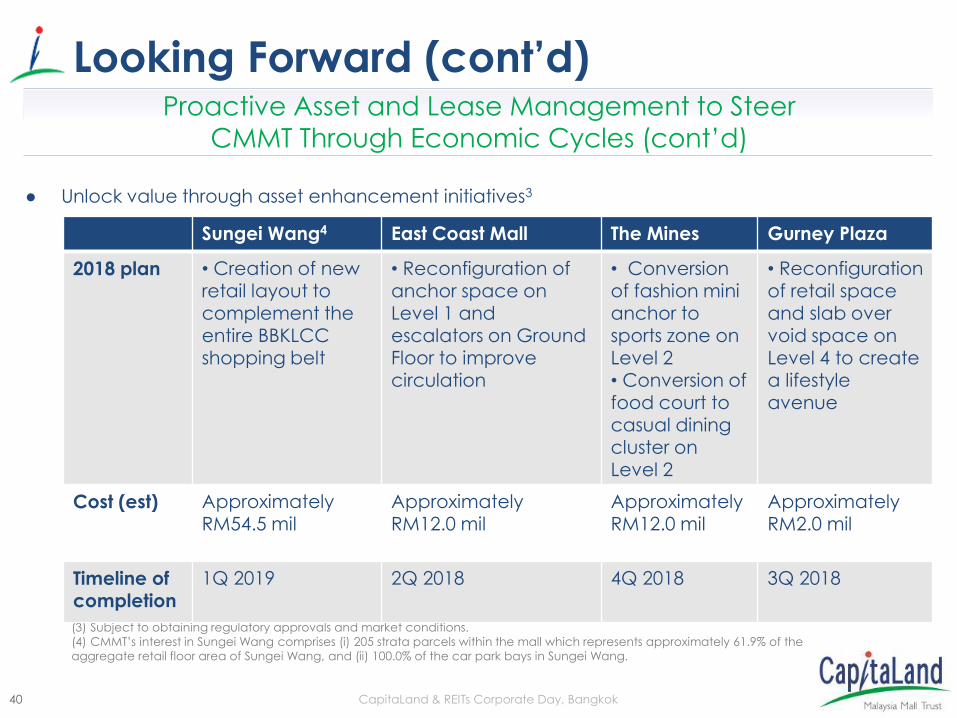
● Unlock value through asset enhancement initiatives3
(3) Subject to obtaining regulatory approvals and market conditions.
(4) CMMT’s interest in Sungei Wang comprises (i) 205 strata parcels within the mall which represents approximately 61.9% of the
aggregate retail floor area of Sungei Wang, and (ii) 100.0% of the car park bays in Sungei Wang.
Looking Forward (cont’d)Proactive Asset and Lease Management to Steer
CMMT Through Economic Cycles (cont’d)
Sungei Wang4 East Coast Mall The Mines Gurney Plaza
2018 plan • Creation of new retail layout to complement the entire BBKLCC shopping belt
• Reconfiguration of anchor space on Level 1 and escalators on Ground Floor to improve circulation
• Conversion of fashion mini anchor to sports zone on Level 2• Conversion of food court to casual dining cluster on Level 2
• Reconfiguration of retail space and slab over void space on Level 4 to create a lifestyle avenue
Cost (est) Approximately RM54.5 mil
Approximately RM12.0 mil
Approximately RM12.0 mil
Approximately RM2.0 mil
Timeline of completion
1Q 2019 2Q 2018 4Q 2018 3Q 2018
41 CapitaLand & REITs Corporate Day, Bangkok
Looking Forward (cont’d)
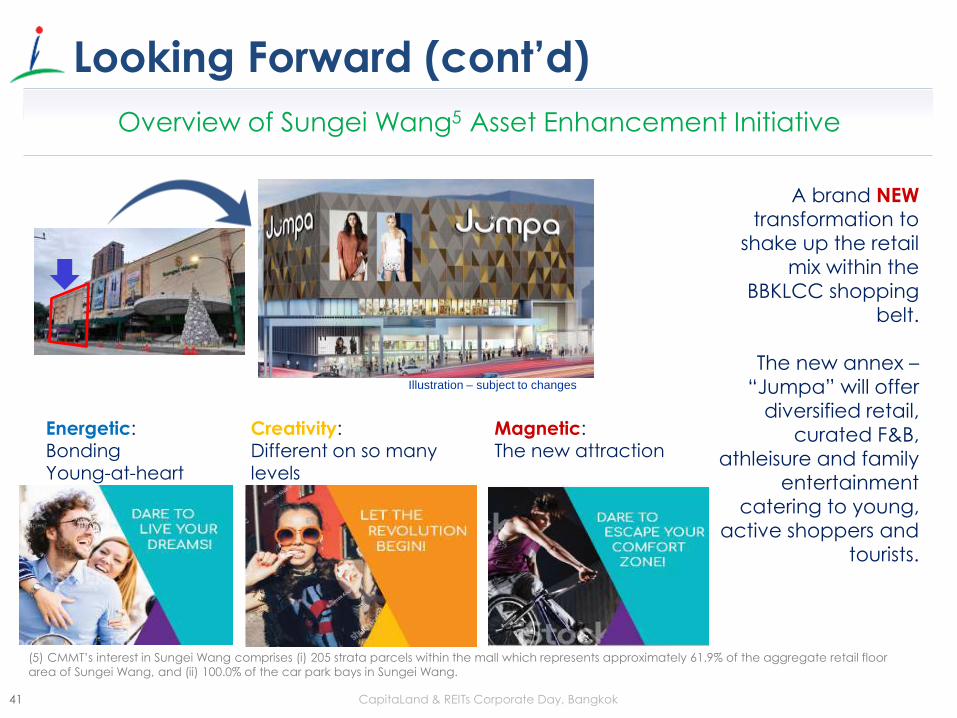
Overview of Sungei Wang5 Asset Enhancement Initiative
Illustration – subject to changes
Creativity:Different on so many levels
Energetic:BondingYoung-at-heart
Magnetic:The new attraction
A brand NEW
transformation to
shake up the retail
mix within the
BBKLCC shopping
belt.
The new annex –
“Jumpa” will offer
diversified retail,
curated F&B,
athleisure and family
entertainment
catering to young,
active shoppers and
tourists.
(5) CMMT’s interest in Sungei Wang comprises (i) 205 strata parcels within the mall which represents approximately 61.9% of the aggregate retail floor
area of Sungei Wang, and (ii) 100.0% of the car park bays in Sungei Wang.
42
Thank YouFor enquiries, please contact:
Jasmine Loo(Investor Relations)Tel: +60 3 2279 9873Fax: +60 3 2279 9889
Email: [email protected]
www.cmmt.com.my
Recommended