Embed Size (px)
Citation preview
28 AmFIRST annual report 2010 29AmFIRST annual report 2010
MenARA AmBAnK
Location : No. 8, Menara AmBank Jalan Yap Kwan Seng 50450 Kuala Lumpur
Description Of Property : 46-storey office building comprising of a 38-storey office tower block, a 1-level cafeteria and a 7-level car park
Title Details : Title No. Geran 52468 Lot No. 140, Section 44 Town and District of Kuala Lumpur State of Federal Territory of Kuala Lumpur
Tenure : Freehold
Encumbrances : Nil
Year of Completion : 1997
Age of Building : 13 years
Net Lettable Area : 458,522 sq ft
Existing Use : Commercial Office
Car Park : 795 bays
Number of Tenants : 22
Acquisition Cost : RM230.16m
Latest Revaluation : RM292.50m
Date of Revaluation : 1 March 2010
Occupancy Rate : 94.58%
Gross Revenue : RM24.23m
Net Property Income : RM15.18m
Major Capital Expenditure : Nil
Average Lease Period : 3 years
Valuer : WTW International C H William Talhar & Wong Sdn Bhd
BANKING & FINANCIAL INSTITUTIONS
OIL & GAS
TELECOMMUNICATION/ IT/ ELECTRONIC/ ELECTRICAL
FOOD & BEVERAGES
CONSTRUCTION & REAL ESTATE
HEALTH
SURVEILLANCE & SECURITY
SERVICES & OTHERS
12,4
41
81,0
77
2,65
0
12,5
88
TENANCY RENEWAL PROFILE - MAB
TENANT MIX - MAB
Sq Ft
Financial Year Ending 31 March
Total (Sq Ft)AmBank Group (Sq Ft)
350,000
300,000
250,000
200,000
150,000
100,000
50,000
0201320122011
316,
577
339,
998
AmBank % total %Fye group (sq ft) (sq ft)
2011 2,650 0.61 12,588 2.902012 12,441 2.87 81,077 18.702013 316,577 73.00 339,998 78.40
totAL 331,668 76.48 433,663 100.00
Major tenants1. AmBank Group2. Germanischer Lloyd (M) Sdn Bhd3. Acer Sales & Services Sdn Bhd
tenAncy RenewAL pRoFILe
cAtegoRy sQ Ft %
Banking & Financial Institutions* 331,668 76.48Oil & Gas 37,260 8.59Telecommunication/ It/ Electronic/ Electrical 24,031 5.54Services & Others 19,440 4.48Food & Beverages 12,569 2.90Construction & Real Estate 4,415 1.02Health 2,349 0.54Surveillance & Security 1,931 0.45
total 433,663 100.00
* including AmAssurance
BANKING & FINANCIAL INSTITUTIONS
OIL & GAS
TELECOMMUNICATION/ IT/ ELECTRONIC/ ELECTRICAL
FOOD & BEVERAGES
CONSTRUCTION & REAL ESTATE
HEALTH
SURVEILLANCE & SECURITY
SERVICES & OTHERS
12,4
41
81,0
77
2,65
0
12,5
88
TENANCY RENEWAL PROFILE - MAB
TENANT MIX - MAB
Sq Ft
Financial Year Ending 31 March
Total (Sq Ft)AmBank Group (Sq Ft)
350,000
300,000
250,000
200,000
150,000
100,000
50,000
0201320122011
316,
577
339,
998
tenAnt tRAde MIx AnALysIs
pRopeRty poRtFoLIo (cont’d)
30 AmFIRST annual report 2010 31AmFIRST annual report 2010
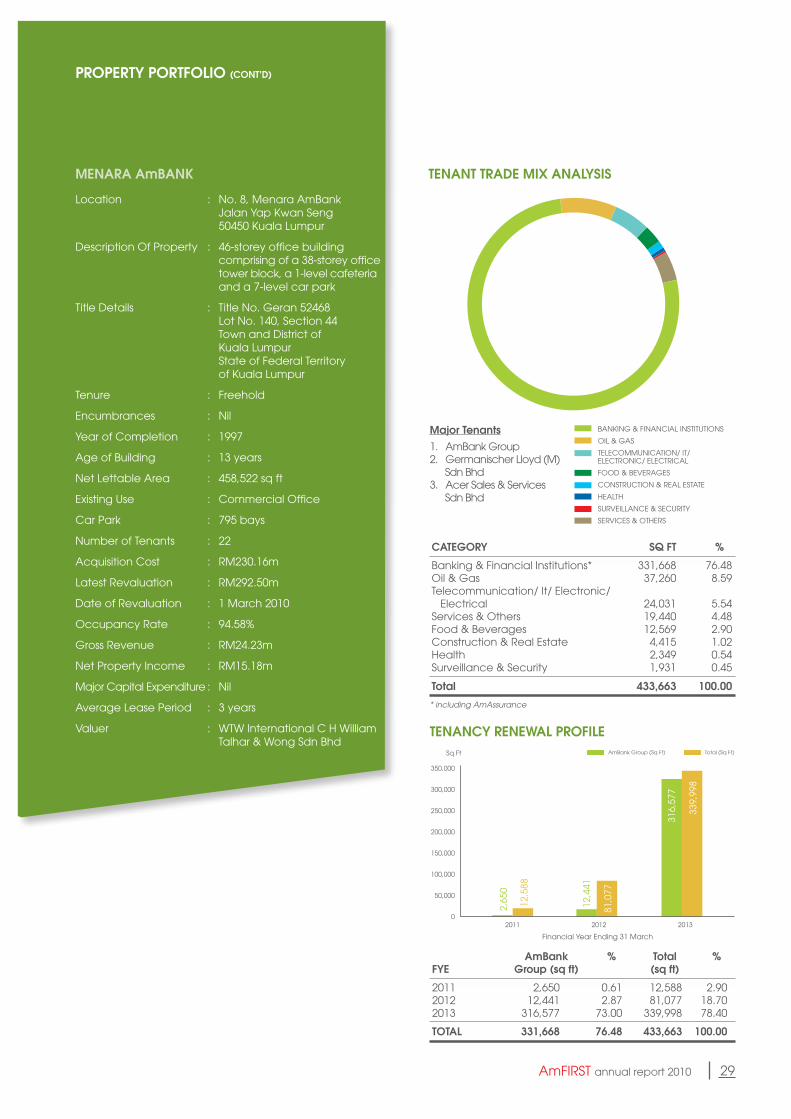
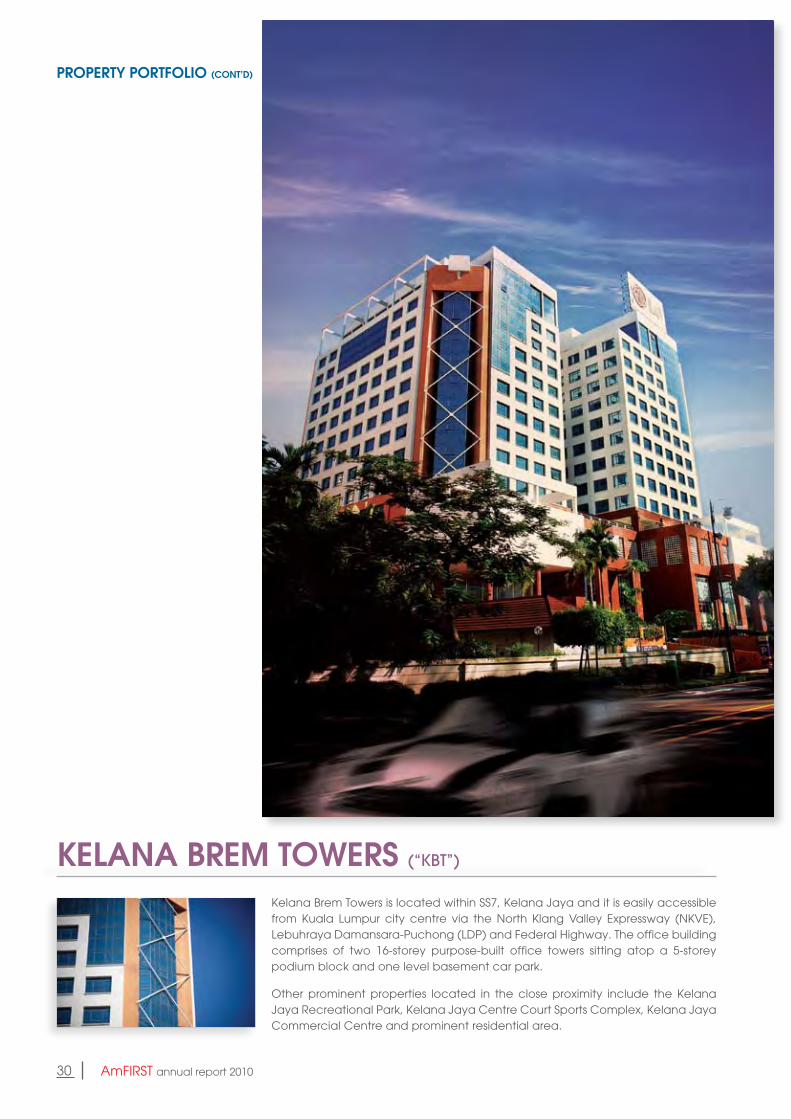
Kelana Brem Towers is located within SS7, Kelana Jaya and it is easily accessible from Kuala Lumpur city centre via the North Klang Valley Expressway (NKVE), Lebuhraya Damansara-Puchong (LDP) and Federal Highway. The office building comprises of two 16-storey purpose-built office towers sitting atop a 5-storey podium block and one level basement car park.
Other prominent properties located in the close proximity include the Kelana Jaya Recreational Park, Kelana Jaya Centre Court Sports Complex, Kelana Jaya Commercial Centre and prominent residential area.
KeLAnA BReM toweRs (“kbt”)
pRopeRty poRtFoLIo (cont’d)
30 AmFIRST annual report 2010 31AmFIRST annual report 2010
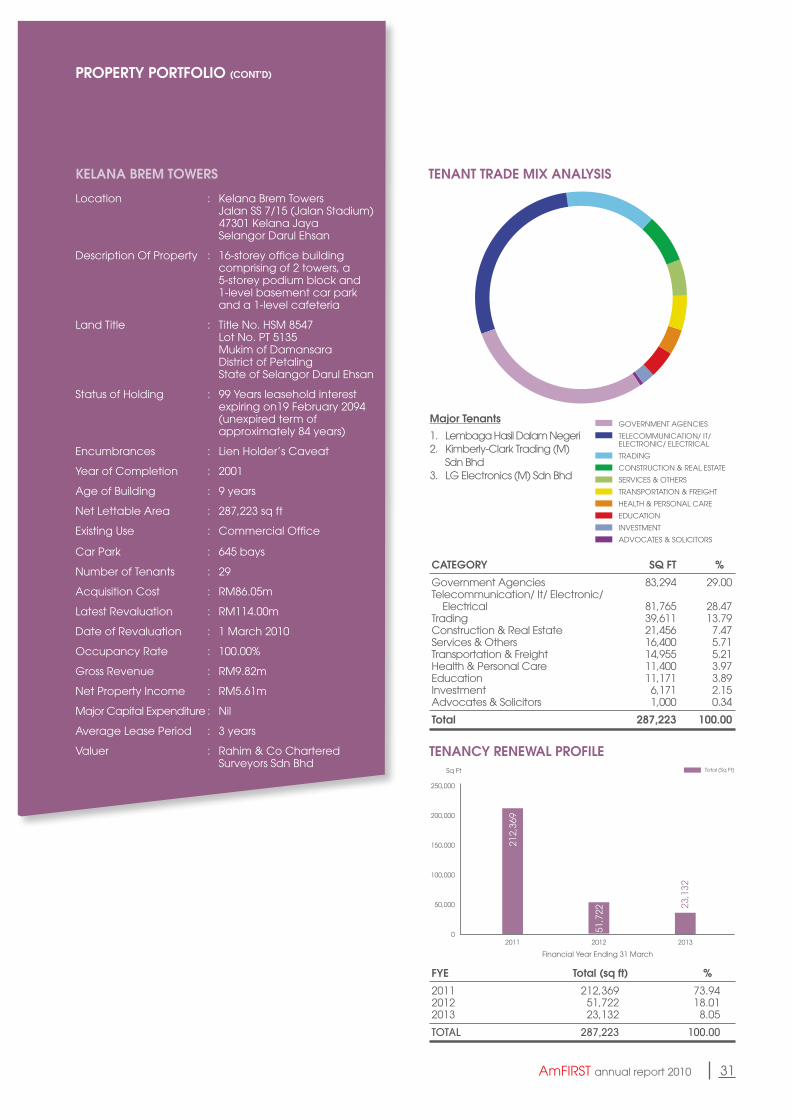
KeLAnA BReM toweRs
Location : Kelana Brem Towers Jalan SS 7/15 (Jalan Stadium) 47301 Kelana Jaya Selangor Darul Ehsan
Description Of Property : 16-storey office building comprising of 2 towers, a 5-storey podium block and 1-level basement car park and a 1-level cafeteria
Land Title : Title No. HSM 8547 Lot No. PT 5135 Mukim of Damansara District of Petaling State of Selangor Darul Ehsan
Status of Holding : 99 Years leasehold interest expiring on19 February 2094 (unexpired term of approximately 84 years)
Encumbrances : Lien Holder’s Caveat
Year of Completion : 2001
Age of Building : 9 years
Net Lettable Area : 287,223 sq ft
Existing Use : Commercial Office
Car Park : 645 bays
Number of Tenants : 29
Acquisition Cost : RM86.05m
Latest Revaluation : RM114.00m
Date of Revaluation : 1 March 2010
Occupancy Rate : 100.00%
Gross Revenue : RM9.82m
Net Property Income : RM5.61m
Major Capital Expenditure : Nil
Average Lease Period : 3 years
Valuer : Rahim & Co Chartered Surveyors Sdn Bhd
GOVERNMENT AGENCIES
TELECOMMUNICATION/ IT/ ELECTRONIC/ ELECTRICAL
TRADING
CONSTRUCTION & REAL ESTATE
SERVICES & OTHERS
TRANSPORTATION & FREIGHT
HEALTH & PERSONAL CARE
EDUCATION
INVESTMENT
ADVOCATES & SOLICITORS
212,
369
23,1
32
51,7
22TENANCY RENEWAL PROFILE - KBT
TENANT MIX - KBT
Sq Ft
Financial Year Ending 31 March
Total (Sq Ft)
250,000
200,000
150,000
100,000
50,000
0201320122011
316,
577
339,
998
Major tenants
1. Lembaga Hasil Dalam Negeri2. Kimberly-Clark Trading (M) Sdn Bhd3. LG Electronics (M) Sdn Bhd
cAtegoRy sQ Ft %
Government Agencies 83,294 29.00Telecommunication/ It/ Electronic/ Electrical 81,765 28.47Trading 39,611 13.79Construction & Real Estate 21,456 7.47Services & Others 16,400 5.71Transportation & Freight 14,955 5.21Health & Personal Care 11,400 3.97Education 11,171 3.89Investment 6,171 2.15Advocates & Solicitors 1,000 0.34
total 287,223 100.00
GOVERNMENT AGENCIES
TELECOMMUNICATION/ IT/ ELECTRONIC/ ELECTRICAL
TRADING
CONSTRUCTION & REAL ESTATE
SERVICES & OTHERS
TRANSPORTATION & FREIGHT
HEALTH & PERSONAL CARE
EDUCATION
INVESTMENT
ADVOCATES & SOLICITORS
212,
369
23,1
32
51,7
22
TENANCY RENEWAL PROFILE - KBT
TENANT MIX - KBT
Sq Ft
Financial Year Ending 31 March
Total (Sq Ft)
250,000
200,000
150,000
100,000
50,000
0201320122011
316,
577
339,
998
Fye total (sq ft) %
2011 212,369 73.942012 51,722 18.012013 23,132 8.05
tOtal 287,223 100.00
tenAnt tRAde MIx AnALysIs
tenAncy RenewAL pRoFILe
pRopeRty poRtFoLIo (cont’d)
32 AmFIRST annual report 2010 33AmFIRST annual report 2010
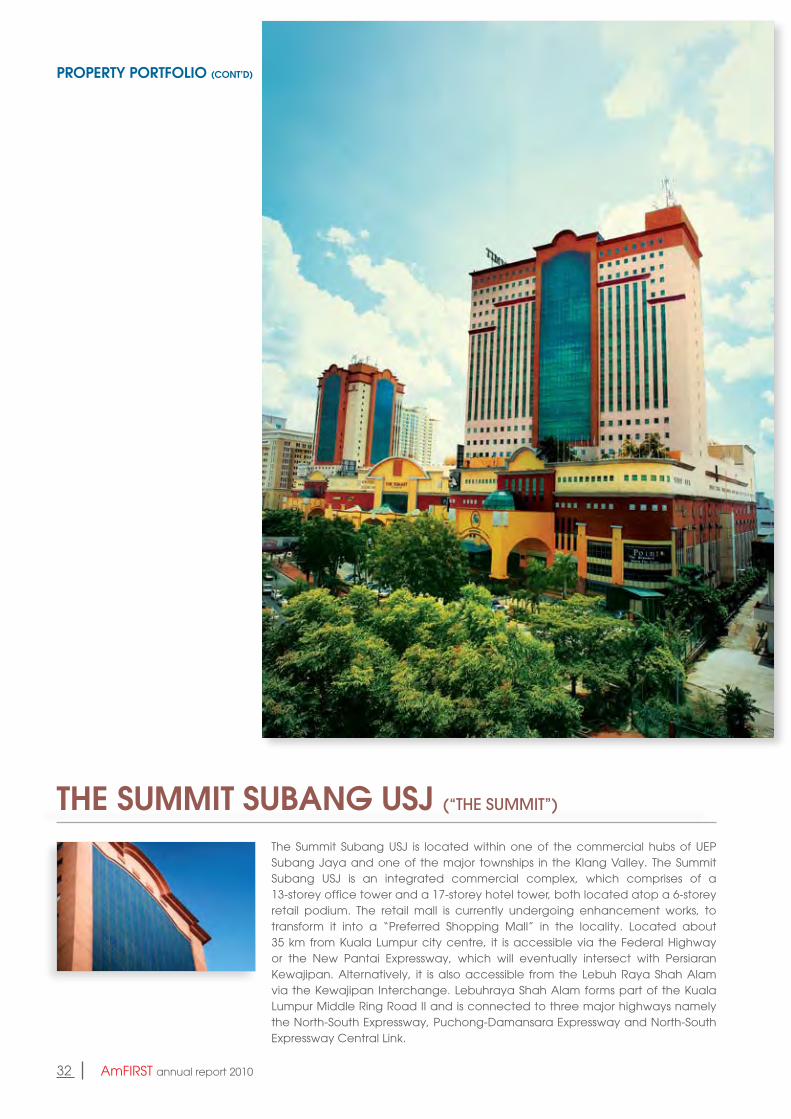
The Summit Subang USJ is located within one of the commercial hubs of UEP Subang Jaya and one of the major townships in the Klang Valley. The Summit Subang USJ is an integrated commercial complex, which comprises of a 13-storey office tower and a 17-storey hotel tower, both located atop a 6-storey retail podium. The retail mall is currently undergoing enhancement works, to transform it into a “Preferred Shopping Mall” in the locality. Located about 35 km from Kuala Lumpur city centre, it is accessible via the Federal Highway or the New Pantai Expressway, which will eventually intersect with Persiaran Kewajipan. Alternatively, it is also accessible from the Lebuh Raya Shah Alam via the Kewajipan Interchange. Lebuhraya Shah Alam forms part of the Kuala Lumpur Middle Ring Road II and is connected to three major highways namely the North-South Expressway, Puchong-Damansara Expressway and North-South Expressway Central Link.
tHe sUMMIt sUBAng UsJ (“tHe summit”)
pRopeRty poRtFoLIo (cont’d)
32 AmFIRST annual report 2010 33AmFIRST annual report 2010
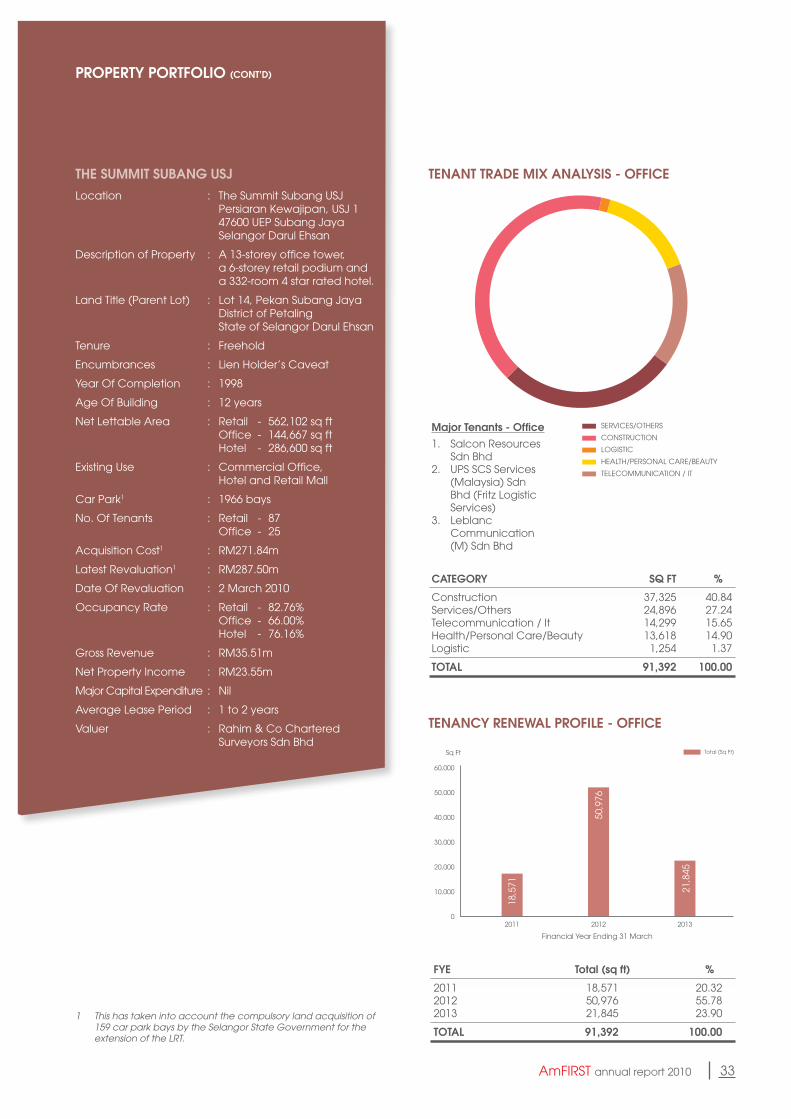
tHe sUMMIt sUBAng UsJLocation : The Summit Subang USJ Persiaran Kewajipan, USJ 1 47600 UEP Subang Jaya Selangor Darul Ehsan
Description of Property : A 13-storey office tower, a 6-storey retail podium and a 332-room 4 star rated hotel.
Land Title (Parent Lot) : Lot 14, Pekan Subang Jaya District of Petaling State of Selangor Darul Ehsan
Tenure : Freehold
Encumbrances : Lien Holder’s Caveat
Year Of Completion : 1998
Age Of Building : 12 years
Net Lettable Area : Retail - 562,102 sq ft Office - 144,667 sq ft Hotel - 286,600 sq ft
Existing Use : Commercial Office, Hotel and Retail Mall
Car Park1 : 1966 bays
No. Of Tenants : Retail - 87 Office - 25
Acquisition Cost1 : RM271.84m
Latest Revaluation1 : RM287.50m
Date Of Revaluation : 2 March 2010
Occupancy Rate : Retail - 82.76% Office - 66.00% Hotel - 76.16%
Gross Revenue : RM35.51m
Net Property Income : RM23.55m
Major Capital Expenditure : Nil
Average Lease Period : 1 to 2 years
Valuer : Rahim & Co Chartered Surveyors Sdn Bhd
tenAnt tRAde MIx AnALysIs - oFFIce
tenAncy RenewAL pRoFILe - oFFIce
cAtegoRy sQ Ft %
Construction 37,325 40.84Services/Others 24,896 27.24Telecommunication / It 14,299 15.65Health/Personal Care/Beauty 13,618 14.90Logistic 1,254 1.37
totAL 91,392 100.00
Fye total (sq ft) %
2011 18,571 20.322012 50,976 55.782013 21,845 23.90
totAL 91,392 100.001 This has taken into account the compulsory land acquisition of
159 car park bays by the Selangor State Government for the extension of the LRT.
LEISURE & ENTERTAINMENT, SPORTS & FITNESS
ANCHOR (SUPERMARKET & DEPT. STORE)
EDUCATION/ENRICHMENT(COLLEGE)/AUDITORIUM
F&B/FAST FOOD/FOOD RETAIL/FOOD COURT
FASHION APPAREL/ACCESSS.
HOBBIES,JEWELLERY/TIME PIECE/GIFTS & SPECIALTY
ELECTRICAL/TELECOMMUNICATION
SERVICES & OTHERS
HOMES IMPROVEMENT/FURNITURE
HEALTH/PERSONAL CARE/BEAUTY
148,
784
134,
950
145,
851
TENANCY RENEWAL PROFILE - SUMMIT - RETAIL
TENANT MIX - SUMMIT - RETAIL
Sq Ft
Financial Year Ending 31 March
Total (Sq Ft)
150,000
145,000
140,000
135,000
130,000
125,000201320122011
SERVICES/OTHERS
CONSTRUCTION
LOGISTIC
HEALTH/PERSONAL CARE/BEAUTY
TELECOMMUNICATION / IT
18,5
71
50,9
76
21,8
45
TENANCY RENEWAL PROFILE - SUMMIT - OFFICE
TENANT MIX - SUMMIT - OFFICE
Sq Ft
Financial Year Ending 31 March
Total (Sq Ft)
60,000
50,000
40,000
30,000
20,000
10,000
0201320122011
LEISURE & ENTERTAINMENT, SPORTS & FITNESS
ANCHOR (SUPERMARKET & DEPT. STORE)
EDUCATION/ENRICHMENT(COLLEGE)/AUDITORIUM
F&B/FAST FOOD/FOOD RETAIL/FOOD COURT
FASHION APPAREL/ACCESSS.
HOBBIES,JEWELLERY/TIME PIECE/GIFTS & SPECIALTY
ELECTRICAL/TELECOMMUNICATION
SERVICES & OTHERS
HOMES IMPROVEMENT/FURNITURE
HEALTH/PERSONAL CARE/BEAUTY
148,
784
134,
950
145,
851
TENANCY RENEWAL PROFILE - SUMMIT - RETAIL
TENANT MIX - SUMMIT - RETAIL
Sq Ft
Financial Year Ending 31 March
Total (Sq Ft)
150,000
145,000
140,000
135,000
130,000
125,000201320122011
SERVICES/OTHERS
CONSTRUCTION
LOGISTIC
HEALTH/PERSONAL CARE/BEAUTY
TELECOMMUNICATION / IT18
,571
50,9
76
21,8
45
TENANCY RENEWAL PROFILE - SUMMIT - OFFICE
TENANT MIX - SUMMIT - OFFICE
Sq Ft
Financial Year Ending 31 March
Total (Sq Ft)
60,000
50,000
40,000
30,000
20,000
10,000
0201320122011
Major tenants - office1. Salcon Resources
Sdn Bhd2. UPS SCS Services
(Malaysia) Sdn Bhd (Fritz Logistic Services)
3. Leblanc Communication (M) Sdn Bhd
pRopeRty poRtFoLIo (cont’d)
34 AmFIRST annual report 2010 35AmFIRST annual report 2010
tenAnt tRAde MIx AnALysIs - RetAIL tenAncy RenewAL pRoFILe - RetAIL
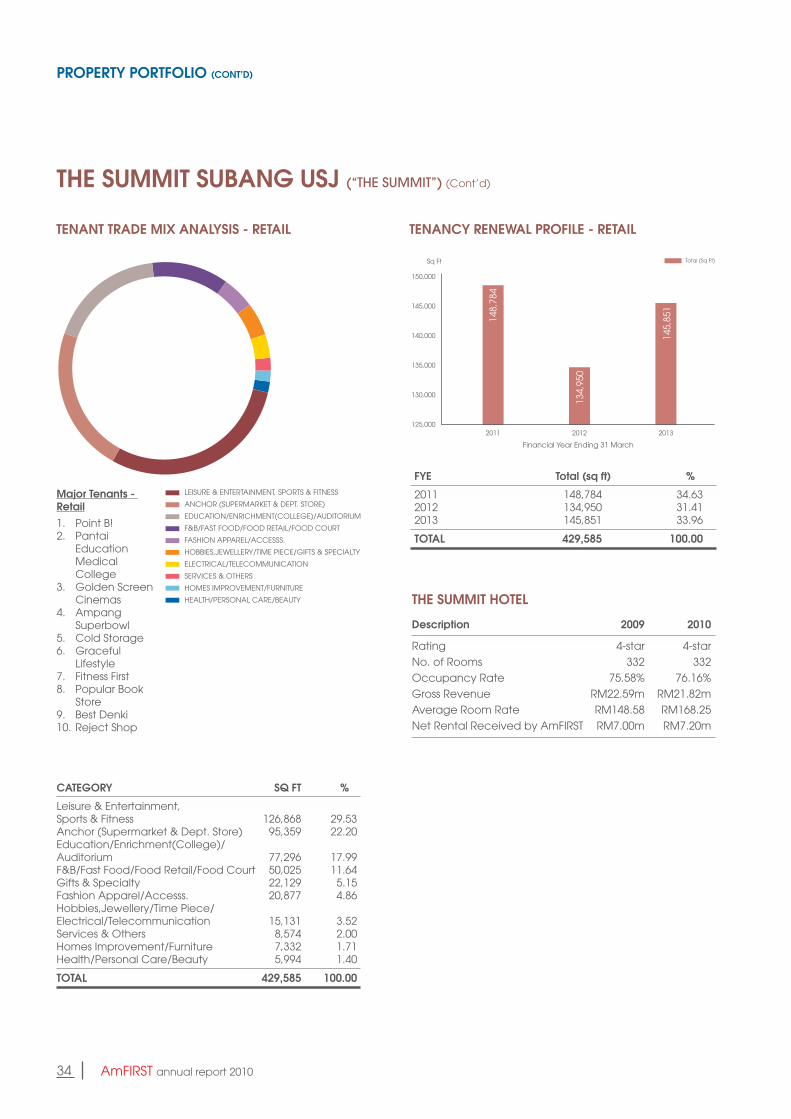
cAtegoRy sQ Ft %
Leisure & Entertainment, Sports & Fitness 126,868 29.53Anchor (Supermarket & Dept. Store) 95,359 22.20Education/Enrichment(College)/Auditorium 77,296 17.99F&B/Fast Food/Food Retail/Food Court 50,025 11.64Gifts & Specialty 22,129 5.15Fashion Apparel/Accesss. 20,877 4.86Hobbies,Jewellery/Time Piece/Electrical/Telecommunication 15,131 3.52Services & Others 8,574 2.00Homes Improvement/Furniture 7,332 1.71Health/Personal Care/Beauty 5,994 1.40
totAL 429,585 100.00
Fye total (sq ft) %
2011 148,784 34.632012 134,950 31.412013 145,851 33.96
totAL 429,585 100.00
LEISURE & ENTERTAINMENT, SPORTS & FITNESS
ANCHOR (SUPERMARKET & DEPT. STORE)
EDUCATION/ENRICHMENT(COLLEGE)/AUDITORIUM
F&B/FAST FOOD/FOOD RETAIL/FOOD COURT
FASHION APPAREL/ACCESSS.
HOBBIES,JEWELLERY/TIME PIECE/GIFTS & SPECIALTY
ELECTRICAL/TELECOMMUNICATION
SERVICES & OTHERS
HOMES IMPROVEMENT/FURNITURE
HEALTH/PERSONAL CARE/BEAUTY
148,
784
134,
950
145,
851
TENANCY RENEWAL PROFILE - SUMMIT - RETAIL
TENANT MIX - SUMMIT - RETAIL
Sq Ft
Financial Year Ending 31 March
Total (Sq Ft)
150,000
145,000
140,000
135,000
130,000
125,000201320122011
SERVICES/OTHERS
CONSTRUCTION
LOGISTIC
HEALTH/PERSONAL CARE/BEAUTY
TELECOMMUNICATION / IT
18,5
71
50,9
76
21,8
45
TENANCY RENEWAL PROFILE - SUMMIT - OFFICE
TENANT MIX - SUMMIT - OFFICE
Sq Ft
Financial Year Ending 31 March
Total (Sq Ft)
60,000
50,000
40,000
30,000
20,000
10,000
0201320122011
LEISURE & ENTERTAINMENT, SPORTS & FITNESS
ANCHOR (SUPERMARKET & DEPT. STORE)
EDUCATION/ENRICHMENT(COLLEGE)/AUDITORIUM
F&B/FAST FOOD/FOOD RETAIL/FOOD COURT
FASHION APPAREL/ACCESSS.
HOBBIES,JEWELLERY/TIME PIECE/GIFTS & SPECIALTY
ELECTRICAL/TELECOMMUNICATION
SERVICES & OTHERS
HOMES IMPROVEMENT/FURNITURE
HEALTH/PERSONAL CARE/BEAUTY
148,
784
134,
950
145,
851
TENANCY RENEWAL PROFILE - SUMMIT - RETAIL
TENANT MIX - SUMMIT - RETAIL
Sq Ft
Financial Year Ending 31 March
Total (Sq Ft)
150,000
145,000
140,000
135,000
130,000
125,000201320122011
SERVICES/OTHERS
CONSTRUCTION
LOGISTIC
HEALTH/PERSONAL CARE/BEAUTY
TELECOMMUNICATION / IT18
,571
50,9
76
21,8
45
TENANCY RENEWAL PROFILE - SUMMIT - OFFICE
TENANT MIX - SUMMIT - OFFICE
Sq Ft
Financial Year Ending 31 March
Total (Sq Ft)
60,000
50,000
40,000
30,000
20,000
10,000
0201320122011
tHe sUMMIt HoteL
description 2009 2010
Rating 4-star 4-starNo. of Rooms 332 332Occupancy Rate 75.58% 76.16%Gross Revenue RM22.59m RM21.82mAverage Room Rate RM148.58 RM168.25Net Rental Received by AmFIRST RM7.00m RM7.20m
Major tenants - Retail1. Point B!2. Pantai
Education Medical
College3. Golden Screen
Cinemas4. Ampang
Superbowl5. Cold Storage6. Graceful
Lifestyle7. Fitness First8. Popular Book
Store9. Best Denki10. Reject Shop
pRopeRty poRtFoLIo (cont’d)
tHe sUMMIt sUBAng UsJ (“tHe summit”) (Cont’d)
34 AmFIRST annual report 2010 35AmFIRST annual report 2010
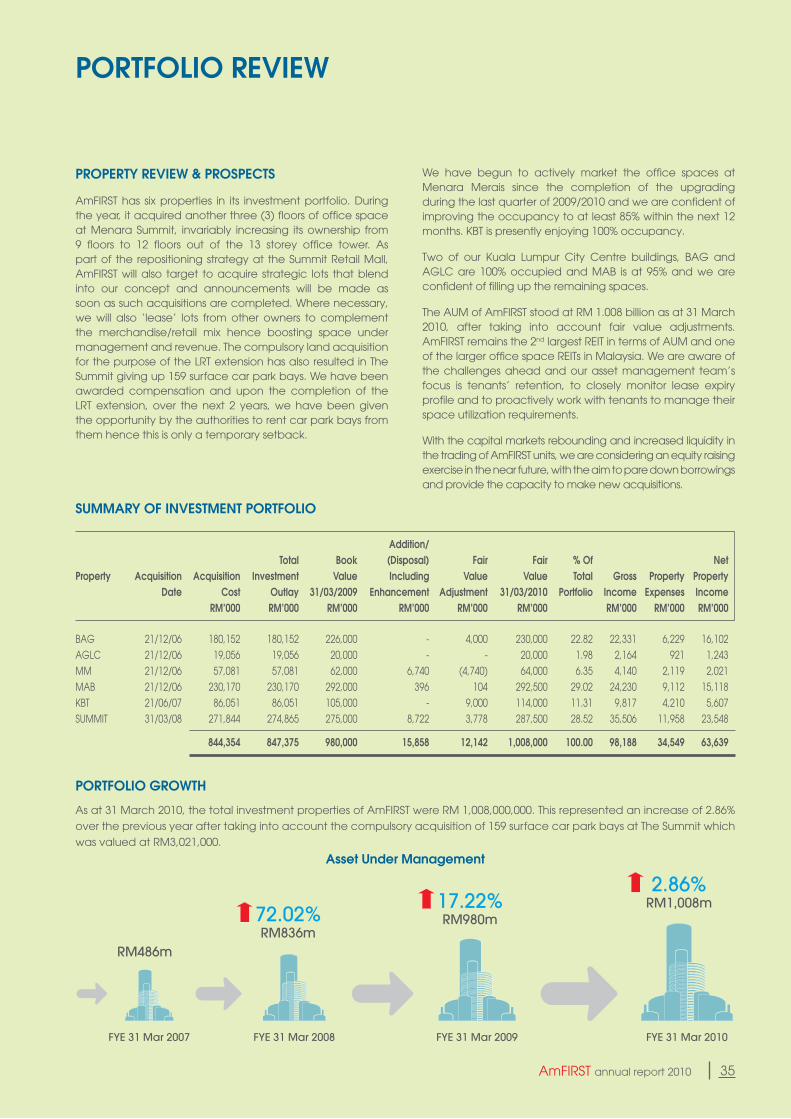
pRopeRty ReVIew & pRospects
AmFIRST has six properties in its investment portfolio. During the year, it acquired another three (3) floors of office space at Menara Summit, invariably increasing its ownership from 9 floors to 12 floors out of the 13 storey office tower. As part of the repositioning strategy at the Summit Retail Mall, AmFIRST will also target to acquire strategic lots that blend into our concept and announcements will be made as soon as such acquisitions are completed. Where necessary, we will also ‘lease’ lots from other owners to complement the merchandise/retail mix hence boosting space under management and revenue. The compulsory land acquisition for the purpose of the LRT extension has also resulted in The Summit giving up 159 surface car park bays. We have been awarded compensation and upon the completion of the LRT extension, over the next 2 years, we have been given the opportunity by the authorities to rent car park bays from them hence this is only a temporary setback.
sUMMARy oF InVestMent poRtFoLIo
Addition/ total Book (disposal) Fair Fair % of netproperty Acquisition Acquisition Investment Value Including Value Value total gross property property date cost outlay 31/03/2009 enhancement Adjustment 31/03/2010 portfolio Income expenses Income RM’000 RM’000 RM’000 RM’000 RM’000 RM’000 RM’000 RM’000 RM’000
BAG 21/12/06 180,152 180,152 226,000 - 4,000 230,000 22.82 22,331 6,229 16,102AGLC 21/12/06 19,056 19,056 20,000 - - 20,000 1.98 2,164 921 1,243MM 21/12/06 57,081 57,081 62,000 6,740 (4,740) 64,000 6.35 4,140 2,119 2,021MAB 21/12/06 230,170 230,170 292,000 396 104 292,500 29.02 24,230 9,112 15,118KBT 21/06/07 86,051 86,051 105,000 - 9,000 114,000 11.31 9,817 4,210 5,607SUMMIT 31/03/08 271,844 274,865 275,000 8,722 3,778 287,500 28.52 35,506 11,958 23,548
844,354 847,375 980,000 15,858 12,142 1,008,000 100.00 98,188 34,549 63,639
We have begun to actively market the office spaces at Menara Merais since the completion of the upgrading during the last quarter of 2009/2010 and we are confident of improving the occupancy to at least 85% within the next 12 months. KBT is presently enjoying 100% occupancy.
Two of our Kuala Lumpur City Centre buildings, BAG and AGLC are 100% occupied and MAB is at 95% and we are confident of filling up the remaining spaces.
The AUM of AmFIRST stood at RM 1.008 billion as at 31 March 2010, after taking into account fair value adjustments. AmFIRST remains the 2nd largest REIT in terms of AUM and one of the larger office space REITs in Malaysia. We are aware of the challenges ahead and our asset management team’s focus is tenants’ retention, to closely monitor lease expiry profile and to proactively work with tenants to manage their space utilization requirements.
With the capital markets rebounding and increased liquidity in the trading of AmFIRST units, we are considering an equity raising exercise in the near future, with the aim to pare down borrowings and provide the capacity to make new acquisitions.
poRtFoLIo gRowtH
As at 31 March 2010, the total investment properties of AmFIRST were RM 1,008,000,000. This represented an increase of 2.86% over the previous year after taking into account the compulsory acquisition of 159 surface car park bays at The Summit which was valued at RM3,021,000.
poRtFoLIo ReVIew
RM486m
FYE 31 Mar 2007 FYE 31 Mar 2008 FYE 31 Mar 2009 FYE 31 Mar 2010
RM836m72.02% RM980m
17.22% RM1,008m2.86%
Asset Under Management
35AmFIRST annual report 2010
36 AmFIRST annual report 2010 37AmFIRST annual report 201036 AmFIRST annual report 2010
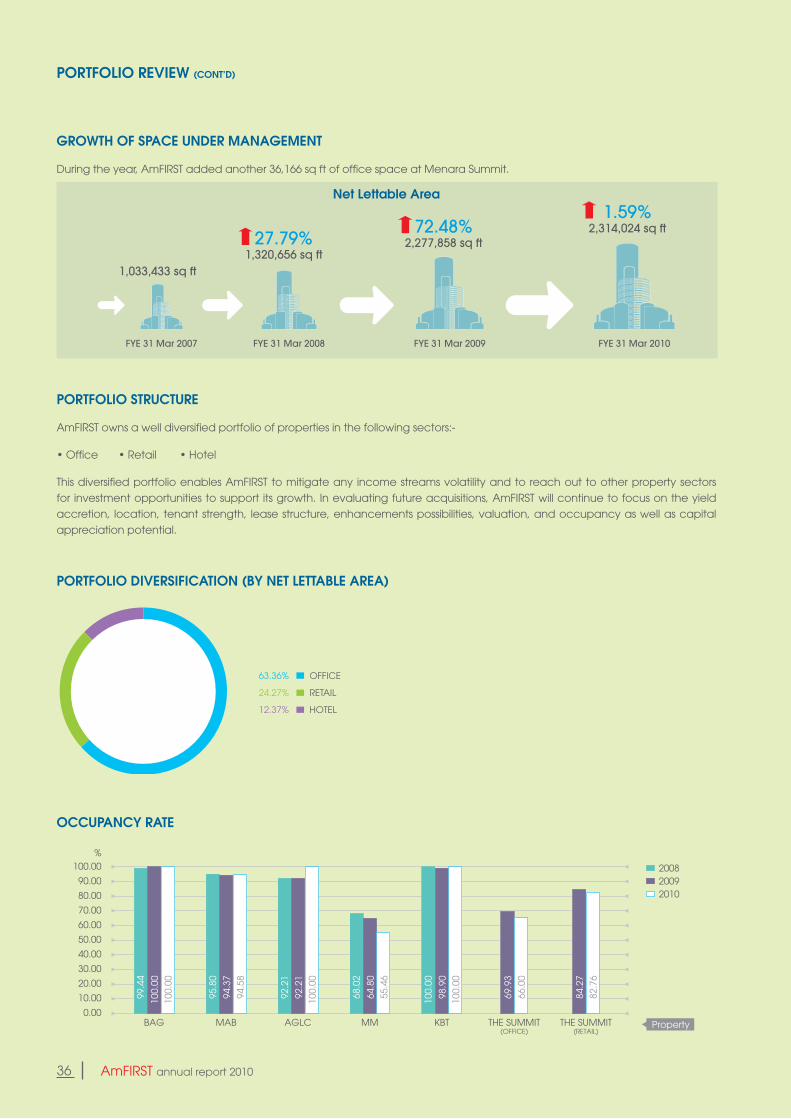
gRowtH oF spAce UndeR MAnAgeMent
During the year, AmFIRST added another 36,166 sq ft of office space at Menara Summit.
poRtFoLIo ReVIew (cont’d)
1,033,433 sq ft
FYE 31 Mar 2007 FYE 31 Mar 2008 FYE 31 Mar 2009 FYE 31 Mar 2010
1,320,656 sq ft27.79% 2,277,858 sq ft
72.48% 2,314,024 sq ft1.59%
net Lettable Area
poRtFoLIo stRUctURe
AmFIRST owns a well diversified portfolio of properties in the following sectors:-
•Office•Retail•Hotel
This diversified portfolio enables AmFIRST to mitigate any income streams volatility and to reach out to other property sectors for investment opportunities to support its growth. In evaluating future acquisitions, AmFIRST will continue to focus on the yield accretion, location, tenant strength, lease structure, enhancements possibilities, valuation, and occupancy as well as capital appreciation potential.
occUpAncy RAte
BAG MAB AGLC MM KBT THE SUMMIT(OFFICE)
THE SUMMIT(RETAIL)
200820092010
%100.00
90.00
80.00
70.00
60.00
50.00
40.00
30.00
20.00
10.00
0.00
99.4
4
100.
0010
0.00
95.8
0
94.3
794
.58
92.2
1
92.2
110
0.00
68.0
2
64.8
055
.46
100.
00
98.9
010
0.00
69.9
366
.00
84.2
782
.76
Property
poRtFoLIo dIVeRsIFIcAtIon (By net LettABLe AReA)
OFFICE
RETAIL
HOTEL
63.36%
24.27%
12.37%
36 AmFIRST annual report 2010 37AmFIRST annual report 2010 37AmFIRST annual report 2010
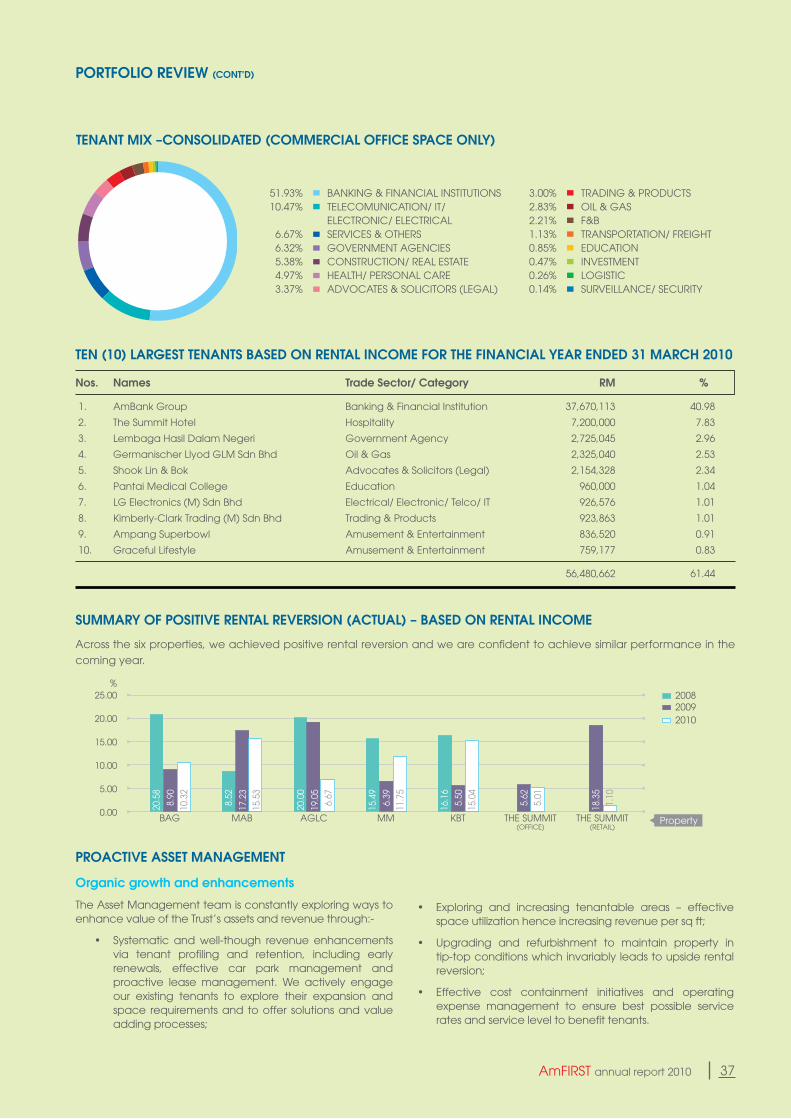
tenAnt MIx –consoLIdAted (coMMeRcIAL oFFIce spAce onLy)
poRtFoLIo ReVIew (cont’d)
ten (10) LARgest tenAnts BAsed on RentAL IncoMe FoR tHe FInAncIAL yeAR ended 31 MARcH 2010
nos. names trade sector/ category RM %
1. AmBank Group Banking & Financial Institution 37,670,113 40.98
2. The Summit Hotel Hospitality 7,200,000 7.83
3. Lembaga Hasil Dalam Negeri Government Agency 2,725,045 2.96
4. Germanischer Llyod GLM Sdn Bhd Oil & Gas 2,325,040 2.53
5. Shook Lin & Bok Advocates & Solicitors (Legal) 2,154,328 2.34
6. Pantai Medical College Education 960,000 1.04
7. LG Electronics (M) Sdn Bhd Electrical/ Electronic/ Telco/ IT 926,576 1.01
8. Kimberly-Clark Trading (M) Sdn Bhd Trading & Products 923,863 1.01
9. Ampang Superbowl Amusement & Entertainment 836,520 0.91
10. Graceful Lifestyle Amusement & Entertainment 759,177 0.83
56,480,662 61.44
51.93% BANKING & FINANCIAL INSTITUTIONS 10.47% TELECOMUNICATION/ IT/ ELECTRONIC/ ELECTRICAL 6.67% SERVICES & OTHERS 6.32% GOVERNMENT AGENCIES 5.38% CONSTRUCTION/ REAL ESTATE 4.97% HEALTH/ PERSONAL CARE 3.37% ADVOCATES & SOLICITORS (LEGAL)
3.00% TRADING & PRODUCTS 2.83% OIL & GAS 2.21% F&B 1.13% TRANSPORTATION/ FREIGHT 0.85% EDUCATION 0.47% INVESTMENT 0.26% LOGISTIC 0.14% SURVEILLANCE/ SECURITY
sUMMARy oF posItIVe RentAL ReVeRsIon (ActUAL) – BAsed on RentAL IncoMe
Across the six properties, we achieved positive rental reversion and we are confident to achieve similar performance in the coming year.
pRoActIVe Asset MAnAgeMent
organic growth and enhancements
The Asset Management team is constantly exploring ways to enhance value of the Trust’s assets and revenue through:-
• Systematic andwell-though revenue enhancementsvia tenant profiling and retention, including early renewals, effective car park management and proactive lease management. We actively engage our existing tenants to explore their expansion and space requirements and to offer solutions and value adding processes;
• Exploring and increasing tenantable areas – effectivespace utilization hence increasing revenue per sq ft;
• Upgrading and refurbishment to maintain property intip-top conditions which invariably leads to upside rental reversion;
• Effective cost containment initiatives and operatingexpense management to ensure best possible service rates and service level to benefit tenants.
PropertyBAG MAB AGLC MM KBT THE SUMMIT(OFFICE)
THE SUMMIT(RETAIL)
200820092010
%25.00
20.00
15.00
10.00
5.00
0.00 20.5
8
8.90
10.3
2
8.52
17.2
315
.53
20.0
0
19.0
56.
67
15.4
9
6.39
11.7
5
16.1
6
5.50
15.0
4
5.62
5.01
18.3
51.
10

38 AmFIRST annual report 2010 39AmFIRST annual report 2010
pRoMotIonAL ActIVItIes & InVestoR ReLAtIons
tHe sUMMIt MALL sUBAng UsJ
During the year, we organized several promotional events at The Summit which is part of our advertising and promotional activities. We also welcome a number of new retail and food & beverages tenants to The Summit during the year and look forward to attracting a more diverse merchandize mix of brands and designs to The Summit Mall in the course of our repositioning and refurbishment works currently in progress.
A&P EVENTS
New teNaNts
38 AmFIRST annual report 2010 39AmFIRST annual report 2010
pRoMotIonAL ActIVItIes & InVestoR ReLAtIons (cont’d)
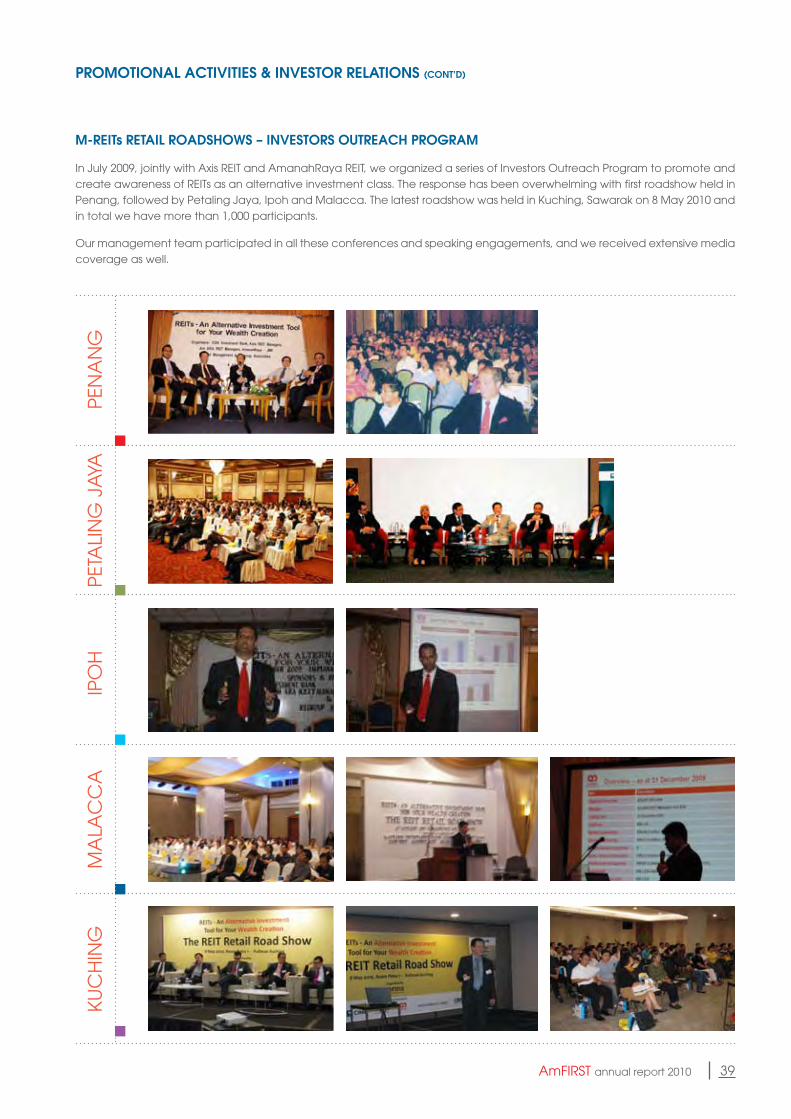
M-ReIts RetAIL RoAdsHows – InVestoRs oUtReAcH pRogRAM
In July 2009, jointly with Axis REIT and AmanahRaya REIT, we organized a series of Investors Outreach Program to promote and create awareness of REITs as an alternative investment class. The response has been overwhelming with first roadshow held in Penang, followed by Petaling Jaya, Ipoh and Malacca. The latest roadshow was held in Kuching, Sawarak on 8 May 2010 and in total we have more than 1,000 participants.
Our management team participated in all these conferences and speaking engagements, and we received extensive media coverage as well.
PEN
AN
GIP
OH
PET
ALI
NG
JA
YAM
ALA
CC
AK
UC
HIN
G
40 AmFIRST annual report 2010 41AmFIRST annual report 2010
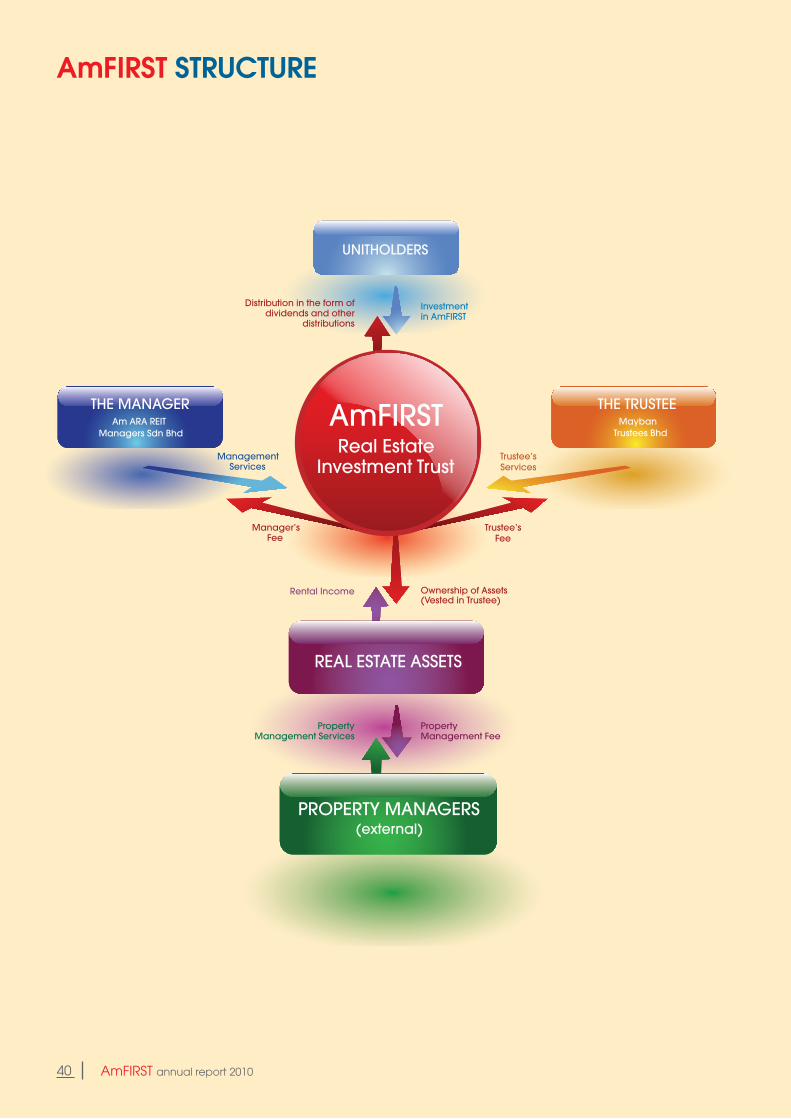
AmFIRst stRUctURe
40 AmFIRST annual report 2010
Property Management Fee
Trustee’sFee
ManagementServices
Trustee’sServices
AmFIRSTReal Estate
Investment Trust
Manager’sFee
Am ARA REITManagers Sdn Bhd
THE MANAGER THE TRUSTEEMayban
Trustees Bhd
REAL ESTATE ASSETS
UNITHOLDERS
PROPERTY MANAGERS(external)
Rental Income Ownership of Assets (Vested in Trustee)
Investment in AmFIRST
PropertyManagement Services
Distribution in the form ofdividends and other
distributions
40 AmFIRST annual report 2010 41AmFIRST annual report 2010
coRpoRAte goVeRnAnce
Am ARA REIT Managers Sdn Bhd (“Am ARA REIT”) as the Manager of AmFIRST Real Estate Investment Trust (“AmFIRST”), recognizes that an effective corporate governance culture is essential to protect the best interest of the unitholders, as well as critical to the performance of the Manager and consequently, the success of AmFIRST.
As a result, the Manager has adopted a good corporate governance framework that is designed to meet the best practice principles. In particular, the Manager has an obligation to act honestly, with due care and diligence, and in the best interests of the unitholders.
The following sections describe the Manager’s main Corporate Governance Practices and Policies which are guided by measures recommended in the Guidelines on Real Estate Investment Trust issued by the Securities Commission (“SC REIT Guidelines”), the Malaysian Code on Corporate Governance (“Code”) and the Listing requirements of Bursa Malaysia Securities Berhad (“Bursa Malaysia”) (“Bursa Listing Requirements”).
tHe MAnAgeR oF AmFIRst
Am ARA REIT as the Manager of AmFIRST has general powers of management over the assets of AmFIRST. Its main responsibility is to manage the assets and liabilities of AmFIRST for the benefit of its unitholders, with a view to providing long-term and sustainable distribution of income to its unitholders and to achieve long-term growth in the net asset value per unit, so as to provide competitive investment return to its unitholders.
The primary role of the Manager is to set the strategic directions of AmFIRST and make recommendations to Mayban Trustees Berhad (“Trustee”), as Trustee of AmFIRST on the acquisition or divestment of assets of AmFIRST in accordance with its stated investment strategy. The research, analysis and evaluation required for this purpose is co-ordinated and carried out by the Manager. The Manager is also responsible for the risk management of AmFIRST.
Other functions and responsibilities of the Manager are as follows:
• Investment Strategy – formulate and implementAmFIRST’s investment strategy, including determining the location, sub-sector, market risk, type and other characteristic of AmFIRST’s property portfolio.
• AcquisitionandDivestment–makerecommendationsto and co-ordinate with the Trustee and implement the acquisition of new assets and divestment of AmFIRST’s existing investments.
• Asset Management – supervise and oversee themanagement of AmFIRST’s properties including preparing property plans on an annual basis for review by the Directors of the Manager which may contain proposals and forecasts on net income, capital expenditure, sales and valuations, explanation of major variances to previous forecasts, written commentary on key issues and underlying assumptions on rental rates, occupancy costs and any other relevant assumptions. The purpose of these plans is to explain the performance of AmFIRST’s assets.
• Financing – formulate plans for equity and debtfinancing for AmFIRST’s funding requirements.
• AccountingRecords–keepbooksandprepareorcause to be prepared accounts and annual reports, including annual budget for AmFIRST.
• Supervisory Services – supervise day-to-dayadministrative service as AmFIRST’s representative, including administrative services relating to meetings of unitholders when such meetings are convened.
• InvestorRelations–co-ordinate,communicateandliaise with unitholders / Investors.
• ComplianceManagement–superviseallregulatoryfilings on behalf of AmFIRST, and ensure that AmFIRST is in compliance with the applicable provisions of the Securities Commission Act, the SC REIT Guidelines, Bursa Listing Requirements, the Trust Deed, and all relevant contracts.
The Manager endeavors to carry on and conduct AmFIRST’s business in a proper and efficient manner and to conduct all transactions with, or on behalf of AmFIRST, on arms length basis. The Manager also manages and supervises the service providers including the property managers CB Richard Ellis (M) Sdn Bhd (formerly known as ReGroup), Jones Lang Wootton and DTZ Nawawi Tie Leung (“property manager”), who perform day-to-day property management functions for AmFIRST’s properties pursuant to the property management agreement signed for each property.
41AmFIRST annual report 2010
42 AmFIRST annual report 2010 43AmFIRST annual report 2010
coRpoRAte goVeRnAnce (cont’d)
AmFIRST constituted as a trust, is externally managed by the Manager and accordingly, it has no personnel of its own. The Manager appoints experienced and well qualified management personnel to handle the day-to-day operations of AmFIRST. All employees of the Manager are not remunerated by AmFIRST. Am ARA REIT is appointed as the manager of AmFIRST in accordance with the terms of the Trust Deed dated 28 September 2006, which outlines the circumstances under which the Manager can be retired.
dIRectoRs oF tHe MAnAgeR
the Board
The Manager is led and managed by an experienced Board of Directors (“Board”) with a wide and varied range of expertise. This broad spectrum of skills and experience gives added strength to the leadership, thus ensuring the Manager is under the guidance of an accountable and competent Board. The Directors recognized the key role played in charting the strategic direction, development and control of the Manager and have adopted the primary responsibilities as listed in the SC REIT Guidelines as well as the roles and duties set out in the SC REIT Guidelines, which facilitate the discharge of the Directors’ stewardship responsibilities.
Board Balance
The Board has five (5) members comprising of three (3) Non-Independent Non-Executive Directors and two (2) Independent Non-Executive Directors. More than one-third of Directors are considered independent which complies with paragraph 15.02 of Bursa Listing Requirements, which requires at least one-third of the Board members to be Independent Directors. The profile of the members of the Board are provided in pages 8 to 11 of the Annual Report.
The Chief Executive Officer is responsible for the day-to-day operations and he works with the Board to determine the overall business, investment and operational strategies for AmFIRST and ensures that they are implemented as planned and in accordance with the Trust Deed, Securities Commission Act and Guidelines. In addition, the Chief Executive Officer is also responsible for the overall planning in respect of the future strategic development and growth of AmFIRST.
The Board focuses mainly on strategy, financial performance and critical business issues, including:-
• Thestrategicbusinessplans• Keyfinancialperformanceindicators• Principalrisksandtheirmanagement• Successionplanningforseniormanagement• Investorsandunitholdersrelationsprograms• Systemsofinternalcontrol
BoARd MeetIngs
Board meetings are scheduled at least four (4) times per annum to review the operations of AmFIRST and to approve the annual financial statements of AmFIRST. Additional meetings are held as and when urgent issues and important decisions need to be taken between the scheduled meetings.
The Board met four (4) times during the financial year ended 31 March 2010. The number of meetings attended by each Director is as follow:
directors designation Attendance
Dato’ Azlan Hashim Non-Independent 4 Non-Executive Chairman Cheah Tek Kuang Non-Independent 2 Non-Executive Director Dato’ Teo Chiang Quan Independent 4 Non-Executive Director Tuan Haji Salleh Akram Independent 4 Non-Executive Director Lim Hwee Chiang Non-Independent 4 Non-Executive Director
Access to and supply of Information and Advice
All Board members are supplied with information on a timely manner. The Agenda together with the full set of Board papers containing information relevant to the Board meetings are circulated to the Directors prior to the Board meetings. There is sufficient time for the Directors to review and seek clarification where necessary prior to meeting being held and this process enables the Directors to make better and informed decisions.
42 AmFIRST annual report 2010
42 AmFIRST annual report 2010 43AmFIRST annual report 2010
coRpoRAte goVeRnAnce (cont’d)
All Directors have access to the advice and services of the Company Secretary and have the right to seek independent professional advice when necessary in discharging their duties, making acquisition decisions and complying with relevant legislations and regulations.
Appointment to the Board
The Board as a whole will serve as the Nominating Committee. All new nominations received are assessed and approved by the entire Board in line with its policy of ensuring nominees are persons of sufficient caliber and experience. The process of assessing the Directors is an-going responsibility of the entire Board.
AccoUntABILIty And AUdIt
Financial Reporting
The Board is responsible for ensuring that financial statements are drawn up in accordance with the provisions of the Act, and applicable approved accounting standards in Malaysia. The Directors are satisfied that in preparing the financial statements of AmFIRST for the financial year ended 31 March 2010, AmFIRST has applied consistently, suitable accounting policies and supported by reasonable and prudent judgments and estimates.
Internal control
The Board is responsible for maintaining a system of internal control that covers financial and operational controls and risk management. The system provides reasonable but not absolute assurance against material misstatement of management and financial information or against financial losses and fraud.
Relationship with Auditors
The Board maintains a transparent relationship throughout their association with the external auditors. The appointment of external auditors, who may be nominated by the Manager, is approved by the Trustee. The auditors appointed must be independent of the Manager and Trustee. The remuneration of the auditors is approved by the Trustee.
Related party transaction and conflict of Interest
The Manager will establish procedures that will ensure that related party transactions and conflicts of interest are undertaken in full compliance with the SC REIT Guidelines, the Trust Deed and the Bursa Listing Requirements.
The Board will consider AmFIRST’s best interest in relation to decision affecting it when they vote as a member of the Board. In addition, the Directors and Chief Executive Officer of the Manager are expected to act with honesty and integrity at all times.
Risk Assessment and Management of Business Risk
The Manager operates within overall guidelines and specific parameters set by the Board. Each transaction is comprehensively analyzed to understand the risk involved. Responsibility for managing risk lies initially with the business unit concerned, working within the overall strategy outlined by the Board.
The Board reviews the risk to the assets of AmFIRST, and act upon any comments of the auditors. In assessing business risk, the Board considers the economic environment and the property industry risk.
communication with Unitholders
The Board acknowledges the importance of regular communication with unitholders and investors to ensure that they are well informed of the activities and performance of AmFIRST. The communication channels are via AmFIRST’s website, annual reports, quarterly financial reports and the various disclosures and announcements released on Bursa Malaysia’s website.
corporate social Responsibility
Corporate Social responsibility (“CSR”) is part of the organization way of succeeding in business, and is, in essence, a set of transparent and ethical actions to give back, nurture and aid in the progress of the various environments in which the corporation operates. This is to contribute to the partners, customers and sources without which the organization would not be able to succeed and prosper.
43AmFIRST annual report 2010
44 AmFIRST annual report 2010 45AmFIRST annual report 2010
coRpoRAte goVeRnAnce (cont’d)
As part of our responsibility to the market place, AmFIRST’s business transactions, deals and relationships with all its groups of customers, suppliers and partners are executed with the highest concern for transparency and ethical conduct, guided by high corporate governance standards. At the workplace, we encouraged staff to be environmentally friendly and adopt cost saving measures.
otHeR InFoRMAtIon
Family Relationship with any director and/or substantial Unitholders
None of the Directors of the Manager has any family relationship with any other Directors or major unitholders, except for Dato’ Azlan Hashim, who is a brother of Tan Sri Azman Hashim, a substantial unitholders of AmFIRST.
conflict of Interest
Save for Directors’ interests in AmFIRST (as disclosed under Director’s interests in the Manager’s Report) and the transactions with companies related to the Manager (as disclosed in the notes to the financial statements), no conflict of interest has arisen during the financial year under review.
convictions for offences
None of the Directors has been convicted for offences within the past 10 years.
Material contracts
There were no material contracts entered by the Trust that involved the Directors of the Manager or substantial unitholders of the Trust during the financial year under review.
directors’ training
All Directors are encouraged to attend briefings, seminars, conferences and continuous education programs to keep abreast with the current developments in the industry.
During the year, the directors attended various courses / seminars in related to their responsibilities and developments in the industry. Among courses / seminars attended includes Developing High Impact Board Modules 1-4 by FIDE Bank Negara, Asset Allocation Summit Asia, High Level Conference 2009 “Central Banking in the 21st Century Implications of Economic and Financial Globalization”, Development and Challenges in Regional and Local Markets, World Capital Market Symposium, Managing Strategy in a Downturn and forum on “FRS 139, Financial Investments: Recognition and Measurement”.
44 AmFIRST annual report 2010
44 AmFIRST annual report 2010 45AmFIRST annual report 2010
KLAng VALLey pRopeRty MARKet oVeRVIew 1Q 2010
1.0 pURpose BUILt oFFIces
1.1 Market overview
Despite the impact of the global financial crisis, the Klang Valley office market is moving inexorably towards a size of 100 million sq ft by 2014.
A significant percentage of this space will be occupied by industries associated with finance, IT and oil and gas together with a number of government linked companies.
The immediate impact of the financial crisis in late 2008 was the reversal of a number of sales of major office properties. In early 2009 the market was at a virtual standstill as the world took stock.
By the 2nd half of 2009, leasing activity had regained momentum although it had become clear that office rentals had peaked in the previous year.
We are now facing a five year period when new supply will add 22.4 million sq ft of new space and probably outpace absorption unless the economy improves dramatically, or unless external factors induce an inflow of tenants from other cities in the region.
On the investment front, a sellers’ market still prevails with strong interest from both domestic and overseas funds at yields starting at 6% per annum net. Despite weakening rentals, office capital values in Kuala Lumpur are expected to range between RM800 to RM1,200 per sq ft. As a yardstick, the total cost of developing new office building with ‘green’ rating on land bought at prevailing market rates is in the range of RM1,000 to RM1,200 per sq ft.
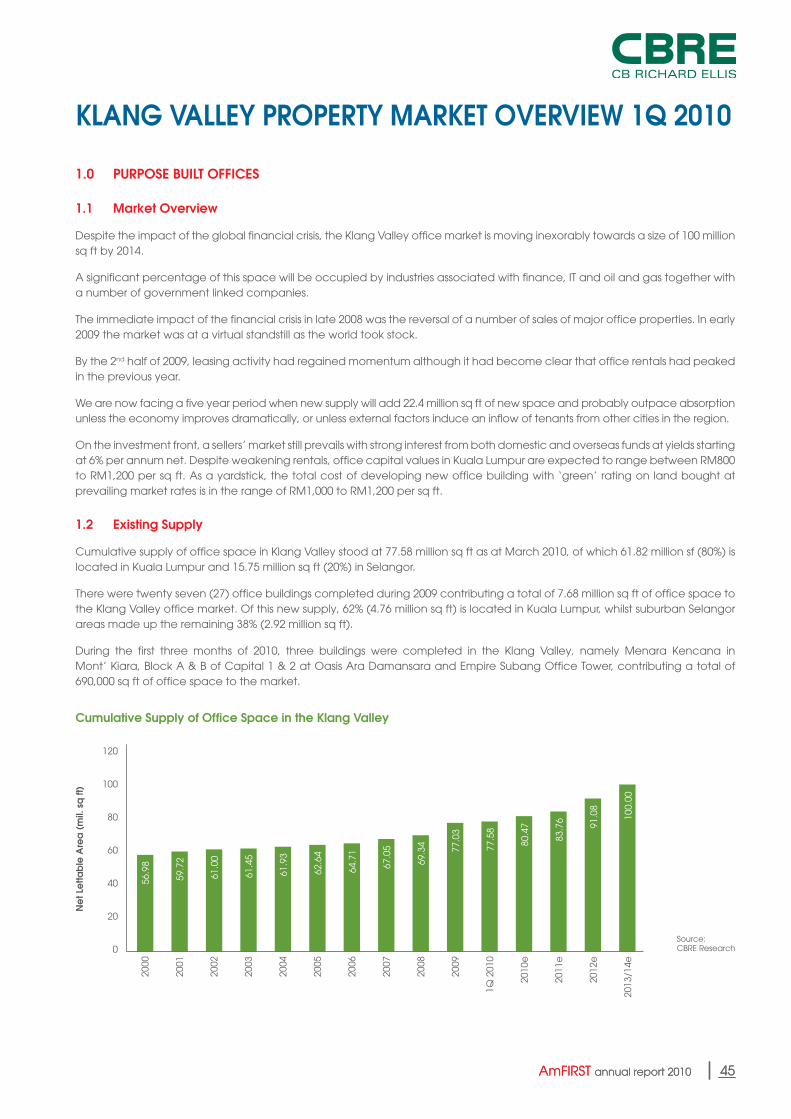
1.2 existing supply
Cumulative supply of office space in Klang Valley stood at 77.58 million sq ft as at March 2010, of which 61.82 million sf (80%) is located in Kuala Lumpur and 15.75 million sq ft (20%) in Selangor.
There were twenty seven (27) office buildings completed during 2009 contributing a total of 7.68 million sq ft of office space to the Klang Valley office market. Of this new supply, 62% (4.76 million sq ft) is located in Kuala Lumpur, whilst suburban Selangor areas made up the remaining 38% (2.92 million sq ft).
During the first three months of 2010, three buildings were completed in the Klang Valley, namely Menara Kencana in Mont’ Kiara, Block A & B of Capital 1 & 2 at Oasis Ara Damansara and Empire Subang Office Tower, contributing a total of 690,000 sq ft of office space to the market.
Source:CBRE Research
cumulative supply of office space in the Klang Valley
ne
t Le
ttab
le A
rea
(m
il. s
q ft
)
120
80
40
100
60
20
0
2000
2006
2002
2008
2004
1Q 2
010
2012
e
2001
2007
2003
2009
2011
e
2005
2010
e
2013
/14e
56.9
8
59.7
2
61.0
0
61.4
5
61.9
3
62.6
4
64.7
1
67.0
5
69.3
4 77.0
3
77.5
8
80.4
7
83.7
6 91.0
8
100.
00
45AmFIRST annual report 2010
46 AmFIRST annual report 2010 47AmFIRST annual report 2010
KLAng VALLey pRopeRty MARKet oVeRVIew 1Q 2010 (cont’d)
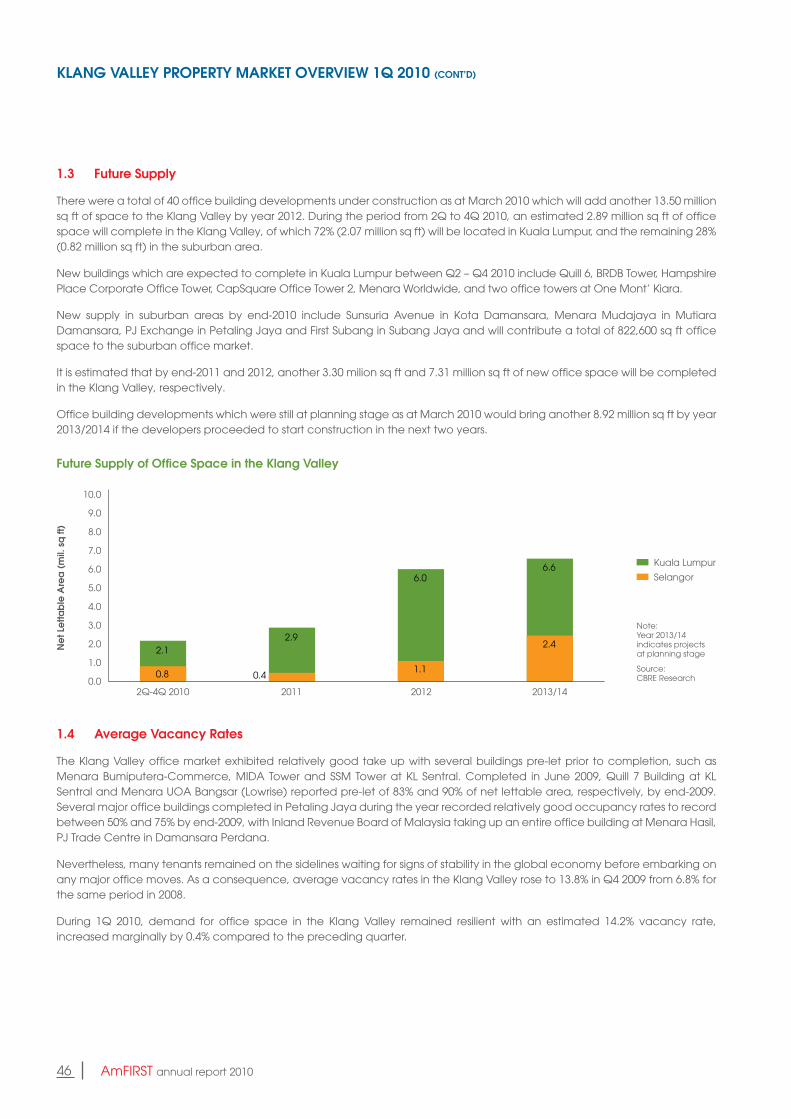
1.3 Future supply
There were a total of 40 office building developments under construction as at March 2010 which will add another 13.50 million sq ft of space to the Klang Valley by year 2012. During the period from 2Q to 4Q 2010, an estimated 2.89 million sq ft of office space will complete in the Klang Valley, of which 72% (2.07 million sq ft) will be located in Kuala Lumpur, and the remaining 28% (0.82 million sq ft) in the suburban area.
New buildings which are expected to complete in Kuala Lumpur between Q2 – Q4 2010 include Quill 6, BRDB Tower, Hampshire Place Corporate Office Tower, CapSquare Office Tower 2, Menara Worldwide, and two office towers at One Mont’ Kiara.
New supply in suburban areas by end-2010 include Sunsuria Avenue in Kota Damansara, Menara Mudajaya in Mutiara Damansara, PJ Exchange in Petaling Jaya and First Subang in Subang Jaya and will contribute a total of 822,600 sq ft office space to the suburban office market.
It is estimated that by end-2011 and 2012, another 3.30 milion sq ft and 7.31 million sq ft of new office space will be completed in the Klang Valley, respectively.
Office building developments which were still at planning stage as at March 2010 would bring another 8.92 million sq ft by year 2013/2014 if the developers proceeded to start construction in the next two years.
1.4 Average Vacancy Rates
The Klang Valley office market exhibited relatively good take up with several buildings pre-let prior to completion, such as Menara Bumiputera-Commerce, MIDA Tower and SSM Tower at KL Sentral. Completed in June 2009, Quill 7 Building at KL Sentral and Menara UOA Bangsar (Lowrise) reported pre-let of 83% and 90% of net lettable area, respectively, by end-2009. Several major office buildings completed in Petaling Jaya during the year recorded relatively good occupancy rates to record between 50% and 75% by end-2009, with Inland Revenue Board of Malaysia taking up an entire office building at Menara Hasil, PJ Trade Centre in Damansara Perdana.
Nevertheless, many tenants remained on the sidelines waiting for signs of stability in the global economy before embarking on any major office moves. As a consequence, average vacancy rates in the Klang Valley rose to 13.8% in Q4 2009 from 6.8% for the same period in 2008.
During 1Q 2010, demand for office space in the Klang Valley remained resilient with an estimated 14.2% vacancy rate, increased marginally by 0.4% compared to the preceding quarter.
Note:Year 2013/14 indicates projects at planning stage
Source:CBRE Research
Future supply of office space in the Klang Valley
ne
t Le
ttab
le A
rea
(m
il. s
q ft
)
10.0
7.0
8.0
3.0
4.0
9.0
5.0
6.0
1.0
2.0
0.02Q-4Q 2010 2011 2012 2013/14
6.06.6
2.4
1.1
Kuala Lumpur
Selangor
2.1
0.8
2.9
0.4
46 AmFIRST annual report 2010 47AmFIRST annual report 2010
KLAng VALLey pRopeRty MARKet oVeRVIew 1Q 2010 (cont’d)
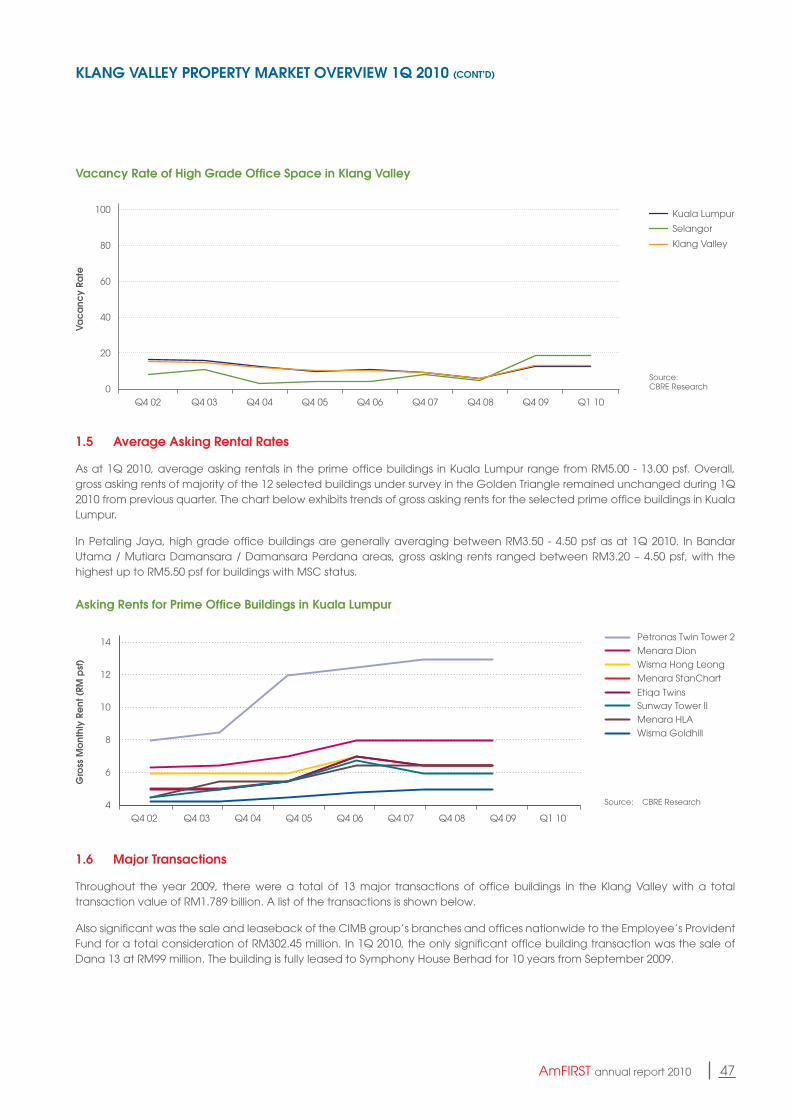
1.5 Average Asking Rental Rates
As at 1Q 2010, average asking rentals in the prime office buildings in Kuala Lumpur range from RM5.00 - 13.00 psf. Overall, gross asking rents of majority of the 12 selected buildings under survey in the Golden Triangle remained unchanged during 1Q 2010 from previous quarter. The chart below exhibits trends of gross asking rents for the selected prime office buildings in Kuala Lumpur.
In Petaling Jaya, high grade office buildings are generally averaging between RM3.50 - 4.50 psf as at 1Q 2010. In Bandar Utama / Mutiara Damansara / Damansara Perdana areas, gross asking rents ranged between RM3.20 – 4.50 psf, with the highest up to RM5.50 psf for buildings with MSC status.
1.6 Major transactions
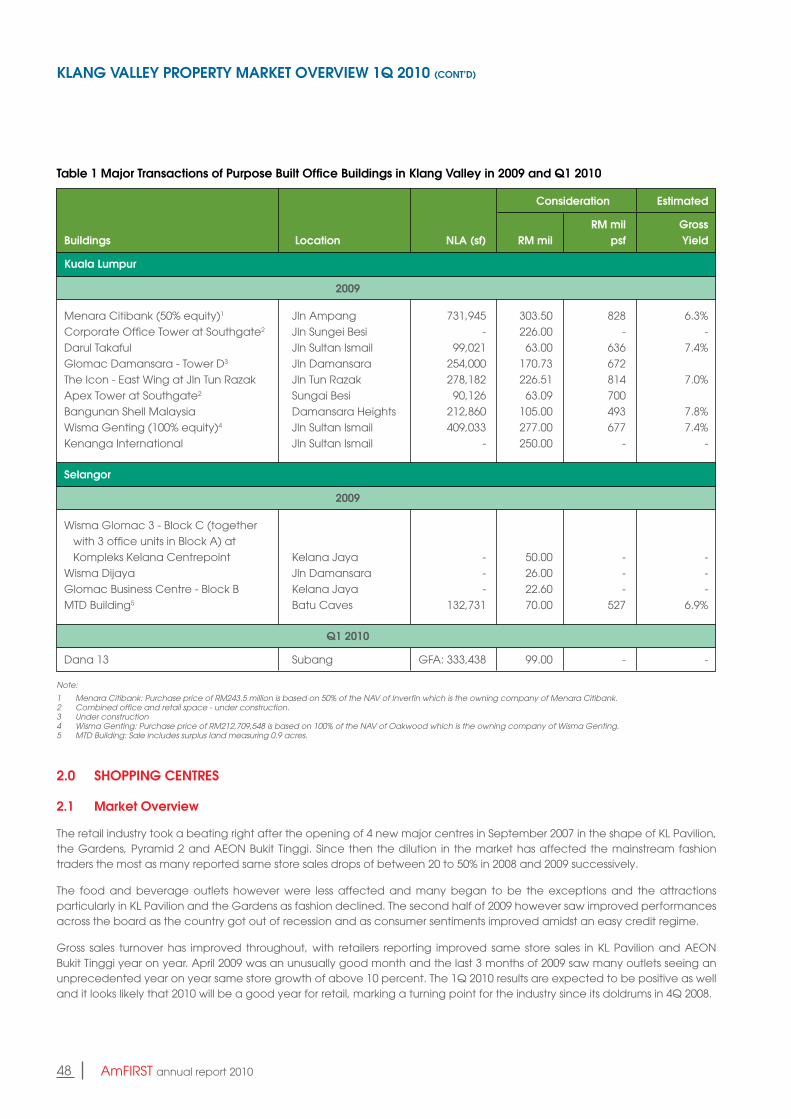
Throughout the year 2009, there were a total of 13 major transactions of office buildings in the Klang Valley with a total transaction value of RM1.789 billion. A list of the transactions is shown below.
Also significant was the sale and leaseback of the CIMB group’s branches and offices nationwide to the Employee’s Provident Fund for a total consideration of RM302.45 million. In 1Q 2010, the only significant office building transaction was the sale of Dana 13 at RM99 million. The building is fully leased to Symphony House Berhad for 10 years from September 2009.
Asking Rents for prime office Buildings in Kuala Lumpur
gro
ss M
ont
hly
Rent
(RM
psf
)
14
12
8
10
6
4Q4 02 Q4 06Q4 04 Q4 08Q4 03 Q4 07Q4 05 Q4 09 Q1 10
Petronas Twin Tower 2
Menara StanChart
Menara Dion
Wisma Hong Leong
Etiqa Twins
Menara HLASunway Tower II
Wisma Goldhill
Source: CBRE Research
Source:CBRE Research
Vacancy Rate of High grade office space in Klang Valley
Vac
anc
y Ra
te
100
80
40
60
20
0Q4 02 Q4 06Q4 04 Q4 08Q4 03 Q4 07Q4 05 Q4 09 Q1 10
Kuala Lumpur
Selangor
Klang Valley
48 AmFIRST annual report 2010 49AmFIRST annual report 2010
KLAng VALLey pRopeRty MARKet oVeRVIew 1Q 2010 (cont’d)
2.0 sHoppIng centRes
2.1 Market overview
The retail industry took a beating right after the opening of 4 new major centres in September 2007 in the shape of KL Pavilion, the Gardens, Pyramid 2 and AEON Bukit Tinggi. Since then the dilution in the market has affected the mainstream fashion traders the most as many reported same store sales drops of between 20 to 50% in 2008 and 2009 successively.
The food and beverage outlets however were less affected and many began to be the exceptions and the attractions particularly in KL Pavilion and the Gardens as fashion declined. The second half of 2009 however saw improved performances across the board as the country got out of recession and as consumer sentiments improved amidst an easy credit regime.
Gross sales turnover has improved throughout, with retailers reporting improved same store sales in KL Pavilion and AEON Bukit Tinggi year on year. April 2009 was an unusually good month and the last 3 months of 2009 saw many outlets seeing an unprecedented year on year same store growth of above 10 percent. The 1Q 2010 results are expected to be positive as well and it looks likely that 2010 will be a good year for retail, marking a turning point for the industry since its doldrums in 4Q 2008.
table 1 Major transactions of purpose Built office Buildings in Klang Valley in 2009 and Q1 2010
consideration estimated
RM mil grossBuildings Location nLA (sf) RM mil psf yield
Kuala Lumpur
2009
Menara Citibank (50% equity)1 Jln Ampang 731,945 303.50 828 6.3%Corporate Office Tower at Southgate2 Jln Sungei Besi - 226.00 - -Darul Takaful Jln Sultan Ismail 99,021 63.00 636 7.4%Glomac Damansara - Tower D3 Jln Damansara 254,000 170.73 672 The Icon - East Wing at Jln Tun Razak Jln Tun Razak 278,182 226.51 814 7.0%Apex Tower at Southgate2 Sungai Besi 90,126 63.09 700 Bangunan Shell Malaysia Damansara Heights 212,860 105.00 493 7.8%Wisma Genting (100% equity)4 Jln Sultan Ismail 409,033 277.00 677 7.4%Kenanga International Jln Sultan Ismail - 250.00 - -
selangor
2009
Wisma Glomac 3 - Block C (together with 3 office units in Block A) at Kompleks Kelana Centrepoint Kelana Jaya - 50.00 - -Wisma Dijaya Jln Damansara - 26.00 - -Glomac Business Centre - Block B Kelana Jaya - 22.60 - -MTD Building5 Batu Caves 132,731 70.00 527 6.9%
Q1 2010
Dana 13 Subang GFA: 333,438 99.00 - -
Note:
1 Menara Citibank: Purchase price of RM243.5 million is based on 50% of the NAV of Inverfin which is the owning company of Menara Citibank.2 Combined office and retail space - under construction.3 Under construction4 Wisma Genting: Purchase price of RM212,709,548 is based on 100% of the NAV of Oakwood which is the owning company of Wisma Genting.5 MTD Building: Sale includes surplus land measuring 0.9 acres.
48 AmFIRST annual report 2010 49AmFIRST annual report 2010
KLAng VALLey pRopeRty MARKet oVeRVIew 1Q 2010 (cont’d)
Going forward, the new supply coming up does not look daunting and perhaps the worse is over for the sector. New additions to the market are talk of the town at the moment and this includes the repositioned KL Plaza which will soon change its façade and name to Fahrenheit 88. It is likely to showcase new fashion majors like H & M, Uniqlo and Sephora. 2011 may well be a new era for retail yet.
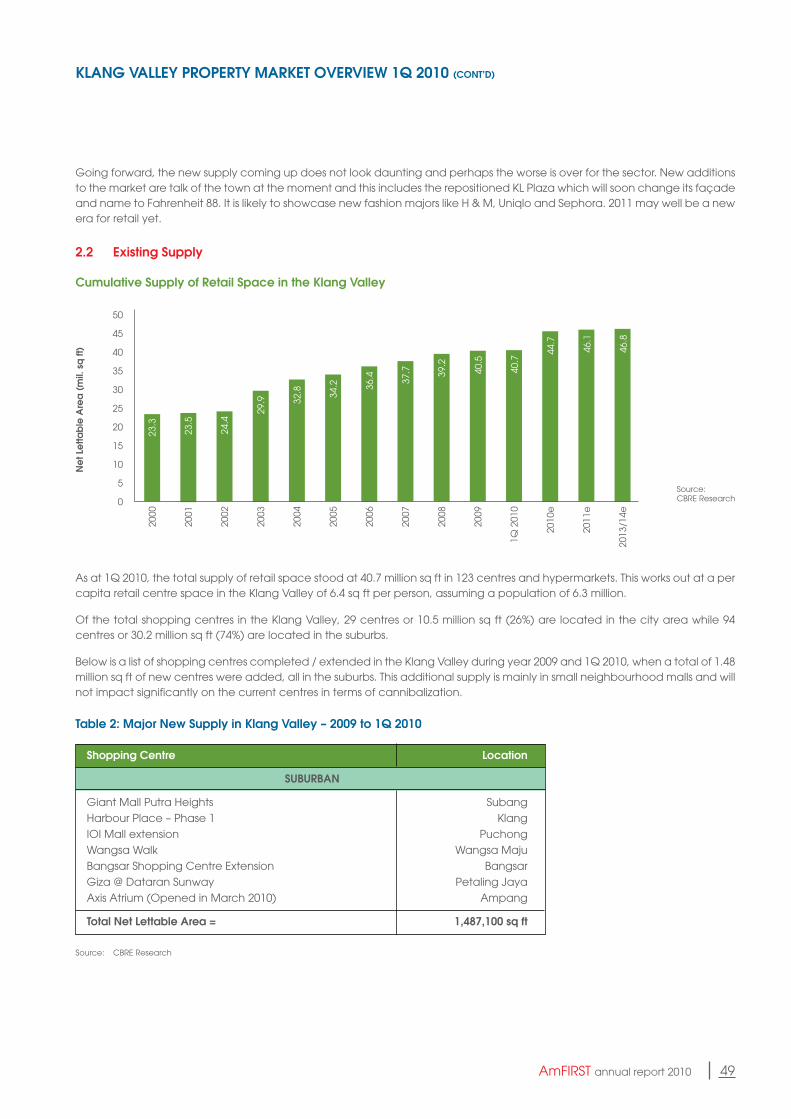
2.2 existing supply
As at 1Q 2010, the total supply of retail space stood at 40.7 million sq ft in 123 centres and hypermarkets. This works out at a per capita retail centre space in the Klang Valley of 6.4 sq ft per person, assuming a population of 6.3 million.
Of the total shopping centres in the Klang Valley, 29 centres or 10.5 million sq ft (26%) are located in the city area while 94 centres or 30.2 million sq ft (74%) are located in the suburbs.
Below is a list of shopping centres completed / extended in the Klang Valley during year 2009 and 1Q 2010, when a total of 1.48 million sq ft of new centres were added, all in the suburbs. This additional supply is mainly in small neighbourhood malls and will not impact significantly on the current centres in terms of cannibalization.
Source: CBRE Research
table 2: Major new supply in Klang Valley – 2009 to 1Q 2010
shopping centre Location
sUBURBAn
Giant Mall Putra Heights SubangHarbour Place – Phase 1 KlangIOI Mall extension PuchongWangsa Walk Wangsa MajuBangsar Shopping Centre Extension BangsarGiza @ Dataran Sunway Petaling JayaAxis Atrium (Opened in March 2010) Ampang
total net Lettable Area = 1,487,100 sq ft
cumulative supply of Retail space in the Klang Valley
ne
t Le
ttab
le A
rea
(m
il. s
q ft
)
50
45
40
25
20
10
35
30
15
5
0Source: CBRE Research
23.3
24.4
32.8 36
.4 39.2
40.7
46.1
23.5
29.9
34.2 37
.7 40.5
44.7
46.8
2000
2006
2002
2008
2004
1Q 2
010
2001
2007
2003
2009
2011
e
2005
2010
e
2013
/14e
50 AmFIRST annual report 2010 51AmFIRST annual report 2010
KLAng VALLey pRopeRty MARKet oVeRVIew 1Q 2010 (cont’d)
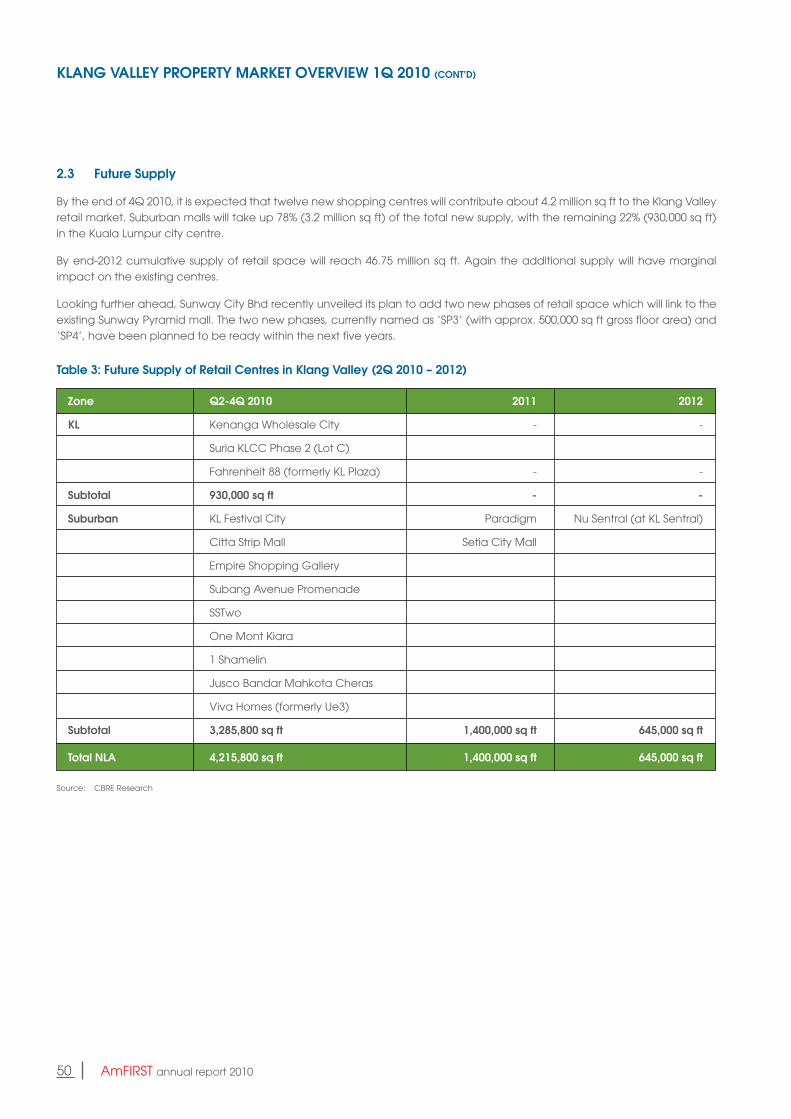
2.3 Future supply
By the end of 4Q 2010, it is expected that twelve new shopping centres will contribute about 4.2 million sq ft to the Klang Valley retail market. Suburban malls will take up 78% (3.2 million sq ft) of the total new supply, with the remaining 22% (930,000 sq ft) in the Kuala Lumpur city centre.
By end-2012 cumulative supply of retail space will reach 46.75 million sq ft. Again the additional supply will have marginal impact on the existing centres.
Looking further ahead, Sunway City Bhd recently unveiled its plan to add two new phases of retail space which will link to the existing Sunway Pyramid mall. The two new phases, currently named as ‘SP3’ (with approx. 500,000 sq ft gross floor area) and ‘SP4’, have been planned to be ready within the next five years.
table 3: Future supply of Retail centres in Klang Valley (2Q 2010 – 2012)
zone Q2-4Q 2010 2011 2012
KL Kenanga Wholesale City - -
Suria KLCC Phase 2 (Lot C)
Fahrenheit 88 (formerly KL Plaza) - -
subtotal 930,000 sq ft - -
suburban KL Festival City Paradigm Nu Sentral (at KL Sentral)
Citta Strip Mall Setia City Mall
Empire Shopping Gallery
Subang Avenue Promenade
SSTwo
One Mont Kiara
1 Shamelin
Jusco Bandar Mahkota Cheras
Viva Homes (formerly Ue3)
subtotal 3,285,800 sq ft 1,400,000 sq ft 645,000 sq ft
total nLA 4,215,800 sq ft 1,400,000 sq ft 645,000 sq ft
Source: CBRE Research
50 AmFIRST annual report 2010 51AmFIRST annual report 2010
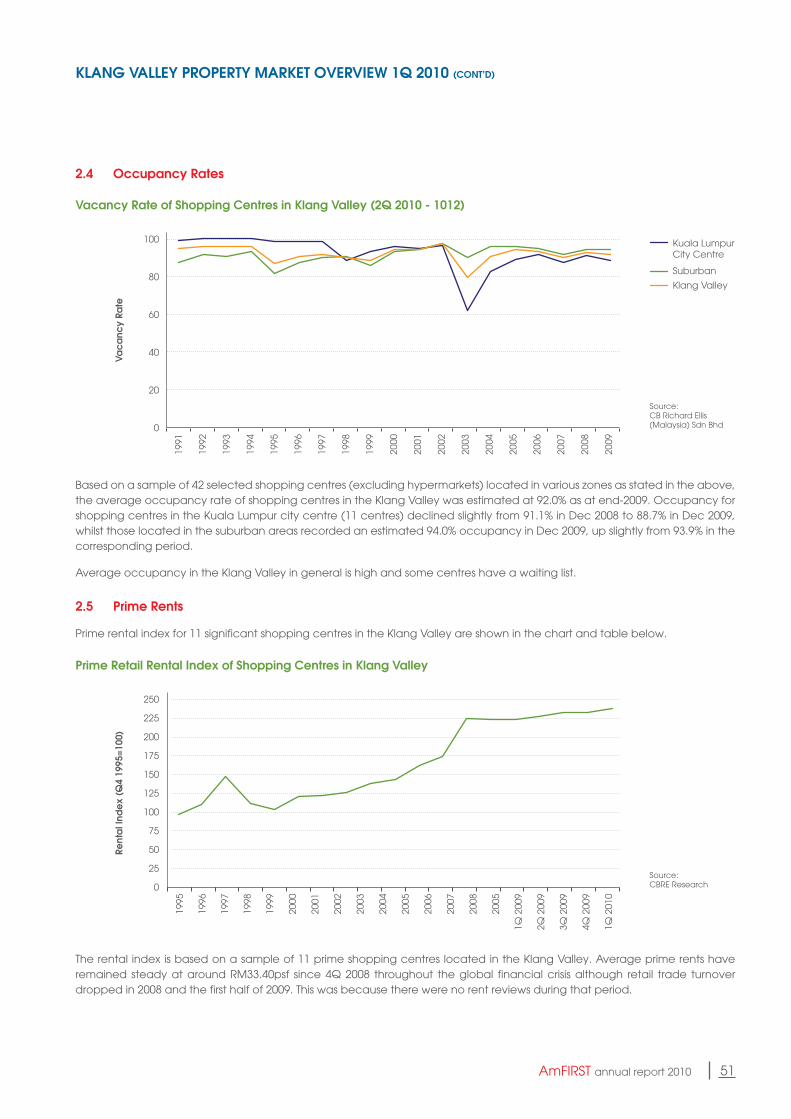
2.4 occupancy Rates
Based on a sample of 42 selected shopping centres (excluding hypermarkets) located in various zones as stated in the above, the average occupancy rate of shopping centres in the Klang Valley was estimated at 92.0% as at end-2009. Occupancy for shopping centres in the Kuala Lumpur city centre (11 centres) declined slightly from 91.1% in Dec 2008 to 88.7% in Dec 2009, whilst those located in the suburban areas recorded an estimated 94.0% occupancy in Dec 2009, up slightly from 93.9% in the corresponding period.
Average occupancy in the Klang Valley in general is high and some centres have a waiting list.
2.5 prime Rents
Prime rental index for 11 significant shopping centres in the Klang Valley are shown in the chart and table below.
Source: CBRE Research
Source: CB Richard Ellis (Malaysia) Sdn Bhd
The rental index is based on a sample of 11 prime shopping centres located in the Klang Valley. Average prime rents have remained steady at around RM33.40psf since 4Q 2008 throughout the global financial crisis although retail trade turnover dropped in 2008 and the first half of 2009. This was because there were no rent reviews during that period.
Vacancy Rate of shopping centres in Klang Valley (2Q 2010 - 1012)
Vac
anc
y Ra
te
100
80
40
60
20
0
1991
1999
1995
2003
1993
2001
1997
2005
2008
1992
2000
1996
2004
2007
1994
2002
1998
2006
2009
Kuala Lumpur City Centre
Suburban
Klang Valley
Rent
al I
nde
x (Q
4 19
95=1
00)
250
225
200
175
100
75
150
125
50
25
0
1995
2003
1999
2007
1997
2005
2001
2005
3Q 2
009
1996
2004
2000
2008
2Q 2
009
1998
2006
2002
1Q 2
009
1Q 2
010
4Q 2
009
prime Retail Rental Index of shopping centres in Klang Valley
KLAng VALLey pRopeRty MARKet oVeRVIew 1Q 2010 (cont’d)
52 AmFIRST annual report 2010
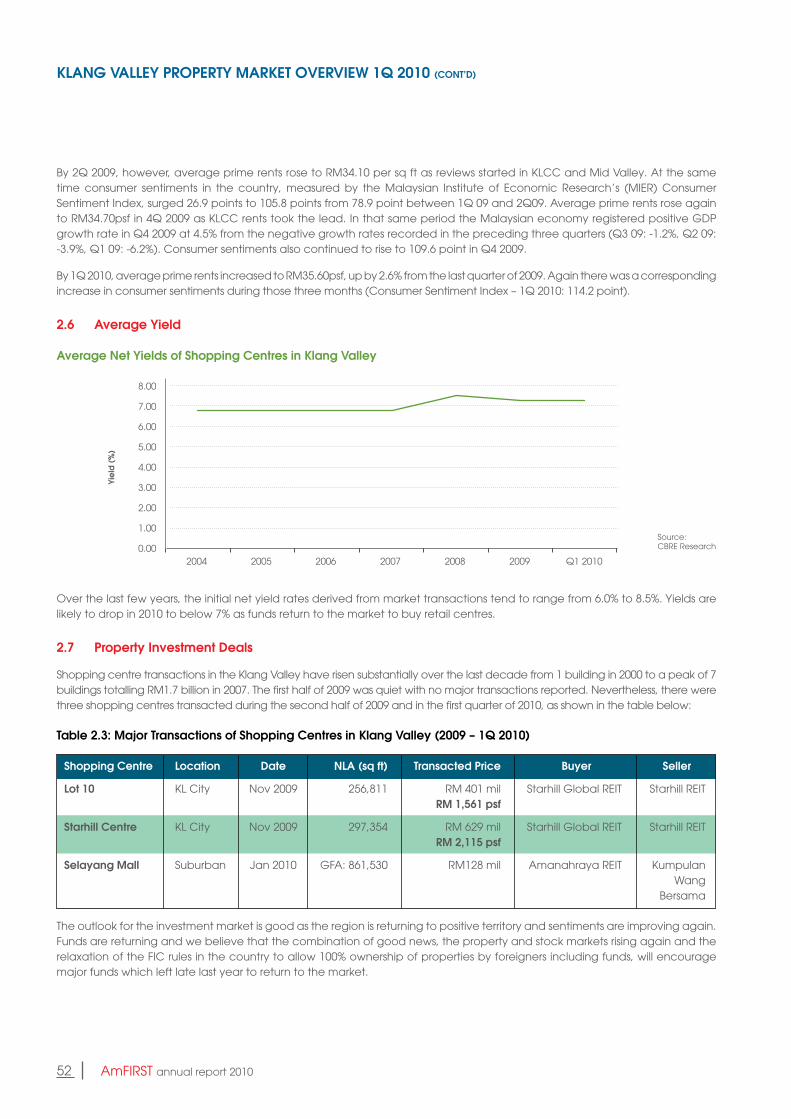
By 2Q 2009, however, average prime rents rose to RM34.10 per sq ft as reviews started in KLCC and Mid Valley. At the same time consumer sentiments in the country, measured by the Malaysian Institute of Economic Research’s (MIER) Consumer Sentiment Index, surged 26.9 points to 105.8 points from 78.9 point between 1Q 09 and 2Q09. Average prime rents rose again to RM34.70psf in 4Q 2009 as KLCC rents took the lead. In that same period the Malaysian economy registered positive GDP growth rate in Q4 2009 at 4.5% from the negative growth rates recorded in the preceding three quarters (Q3 09: -1.2%, Q2 09: -3.9%, Q1 09: -6.2%). Consumer sentiments also continued to rise to 109.6 point in Q4 2009.
By 1Q 2010, average prime rents increased to RM35.60psf, up by 2.6% from the last quarter of 2009. Again there was a corresponding increase in consumer sentiments during those three months (Consumer Sentiment Index – 1Q 2010: 114.2 point).
2.6 Average yield
Over the last few years, the initial net yield rates derived from market transactions tend to range from 6.0% to 8.5%. Yields are likely to drop in 2010 to below 7% as funds return to the market to buy retail centres.
2.7 property Investment deals
Shopping centre transactions in the Klang Valley have risen substantially over the last decade from 1 building in 2000 to a peak of 7 buildings totalling RM1.7 billion in 2007. The first half of 2009 was quiet with no major transactions reported. Nevertheless, there were three shopping centres transacted during the second half of 2009 and in the first quarter of 2010, as shown in the table below:
table 2.3: Major transactions of shopping centres in Klang Valley (2009 – 1Q 2010)
shopping centre Location date nLA (sq ft) transacted price Buyer seller
Lot 10 KL City Nov 2009 256,811 RM 401 mil Starhill Global REIT Starhill REIT RM 1,561 psf
starhill centre KL City Nov 2009 297,354 RM 629 mil Starhill Global REIT Starhill REIT RM 2,115 psf
selayang Mall Suburban Jan 2010 GFA: 861,530 RM128 mil Amanahraya REIT Kumpulan Wang Bersama
The outlook for the investment market is good as the region is returning to positive territory and sentiments are improving again. Funds are returning and we believe that the combination of good news, the property and stock markets rising again and the relaxation of the FIC rules in the country to allow 100% ownership of properties by foreigners including funds, will encourage major funds which left late last year to return to the market.
Source: CBRE Research
Average net yields of shopping centres in Klang Valley
yie
ld (
%)
8.00
4.00
5.00
6.00
7.00
2.00
3.00
0.00
1.00
2004 200820062005 20092007 Q1 2010
KLAng VALLey pRopeRty MARKet oVeRVIew 1Q 2010 (cont’d)

53AmFIRST annual report 2010
FinancialStatements
54 AmFIRST annual report 2010 55AmFIRST annual report 2010
REPORT BY THE DIRECTORS OF THE MANAGERFor the Financial Year Ended 31 March 2010
The Directors of Am ARA REIT Managers Sdn Bhd, (“Am ARA” or “the Manager”), the Manager of AmFIRST Real Estate Investment Trust (“AmFIRST” or the “Trust”), have pleasure in presenting their report to the unitholders of the Trust together with the audited financial statements of the Trust for the financial year ended 31 March 2010.
THE TRUST, THE MANAGER AND THEIR PRINCIPAL ACTIVITIES
The Trust was constituted pursuant to the execution of a Trust Deed dated 28 September 2006 (as amended by the Supplemented, Revised and Restated Trust Deed dated 15 December 2006) by the Manager and the Trustee, Mayban Trustees Berhad. The principal activity of the Trust is to own and invest in a portfolio of commercial properties in major growth areas of Malaysia, primarily in the Klang Valley.
The Manager, incorporated in Malaysia, is a wholly-owned subsidiary of Am ARA REIT Holdings Sdn. Bhd.. Am ARA REIT Holdings Sdn Bhd is 70% owned by AmInvestment Group Berhad and 30% owned by ARA Asset Management (Malaysia) Limited, a wholly-owned subsidiary of ARA AmFirst (Singapore) Pte Ltd, which is in turn a wholly-owned subsidiary of ARA Asset Management Limited (“ARA Group”), an affiliate member of the Cheung Kong Group based in Hong Kong. Am ARA is a professional manager and its principal activity is to manage real estate investment trusts. There has been no significant change in the nature of this activity during the financial year.
TERM OF THE TRUST
The Trust has no fixed termination date. However, the Trust Deed does provide for a number of circumstances under which the Trust may be terminated.
MANAGER’S INVESTMENT OBJECTIVES AND STRATEGIES
The Manager’s investment objectives are to deliver regular and stable distributions to unitholders and to achieve long-term growth in the net asset value per unit through proactive management of the Trust’s portfolio of assets and acquisition of yield accretive properties.
The Manager intends to achieve AmFIRST’s investment objectives through three key strategies:-
(i) Operating Strategy
Am ARA’s operating strategy is to continue to enhance the performance of the existing properties by increasing yields and returns through retaining existing tenants, reducing vacancy levels, adding and/or optimising office space at the properties and minimising interruptions in rental income and operational costs. Am ARA expects to apply the following key operating and management principles in order to continue to manage the properties efficiently, to increase the yields of the properties and to maximise growth:-
• Improverentalrates;• Establishcloserelationshipswithtenantstooptimisetenantretention;• Diversifytenantbase;• Reviewtenantmixandre-configureexistingspace;• Maintainthequalityoftheproperties;• Maximisetheperformanceofeachproperty;• Improveoperatingefficienciesandeconomiesofscale;and• Raisetheprofileoftheproperties.
(ii) Acquisition Strategy
The Manager intends to pursue an acquisition strategy for AmFIRST to increase net property income and the potential for asset growth based on the following criteria:
• Yield-accretive;• Healthytenantmixandoccupancylevel;
54 AmFIRST annual report 2010 55AmFIRST annual report 2010
MANAGER’S INVESTMENT OBJECTIVES AND STRATEGIES (CONT’D)
(ii) Acquisition Strategy (Cont’d)
• Goodlocation;• Valueaddingopportunities;and• Goodbuildingandfacilitiesspecifications.
The Manager expects to benefit from the network of the sponsor and its Joint Venture Partner, ARA Asset Management (Malaysia) Limited, which is part of the ARA Group. ARA Group is a leading real estate fund management house in Asia. It has a strong presence in the region, with investments in many parts of Asia. ARA Group possesses expertise in identifying opportunities in the development of the Asian real estate industry, and is dedicated to the real estate fund management business. Its key staff have been involved with many corporate restructurings in Asia involving real estate assets. Their experience and network will provide an edge to the Manager in its efforts to grow AmFIRST.
AmFIRST intends to hold the properties on a long-term basis. In the future where the Manager considers that any property has reached a stage that offers only limited scope for growth, it may consider selling the property and using the proceeds for alternative investments in properties that meet the Manager’s investment criteria.
(iii) Capital Management Strategy
The Manager’s strategy for the management of AmFIRST’s capital structure involves adopting and maintaining an appropriate debt-equity structure with gearing level to be maintained within the prescribed limits and utilising an active interest rate management policy to manage the risks associated with interest rate fluctuations. The Manager believes that this strategy will:-
• Optimiseunitholders’returns;• Maintainoperatingflexibilitywhenconsideringcapitalexpenditurerequirements;and• EnableAmFIRSTtomaintainfinancingflexibilityinthefundingoffutureacquisitions.
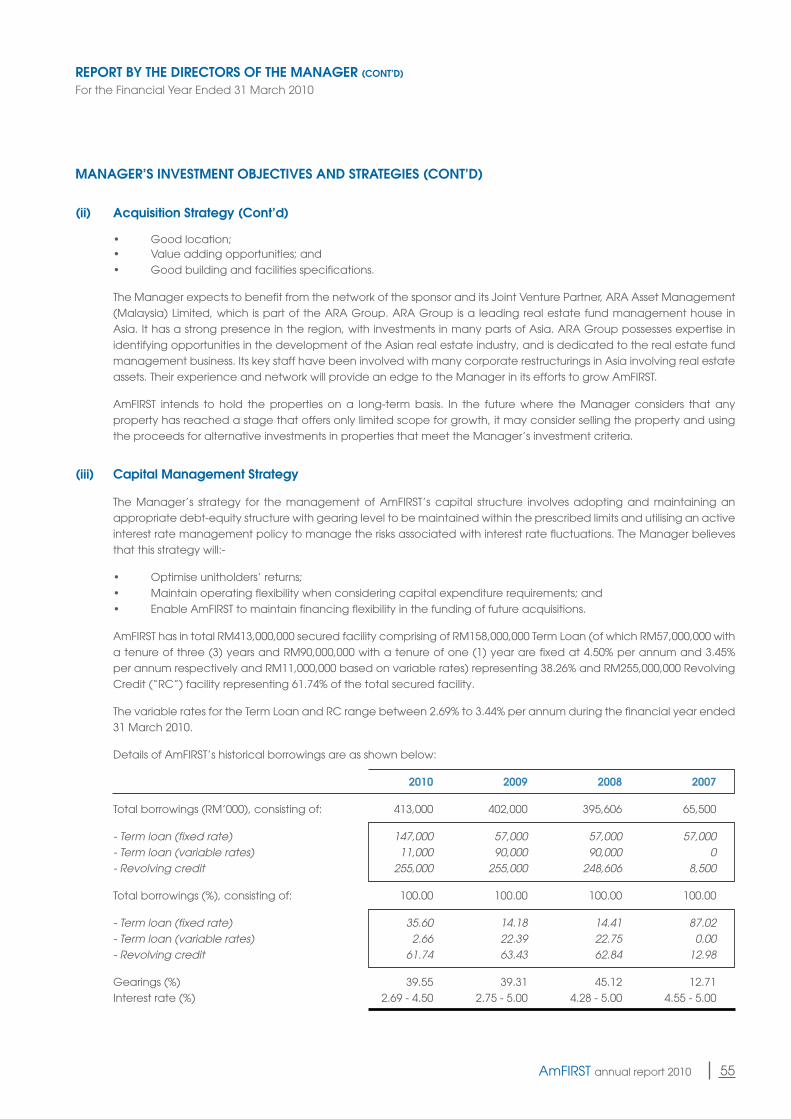
AmFIRST has in total RM413,000,000 secured facility comprising of RM158,000,000 Term Loan (of which RM57,000,000 with a tenure of three (3) years and RM90,000,000 with a tenure of one (1) year are fixed at 4.50% per annum and 3.45% per annum respectively and RM11,000,000 based on variable rates) representing 38.26% and RM255,000,000 Revolving Credit (“RC”) facility representing 61.74% of the total secured facility.
The variable rates for the Term Loan and RC range between 2.69% to 3.44% per annum during the financial year ended 31 March 2010.
Details of AmFIRST’s historical borrowings are as shown below:
2010 2009 2008 2007
Total borrowings (RM’000), consisting of: 413,000 402,000 395,606 65,500
- Term loan (fixed rate) 147,000 57,000 57,000 57,000- Term loan (variable rates) 11,000 90,000 90,000 0- Revolving credit 255,000 255,000 248,606 8,500
Total borrowings (%), consisting of: 100.00 100.00 100.00 100.00
- Term loan (fixed rate) 35.60 14.18 14.41 87.02- Term loan (variable rates) 2.66 22.39 22.75 0.00- Revolving credit 61.74 63.43 62.84 12.98
Gearings (%) 39.55 39.31 45.12 12.71Interest rate (%) 2.69 - 4.50 2.75 - 5.00 4.28 - 5.00 4.55 - 5.00
REPORT BY THE DIRECTORS OF THE MANAGER (CONT’D)
For the Financial Year Ended 31 March 2010
56 AmFIRST annual report 2010 57AmFIRST annual report 2010
INVESTMENT POLICIES AND COMPLIANCE WITH REIT GUIDELINES
(i) Permitted Investments and Restrictions
AmFIRST is allowed to invest in real estate, single-purpose companies whose principal assets comprise real estate, real estate-related or non real estate-related assets, liquid assets, asset-backed securities, listed or unlisted debt securities, and any other investment which is permissible under the REIT Guidelines or otherwise permitted by the SC.
AmFIRST will not extend loans and any other credit facilities to any party, enter into forward purchases or sales in any currency or any foreign-exchange contracts unless these instruments are in compliance with the Exchange Control Act 1953. The Trust will also not be involved in property development, except in the case where the development is made with a view of purchasing the real estate upon completion and having met the criteria stipulated under the REIT Guidelines.
(ii) Portfolio Composition
AmFIRST’s investments may be allocated in the following manner, as prescribed by the REIT Guidelines:
(a) invest in real estates, single-purpose companies, real estate-related assets, non-real estate-related assets and liquidassets;
(b) at least 50% of AmFIRST’s total assets must be invested in real estate and/or single-purpose companies at all times;and
(c) investment in non-real estate-related assets and/or liquid assets must not exceed 25% of AmFIRST’s total assets.
(iii) Diversification
AmFIRST will seek to diversify its real estate portfolio by property type and location. AmFIRST will focus on investing in real estate which are primarily used for commercial purposes.
(iv) Gearing
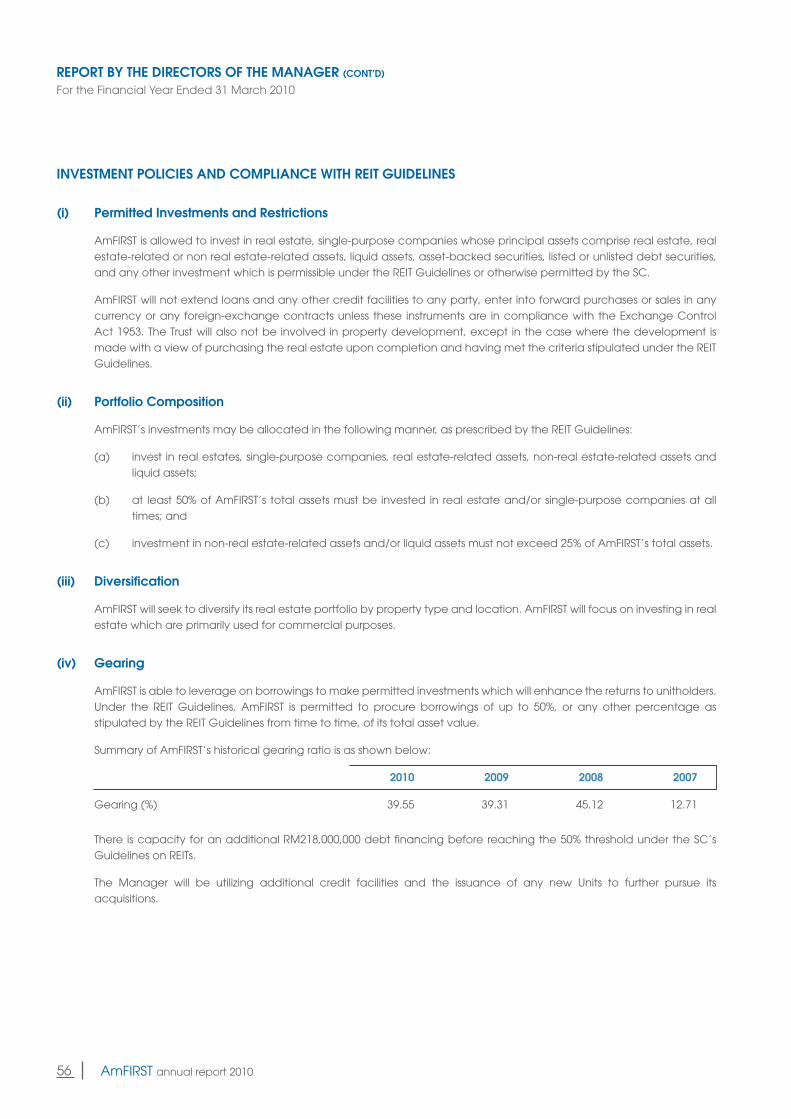
AmFIRST is able to leverage on borrowings to make permitted investments which will enhance the returns to unitholders. Under the REIT Guidelines, AmFIRST is permitted to procure borrowings of up to 50%, or any other percentage as stipulated by the REIT Guidelines from time to time, of its total asset value.
Summary of AmFIRST’s historical gearing ratio is as shown below:
2010 2009 2008 2007
Gearing (%) 39.55 39.31 45.12 12.71
There is capacity for an additional RM218,000,000 debt financing before reaching the 50% threshold under the SC’s Guidelines on REITs.
The Manager will be utilizing additional credit facilities and the issuance of any new Units to further pursue its acquisitions.
REPORT BY THE DIRECTORS OF THE MANAGER (CONT’D)
For the Financial Year Ended 31 March 2010
56 AmFIRST annual report 2010 57AmFIRST annual report 2010
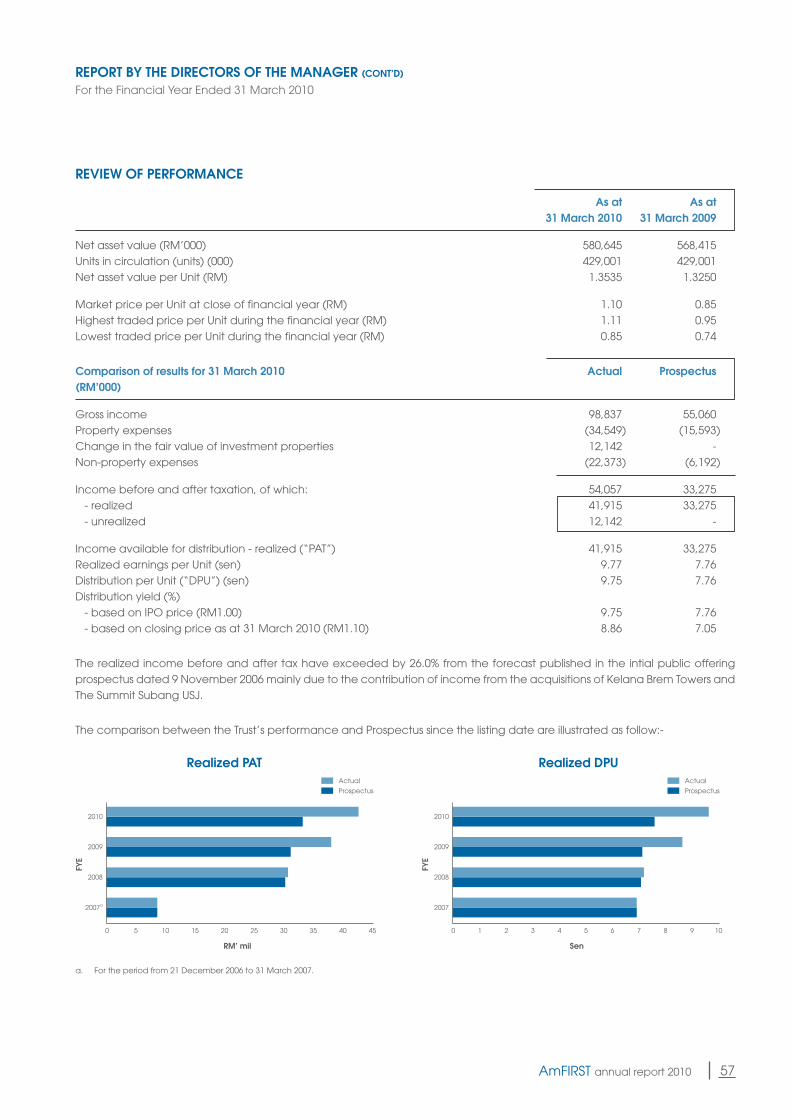
REVIEW OF PERFORMANCE
As at As at 31 March 2010 31 March 2009
Net asset value (RM’000) 580,645 568,415Units in circulation (units) (000) 429,001 429,001Net asset value per Unit (RM) 1.3535 1.3250
Market price per Unit at close of financial year (RM) 1.10 0.85Highest traded price per Unit during the financial year (RM) 1.11 0.95Lowest traded price per Unit during the financial year (RM) 0.85 0.74
Comparison of results for 31 March 2010 Actual Prospectus(RM’000)
Gross income 98,837 55,060Property expenses (34,549) (15,593)Change in the fair value of investment properties 12,142 -Non-property expenses (22,373) (6,192)
Income before and after taxation, of which: 54,057 33,275 - realized 41,915 33,275 - unrealized 12,142 -
Income available for distribution - realized (“PAT”) 41,915 33,275Realized earnings per Unit (sen) 9.77 7.76Distribution per Unit (“DPU”) (sen) 9.75 7.76 Distribution yield (%)-basedonIPOprice(RM1.00) 9.75 7.76 - based on closing price as at 31 March 2010 (RM1.10) 8.86 7.05
The realized income before and after tax have exceeded by 26.0% from the forecast published in the intial public offering prospectus dated 9 November 2006 mainly due to the contribution of income from the acquisitions of Kelana Brem Towers and The Summit Subang USJ.
The comparison between the Trust’s performance and Prospectus since the listing date are illustrated as follow:-
REPORT BY THE DIRECTORS OF THE MANAGER (CONT’D)
For the Financial Year Ended 31 March 2010
Realized DPU
FYE
Sen
2010
2007
2008
2009
0 21 43 65 87 109
Actual
Prospectus
Realized PAT
FYE
RM’ mil
2010
2007a
2008
2009
50 15 25 3510 20 30 40 45
Actual
Prospectus
a. For the period from 21 December 2006 to 31 March 2007.
58 AmFIRST annual report 2010 59AmFIRST annual report 2010
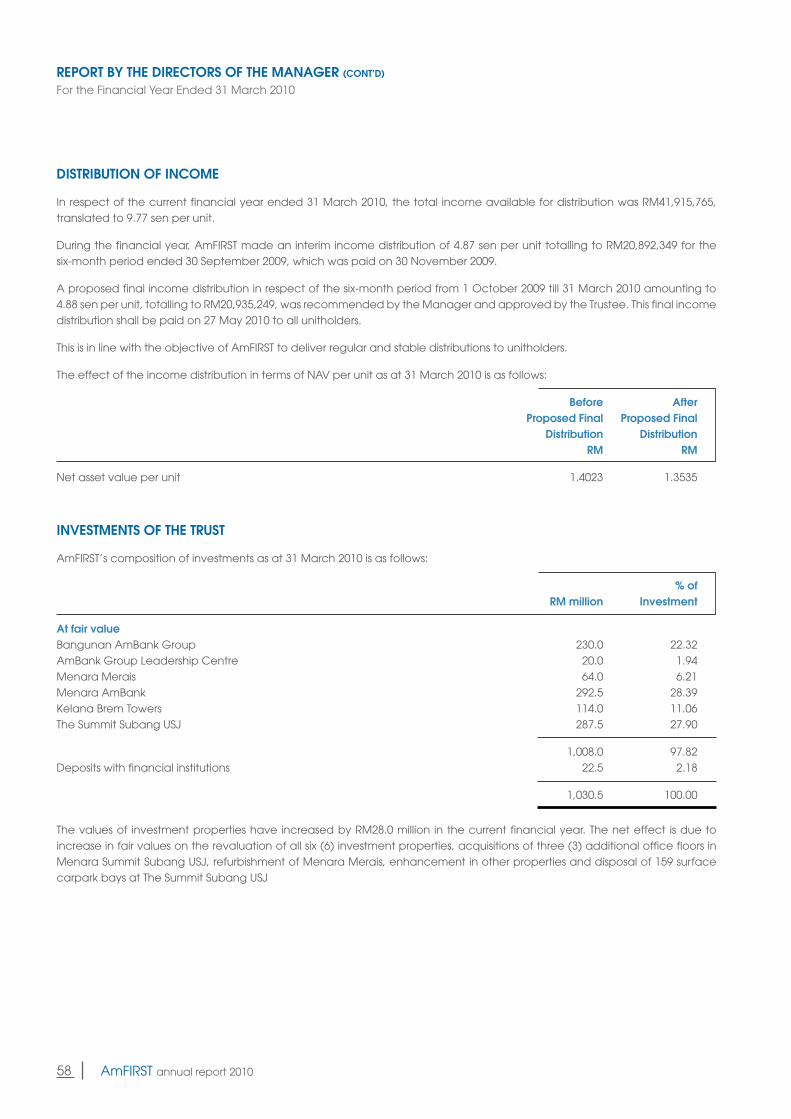
DISTRIBUTION OF INCOME
In respect of the current financial year ended 31 March 2010, the total income available for distribution was RM41,915,765, translated to 9.77 sen per unit.
During the financial year, AmFIRST made an interim income distribution of 4.87 sen per unit totalling to RM20,892,349 for the six-month period ended 30 September 2009, which was paid on 30 November 2009.
Aproposedfinalincomedistributioninrespectofthesix-monthperiodfrom1October2009till31March2010amountingto4.88 sen per unit, totalling to RM20,935,249, was recommended by the Manager and approved by the Trustee. This final income distribution shall be paid on 27 May 2010 to all unitholders.
This is in line with the objective of AmFIRST to deliver regular and stable distributions to unitholders.
The effect of the income distribution in terms of NAV per unit as at 31 March 2010 is as follows:
Before After Proposed Final Proposed Final Distribution Distribution RM RM
Net asset value per unit 1.4023 1.3535
INVESTMENTS OF THE TRUST
AmFIRST’s composition of investments as at 31 March 2010 is as follows:
% of RM million Investment
At fair valueBangunan AmBank Group 230.0 22.32AmBank Group Leadership Centre 20.0 1.94Menara Merais 64.0 6.21Menara AmBank 292.5 28.39Kelana Brem Towers 114.0 11.06The Summit Subang USJ 287.5 27.90
1,008.0 97.82Deposits with financial institutions 22.5 2.18
1,030.5 100.00
The values of investment properties have increased by RM28.0 million in the current financial year. The net effect is due to increase in fair values on the revaluation of all six (6) investment properties, acquisitions of three (3) additional office floors in Menara Summit Subang USJ, refurbishment of Menara Merais, enhancement in other properties and disposal of 159 surface carpark bays at The Summit Subang USJ
REPORT BY THE DIRECTORS OF THE MANAGER (CONT’D)
For the Financial Year Ended 31 March 2010
58 AmFIRST annual report 2010 59AmFIRST annual report 2010
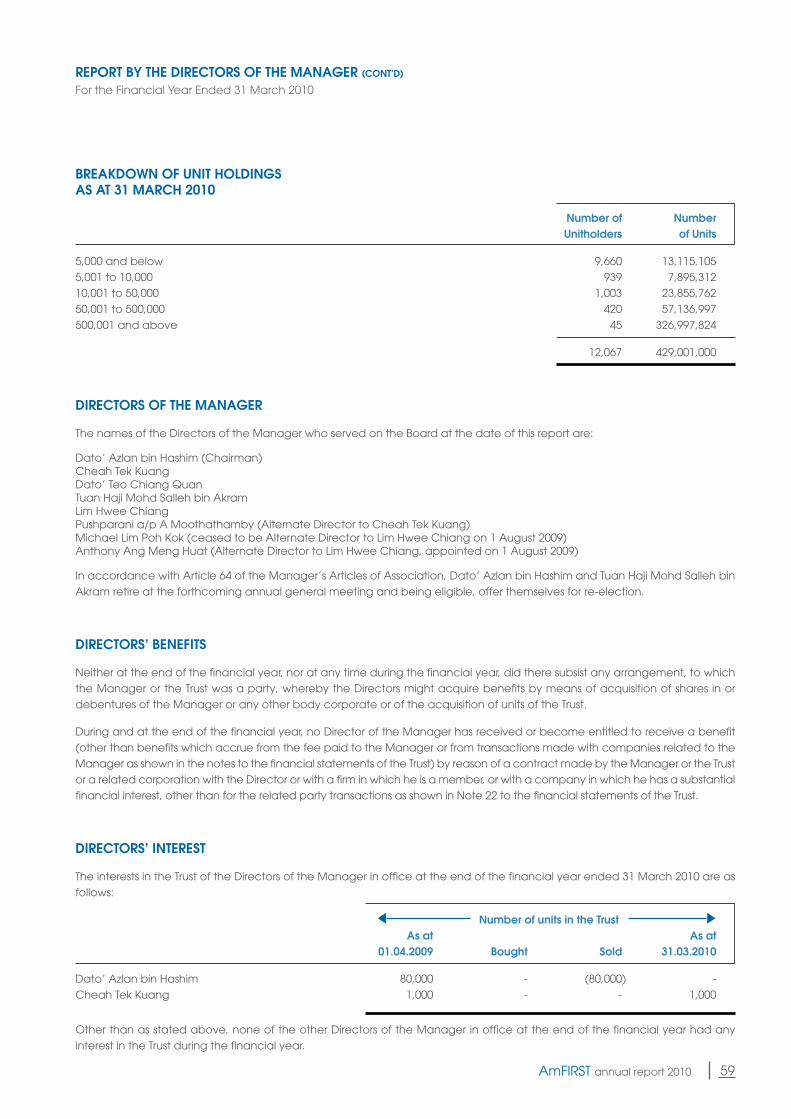
BREAKDOWN OF UNIT HOLDINGSAS AT 31 MARCH 2010
Number of Number Unitholders of Units
5,000 and below 9,660 13,115,1055,001 to 10,000 939 7,895,31210,001 to 50,000 1,003 23,855,76250,001 to 500,000 420 57,136,997500,001 and above 45 326,997,824
12,067 429,001,000
DIRECTORS OF THE MANAGER
The names of the Directors of the Manager who served on the Board at the date of this report are:
Dato’ Azlan bin Hashim (Chairman)Cheah Tek KuangDato’ Teo Chiang QuanTuan Haji Mohd Salleh bin AkramLim Hwee ChiangPushparani a/p A Moothathamby (Alternate Director to Cheah Tek Kuang)Michael Lim Poh Kok (ceased to be Alternate Director to Lim Hwee Chiang on 1 August 2009)Anthony Ang Meng Huat (Alternate Director to Lim Hwee Chiang, appointed on 1 August 2009)
In accordance with Article 64 of the Manager’s Articles of Association, Dato’ Azlan bin Hashim and Tuan Haji Mohd Salleh bin Akram retire at the forthcoming annual general meeting and being eligible, offer themselves for re-election.
DIRECTORS’ BENEFITS
Neither at the end of the financial year, nor at any time during the financial year, did there subsist any arrangement, to which the Manager or the Trust was a party, whereby the Directors might acquire benefits by means of acquisition of shares in or debentures of the Manager or any other body corporate or of the acquisition of units of the Trust.
During and at the end of the financial year, no Director of the Manager has received or become entitled to receive a benefit (other than benefits which accrue from the fee paid to the Manager or from transactions made with companies related to the Manager as shown in the notes to the financial statements of the Trust) by reason of a contract made by the Manager or the Trust or a related corporation with the Director or with a firm in which he is a member, or with a company in which he has a substantial financial interest, other than for the related party transactions as shown in Note 22 to the financial statements of the Trust.
DIRECTORS’ INTEREST
The interests in the Trust of the Directors of the Manager in office at the end of the financial year ended 31 March 2010 are as follows:
Number of units in the Trust As at As at 01.04.2009 Bought Sold 31.03.2010
Dato’ Azlan bin Hashim 80,000 - (80,000) -Cheah Tek Kuang 1,000 - - 1,000
Otherthanasstatedabove,noneoftheotherDirectorsoftheManagerinofficeattheendofthefinancialyearhadanyinterest in the Trust during the financial year.
REPORT BY THE DIRECTORS OF THE MANAGER (CONT’D)
For the Financial Year Ended 31 March 2010
60 AmFIRST annual report 2010 61AmFIRST annual report 2010
MANAGER’S FEES AND COMMISSION
Pursuant to the Trust Deed, the Manager’s fee consists of a base fee (excluding any taxes payable) of up to 0.5% per annum of the total asset value and a performance fee (excluding any taxes payable) of 3% per annum of the net property income, but before deduction of property management fees.
In addition, the Manager will also be entitled to an acquisition fee of 1% of the acquisition price of any real estate or single-purpose company whose principal assets comprise real estate for any acquisition by AmFIRST and a divestment fee of 0.5% of the sale price of any real estate or single-purpose company whose principal assets comprise real estate, sold or divested by AmFIRST (pro-rated if applicable to the proportion of the interest in real estate or single-purpose company purchased or sold).
During the financial year, the Manager did not receive any soft commission (i.e. goods and services) from its broker, by virtue of transactions conducted by AmFIRST.
OTHER STATUTORY INFORMATION
(a) Before the income statement and balance sheet of the Trust were made out, the Manager took reasonable steps:-
(i) to ascertain that proper action had been taken in relation to the writing off of bad debts and the making of provision for doubtful debts and satisfied themselves that there were no known bad debts and that adequate provisionhadbeenmadefordoubtfuldebts;and
(ii) to ensure that any current assets which were unlikely to realise their value as shown in the accounting records in the ordinary course of business had been written down to their estimated realizable values.
(b) At the date of this report, the Manager is not aware of any circumstances not otherwise dealt with in this report or financial statements of the Trust which would render:
(i) the amount written off for bad debts or the amount of the provision for doubtful debts made in the financial statementsoftheTrustinadequatetoanymaterialextent;and
(ii) the values attributed to the current assets in the financial statements of the Trust misleading.
(c) At the date of this report, the Manager is not aware of any circumstances which have arisen, which would render adherence to the existing method of valuation of assets or liabilities of the Trust misleading or inappropriate.
(d) At the date of this report, the Manager is not aware of any circumstances not otherwise dealt with in this report or the financial statements of the Trust which would render any amount stated in the financial statements misleading.
(e) At the date of this report, there does not exist:
(i) any charge on the assets of the Trust which has arisen since the end of the financial year which secures the liabilitiesofanyotherperson;or
(ii) any contingent liability of the Trust which has arisen since the end of the financial year.
(f) In the opinion of the Directors of the Manager:
(i) no contingent or other liability of the Trust has become enforceable or is likely to become enforceable within the period of twelve months after the end of the financial year which will or may affect the ability of the Trust to meetitsobligationswhentheyfalldue;and
(ii) no item, transaction or event of a material and unusual nature has arisen in the interval between the end of the financial year and the date of this report which is likely to affect substantially the results of the operations of the Trust for the financial year in which this report is made.
REPORT BY THE DIRECTORS OF THE MANAGER (CONT’D)
For the Financial Year Ended 31 March 2010
60 AmFIRST annual report 2010 61AmFIRST annual report 2010
REPORT BY THE DIRECTORS OF THE MANAGER (CONT’D)
For the Financial Year Ended 31 March 2010
SIGNIFICANT EVENTS
The significant events are as disclosed in Note 24 to the financial statements.
AUDITORS
The auditors, Ernst & Young, have expressed their willingness to continue in office.
Signed on behalf of the Board in accordance with a resolution of the Directors of the Manager.
DATO’ AZLAN BIN HASHIM TUAN HAJI MOHD SALLEH BIN AKRAM
Kuala Lumpur, MalaysiaDate: 21 May 2010
62 AmFIRST annual report 2010 63AmFIRST annual report 2010
STATEMENT BY DIRECTORS OF THE MANAGER
STATUTORY DECLARATION
We, Dato’ Azlan bin Hashim and Tuan Haji Mohd Salleh bin Akram, being two of the Directors of the Manager, do hereby state that, in the opinion of the Directors of the Manager, the financial statements of AmFIRST Real Estate Investment Trust (the “Trust”) as set out on pages 65 to 83 are drawn up in accordance with applicable Financial Reporting Standards in Malaysia, applicable provisions of the Trust Deed and the Securities Commission’s Guidelines on Real Estate Investment Trusts so as to give a true and fair view of the financial position of the Trust as at 31 March 2010 and of the results and the cash flows of the Trust for the financial year then ended.
Signed on behalf of the Board in accordance with a resolution of the Directors of the Manager.
DATO’ AZLAN BIN HASHIM TUAN HAJI MOHD SALLEH BIN AKRAM
Kuala Lumpur, MalaysiaDate: 21 May 2010
I, Lim Yoon Peng, being the officer primarily responsible for the financial management of AmFIRST Real Estate Investment Trust, do solemnly and sincerely declare that the financial statements set out on pages 65 to 83 are, to the best of my knowledge and belief, correct, and I make this solemn declaration conscientiously believing the same to be true and by virtue of the provisions of the Statutory Declarations Act l960.
Subscribed and solemnly declared bythe abovenamed Lim Yoon Pengat Kuala Lumpur in Wilayah Persekutuanon 21 May 2010 LIM YOON PENG
Before me:
CommissionerforOaths
62 AmFIRST annual report 2010 63AmFIRST annual report 2010
TRUSTEE’S REPORTTo the Unitholders of AmFIRST Real Estate Investment Trust
We have acted as the Trustee of AmFIRST Real Estate Investment Trust (“the Trust”) for the financial year ended 31 March 2010. To the best of our knowledge, Am ARA REIT Managers Sdn. Bhd. has managed the Trust in accordance with the roles and responsibilities and limitation imposed on the management company under the Trust Deed, the Securities Commission’s Guidelines on Real Estate Investment Trusts, the Capital Markets and Services Act 2007 and other applicable laws during the financial year ended 31 March 2010.
We are of the opinion that the recommended final income distribution of 4.88 sen per unit for the six-month period ended 31 March 2010 is in line with and is reflective of the objectives of the Trust.
For Mayban Trustees Berhad
Jennifer Wong Chee MunHead,Operations
Kuala Lumpur, MalaysiaDate: 21 May 2010
64 AmFIRST annual report 2010 65AmFIRST annual report 2010
INDEPENDENT AUDITORS’ REPORTTo the Unitholders of AmFIRST Real Estate Investment Trust
REPORT ON THE FINANCIAL STATEMENTS
We have audited the financial statements of AmFIRST Real Estate Investment Trust, which comprise of the balance sheet as at 31 March 2010, and the income statement, statement of changes in net asset value and cash flow statement for the financial year then ended, and a summary of significant accounting policies and other explanatory notes, as set out on pages 65 to 83.
Manager’s and Trustee’s responsibility for the financial statements
The Manager of the Trust is responsible for the preparation and fair presentation of these financial statements in accordance with Financial Reporting Standards in Malaysia and the Securities Commission’s Guidelines on Real Estate Investment Trusts. This responsibility includes: designing, implementing and maintaining internal control relevant to the preparation and fair presentationoffinancialstatementsthatarefreefrommaterialmisstatement,whetherduetofraudorerror;selectingandapplyingappropriateaccountingpolicies;andmakingaccountingestimatesthatarereasonableinthecircumstances.TheTrustee is responsible for ensuring that the Manager maintains proper accounting and other records as are necessary to enable fair presentation of these financial statements.
Auditors’ responsibility
Our responsibility is to express an opinion on these financial statements based on our audit. We conducted our auditin accordance with approved standards on auditing in Malaysia. Those standards require that we comply with ethical requirements and plan and perform the audit to obtain reasonable assurance whether the financial statements are free from material misstatement.
An audit involves performing procedures to obtain audit evidence about the amounts and disclosures in the financial statements. The procedures selected depend on our judgment, including the assessment of risks of material misstatement of the financial statements, whether due to fraud or error. In making those risk assessments, we consider internal control relevant to the entity’s preparation and fair presentation of the financial statements in order to design audit procedures that are appropriate in the circumstances, but not for the purpose of expressing an opinion on the effectiveness of the entity’s internal control. An audit also includes evaluating the appropriateness of the accounting policies used and the reasonableness of accounting estimates made by the Directors of the Manager, as well as evaluating the overall presentation of the financial statements.
We believe that the audit evidence we have obtained is sufficient and appropriate to provide a basis for our audit opinion.
Opinion
In our opinion, the financial statements have been properly drawn up in accordance with Financial Reporting Standards in Malaysia and the Securities Commission’s Guidelines on Real Estate Investment Trusts so as to give a true and fair view of the financial position of the Trust as at 31 March 2010 and of its financial performance, the changes in net asset value and the cash flows of the Trust for the financial year then ended.
Other matters
This report is made solely to the unitholders of the Trust, as a body, and for no other purpose. We do not assume responsibility to any other person for the content of this report.
Ernst & Young Yap Seng ChongAF: 0039 No. 2190/12/11 (J)Chartered Accountants Chartered Accountant
Kuala Lumpur, MalaysiaDate: 21 May 2010
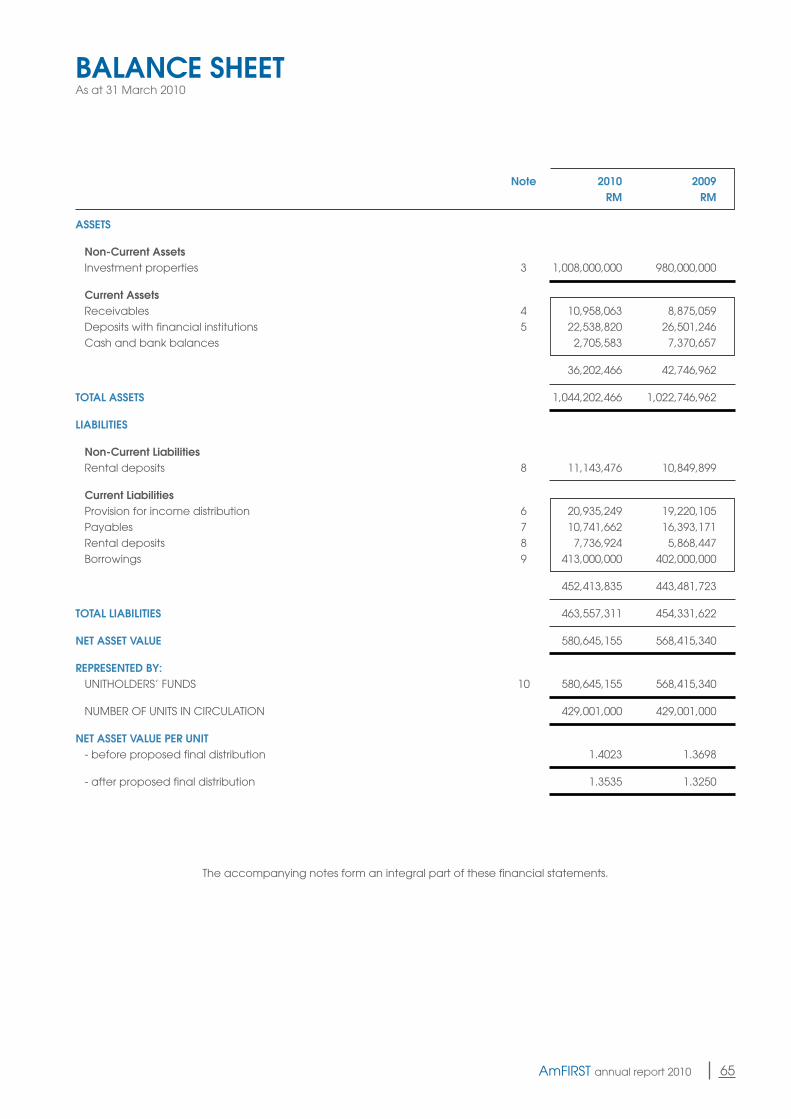
64 AmFIRST annual report 2010 65AmFIRST annual report 2010
BALANCE SHEETAs at 31 March 2010
Note 2010 2009 RM RM
ASSETS
Non-Current Assets Investment properties 3 1,008,000,000 980,000,000
Current Assets Receivables 4 10,958,063 8,875,059 Deposits with financial institutions 5 22,538,820 26,501,246 Cash and bank balances 2,705,583 7,370,657
36,202,466 42,746,962
TOTAL ASSETS 1,044,202,466 1,022,746,962
LIABILITIES
Non-Current Liabilities Rental deposits 8 11,143,476 10,849,899
Current Liabilities Provision for income distribution 6 20,935,249 19,220,105 Payables 7 10,741,662 16,393,171 Rental deposits 8 7,736,924 5,868,447 Borrowings 9 413,000,000 402,000,000
452,413,835 443,481,723
TOTAL LIABILITIES 463,557,311 454,331,622
NET ASSET VALUE 580,645,155 568,415,340
REPRESENTED BY:UNITHOLDERS’FUNDS 10 580,645,155 568,415,340
NUMBEROFUNITSINCIRCULATION 429,001,000 429,001,000
NET ASSET VALUE PER UNIT - before proposed final distribution 1.4023 1.3698
- after proposed final distribution 1.3535 1.3250
The accompanying notes form an integral part of these financial statements.
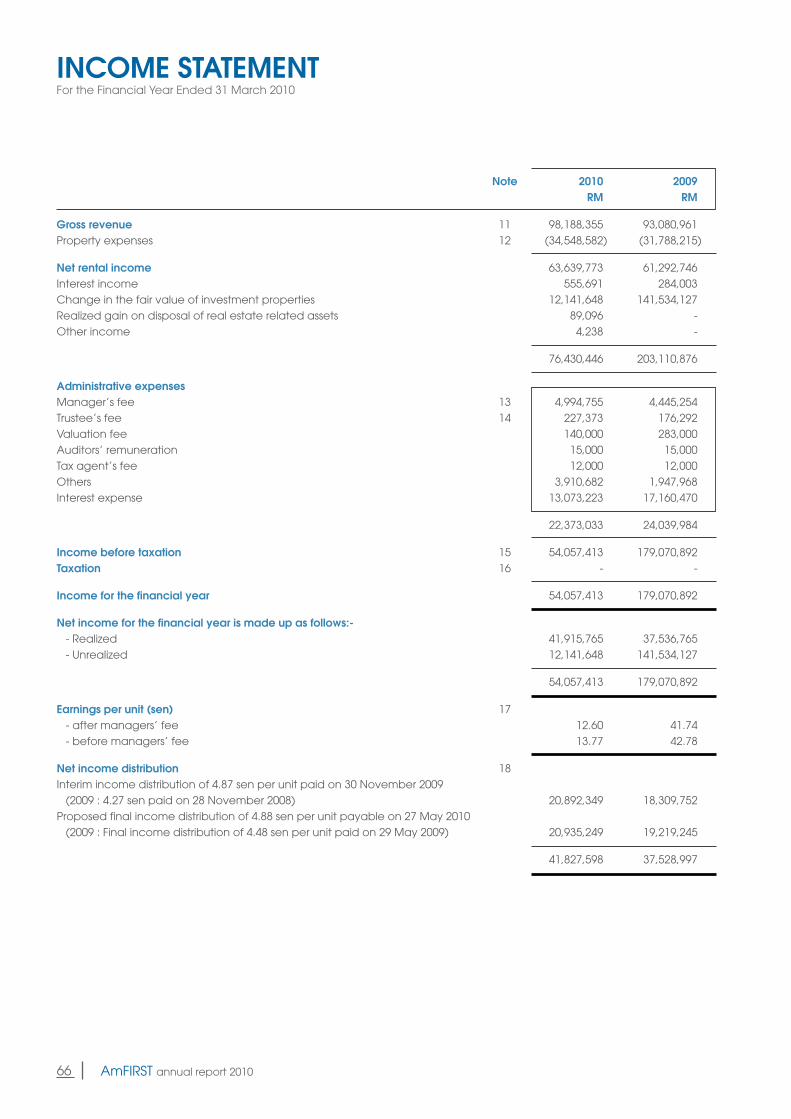
66 AmFIRST annual report 2010 67AmFIRST annual report 2010
INCOME STATEMENTFor the Financial Year Ended 31 March 2010
Note 2010 2009 RM RM
Gross revenue 11 98,188,355 93,080,961Property expenses 12 (34,548,582) (31,788,215)
Net rental income 63,639,773 61,292,746Interest income 555,691 284,003Change in the fair value of investment properties 12,141,648 141,534,127Realized gain on disposal of real estate related assets 89,096 -Otherincome 4,238 -
76,430,446 203,110,876
Administrative expensesManager’s fee 13 4,994,755 4,445,254Trustee’s fee 14 227,373 176,292Valuation fee 140,000 283,000Auditors’ remuneration 15,000 15,000Tax agent’s fee 12,000 12,000Others 3,910,682 1,947,968Interest expense 13,073,223 17,160,470
22,373,033 24,039,984
Income before taxation 15 54,057,413 179,070,892Taxation 16 - -
Income for the financial year 54,057,413 179,070,892
Net income for the financial year is made up as follows:- - Realized 41,915,765 37,536,765 - Unrealized 12,141,648 141,534,127
54,057,413 179,070,892
Earnings per unit (sen) 17 - after managers’ fee 12.60 41.74 - before managers’ fee 13.77 42.78
Net income distribution 18Interim income distribution of 4.87 sen per unit paid on 30 November 2009 (2009 : 4.27 sen paid on 28 November 2008) 20,892,349 18,309,752Proposed final income distribution of 4.88 sen per unit payable on 27 May 2010 (2009 : Final income distribution of 4.48 sen per unit paid on 29 May 2009) 20,935,249 19,219,245
41,827,598 37,528,997
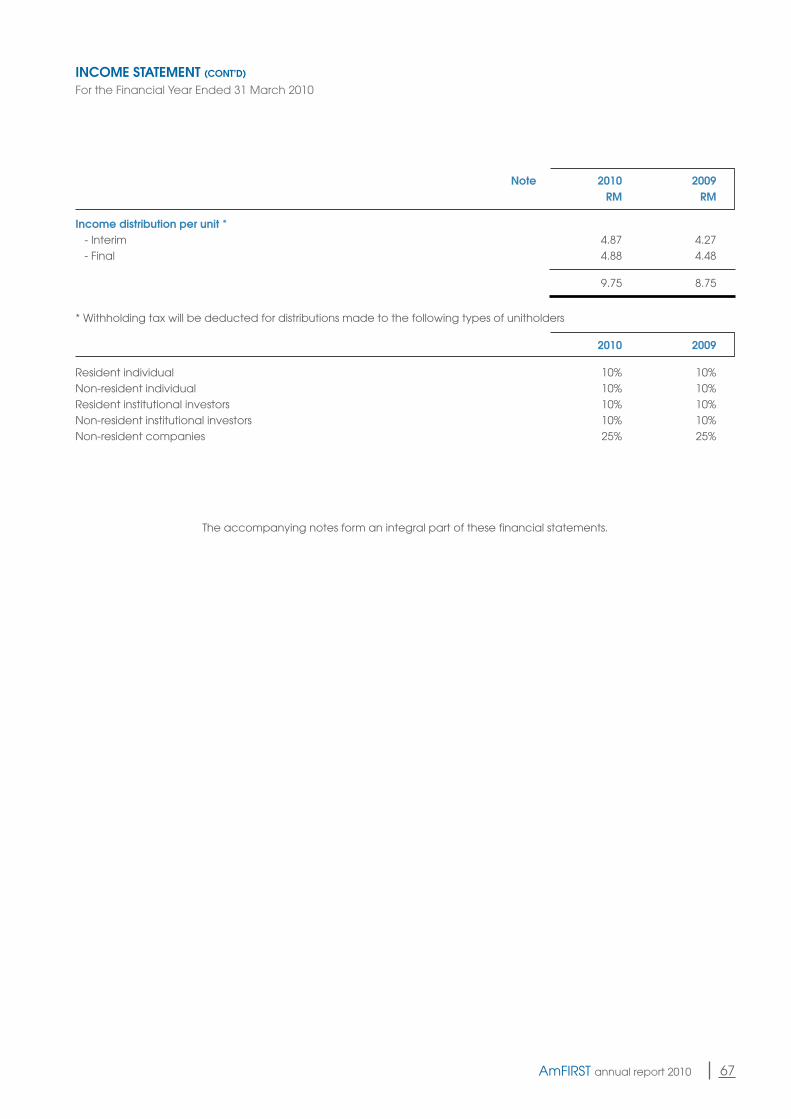
66 AmFIRST annual report 2010 67AmFIRST annual report 2010
Note 2010 2009 RM RM
Income distribution per unit * - Interim 4.87 4.27 - Final 4.88 4.48
9.75 8.75
* Withholding tax will be deducted for distributions made to the following types of unitholders
2010 2009
Resident individual 10% 10%Non-resident individual 10% 10%Resident institutional investors 10% 10%Non-resident institutional investors 10% 10%Non-resident companies 25% 25%
The accompanying notes form an integral part of these financial statements.
INCOME STATEMENT (CONT’D)
For the Financial Year Ended 31 March 2010
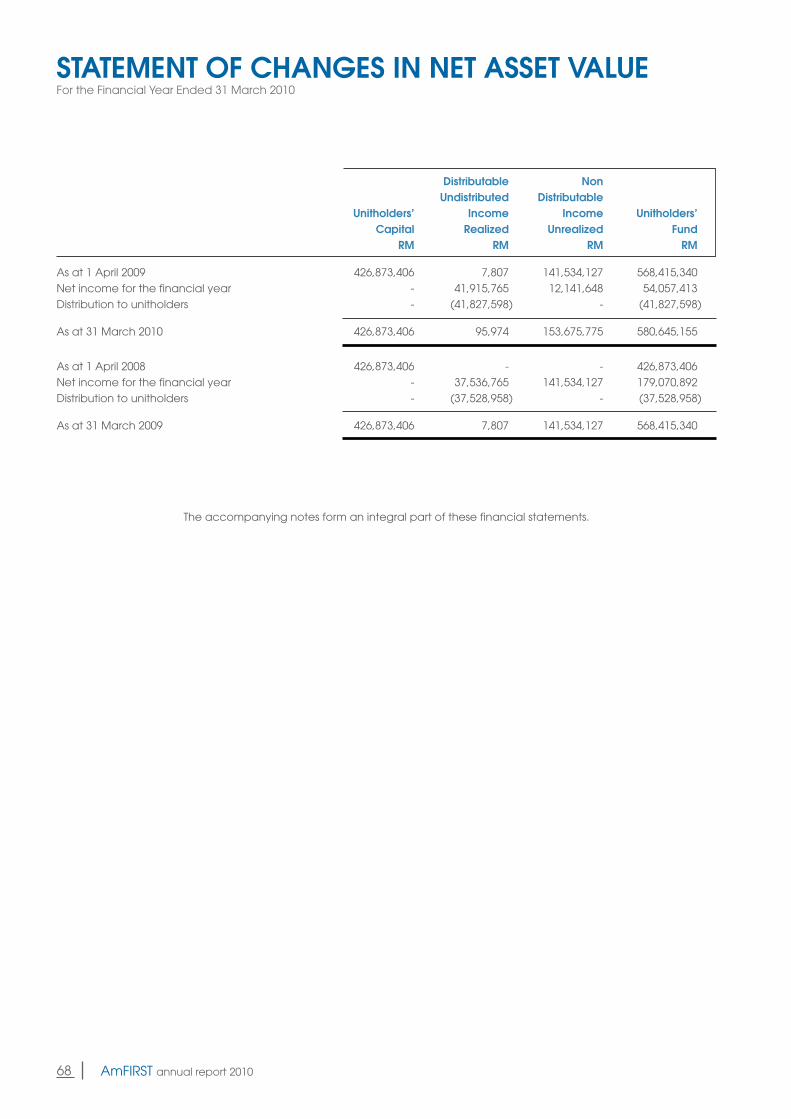
68 AmFIRST annual report 2010 69AmFIRST annual report 2010
STATEMENT OF CHANGES IN NET ASSET VALUEFor the Financial Year Ended 31 March 2010
Distributable Non Undistributed Distributable Unitholders’ Income Income Unitholders’ Capital Realized Unrealized Fund RM RM RM RM
As at 1 April 2009 426,873,406 7,807 141,534,127 568,415,340Net income for the financial year - 41,915,765 12,141,648 54,057,413Distribution to unitholders - (41,827,598) - (41,827,598)
As at 31 March 2010 426,873,406 95,974 153,675,775 580,645,155
As at 1 April 2008 426,873,406 - - 426,873,406Net income for the financial year - 37,536,765 141,534,127 179,070,892Distribution to unitholders - (37,528,958) - (37,528,958)
As at 31 March 2009 426,873,406 7,807 141,534,127 568,415,340
The accompanying notes form an integral part of these financial statements.
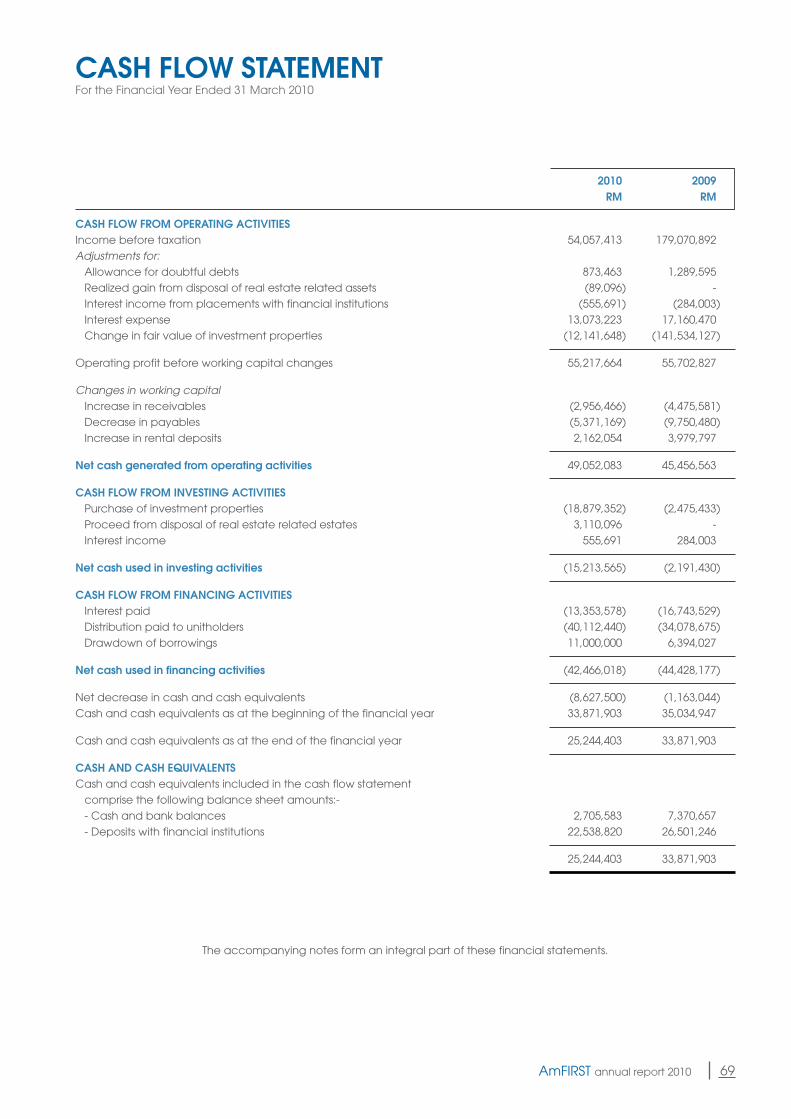
68 AmFIRST annual report 2010 69AmFIRST annual report 2010
CASH FLOW STATEMENTFor the Financial Year Ended 31 March 2010
2010 2009 RM RM
CASH FLOW FROM OPERATING ACTIVITIESIncome before taxation 54,057,413 179,070,892Adjustments for: Allowance for doubtful debts 873,463 1,289,595 Realized gain from disposal of real estate related assets (89,096) - Interest income from placements with financial institutions (555,691) (284,003) Interest expense 13,073,223 17,160,470 Change in fair value of investment properties (12,141,648) (141,534,127)
Operatingprofitbeforeworkingcapitalchanges 55,217,664 55,702,827
Changes in working capital Increase in receivables (2,956,466) (4,475,581) Decrease in payables (5,371,169) (9,750,480) Increase in rental deposits 2,162,054 3,979,797
Net cash generated from operating activities 49,052,083 45,456,563
CASH FLOW FROM INVESTING ACTIVITIES Purchase of investment properties (18,879,352) (2,475,433) Proceed from disposal of real estate related estates 3,110,096 - Interest income 555,691 284,003
Net cash used in investing activities (15,213,565) (2,191,430)
CASH FLOW FROM FINANCING ACTIVITIES Interest paid (13,353,578) (16,743,529) Distribution paid to unitholders (40,112,440) (34,078,675) Drawdown of borrowings 11,000,000 6,394,027
Net cash used in financing activities (42,466,018) (44,428,177)
Net decrease in cash and cash equivalents (8,627,500) (1,163,044)Cash and cash equivalents as at the beginning of the financial year 33,871,903 35,034,947
Cash and cash equivalents as at the end of the financial year 25,244,403 33,871,903
CASH AND CASH EQUIVALENTSCash and cash equivalents included in the cash flow statement comprise the following balance sheet amounts:- - Cash and bank balances 2,705,583 7,370,657 - Deposits with financial institutions 22,538,820 26,501,246
25,244,403 33,871,903
The accompanying notes form an integral part of these financial statements.
70 AmFIRST annual report 2010 71AmFIRST annual report 2010
NOTES TO THE FINANCIAL STATEMENTSAs at 31 March 2010
1. GENERAL INFORMATION
The Trust was constituted pursuant to the execution of a Trust Deed dated 28 September 2006 by the Manager, Am ARA REIT Managers Sdn Bhd, and the Trustee, Mayban Trustees Berhad. The Manager, incorporated in Malaysia, is a wholly-owned subsidiary of Am ARA REIT Holdings Sdn Bhd. Am ARA REIT Holdings Sdn Bhd is 70% owned by AmInvestment Group Berhad and 30% owned by ARA Asset Management (Malaysia) Limited, a wholly-owned subsidiary of ARA AmFIRST (Singapore) Pte. Ltd., which is in turn a wholly-owned subsidiary of ARA Asset Management Limited, which is an affiliate of the Cheung Kong Group based in Hong Kong.
AmFIRST was listed on the Main Market of Bursa Malaysia Securities Berhad on 21 December 2006.
The key objectives for AmFIRST is to own and invest in real estate whether directly or indirectly through the ownership of single-purpose companies whose principal assets comprise real estate and real estate-related assets.
The registered office of the Manager is located at 22nd Floor, Bangunan AmBank Group, No. 55, Jalan Raja Chulan, 50200 Kuala Lumpur.
The financial statements were authorized for issue by the Board of Directors of the Manager in accordance with a resolution of the Directors.
2. SIGNIFICANT ACCOUNTING POLICIES
(a) Basis of accounting
The financial statements are prepared under the historical cost convention unless otherwise indicated in the accounting policies below, and comply with applicable Financial Reporting Standards in Malaysia (FRSs), applicable provisions of the Trust Deed and applicable Securities Commission’s Guidelines on Real Estate Investment Trusts.
The financial statements are presented in Ringgit Malaysia (RM), which is also the Trust’s functional currency.
At the date of authorization of these financial statements, the following new FRSs and Interpretations, and amendments to certain Standards and Interpretations were issued but not yet effective and have not been applied by the Trust:
Effective for financial periods beginning on or after 1 January 2010- FRS 4: Insurance Contracts- FRS 7: Financial Instruments: Disclosures- FRS 101: Presentation of Financial Statements (revised)- FRS 123: Borrowing Costs- FRS 139: Financial Instruments: Recognition and Measurement- Amendments to FRS 1: First-time Adoption of Financial Reporting Standards and FRS 127: Consolidated and
Separate Financial Statements: Cost of an Investment in a Subsidiary, Jointly Controlled Entity or Associate- Amendments to FRS 2: Share-based Payment - Vesting Conditions and Cancellations- Amendments to FRS 132: Financial Instruments: Presentation- Amendments to FRS 139: Financial Instruments: Recognition and Measurement, FRS 7: Financial Instruments:
Disclosures and IC Interpretation 9: Reassessment of Embedded Derivatives- Amendments to FRSs ‘Improvements to FRSs (2009)’- IC Interpretation 9: Reassessment of Embedded Derivatives- IC Interpretation 10: Interim Financial Reporting and Impairment- IC Interpretation 11: FRS 2 - Group and Treasury Share Transactions- IC Interpretation 13: Customer Loyalty Programmes- IC Interpretation 14: FRS 119 - The Limit on a Defined Benefit Asset, Minimum Funding Requirements and their
Interaction- TR i - 3: Presentation of Financial Statements of Islamic Financial Institutions
70 AmFIRST annual report 2010 71AmFIRST annual report 2010
NOTES TO THE FINANCIAL STATEMENTS (CONT’D)
As at 31 March 2010
2. SIGNIFICANT ACCOUNTING POLICIES (CONT’D)
(a) Basis of accounting (Cont’d)
Effective for financial periods beginning on or after 1 July 2010- FRS 1: First-time Adoption of Financial Reporting Standards- FRS 3: Business Combinations (revised)- FRS 127: Consolidated and Separate Financial Statements (amended)- Amendments to FRS 2: Share-based Payment- AmendmentstoFRS5:Non-currentAssetsHeldforSaleandDiscontinuedOperations- Amendments to FRS138: Intangible Assets- Amendments to IC Interpretation 9: Reassessment of Embedded Derivatives- IC Interpretation 12: Service Concession Arrangements- IC Interpretation I5: Agreements for the Construction of Real Estate- ICInterpretation16:HedgesofaNetInvestmentinaForeignOperation- ICInterpretation17:DistributionsofNon-cashAssetstoOwners
The Trust plans to adopt the above pronouncements when they become effective in the respective financial period. Unless otherwise described below, these pronouncements are expected to have no significant impact to the financial statements of the Trust upon their initial application:
FRS 101: Presentation of Financial Statements (revised)
The revised FRS 101 separates owner and non-owner changes in equity. Therefore, the statement of changes in net asset value will now include only details of transactions with owners. All non-owner changes in equity are presented as a single line labelled as total comprehensive income. The Standard also introduces the statement of comprehensive income: presenting all items of income and expense recognized in the income statement, together with all other items of recognized income and expense, either in one single statement, or in two linked statements. The Trust is currently evaluating the format to adopt. In addition, a statement of financial position is required at the beginning of the earliest comparative period following a change in accounting policy, the correction of an error or the reclassification of items in the financial statements. This revised FRS does not have any impact on the financial position and results of the Trust.
FRS 123: Borrowing Costs
This Standard supersedes FRS 1232004: Borrowing Costs that removes the option of expensing borrowing costs and requires capitalization of such costs that are directly attributable to the acquisition, construction or production ofaqualifyingassetaspartofthecostofthatasset.Otherborrowingcostsarerecognizedasanexpense.TheTrust’s current accounting policy is to expense the borrowing costs in the period which they are incurred. In accordance with the transitional provisions of the Standard, the Trust will apply the change in accounting policy prospectively for which the commencement date for capitalization of borrowing cost on qualifying assets is on or after the financial period 1 January 2010.
FRS 139: Financial Instruments: Recognition and Measurement, FRS 7: Financial Instruments: Disclosures and Amendments to FRS 139: Financial Instruments: Recognition and Measurement, FRS 7: Financial Instruments: Disclosures
The new Standard on FRS 139: Financial Instruments: Recognition and Measurement establishes principles for recognizing and measuring financial assets, financial liabilities and some contracts to buy and sell non-financial items. Requirements for presenting information about financial instruments are in FRS 132: Financial Instruments: Presentation and the requirements for disclosing information about financial instruments are in FRS 7: Financial Instruments: Disclosures.
FRS 7: Financial Instruments: Disclosures is a new Standard that requires new disclosures in relation to financial instruments. The Standard is considered to result in increased disclosures, both quantitative and qualitative of the Trust’s exposure to risks, enhanced disclosure regarding components of the Trust’s financial position and performance, and possible changes to the way of presenting certain items in the financial statements.
72 AmFIRST annual report 2010 73AmFIRST annual report 2010
NOTES TO THE FINANCIAL STATEMENTS (CONT’D)
As at 31 March 2010
2. SIGNIFICANT ACCOUNTING POLICIES (CONT’D)
(a) Basis of accounting (Cont’d)
FRS 139: Financial Instruments: Recognition and Measurement, FRS 7: Financial Instruments: Disclosures and Amendments to FRS 139: Financial Instruments: Recognition and Measurement, FRS 7: Financial Instruments: Disclosures (Cont’d)
In accordance with the respective transitional provisions, the Trust is exempted from disclosing the possible impact to the financial statements upon the initial application.
The impact of applying the above FRSs, amendments to accounting standards and IC interpretations on these financial statements upon first adoption of these standards as required by paragraph 30(b) of FRS 108: Accounting Policies, Changes in Accounting Estimates and Errors are not disclosed as FRS 4 and 8, and IC Interpretations 9 and 10 do not have any significant financial impact on the financial statements to the Trust. The Trust is also exempted from disclosing the possible impact, if any, to the financial statements upon the initial application of FRS 7 and FRS 139.
(b) Investment properties
Investment properties are properties held to earn rental income or for capital appreciation or both rather than for use in the production or supply of goods and services or for administrative purpose, or sale in the ordinary course of business.
Investment properties are measured initially at cost, including transaction costs. The carrying amount includes the cost of replacing part of an existing investment properties at the time the cost is incurred if the recognition criteriaaremet;andexcludesthecostsofday-to-dayservicingofaninvestmentproperty.
Investment properties are stated at fair value which reflects market condition at the balance sheet date. The fair value is arrived at by reference to market evidence of transaction prices or price which the properties could be exchanged between knowldegeable, willing parties in an arm length transaction. Gains and losses arising from changes in the fair values of investment properties are included in the income statement in the year in which they arise.
Investment properties are derecognized upon disposal or when they are permanently withdrawn from use and no futureeconomicbenefitsareexpected fromtheirdisposal.Ondisposal, thedifferencebetweenthenetdisposal proceeds and the carrying amount is recognized in the income statement.
(c) Trade and other receivables
Trade and other receivables are carried at anticipated realizable values. Known bad debts are written off and specific provisions are made for any debts considered to be doubtful of collection.
(d) Cash and cash equivalents
Cash and cash equivalents consist of cash at bank and deposits with licensed financial institutions.
(e) Trade and other payables
Trade and other payables are stated at cost which is the fair value of the consideration to be paid in the future for goods and services received
72 AmFIRST annual report 2010 73AmFIRST annual report 2010
NOTES TO THE FINANCIAL STATEMENTS (CONT’D)
As at 31 March 2010
2. SIGNIFICANT ACCOUNTING POLICIES (CONT’D)
(f) Provisions
Provision is recognized when it is probable that an outflow of resources embodying economic benefit will be required to settle a present obligation (legal or constructive) as a result of a past event and a reliable estimate can be made of the amount.
(g) Borrowings
Interest bearing borrowings are recorded at the amount of borrowings received.
(h) Income tax
Income tax on the profit or loss for the year comprises current and deferred tax. Current tax is the expected amount of income tax payable in respect of the taxable profit for the year and is measured using the tax rates that have been enacted at the balance sheet date.
Deferred tax is provided for, using the liability method, on temporary differences at the balance sheet date between the tax bases of assets and liabilities and their carrying amounts in the financial statements. In principle, deferred tax liabilities are recognized for all taxable temporary differences and deferred tax assets are recognized for all deductible temporary differences, unused tax losses and unused tax credits to the extent that it is probable that taxable profit will be available against which the deductible temporary differences, unused tax losses and unused tax credits can be utilized. Deferred tax is not recognized if the temporary difference arises from the initial recognition of an asset or liability in a transaction which is not a business combination and at the time of the transaction, affects neither accounting profit nor taxable profit.
Deferred tax is measured at the tax rates that are expected to apply in the period when the asset is realized or the liability is settled, based on tax rates that have been enacted or substantively enacted at the balance sheet date. Deferred tax is recognized in the income statement, except when it arises from a transaction which is recognized directly in equity, in which case the deferred tax is also charged or credited directly in equity.
(i) Impairment of assets
At each balance sheet date, the Manager reviews the carrying amounts of its assets to determine whether there is any indication of impairment. If any such indication exists, impairment is measured by comparing the carrying values of the assets with their recoverable amounts. Recoverable amount is the higher of net selling price and value in use, which is measured by reference to discounted future cash flows.
An impairment loss is charged to the income statement immediately, unless the asset is carried at revalued amount. Any impairment loss of a revalued asset is treated as a revaluation decrease to the extent of any available previously recognized revaluation surplus for the same asset. Reversal of impairment losses recognized in prior years is recorded when there is an indication that the impairment losses recognized for the asset no longer exist or have decreased.
The reversal is recognized to the extent of the carrying amount of the asset that would have been determined (net of amortization and depreciation) had no impairment loss been recognized. The reversal is recognized in the income statement immediately, unless the asset is carried at revalued amount. A reversal of an impairment loss on a revalued asset is credited directly to revaluation surplus. However, to the extent that an impairment loss on the same revalued asset was previously recognized as an expense in the income statement, a reversal of that impairment loss is recognized as income in the income statement.
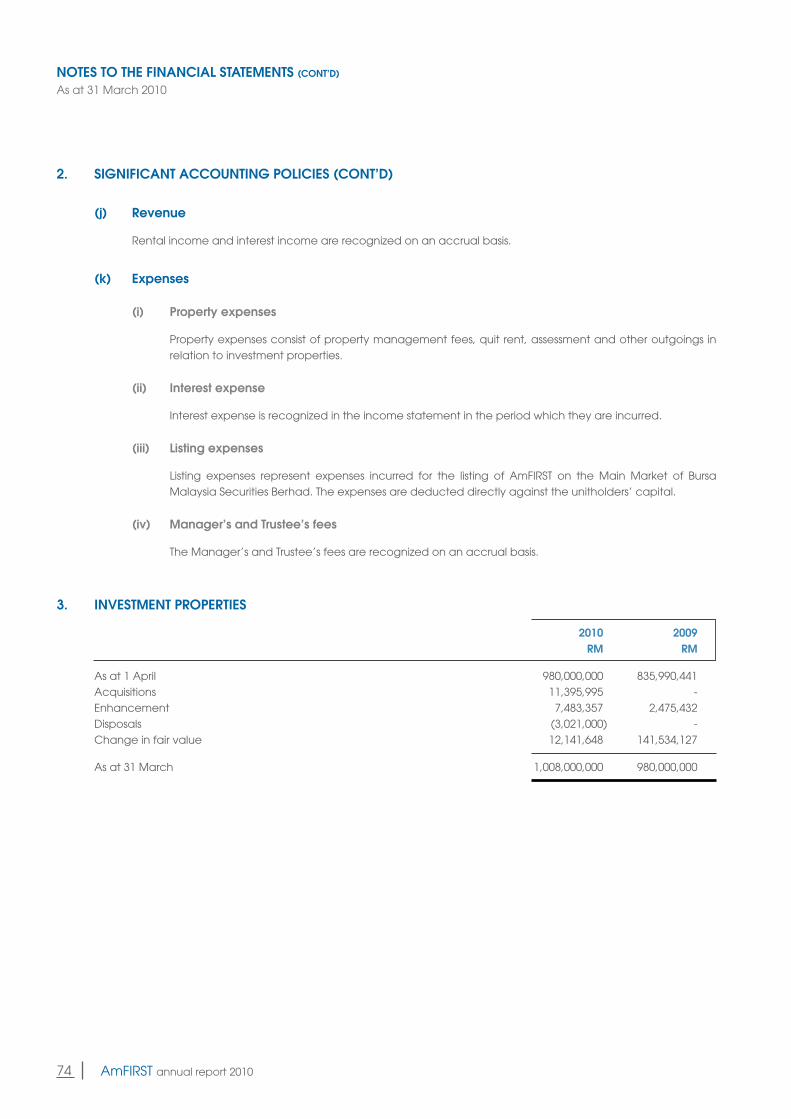
74 AmFIRST annual report 2010 75AmFIRST annual report 2010
NOTES TO THE FINANCIAL STATEMENTS (CONT’D)
As at 31 March 2010
2. SIGNIFICANT ACCOUNTING POLICIES (CONT’D)
(j) Revenue
Rental income and interest income are recognized on an accrual basis.
(k) Expenses
(i) Property expenses
Property expenses consist of property management fees, quit rent, assessment and other outgoings in relation to investment properties.
(ii) Interest expense
Interest expense is recognized in the income statement in the period which they are incurred.
(iii) Listing expenses
Listing expenses represent expenses incurred for the listing of AmFIRST on the Main Market of Bursa Malaysia Securities Berhad. The expenses are deducted directly against the unitholders’ capital.
(iv) Manager’s and Trustee’s fees
The Manager’s and Trustee’s fees are recognized on an accrual basis.
3. INVESTMENT PROPERTIES
2010 2009 RM RM
As at 1 April 980,000,000 835,990,441Acquisitions 11,395,995 -Enhancement 7,483,357 2,475,432Disposals (3,021,000) -Change in fair value 12,141,648 141,534,127
As at 31 March 1,008,000,000 980,000,000
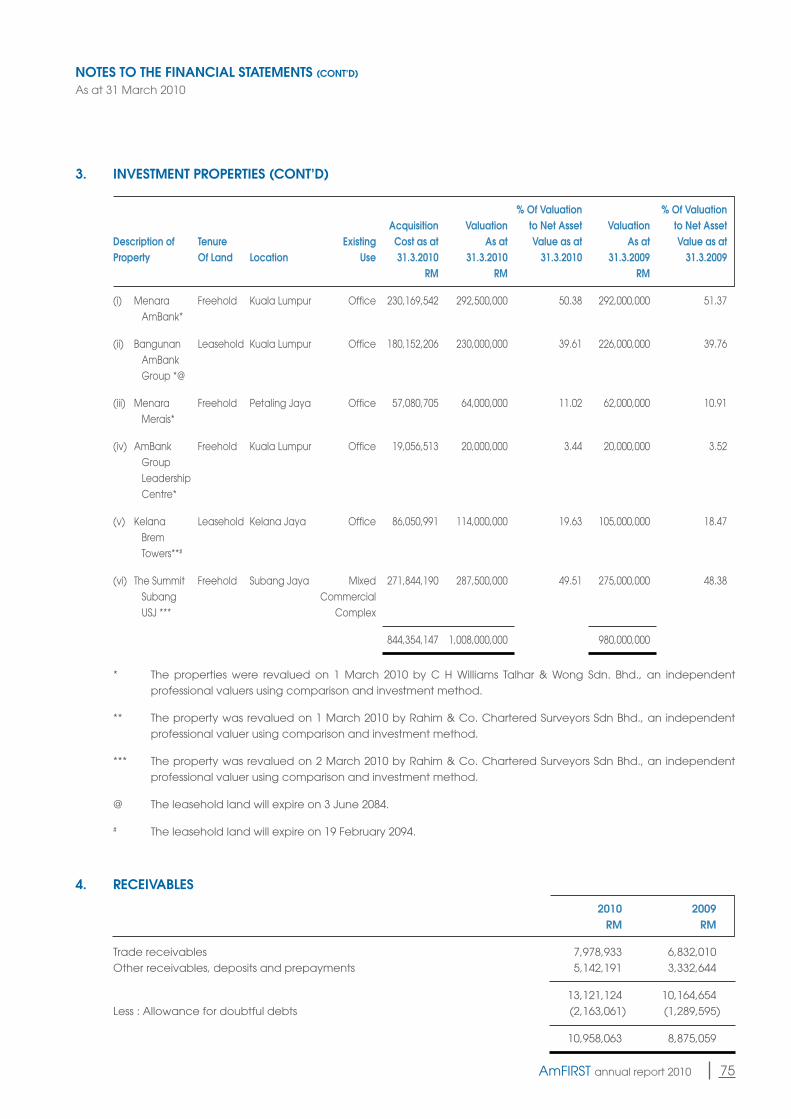
74 AmFIRST annual report 2010 75AmFIRST annual report 2010
NOTES TO THE FINANCIAL STATEMENTS (CONT’D)
As at 31 March 2010
3. INVESTMENT PROPERTIES (CONT’D)
% Of Valuation % Of Valuation Acquisition Valuation to Net Asset Valuation to Net AssetDescription of Tenure Existing Cost as at As at Value as at As at Value as atProperty Of Land Location Use 31.3.2010 31.3.2010 31.3.2010 31.3.2009 31.3.2009 RM RM RM
(i) Menara Freehold KualaLumpur Office 230,169,542 292,500,000 50.38 292,000,000 51.37 AmBank*
(ii) Bangunan Leasehold KualaLumpur Office 180,152,206 230,000,000 39.61 226,000,000 39.76 AmBank Group *@
(iii) Menara Freehold PetalingJaya Office 57,080,705 64,000,000 11.02 62,000,000 10.91 Merais*
(iv) AmBank Freehold KualaLumpur Office 19,056,513 20,000,000 3.44 20,000,000 3.52 Group Leadership Centre*
(v) Kelana Leasehold KelanaJaya Office 86,050,991 114,000,000 19.63 105,000,000 18.47 Brem Towers**#
(vi) The Summit Freehold Subang Jaya Mixed 271,844,190 287,500,000 49.51 275,000,000 48.38 Subang Commercial USJ *** Complex
844,354,147 1,008,000,000 980,000,000
* The properties were revalued on 1 March 2010 by C H Williams Talhar & Wong Sdn. Bhd., an independent professional valuers using comparison and investment method.
** The property was revalued on 1 March 2010 by Rahim & Co. Chartered Surveyors Sdn Bhd., an independent professional valuer using comparison and investment method.
*** The property was revalued on 2 March 2010 by Rahim & Co. Chartered Surveyors Sdn Bhd., an independent professional valuer using comparison and investment method.
@ The leasehold land will expire on 3 June 2084.
# The leasehold land will expire on 19 February 2094.
4. RECEIVABLES
2010 2009 RM RM
Trade receivables 7,978,933 6,832,010Otherreceivables,depositsandprepayments 5,142,191 3,332,644
13,121,124 10,164,654Less : Allowance for doubtful debts (2,163,061) (1,289,595)
10,958,063 8,875,059
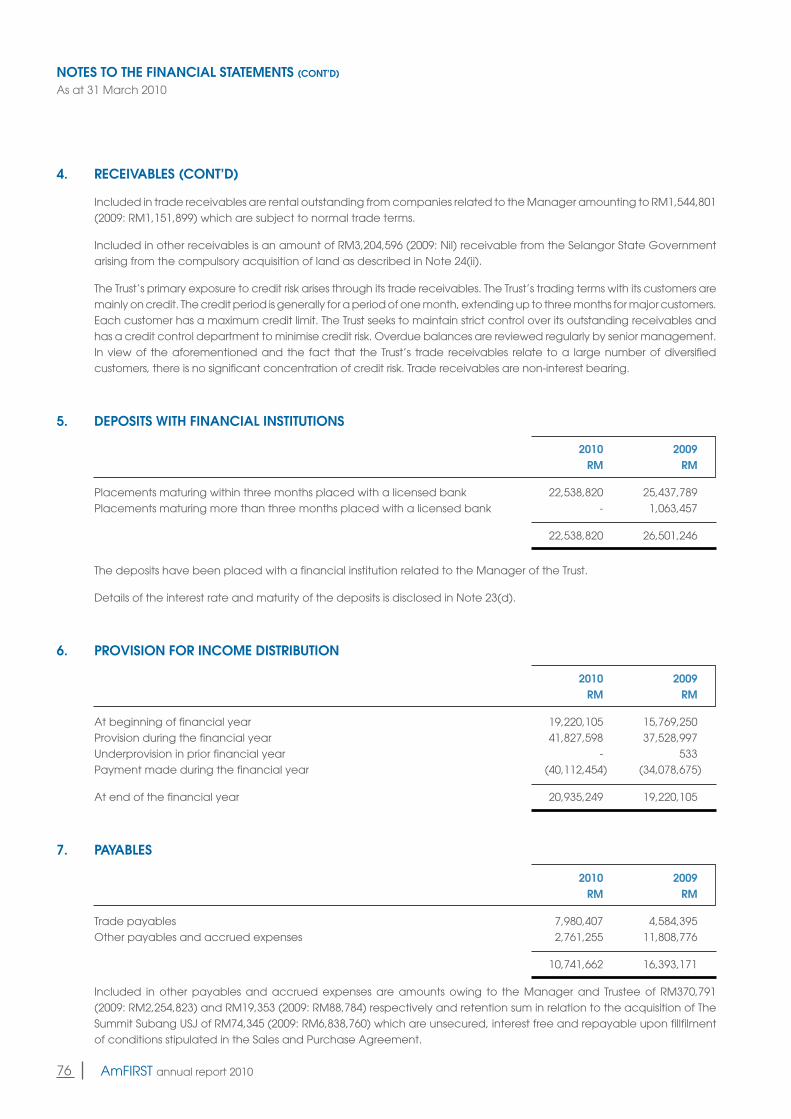
76 AmFIRST annual report 2010 77AmFIRST annual report 2010
NOTES TO THE FINANCIAL STATEMENTS (CONT’D)
As at 31 March 2010
4. RECEIVABLES (CONT’D)
Included in trade receivables are rental outstanding from companies related to the Manager amounting to RM1,544,801 (2009: RM1,151,899) which are subject to normal trade terms.
Included in other receivables is an amount of RM3,204,596 (2009: Nil) receivable from the Selangor State Government arising from the compulsory acquisition of land as described in Note 24(ii).
The Trust’s primary exposure to credit risk arises through its trade receivables. The Trust’s trading terms with its customers are mainly on credit. The credit period is generally for a period of one month, extending up to three months for major customers. Each customer has a maximum credit limit. The Trust seeks to maintain strict control over its outstanding receivables and hasacreditcontroldepartmenttominimisecreditrisk.Overduebalancesarereviewedregularlybyseniormanagement.In view of the aforementioned and the fact that the Trust’s trade receivables relate to a large number of diversified customers, there is no significant concentration of credit risk. Trade receivables are non-interest bearing.
5. DEPOSITS WITH FINANCIAL INSTITUTIONS
2010 2009 RM RM
Placements maturing within three months placed with a licensed bank 22,538,820 25,437,789Placements maturing more than three months placed with a licensed bank - 1,063,457
22,538,820 26,501,246
The deposits have been placed with a financial institution related to the Manager of the Trust.
Details of the interest rate and maturity of the deposits is disclosed in Note 23(d).
6. PROVISION FOR INCOME DISTRIBUTION
2010 2009 RM RM
At beginning of financial year 19,220,105 15,769,250Provision during the financial year 41,827,598 37,528,997Underprovision in prior financial year - 533Payment made during the financial year (40,112,454) (34,078,675)
At end of the financial year 20,935,249 19,220,105
7. PAYABLES
2010 2009 RM RM
Trade payables 7,980,407 4,584,395Otherpayablesandaccruedexpenses 2,761,255 11,808,776
10,741,662 16,393,171
Included in other payables and accrued expenses are amounts owing to the Manager and Trustee of RM370,791 (2009: RM2,254,823) and RM19,353 (2009: RM88,784) respectively and retention sum in relation to the acquisition of The Summit Subang USJ of RM74,345 (2009: RM6,838,760) which are unsecured, interest free and repayable upon fillfilment of conditions stipulated in the Sales and Purchase Agreement.
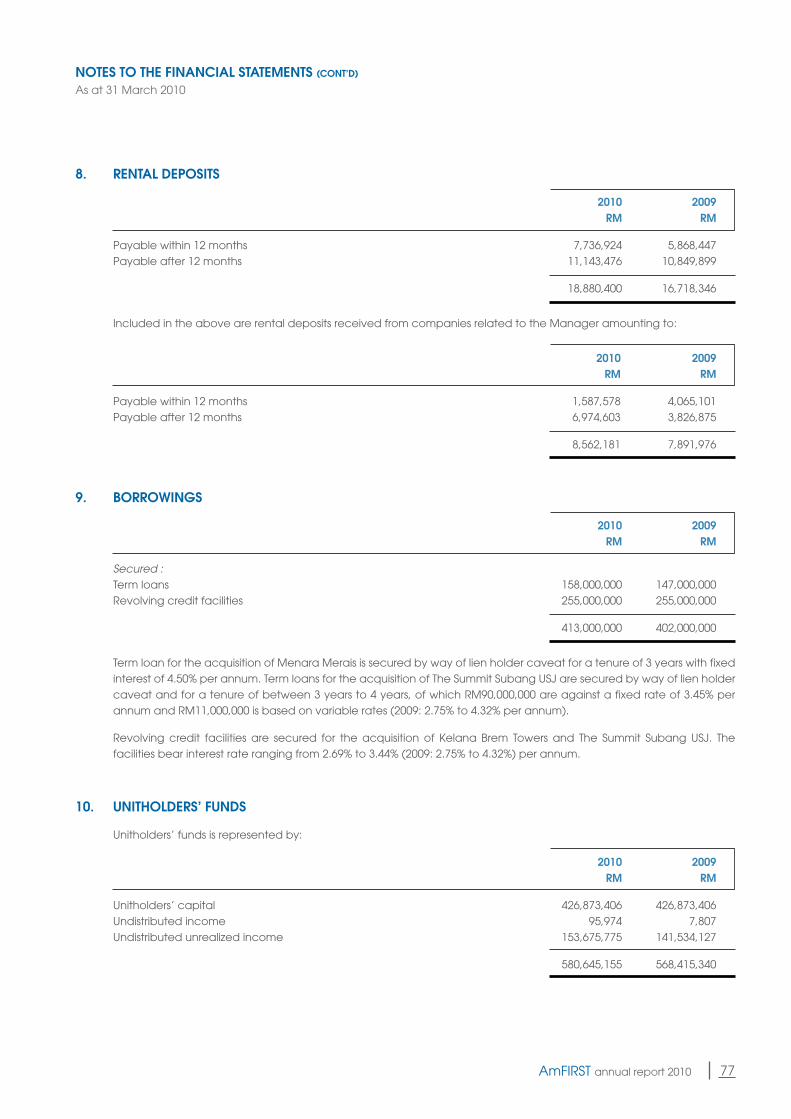
76 AmFIRST annual report 2010 77AmFIRST annual report 2010
NOTES TO THE FINANCIAL STATEMENTS (CONT’D)
As at 31 March 2010
8. RENTAL DEPOSITS
2010 2009 RM RM
Payable within 12 months 7,736,924 5,868,447Payable after 12 months 11,143,476 10,849,899
18,880,400 16,718,346
Included in the above are rental deposits received from companies related to the Manager amounting to:
2010 2009 RM RM
Payable within 12 months 1,587,578 4,065,101Payable after 12 months 6,974,603 3,826,875
8,562,181 7,891,976
9. BORROWINGS
2010 2009 RM RM
Secured :Term loans 158,000,000 147,000,000Revolving credit facilities 255,000,000 255,000,000
413,000,000 402,000,000
Term loan for the acquisition of Menara Merais is secured by way of lien holder caveat for a tenure of 3 years with fixed interest of 4.50% per annum. Term loans for the acquisition of The Summit Subang USJ are secured by way of lien holder caveat and for a tenure of between 3 years to 4 years, of which RM90,000,000 are against a fixed rate of 3.45% per annum and RM11,000,000 is based on variable rates (2009: 2.75% to 4.32% per annum).
Revolving credit facilities are secured for the acquisition of Kelana Brem Towers and The Summit Subang USJ. The facilities bear interest rate ranging from 2.69% to 3.44% (2009: 2.75% to 4.32%) per annum.
10. UNITHOLDERS’ FUNDS
Unitholders’ funds is represented by:
2010 2009 RM RM
Unitholders’ capital 426,873,406 426,873,406Undistributed income 95,974 7,807Undistributed unrealized income 153,675,775 141,534,127
580,645,155 568,415,340
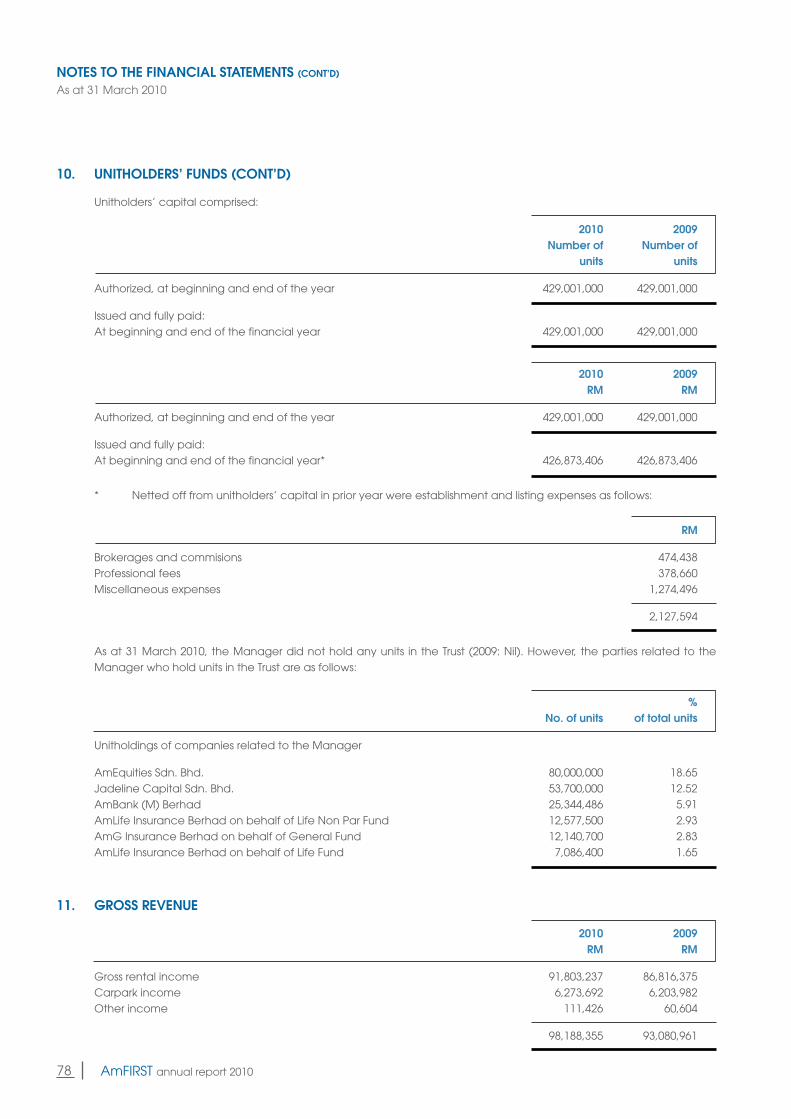
78 AmFIRST annual report 2010 79AmFIRST annual report 2010
NOTES TO THE FINANCIAL STATEMENTS (CONT’D)
As at 31 March 2010
10. UNITHOLDERS’ FUNDS (CONT’D)
Unitholders’ capital comprised:
2010 2009 Number of Number of units units
Authorized, at beginning and end of the year 429,001,000 429,001,000
Issued and fully paid:At beginning and end of the financial year 429,001,000 429,001,000
2010 2009 RM RM
Authorized, at beginning and end of the year 429,001,000 429,001,000
Issued and fully paid:At beginning and end of the financial year* 426,873,406 426,873,406
* Netted off from unitholders’ capital in prior year were establishment and listing expenses as follows:
RM
Brokerages and commisions 474,438Professional fees 378,660Miscellaneous expenses 1,274,496
2,127,594
As at 31 March 2010, the Manager did not hold any units in the Trust (2009: Nil). However, the parties related to the Manager who hold units in the Trust are as follows:
% No. of units of total units
Unitholdings of companies related to the Manager
AmEquities Sdn. Bhd. 80,000,000 18.65Jadeline Capital Sdn. Bhd. 53,700,000 12.52AmBank (M) Berhad 25,344,486 5.91AmLife Insurance Berhad on behalf of Life Non Par Fund 12,577,500 2.93AmG Insurance Berhad on behalf of General Fund 12,140,700 2.83AmLife Insurance Berhad on behalf of Life Fund 7,086,400 1.65
11. GROSS REVENUE
2010 2009 RM RM
Gross rental income 91,803,237 86,816,375Carpark income 6,273,692 6,203,982Otherincome 111,426 60,604
98,188,355 93,080,961
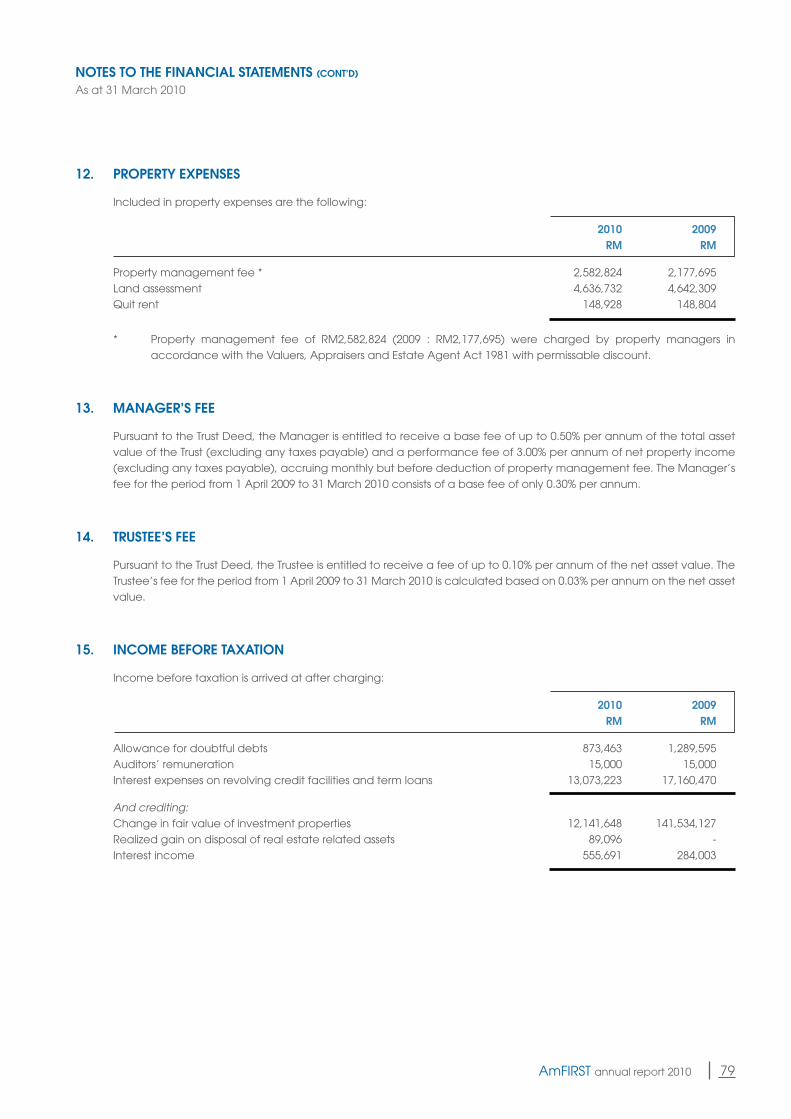
78 AmFIRST annual report 2010 79AmFIRST annual report 2010
NOTES TO THE FINANCIAL STATEMENTS (CONT’D)
As at 31 March 2010
12. PROPERTY EXPENSES
Included in property expenses are the following:
2010 2009 RM RM
Property management fee * 2,582,824 2,177,695Land assessment 4,636,732 4,642,309Quit rent 148,928 148,804
* Property management fee of RM2,582,824 (2009 : RM2,177,695) were charged by property managers in accordance with the Valuers, Appraisers and Estate Agent Act 1981 with permissable discount.
13. MANAGER’S FEE
Pursuant to the Trust Deed, the Manager is entitled to receive a base fee of up to 0.50% per annum of the total asset value of the Trust (excluding any taxes payable) and a performance fee of 3.00% per annum of net property income (excluding any taxes payable), accruing monthly but before deduction of property management fee. The Manager’s fee for the period from 1 April 2009 to 31 March 2010 consists of a base fee of only 0.30% per annum.
14. TRUSTEE’S FEE
Pursuant to the Trust Deed, the Trustee is entitled to receive a fee of up to 0.10% per annum of the net asset value. The Trustee’s fee for the period from 1 April 2009 to 31 March 2010 is calculated based on 0.03% per annum on the net asset value.
15. INCOME BEFORE TAXATION
Income before taxation is arrived at after charging:
2010 2009 RM RM
Allowance for doubtful debts 873,463 1,289,595Auditors’ remuneration 15,000 15,000Interest expenses on revolving credit facilities and term loans 13,073,223 17,160,470
And crediting:Change in fair value of investment properties 12,141,648 141,534,127Realized gain on disposal of real estate related assets 89,096 -Interest income 555,691 284,003
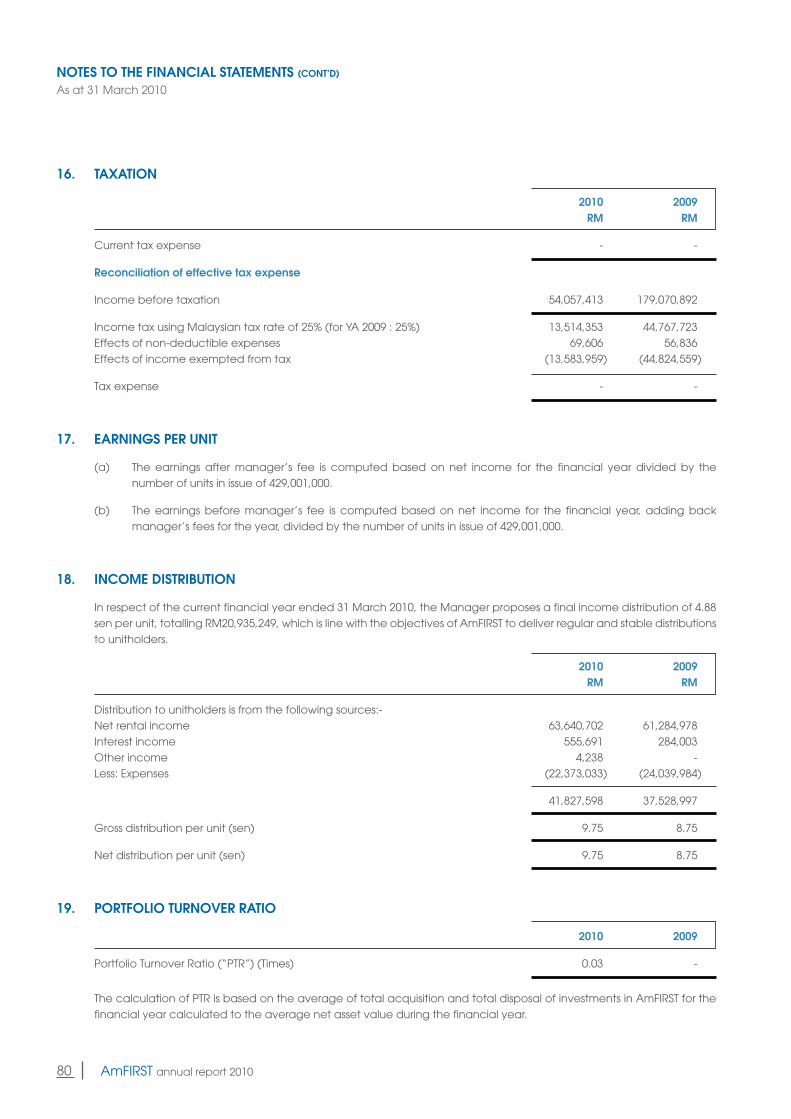
80 AmFIRST annual report 2010 81AmFIRST annual report 2010
NOTES TO THE FINANCIAL STATEMENTS (CONT’D)
As at 31 March 2010
16. TAXATION
2010 2009 RM RM
Current tax expense - -
Reconciliation of effective tax expense
Income before taxation 54,057,413 179,070,892
Income tax using Malaysian tax rate of 25% (for YA 2009 : 25%) 13,514,353 44,767,723Effects of non-deductible expenses 69,606 56,836Effects of income exempted from tax (13,583,959) (44,824,559)
Tax expense - -
17. EARNINGS PER UNIT
(a) The earnings after manager’s fee is computed based on net income for the financial year divided by the number of units in issue of 429,001,000.
(b) The earnings before manager’s fee is computed based on net income for the financial year, adding back manager’s fees for the year, divided by the number of units in issue of 429,001,000.
18. INCOME DISTRIBUTION
In respect of the current financial year ended 31 March 2010, the Manager proposes a final income distribution of 4.88 sen per unit, totalling RM20,935,249, which is line with the objectives of AmFIRST to deliver regular and stable distributions to unitholders.
2010 2009 RM RM
Distribution to unitholders is from the following sources:-Net rental income 63,640,702 61,284,978Interest income 555,691 284,003Otherincome 4,238 -Less: Expenses (22,373,033) (24,039,984)
41,827,598 37,528,997
Gross distribution per unit (sen) 9.75 8.75
Net distribution per unit (sen) 9.75 8.75
19. PORTFOLIO TURNOVER RATIO
2010 2009
Portfolio Turnover Ratio (“PTR”) (Times) 0.03 -
The calculation of PTR is based on the average of total acquisition and total disposal of investments in AmFIRST for the financial year calculated to the average net asset value during the financial year.
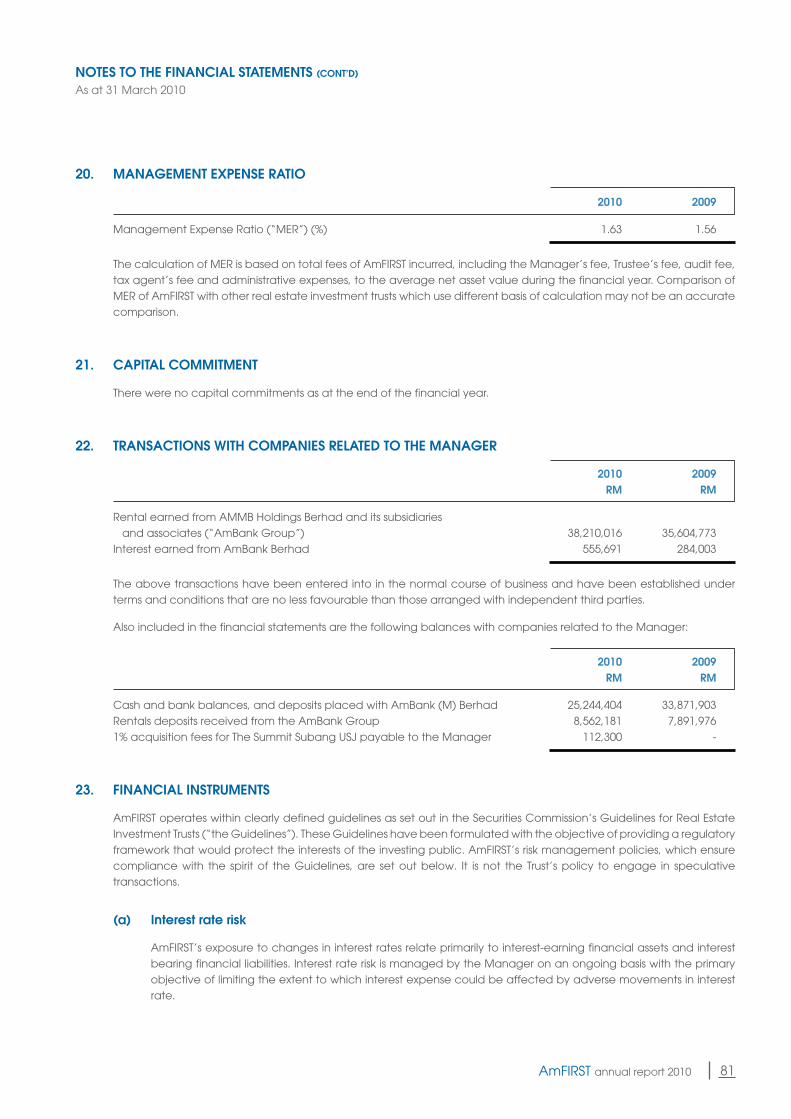
80 AmFIRST annual report 2010 81AmFIRST annual report 2010
NOTES TO THE FINANCIAL STATEMENTS (CONT’D)
As at 31 March 2010
20. MANAGEMENT EXPENSE RATIO
2010 2009
Management Expense Ratio (“MER”) (%) 1.63 1.56
The calculation of MER is based on total fees of AmFIRST incurred, including the Manager’s fee, Trustee’s fee, audit fee, tax agent’s fee and administrative expenses, to the average net asset value during the financial year. Comparison of MER of AmFIRST with other real estate investment trusts which use different basis of calculation may not be an accurate comparison.
21. CAPITAL COMMITMENT
There were no capital commitments as at the end of the financial year.
22. TRANSACTIONS WITH COMPANIES RELATED TO THE MANAGER
2010 2009 RM RM
Rental earned from AMMB Holdings Berhad and its subsidiaries and associates (“AmBank Group”) 38,210,016 35,604,773Interest earned from AmBank Berhad 555,691 284,003
The above transactions have been entered into in the normal course of business and have been established under terms and conditions that are no less favourable than those arranged with independent third parties.
Also included in the financial statements are the following balances with companies related to the Manager:
2010 2009 RM RM
Cash and bank balances, and deposits placed with AmBank (M) Berhad 25,244,404 33,871,903Rentals deposits received from the AmBank Group 8,562,181 7,891,9761% acquisition fees for The Summit Subang USJ payable to the Manager 112,300 -
23. FINANCIAL INSTRUMENTS
AmFIRST operates within clearly defined guidelines as set out in the Securities Commission’s Guidelines for Real Estate Investment Trusts (“the Guidelines”). These Guidelines have been formulated with the objective of providing a regulatory framework that would protect the interests of the investing public. AmFIRST’s risk management policies, which ensure compliance with the spirit of the Guidelines, are set out below. It is not the Trust’s policy to engage in speculative transactions.
(a) Interest rate risk
AmFIRST’s exposure to changes in interest rates relate primarily to interest-earning financial assets and interest bearing financial liabilities. Interest rate risk is managed by the Manager on an ongoing basis with the primary objective of limiting the extent to which interest expense could be affected by adverse movements in interest rate.
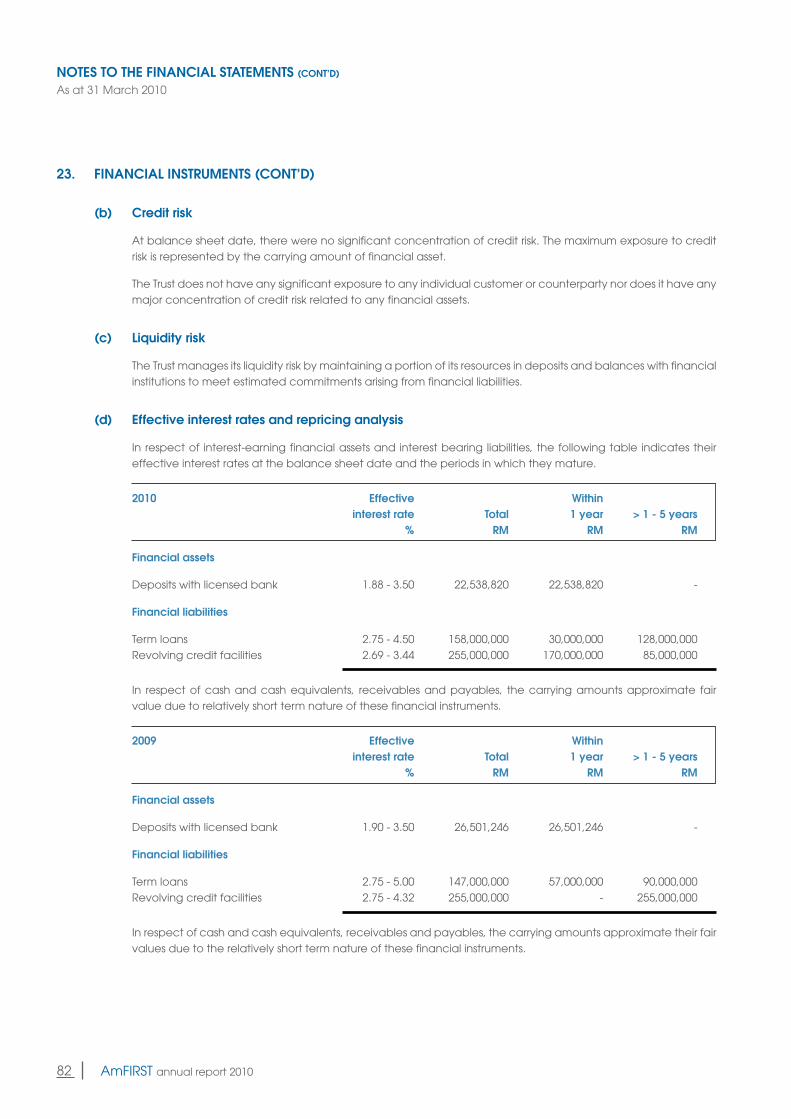
82 AmFIRST annual report 2010 83AmFIRST annual report 2010
NOTES TO THE FINANCIAL STATEMENTS (CONT’D)
As at 31 March 2010
23. FINANCIAL INSTRUMENTS (CONT’D)
(b) Credit risk
At balance sheet date, there were no significant concentration of credit risk. The maximum exposure to credit risk is represented by the carrying amount of financial asset.
The Trust does not have any significant exposure to any individual customer or counterparty nor does it have any major concentration of credit risk related to any financial assets.
(c) Liquidity risk
The Trust manages its liquidity risk by maintaining a portion of its resources in deposits and balances with financial institutions to meet estimated commitments arising from financial liabilities.
(d) Effective interest rates and repricing analysis
In respect of interest-earning financial assets and interest bearing liabilities, the following table indicates their effective interest rates at the balance sheet date and the periods in which they mature.
2010 Effective Within interest rate Total 1 year > 1 - 5 years % RM RM RM
Financial assets
Deposits with licensed bank 1.88 - 3.50 22,538,820 22,538,820 -
Financial liabilities
Term loans 2.75 - 4.50 158,000,000 30,000,000 128,000,000Revolving credit facilities 2.69 - 3.44 255,000,000 170,000,000 85,000,000
In respect of cash and cash equivalents, receivables and payables, the carrying amounts approximate fair value due to relatively short term nature of these financial instruments.
2009 Effective Within interest rate Total 1 year > 1 - 5 years % RM RM RM
Financial assets
Deposits with licensed bank 1.90 - 3.50 26,501,246 26,501,246 -
Financial liabilities
Term loans 2.75 - 5.00 147,000,000 57,000,000 90,000,000Revolving credit facilities 2.75 - 4.32 255,000,000 - 255,000,000
In respect of cash and cash equivalents, receivables and payables, the carrying amounts approximate their fair values due to the relatively short term nature of these financial instruments.
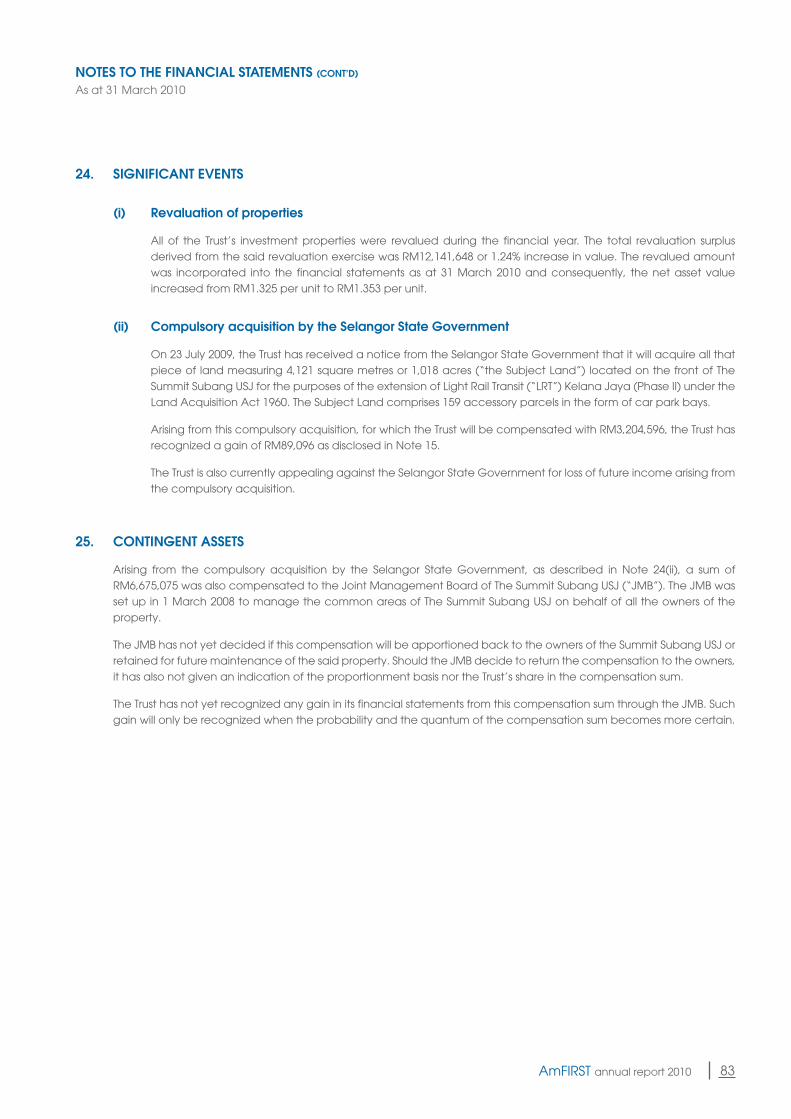
82 AmFIRST annual report 2010 83AmFIRST annual report 2010
24. SIGNIFICANT EVENTS
(i) Revaluation of properties
All of the Trust’s investment properties were revalued during the financial year. The total revaluation surplus derived from the said revaluation exercise was RM12,141,648 or 1.24% increase in value. The revalued amount was incorporated into the financial statements as at 31 March 2010 and consequently, the net asset value increased from RM1.325 per unit to RM1.353 per unit.
(ii) Compulsory acquisition by the Selangor State Government
On23July2009,theTrusthasreceivedanoticefromtheSelangorStateGovernmentthatitwillacquireallthatpiece of land measuring 4,121 square metres or 1,018 acres (“the Subject Land”) located on the front of The Summit Subang USJ for the purposes of the extension of Light Rail Transit (“LRT”) Kelana Jaya (Phase II) under the Land Acquisition Act 1960. The Subject Land comprises 159 accessory parcels in the form of car park bays.
Arising from this compulsory acquisition, for which the Trust will be compensated with RM3,204,596, the Trust has recognized a gain of RM89,096 as disclosed in Note 15.
The Trust is also currently appealing against the Selangor State Government for loss of future income arising from the compulsory acquisition.
25. CONTINGENT ASSETS
Arising from the compulsory acquisition by the Selangor State Government, as described in Note 24(ii), a sum of RM6,675,075 was also compensated to the Joint Management Board of The Summit Subang USJ (“JMB”). The JMB was set up in 1 March 2008 to manage the common areas of The Summit Subang USJ on behalf of all the owners of the property.
The JMB has not yet decided if this compensation will be apportioned back to the owners of the Summit Subang USJ or retained for future maintenance of the said property. Should the JMB decide to return the compensation to the owners, it has also not given an indication of the proportionment basis nor the Trust’s share in the compensation sum.
The Trust has not yet recognized any gain in its financial statements from this compensation sum through the JMB. Such gain will only be recognized when the probability and the quantum of the compensation sum becomes more certain.
NOTES TO THE FINANCIAL STATEMENTS (CONT’D)
As at 31 March 2010
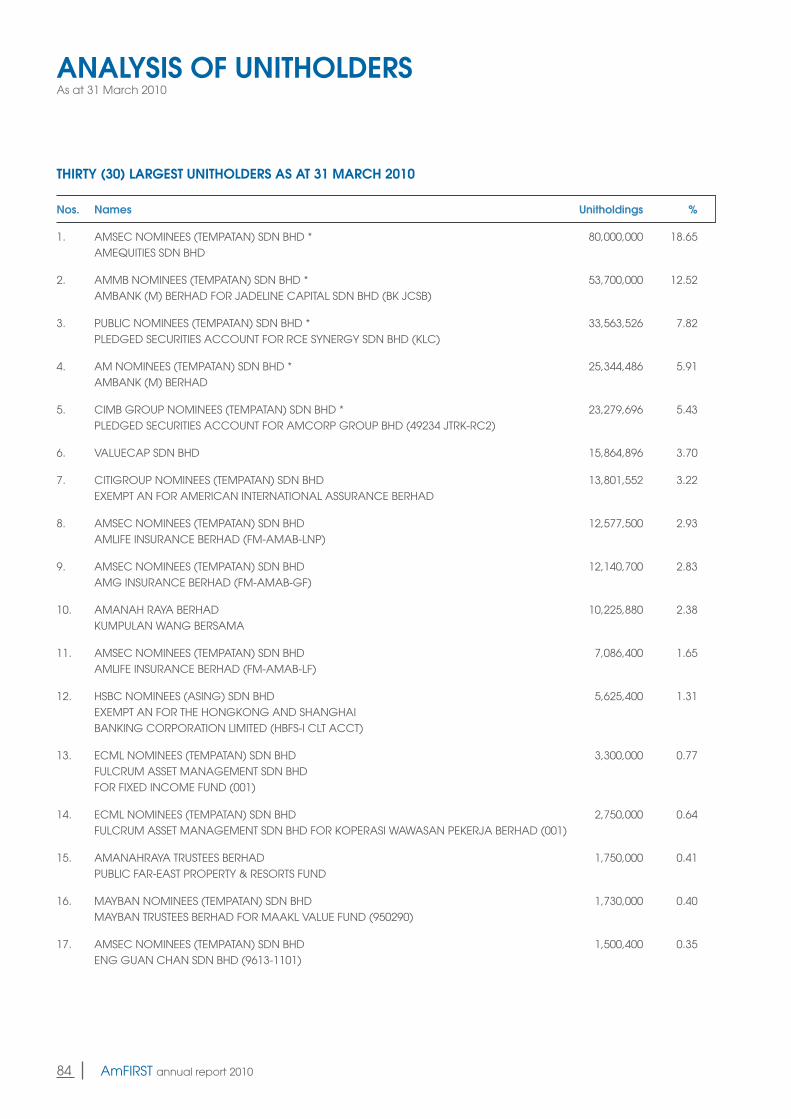
84 AmFIRST annual report 2010 85AmFIRST annual report 2010
ANALYSIS OF UNITHOLDERSAs at 31 March 2010
THIRTY (30) LARGEST UNITHOLDERS AS AT 31 MARCH 2010
Nos. Names Unitholdings %
1. AMSECNOMINEES(TEMPATAN)SDNBHD* 80,000,000 18.65 AMEQUITIES SDN BHD
2. AMMBNOMINEES(TEMPATAN)SDNBHD* 53,700,000 12.52 AMBANK(M)BERHADFORJADELINECAPITALSDNBHD(BKJCSB)
3. PUBLICNOMINEES(TEMPATAN)SDNBHD* 33,563,526 7.82 PLEDGEDSECURITIESACCOUNTFORRCESYNERGYSDNBHD(KLC)
4. AMNOMINEES(TEMPATAN)SDNBHD* 25,344,486 5.91 AMBANK (M) BERHAD
5. CIMBGROUPNOMINEES(TEMPATAN)SDNBHD* 23,279,696 5.43 PLEDGEDSECURITIESACCOUNTFORAMCORPGROUPBHD(49234JTRK-RC2)
6. VALUECAP SDN BHD 15,864,896 3.70
7. CITIGROUPNOMINEES(TEMPATAN)SDNBHD 13,801,552 3.22 EXEMPTANFORAMERICANINTERNATIONALASSURANCEBERHAD
8. AMSECNOMINEES(TEMPATAN)SDNBHD 12,577,500 2.93 AMLIFE INSURANCE BERHAD (FM-AMAB-LNP)
9. AMSECNOMINEES(TEMPATAN)SDNBHD 12,140,700 2.83 AMG INSURANCE BERHAD (FM-AMAB-GF)
10. AMANAH RAYA BERHAD 10,225,880 2.38 KUMPULAN WANG BERSAMA
11. AMSECNOMINEES(TEMPATAN)SDNBHD 7,086,400 1.65 AMLIFE INSURANCE BERHAD (FM-AMAB-LF)
12. HSBCNOMINEES(ASING)SDNBHD 5,625,400 1.31 EXEMPTANFORTHEHONGKONGANDSHANGHAI BANKINGCORPORATIONLIMITED(HBFS-ICLTACCT)
13. ECMLNOMINEES(TEMPATAN)SDNBHD 3,300,000 0.77 FULCRUM ASSET MANAGEMENT SDN BHD FORFIXEDINCOMEFUND(001)
14. ECMLNOMINEES(TEMPATAN)SDNBHD 2,750,000 0.64 FULCRUMASSETMANAGEMENTSDNBHDFORKOPERASIWAWASANPEKERJABERHAD(001)
15. AMANAHRAYA TRUSTEES BERHAD 1,750,000 0.41 PUBLICFAR-EASTPROPERTY&RESORTSFUND
16. MAYBANNOMINEES(TEMPATAN)SDNBHD 1,730,000 0.40 MAYBANTRUSTEESBERHADFORMAAKLVALUEFUND(950290)
17. AMSECNOMINEES(TEMPATAN)SDNBHD 1,500,400 0.35 ENG GUAN CHAN SDN BHD (9613-1101)
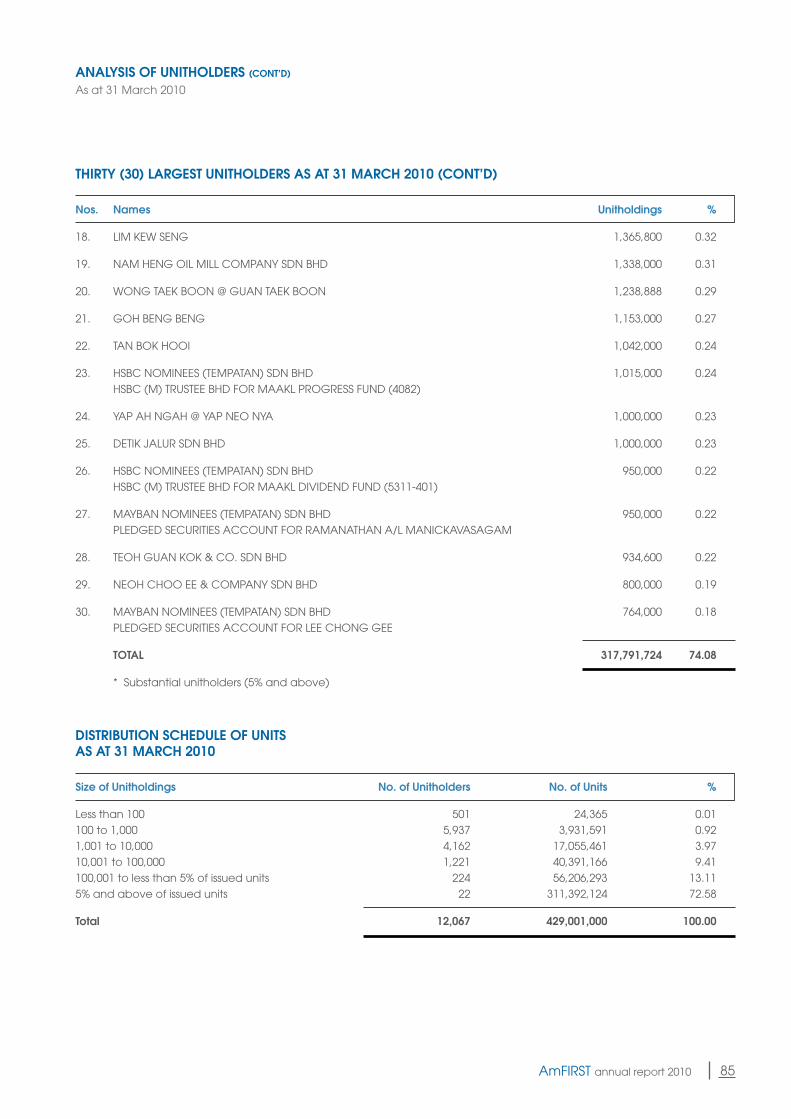
84 AmFIRST annual report 2010 85AmFIRST annual report 2010
ANALYSIS OF UNITHOLDERS (CONT’D)
As at 31 March 2010
THIRTY (30) LARGEST UNITHOLDERS AS AT 31 MARCH 2010 (CONT’D)
Nos. Names Unitholdings %
18. LIM KEW SENG 1,365,800 0.32
19. NAMHENGOILMILLCOMPANYSDNBHD 1,338,000 0.31
20. WONGTAEKBOON@GUANTAEKBOON 1,238,888 0.29
21. GOHBENGBENG 1,153,000 0.27
22. TANBOKHOOI 1,042,000 0.24
23. HSBCNOMINEES(TEMPATAN)SDNBHD 1,015,000 0.24 HSBC(M)TRUSTEEBHDFORMAAKLPROGRESSFUND(4082)
24. YAPAHNGAH@YAPNEONYA 1,000,000 0.23
25. DETIK JALUR SDN BHD 1,000,000 0.23
26. HSBCNOMINEES(TEMPATAN)SDNBHD 950,000 0.22 HSBC(M)TRUSTEEBHDFORMAAKLDIVIDENDFUND(5311-401)
27. MAYBANNOMINEES(TEMPATAN)SDNBHD 950,000 0.22 PLEDGEDSECURITIESACCOUNTFORRAMANATHANA/LMANICKAVASAGAM
28. TEOHGUANKOK&CO.SDNBHD 934,600 0.22
29. NEOHCHOOEE&COMPANYSDNBHD 800,000 0.19
30. MAYBANNOMINEES(TEMPATAN)SDNBHD 764,000 0.18 PLEDGEDSECURITIESACCOUNTFORLEECHONGGEE
TOTAL 317,791,724 74.08
* Substantial unitholders (5% and above)
DISTRIBUTION SCHEDULE OF UNITSAS AT 31 MARCH 2010
Size of Unitholdings No. of Unitholders No. of Units %
Less than 100 501 24,365 0.01100 to 1,000 5,937 3,931,591 0.921,001 to 10,000 4,162 17,055,461 3.9710,001 to 100,000 1,221 40,391,166 9.41100,001 to less than 5% of issued units 224 56,206,293 13.115% and above of issued units 22 311,392,124 72.58
Total 12,067 429,001,000 100.00
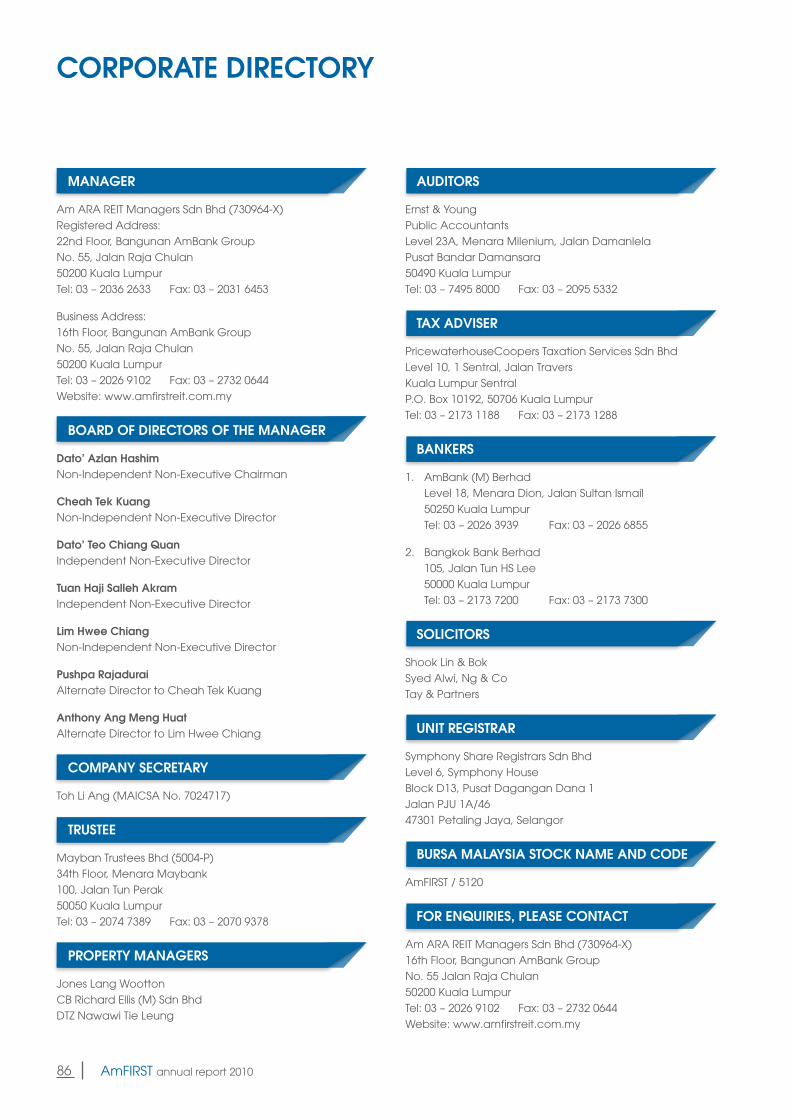
86 AmFIRST annual report 2010
CORPORATE DIRECTORY
MANAGER
Am ARA REIT Managers Sdn Bhd (730964-X)Registered Address:22nd Floor, Bangunan AmBank GroupNo. 55, Jalan Raja Chulan50200 Kuala LumpurTel: 03 – 2036 2633 Fax: 03 – 2031 6453
Business Address:16th Floor, Bangunan AmBank GroupNo. 55, Jalan Raja Chulan50200 Kuala LumpurTel: 03 – 2026 9102 Fax: 03 – 2732 0644Website: www.amfirstreit.com.my
BOARD OF DIRECTORS OF THE MANAGER
Dato’ Azlan HashimNon-Independent Non-Executive Chairman
Cheah Tek KuangNon-Independent Non-Executive Director
Dato’ Teo Chiang QuanIndependent Non-Executive Director
Tuan Haji Salleh AkramIndependent Non-Executive Director
Lim Hwee ChiangNon-Independent Non-Executive Director
Pushpa RajaduraiAlternate Director to Cheah Tek Kuang
Anthony Ang Meng HuatAlternate Director to Lim Hwee Chiang
COMPANY SECRETARY
Toh Li Ang (MAICSA No. 7024717)
TRUSTEE
Mayban Trustees Bhd (5004-P)34th Floor, Menara Maybank100, Jalan Tun Perak50050 Kuala LumpurTel: 03 – 2074 7389 Fax: 03 – 2070 9378
PROPERTY MANAGERS
Jones Lang WoottonCB Richard Ellis (M) Sdn BhdDTZ Nawawi Tie Leung
AUDITORS
Ernst & YoungPublic AccountantsLevel 23A, Menara Milenium, Jalan DamanlelaPusat Bandar Damansara50490 Kuala LumpurTel: 03 – 7495 8000 Fax: 03 – 2095 5332
TAX ADVISER
PricewaterhouseCoopers Taxation Services Sdn BhdLevel 10, 1 Sentral, Jalan TraversKuala Lumpur SentralP.O.Box10192,50706KualaLumpurTel: 03 – 2173 1188 Fax: 03 – 2173 1288
BANKERS
1. AmBank (M) Berhad Level 18, Menara Dion, Jalan Sultan Ismail 50250 Kuala Lumpur Tel: 03 – 2026 3939 Fax: 03 – 2026 6855
2. Bangkok Bank Berhad 105, Jalan Tun HS Lee 50000 Kuala Lumpur Tel: 03 – 2173 7200 Fax: 03 – 2173 7300
SOLICITORS
Shook Lin & BokSyed Alwi, Ng & CoTay & Partners
UNIT REGISTRAR
Symphony Share Registrars Sdn BhdLevel 6, Symphony HouseBlock D13, Pusat Dagangan Dana 1Jalan PJU 1A/4647301 Petaling Jaya, Selangor
BURSA MALAYSIA STOCK NAME AND CODE
AmFIRST / 5120
FOR ENQUIRIES, PLEASE CONTACT
Am ARA REIT Managers Sdn Bhd (730964-X)16th Floor, Bangunan AmBank GroupNo. 55 Jalan Raja Chulan50200 Kuala LumpurTel: 03 – 2026 9102 Fax: 03 – 2732 0644Website: www.amfirstreit.com.my
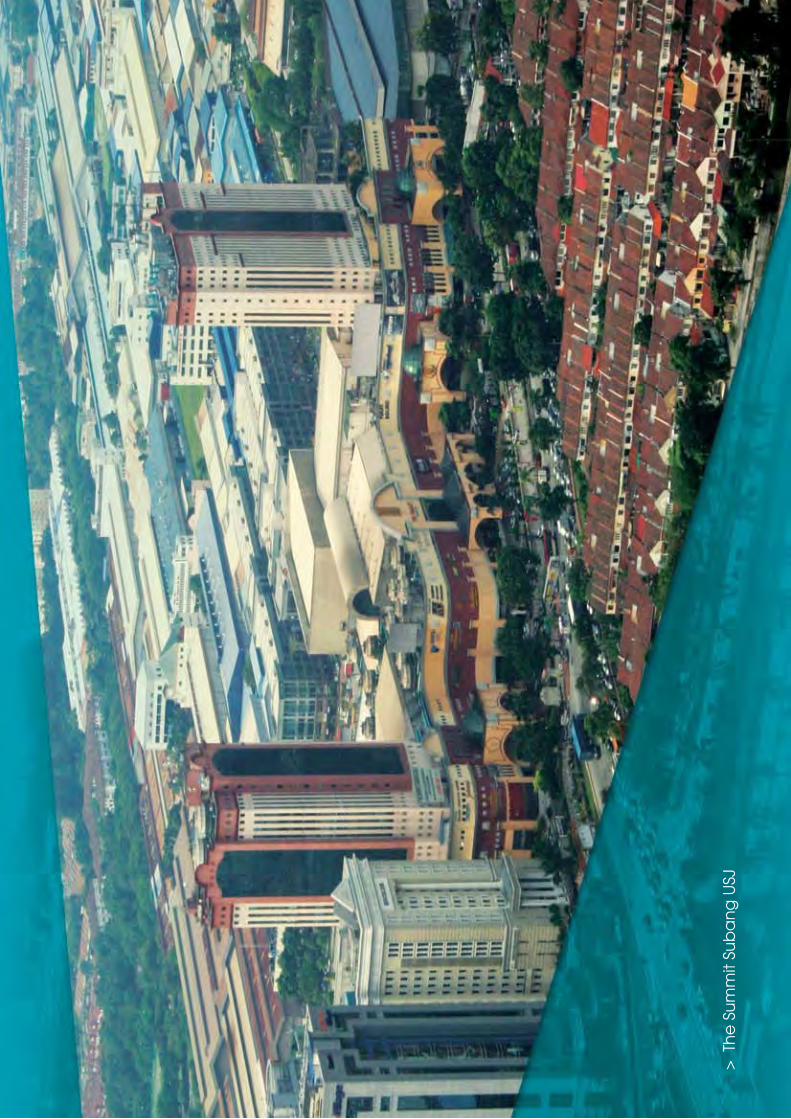
02 AmFIRST annual report 2010 03AmFIRST annual report 2010 > T
he
Su
mm
it Su
ba
ng
USJ