International Research Journal of Engineering and Technology (IRJET) e-ISSN: 2395-0056
Volume: 08 Issue: 07 | July 2021 www.irjet.net p-ISSN: 2395-0072
© 2021, IRJET | Impact Factor value: 7.529 | ISO 9001:2008 Certified Journal | Page 1068
Calculation of Land Surface Temperature Neighboring Thermal Power
Plant, NTPC-Singrauli, Using Geo-Spatial Techniques
Sachin Saurabh Pandey1, Dr Virendra Kumar2, Dr Sudhakar Shukla3
1M.Tech Scholar, School of Geoinformatics, RSAC-UP, Lucknow, Uttar Pradesh, India 2Head, Land Use and Urban Survey Division, RSAC-UP, Lucknow, Uttar Pradesh, India
3Head, School of Geoinformatics, RSAC-UP, Lucknow, Uttar Pradesh, India -------------------------------------------------------------------------***------------------------------------------------------------------------ Abstract – Power generation by the fossil fuels particularly by coal. The burning of coal result in more temperature rise
and earth average surface temperature. LST plays critical role in assessing the global temperature rise with the help of
Remote Sensing and GIS which have wide application in surface temperature analysis and climate change. India's energy
capital—Singrauli, has conglomerations of different thermal power plant and functional coal mine shafts. Prior, the region
was thickly forested, rich in biodiversity and home to different ancestral networks. In the last decade, there has been
extreme exploitation by the private sector for setting up huge scope power generation plants. Land surface temperature
(LST) has been studied for the National Thermal Power Plant. For the analysis of the LST LANDSAT (4-5) and LANDSAT 8
satellite data has been used. The analysis is done for year 1988 and year 2020. The calculation of LST is done with ArcGIS
Software for Singrauli area NTPC power plant. By analyzing various parameters, we can easily identify spectral reflectance
and Emissivity of surface Temperature. Various tools and techniques are used for enhancing the value of LST. Spectral
reflectance has been estimated using TIR and emissivity has been calculated by NDVI value. Finally LST for NTPC Singrauli
region has been studied and statistics are represented which define the change in temperature in the study area which is
around 10 0C.
Key Words: Remote sensing (RS) ,Land surface temperature (LST), Normalised Dfifferernce Vegetataion Index(NDVI)
,Climate change
1. INTRODUCTION
The Land Surface Temperature (LST) is also known as the earth surface temperature, as measured using the remote
sensor. It is estimated from Top-of-Atmosphere brightness temperatures from the infrared spectral channels of a
constellation of geostationary satellites. Its estimation further depends on the albedo, which is the percentage of solar
radiation that is absorbed by the land surface, the vegetation cover and the soil moisture.
LST includes vegetation and bare soil temperatures. Because both react rapidly to changes in incoming solar radiation due
to cloud cover and aerosol load modifications and diurnal variation of illumination, the LST displays quick variations too.
In turn, the LST influences the partition of energy between ground and vegetation, and determines the surface air
temperature Land surface temperature (LST) is a critical parameter in land surface cycles, not just going about as a key
indicator of environmental change, yet in addition because of its control of the upward terrestrial radiation, and therefore,
the control of the energy balance at the outside of the Earth LST is the temperature discharged by the outside of the Earth
and mesured in Kelvin. The increasing concentration of the green house gases in the atmosphere affects the LST greatly. As
the temperature rises, it brings about the liquefying of the glacial masses and ice sheets in the polar districts driving to
flood and ocean level ascent. Expansion in LST likewise influences the climatic state of the rainstorm nations like India
leading to flighty examples of precipitation. In this study the change in Land Surface Temperature is analyzed between
(January 1988 and January 2020). Data of Landsat (4-5) Thematic mapper and Landsat 8 operational land imager (OLI)
and Thermal Infrared Sensor (TIRS ) are used for study . Landsat (4-5) Band 6 is thermal band and Landsat 8 Band 10 is
used for the calculation of the Land Surface Temperature.
In this manner, Remote Sensing detecting is a significant marker to examine thermal varieties in metropolitan biological
system and its relationship with vegetation cover . The motivation behind this paper isn't to emphasize the grounded
connection among LST and NDVI, yet rather to delineate how once thickly forested, biodiversity rich and hostage coal save
Singrauli has been utilized by the private area for setting up of enormous scope influence plants, which thus has prompted
huge changes in the LST of the study region.
International Research Journal of Engineering and Technology (IRJET) e-ISSN: 2395-0056
Volume: 08 Issue: 07 | July 2021 www.irjet.net p-ISSN: 2395-0072
© 2021, IRJET | Impact Factor value: 7.529 | ISO 9001:2008 Certified Journal | Page 1069
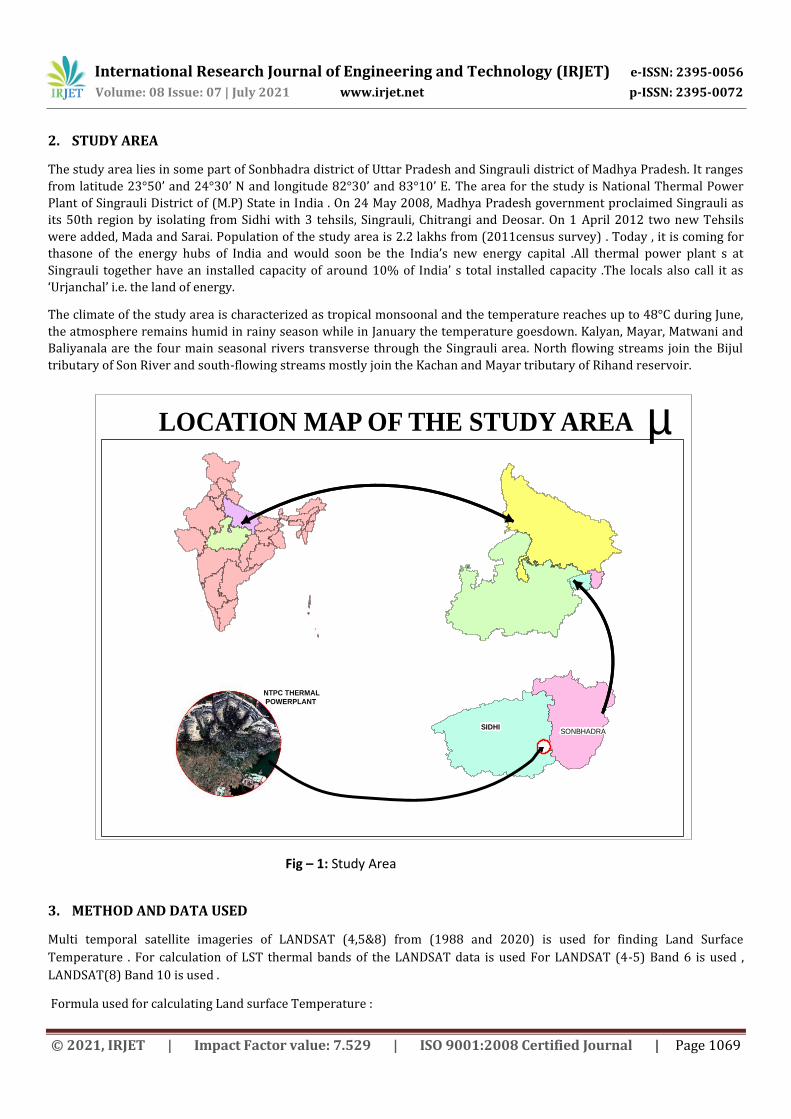
2. STUDY AREA
The study area lies in some part of Sonbhadra district of Uttar Pradesh and Singrauli district of Madhya Pradesh. It ranges
from latitude 23°50’ and 24°30’ N and longitude 82°30’ and 83°10’ E. The area for the study is National Thermal Power
Plant of Singrauli District of (M.P) State in India . On 24 May 2008, Madhya Pradesh government proclaimed Singrauli as
its 50th region by isolating from Sidhi with 3 tehsils, Singrauli, Chitrangi and Deosar. On 1 April 2012 two new Tehsils
were added, Mada and Sarai. Population of the study area is 2.2 lakhs from (2011census survey) . Today , it is coming for
thasone of the energy hubs of India and would soon be the India’s new energy capital .All thermal power plant s at
Singrauli together have an installed capacity of around 10% of India’ s total installed capacity .The locals also call it as
‘Urjanchal’ i.e. the land of energy.
The climate of the study area is characterized as tropical monsoonal and the temperature reaches up to 48°C during June,
the atmosphere remains humid in rainy season while in January the temperature goesdown. Kalyan, Mayar, Matwani and
Baliyanala are the four main seasonal rivers transverse through the Singrauli area. North flowing streams join the Bijul
tributary of Son River and south-flowing streams mostly join the Kachan and Mayar tributary of Rihand reservoir.
3. METHOD AND DATA USED
Multi temporal satellite imageries of LANDSAT (4,5&8) from (1988 and 2020) is used for finding Land Surface
Temperature . For calculation of LST thermal bands of the LANDSAT data is used For LANDSAT (4-5) Band 6 is used ,
LANDSAT(8) Band 10 is used .
Formula used for calculating Land surface Temperature :
LOCATION MAP OF THE STUDY AREA µ
SONBHADRASIDHI
NTPC THERMAL POWERPLANT
Fig – 1: Study Area
International Research Journal of Engineering and Technology (IRJET) e-ISSN: 2395-0056
Volume: 08 Issue: 07 | July 2021 www.irjet.net p-ISSN: 2395-0072
© 2021, IRJET | Impact Factor value: 7.529 | ISO 9001:2008 Certified Journal | Page 1070
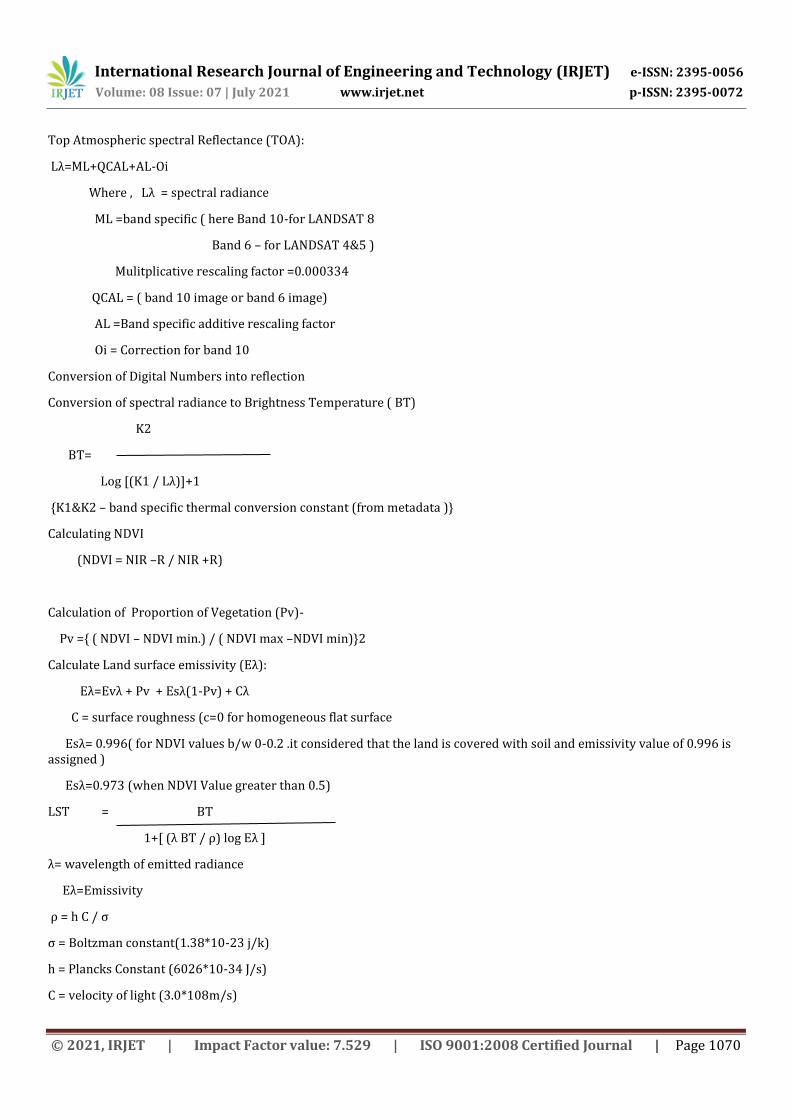
Top Atmospheric spectral Reflectance (TOA):
Lλ=ML+QCAL+AL-Oi
Where , Lλ = spectral radiance
ML =band specific ( here Band 10-for LANDSAT 8
Band 6 – for LANDSAT 4&5 )
Mulitplicative rescaling factor =0.000334
QCAL = ( band 10 image or band 6 image)
AL =Band specific additive rescaling factor
Oi = Correction for band 10
Conversion of Digital Numbers into reflection
Conversion of spectral radiance to Brightness Temperature ( BT)
K2
BT=
Log [(K1 / Lλ)]+1
{K1&K2 – band specific thermal conversion constant (from metadata )}
Calculating NDVI
(NDVI = NIR –R / NIR +R)
Calculation of Proportion of Vegetation (Pv)-
Pv ={ ( NDVI – NDVI min.) / ( NDVI max –NDVI min)}2
Calculate Land surface emissivity (Eλ):
Eλ=Evλ + Pv + Esλ(1-Pv) + Cλ
C = surface roughness (c=0 for homogeneous flat surface
Esλ= 0.996( for NDVI values b/w 0-0.2 .it considered that the land is covered with soil and emissivity value of 0.996 is assigned )
Esλ=0.973 (when NDVI Value greater than 0.5)
LST = BT
1+[ (λ BT / ρ) log Eλ ]
λ= wavelength of emitted radiance
Eλ=Emissivity
ρ = h C / σ
σ = Boltzman constant(1.38*10-23 j/k)
h = Plancks Constant (6026*10-34 J/s)
C = velocity of light (3.0*108m/s)
International Research Journal of Engineering and Technology (IRJET) e-ISSN: 2395-0056
Volume: 08 Issue: 07 | July 2021 www.irjet.net p-ISSN: 2395-0072
© 2021, IRJET | Impact Factor value: 7.529 | ISO 9001:2008 Certified Journal | Page 1071
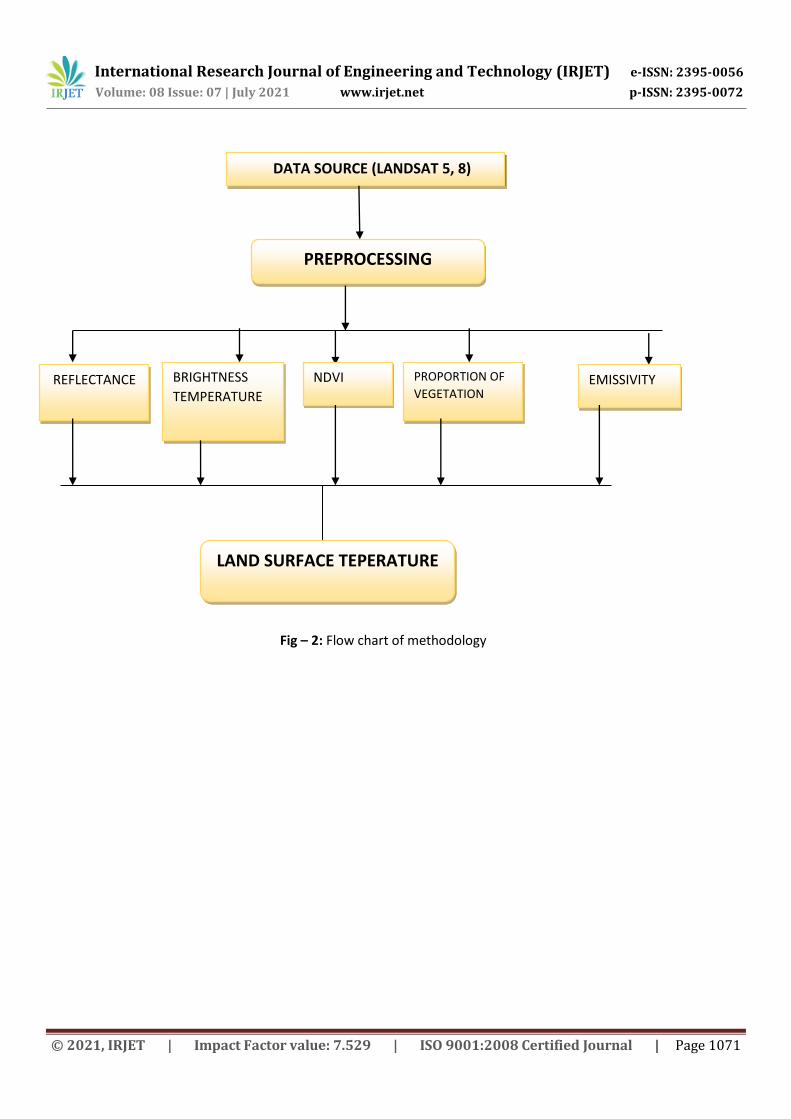
DATA SOURCE (LANDSAT 5, 8)
PREPROCESSING
REFLECTANCE BRIGHTNESS
TEMPERATURE
NDVI PROPORTION OF
VEGETATION EMISSIVITY
LAND SURFACE TEPERATURE
Fig – 2: Flow chart of methodology
International Research Journal of Engineering and Technology (IRJET) e-ISSN: 2395-0056
Volume: 08 Issue: 07 | July 2021 www.irjet.net p-ISSN: 2395-0072
© 2021, IRJET | Impact Factor value: 7.529 | ISO 9001:2008 Certified Journal | Page 1072
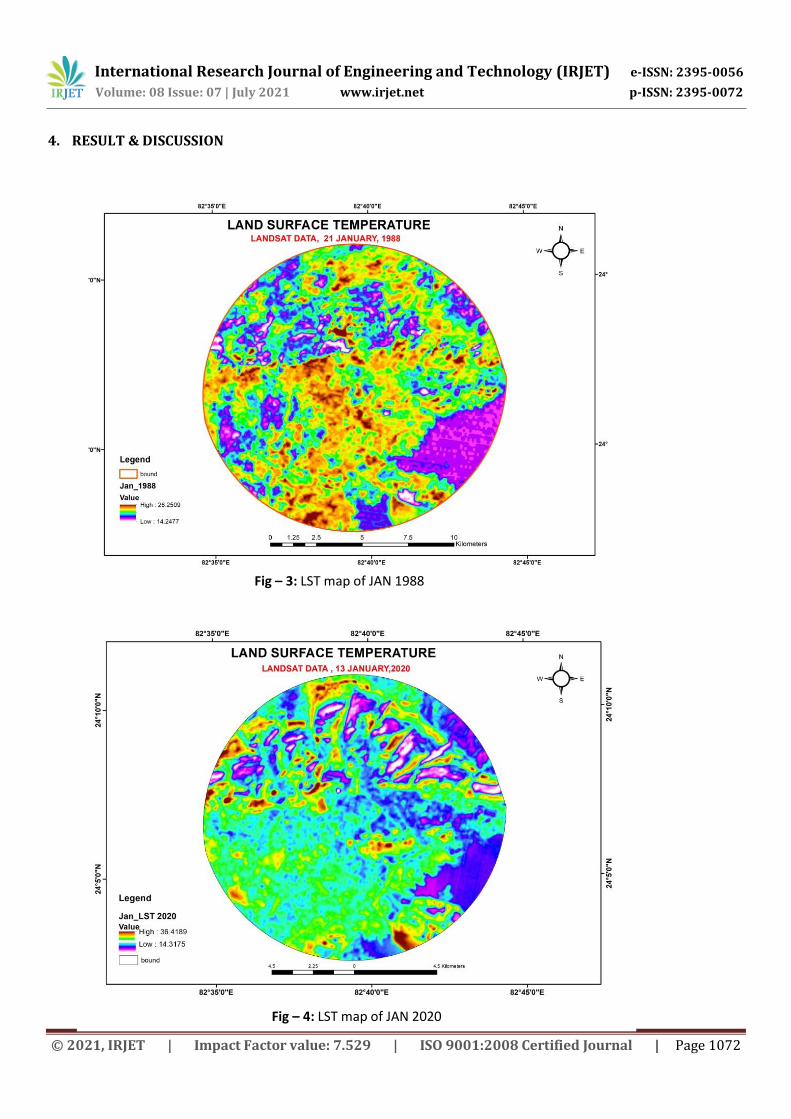
4. RESULT & DISCUSSION
Fig – 3: LST map of JAN 1988
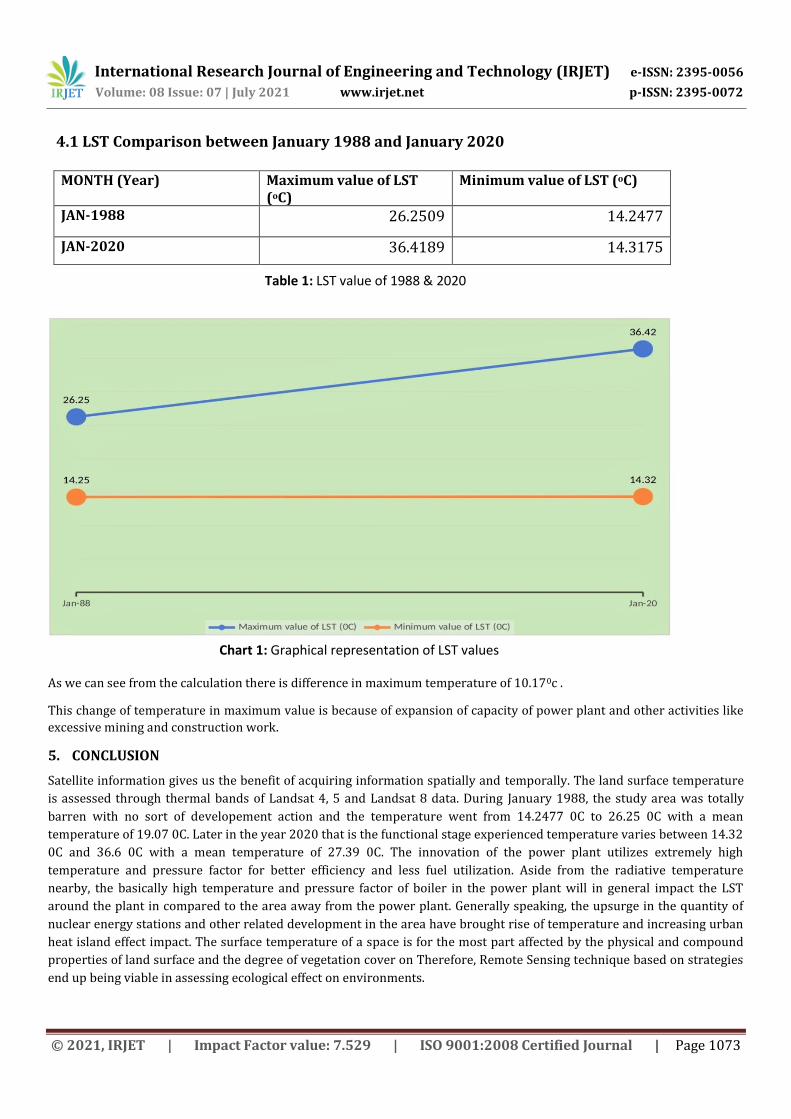
Fig – 4: LST map of JAN 2020
International Research Journal of Engineering and Technology (IRJET) e-ISSN: 2395-0056
Volume: 08 Issue: 07 | July 2021 www.irjet.net p-ISSN: 2395-0072
© 2021, IRJET | Impact Factor value: 7.529 | ISO 9001:2008 Certified Journal | Page 1073
4.1 LST Comparison between January 1988 and January 2020
MONTH (Year) Maximum value of LST (oC)
Minimum value of LST (oC)
JAN-1988 26.2509 14.2477
JAN-2020 36.4189 14.3175
As we can see from the calculation there is difference in maximum temperature of 10.170c .
This change of temperature in maximum value is because of expansion of capacity of power plant and other activities like
excessive mining and construction work.
5. CONCLUSION
Satellite information gives us the benefit of acquiring information spatially and temporally. The land surface temperature
is assessed through thermal bands of Landsat 4, 5 and Landsat 8 data. During January 1988, the study area was totally
barren with no sort of developement action and the temperature went from 14.2477 0C to 26.25 0C with a mean
temperature of 19.07 0C. Later in the year 2020 that is the functional stage experienced temperature varies between 14.32
0C and 36.6 0C with a mean temperature of 27.39 0C. The innovation of the power plant utilizes extremely high
temperature and pressure factor for better efficiency and less fuel utilization. Aside from the radiative temperature
nearby, the basically high temperature and pressure factor of boiler in the power plant will in general impact the LST
around the plant in compared to the area away from the power plant. Generally speaking, the upsurge in the quantity of
nuclear energy stations and other related development in the area have brought rise of temperature and increasing urban
heat island effect impact. The surface temperature of a space is for the most part affected by the physical and compound
properties of land surface and the degree of vegetation cover on Therefore, Remote Sensing technique based on strategies
end up being viable in assessing ecological effect on environments.
Table 1: LST value of 1988 & 2020
Chart 1: Graphical representation of LST values
International Research Journal of Engineering and Technology (IRJET) e-ISSN: 2395-0056
Volume: 08 Issue: 07 | July 2021 www.irjet.net p-ISSN: 2395-0072
© 2021, IRJET | Impact Factor value: 7.529 | ISO 9001:2008 Certified Journal | Page 1074
References 1. Aires, F., Prigent, C., Rossow, W. B., & Rothstein, M. (2001). A new neural network approach including first guess for
retrieval of atmospheric water vapor, cloud liquid water path, surface temperature, and emissivities over land from
satellite microwave observations. Journal of Geophysical Research: Atmospheres,106(D14), 14887–14907.
2. Sun, D., & Pinker, R. T. (2003). Estimation of land surface temperature from a Geostationary Operational
Environmental Satellite (GOES-8). Journal of Geophysical Research: Atmospheres, 108(D11), 4326.
3. Qin, Z., Karnieli, A., & Berliner, P. (2001). A mono-windowalgorithm for retrieving land surface temperature from
LandsatTM data and its application to the Israel-Egypt border region.International Journal of Remote Sensing, 22(18),
3719–3746.
4. Sobrino, J. A., El Kharraz, J., & Li, Z. L. (2003). Surface temperature and water vapour retrieval from MODIS data.
International Journal of Remote Sensing, 24(24), 5161–5182.
5. Becker, F., & Li, Z. L. (1990). Temperature-independent spectralindices in thermal infrared bands. Remote Sensing of
Environment,32(1), 17–33.
6. Price, J. C. (1984). Land surface temperature measurements fromthe split window channels of the NOAA 7 Advanced
Very HighResolution Radiometer. Journal of Geophysical Research Atmospheres,89(D5), 7231–7237.
7. Prata, A. J. (1994). Land surface temperatures derived from the advanced very high resolution radiometer and the
along-trackscanning radiometer: 2. Experimental results and validation of AVHRR algorithms. Journal of Geophysical
Research: Atmospheres, 99(D6), 13025–13058.
8. Sobrino, J. A., Jime´nez-Mun˜oz, J. C., & Paolini, L. (2004). Landsurface temperature retrieval from LANDSAT TM 5.
RemoteSensing of Environment, 90(4), 434–440.
9. Wan, Z., Wang, P., & Li, X. (2004). Using MODIS land surfacetemperature and normalized difference vegetation index
productsfor monitoring drought in the southern great plains, USA. InternationalJournal of Remote Sensing, 25(1), 61–
72.
10. Weng, Q., Lu, D., & Schubring, J. (2004). Estimation of landsurface temperature–vegetation abundance relationship for
urbanheat island studies. Remote Sensing of Environment, 89(4),467–483.
11. Landsat Project Science Office. (2002). Landsat 7 science datauser’s handbook (Goddard Space Flight Center).
12. Snyder, W. C., Wan, Z., Zhang, Y., & Feng, Y. Z. (1998).Classification-based emissivity for land surface
temperaturemeasurement from space. International Journal of RemoteSensing, 19(14), 2753–2774.
13. Nichol, J. E. (1994). A GIS-based approach to microclimatemonitoring in Singapore’s high-rise housing estates.
PhotogrammetricEngineering and Remote Sensing, 60(10),1225–1232.
14. Artis, D. A., & Carnahan, W. H. (1982). Survey of emissivityvariability in thermography of urban areas. Remote Sensing
ofEnvironment, 12(4), 313–329.Table 3 Pearson’s co-relation between NDVI and LSTLST Correlation matrix .
Recommended