Working Paper No. 42 THE POWER OF PROPAGANDA: PUBLIC OPINION IN ZIMBABWE, 2004 by Annie Chikwanha, Tulani Sithole and Michael Bratton
Copyright Afrobarometer
AFROBAROMETER WORKING PAPERS
Working Paper No. 42 THE POWER OF PROPAGANDA: PUBLIC OPINION IN ZIMBABWE, 2004
by Annie Chikwana, Tulani Sithole and Michael Bratton
August 2004 Annie Chikwana is Project Director for the Afrobarometer at the Institute for Democracy in South Africa (Idasa). Tulani Sithole is a Senior Researcher at the Mass Public Opinion Institute (MPOI) in Zimbabwe. Michael Bratton is a co-founder and co-Director of the Afrobarometer. He is also a Professor in the Department of Political Science and the African Studies Center at Michigan State University. The Afrobarometer Network is grateful to the Netherlands Ministry of Foreign Affairs and the U.S. Agency for International Development/Regional Center for Southern Africa for financial support for the collection of data, institutional capacity building, and the dissemination of results.
Copyright Afrobarometer
AFROBAROMETER WORKING PAPERS
Editors: Michael Bratton, E. Gyimah-Boadi, and Robert Mattes
Managing Editor: Carolyn Logan
Afrobarometer publications report the results of national sample surveys on the attitudes of citizens in selected African countries towards democracy, markets, civil society, and other aspects of development. The Afrobarometer is a collaborative enterprise of Michigan State University (MSU), the Institute for Democracy in South Africa (IDASA) and the Centre for Democratic Development (CDD, Ghana). Afrobarometer papers are simultaneously co-published by these partner institutions.
Working Papers and Briefings Papers can be downloaded in Adobe Acrobat format from www.afrobarometer.org.
Printed copies of Working Papers are available for $15.00 each plus applicable tax, shipping and handling charges. Orders may be directed to:
IDASA POS 6 Spin Street, Church Square Cape Town 8001 SOUTH AFRICA (phone: 27 21 461 5229, fax: 27 21 461 2589, e-mail: [email protected])
An invoice will be sent.
Idasa
Copyright Afrobarometer i
Publications List
AFROBAROMETER WORKING PAPERS
No.42 Chikwanha, Annie, Tulani Sithole and Michael Bratton. “The Power of Propaganda: Public Opinion in
Zimbabwe, 2004.” 2004. No.41 Mulenga, Chileshe L., Annie Barbara Chikwanha and Mbiko Msoni. “Satisfaction with Democracy and
Performance of the New Deal Government: Attitudes and Perceptions of Zambians.” 2004. No.40 Ferree, Karen E. “The Micro-Foundations of Ethnic Voting: Evidence from South Africa.” 2004. No.39 Cho, Wonbin. “Political Institutions and Satisfaction with Democracy in Sub-Saharan Africa.” 2004. No.38 Mattes, Robert. “Understanding Identity in Africa: A First Cut.” 2004. No.37 Leysens, Anthony J. “Marginalisation in Southern Africa: Transformation from Below?” 2004. No.36 Sall, Babaly and Zeric Kay Smith, with Mady Dansokho. “Libéralisme, Patrimonialisme ou Autoritarisme
Atténue : Variations autour de la Démocratie Sénégalaise.” 2004. No.35 Coulibaly, Massa and Amadou Diarra. “Démocratie et légtimation du marché: Rapport d’enquête
Afrobaromètre au Mali, décembre 2002.” 2004. No.34 The Afrobarometer Network. “Afrobarometer Round 2: Compendium of Results from a 15-Country
Survey.” 2004. No.33 Wolf, Tom, Carolyn Logan, and Jeremiah Owiti. “A New Dawn? Popular Optimism in Kenya After the
Transition,” 2004. No.32 Gay, John and Robert Mattes. “The State of Democracy in Lesotho.” 2004. No.31 Mattes, Robert and Michael Bratton. “Learning about Democracy in Africa: Awareness, Performance, and
Experience.” 2003 No.30 Pereira, Joao, Ines Raimundo, Annie Chikwanha, Alda Saute, and Robert Mattes. “Eight Years of
Multiparty Democracy in Mozambique: The Public’s View.” 2003 No.29 Gay, John. “Development as Freedom: A Virtuous Circle?” 2003. No.28 Gyimah-Boadi, E. and Kwabena Amoah Awuah Mensah. “The Growth of Democracy in Ghana. Despite
Economic Dissatisfaction: A Power Alternation Bonus?” 2003. No.27 Logan, Carolyn J., Nansozi Muwanga, Robert Sentamu, and Michael Bratton. “Insiders and Outsiders:
Varying Perceptions of Democracy and Governance in Uganda.” 2003. No.26 Norris, Pippa, and Robert Mattes. “Does Ethnicity Determine Support for the Governing Party?” 2003. No.25 Ames, Barry, Lucio Renno, and Francisco Rodrigues. “Democracy, Market Reform, and Social Peace in
Cape Verde.” 2003.
No.24 Mattes, Robert, Christiaan Keulder, Annie B. Chikwana, Cherrel Africa, and Yul Derek Davids. “Democratic Governance in South Africa: The People’s View.” 2003.
Copyright Afrobarometer ii
No.23 Mattes, Robert, Michael Bratton, and Yul Derek Davids. “Poverty, Survival, and Democracy in Southern Africa.” 2003.
No.22 Pereira, Joao C. G., Yul Derek Davids, and Robert Mattes. “Mozambicans’ Views of Democracy and
Political Reform: A Comparative Perspective.” 2003. No.21 Whiteside, Alan, Robert Mattes, Samantha Willan, and Ryann Manning. “Examining HIV/AIDS in
Southern Africa Through the Eyes of Ordinary Southern Africans.” 2002. No.20 Lewis, Peter, Etannibi Alemika, and Michael Bratton. “Down to Earth: Changes in Attitudes Towards
Democracy and Markets in Nigeria.” 2002. No.19 Bratton, Michael. “Wide but Shallow: Popular Support for Democracy in Africa.” 2002. No.18 Chaligha, Amon, Robert Mattes, Michael Bratton, and Yul Derek Davids. “Uncritical Citizens and Patient
Trustees? Tanzanians’ Views of Political and Economic Reform.” 2002. No.17 Simutanyi, Neo. “Challenges to Democratic Consolidation in Zambia: Public Attitudes to Democracy and
the Economy.” 2002. No.16 Tsoka, Maxton Grant. “Public Opinion and the Consolidation of Democracy in Malawi.” 2002. No.15 Keulder, Christiaan. “Public Opinion and Consolidation of Democracy in Namibia.” 2002. No.14 Lekorwe, Mogopodi, Mpho Molomo, Wilford Molefe, and Kabelo Moseki. “Public Attitudes Toward
Democracy, Governance, and Economic Development in Botswana.” 2001. No.13 Gay, John and Thuso Green. “Citizen Perceptions of Democracy, Governance, and Political Crisis in
Lesotho.” 2001. No.12 Chikwanha-Dzenga, Annie Barbara, Eldred Masunungure, and Nyasha Madingira. “Democracy and National
Governance in Zimbabwe: A Country Survey Report.” 2001. No. 11 The Afrobarometer Network. “Afrobarometer Round I: Compendium of Comparative Data from a Twelve-
Nation Survey.” 2002. No.10 Bratton, Michael and Robert Mattes. “Popular Economic Values and Economic Reform in Southern Africa.”
2001. No. 9 Bratton, Michael, Massa Coulibaly and Fabiana Machado. “Popular Perceptions of Good Governance in
Mali.” March 2000. No.8 Mattes, Robert, Yul Derek Davids and Cherrel Africa. “Views of Democracy in South Africa and the
Region: Trends and Comparisons.” October 2000.
No.7 Mattes, Robert, Yul Derek Davids, Cherrel Africa and Michael Bratton. “Public Opinion and the Consolidation of Democracy in Southern Africa.” July 2000.
No.6 Bratton, Michael and Gina Lambright. “Uganda’s Referendum 2000: The Silent Boycott.” 2001.
No.5 Bratton, Michael and Robert Mattes. “Democratic and Market Reforms in Africa: What ‘the People’ Say.”
2000.
No.4 Bratton, Michael, Gina Lambright, and Robert Sentamu. “Democracy and Economy in Uganda: A Public Opinion Perspective.” 2000.
Copyright Afrobarometer iii
No.3 Lewis, Peter M. and Michael Bratton. “Attitudes to Democracy and Markets in Nigeria.” 2000. No.2 Bratton, Michael, Peter Lewis and E. Gyimah-Boadi. “Attitudes to Democracy and Markets in Ghana.”
1999. No.1 Bratton, Michael and Robert Mattes. “Support for Democracy in Africa: Intrinsic or Instrumental?” 1999.
Copyright Afrobarometer iv
CONTENTS
Page
Executive Summary…………………………………………………….……. vi Introduction: A Country in Crisis.……………………………………….……1
An Economic Crisis………………………………………1
A Political Crisis………………………………………….3 The Squeeze on the Media………………………………..4
The Afrobarometer………………………….…………………….……………6
The Survey in Zimbabwe…………….……..……………………….…………6
Economic Deprivation….…………….…….………….……….……….….…..8
Political Acquiescence…….…….……………………….………….….……..15
Explaining a Paradox….…………….…….……….………….….…………...23 An Economic Upturn?…………………………………..23 Political Fear?…………………………………………...25 The Power of Propaganda?……………………………...27 Merging Explanations…………………………………...30
Conclusion and Way Forward…….…….…….……….……………….……..32
Copyright Afrobarometer v
EXECUTIVE SUMMARY
Based on a national sample survey conducted as part of Afrobarometer Round 2, this report probes the public mood in Zimbabwe in mid-2004. It documents changes in public opinion since 1999 and compares Zimbabwe to other African countries. Mass attitudes are measured in the context of a country that has encountered severe economic and political crises during the past five years.
The Afrobarometer survey finds that:
On the economy: * Zimbabweans feel economically deprived: more than half of all adults think that current living conditions are bad; and present generations think they are materially worse off than their parents. * Four in ten Zimbabweans report that they went without food “many times” in the previous year. Rates of persistent hunger are higher than in any other country surveyed. * More than other Africans, Zimbabweans are prone to hold government accountable for individual welfare. The most important popular priorities for government action are the management of the economy, unemployment, and food security. * Zimbabweans rarely mention land reform as a priority national problem; three quarters think that land acquisition should only be done by legal means and with compensation to owners. * Citizens give the government higher marks for combating AIDS than for creating jobs, keeping prices stable, or closing the gap between rich and poor. But the proportion is rising of those reporting they know someone who has died from AIDS. On politics: * Zimbabweans are losing faith in democracy. Expressed support for this form of government is down from two-thirds of citizens in 1999 to less than one half in 2004. * If rejection of authoritarian alternatives is included, then deep commitments to democracy are down still further. Increasing numbers acquiesce to the idea of single-party rule. * At the same time, political parties have not fully penetrated society; one half of all Zimbabweans prefers to remain unaligned with either ZANU-PF or MDC. Part of the reason is that three out of four think that party competition leads to social conflict. * By a margin of more than five to one, Zimbabweans overwhelmingly reject political violence. Whereas MDC supporters are more likely to support violence in support of a just cause, ZANU-PF partisans are more likely to have actually engaged in violent political acts. * Fewer than half say they trust Robert Mugabe and the ruling party. While hardly a strong endorsement of presidential popularity, these figures have risen since 1999. And they far exceed the small proportions who are willing to admit trusting Morgan Tsvangirai and opposition parties.
Copyright Afrobarometer vi
Explaining Mass Attitudes
Public opinion in Zimbabwe is therefore a paradox. While the economy has shrunk and hunger has become widespread, political support for the incumbent has apparently increased. The report ends by offering an explanation of this puzzle. * First, some people – like party loyalists, military forces, and resettled peasant farmers – have benefited from ZANU-PF patronage. They not only regard the economy as having turned up in the past year, but they credit the president with improvements in their own economic conditions. * Second, other people – especially the younger generation and rural dwellers – are afraid to express their true political preferences. Self-censorship is evident among those who think that the survey was sponsored by a government agency. They say they approve of the president when, in fact, they may not. * Third, the most important factor is political propaganda. Since 2000, the government has mounted a comprehensive campaign to revive the nationalist fervor of the liberation war. People who trust the ideological pronouncements of the official government media are very much more likely to give the president a positive rating. * Finally, Zimbabweans are sick and tired of the deadlock between the country’s two main political parties. Two-thirds of all respondents in the 2004 Afrobarometer survey in Zimbabwe consider that “problems in this country can only be solved if MDC and ZANU-PF sit down and talk with one another.”
Copyright Afrobarometer vii
THE POWER OF PROPOGANDA: PUBLIC OPINION IN ZIMBABWE, 2004 Introduction: A Country in Crisis
This report probes the public mood in Zimbabwe in mid-2004. Among many other
questions, it asks: How do Zimbabweans assess economic conditions in their country? And how do they feel about the performance of political leaders? To summarize results, we find that Zimbabweans are deeply concerned about eroding standards of living but, paradoxically, are increasingly resigned to the dominance of the incumbent government. We explain this outcome mainly in terms of the government’s squeeze on the media, which in recent years has denied citizens access to most sources of information except official propaganda. For this report, public opinion in Zimbabwe was measured by means of a nationally representative sample survey. Conducted as part of the cross-national Afrobarometer Round 2, the survey situates Zimbabwe in comparison to 15 other African nations. The survey instrument also repeats questions first asked in Zimbabwe in 1999, which allows us to see how public opinion is evolving over time. The five-year interval between 1999 and 2004 has been a tumultuous period for Zimbabwe. Twin crises – a sharp deterioration in the economy, and a violent political confrontation between government and opposition forces – have buffeted the country. By way of background, we first sketch these macro-economic and macro-political trends in order to set the scene for reviewing mass public opinion. An Economic Crisis
At the time of political independence in 1980, Zimbabwe inherited a diversified and productive economy, but one that was highly unequal. The country’s position as an exporter of food and cash crops was based upon a narrow sector of commercial agriculture, in which a small minority of whites – numbering no more than 70,000 in a population of nearly 12 million by the turn of the century – owned an overwhelming proportion of the most fertile land in the country. A widespread consensus emerged inside and outside of Zimbabwe in favour of redressing this disproportionate distribution of land. But over 20 years of independence, the Zimbabwe government was unable to amass the financial, legal, administrative, or technical capacity to undertake more than token land reform measures.
All this changed in 2000. In response to a series of challenges to its political dominance (see next section), the ruling Zimbabwe African National Union-Patriotic Front (ZANU-PF) embarked on a “fast-track” program of land seizures. The government enacted laws authorizing compulsory acquisition of land from white owners and encouraged political supporters (the “war veterans”) to take the law into their own hands by invading commercial farms. The land redistribution was violent, chaotic and corrupt and ended up benefiting politicians and supporters of the ruling party while doing little for the most needy or qualified peasant farmers. On all these grounds, the government’s approach to land reform was condemned locally and internationally in the independent media. At the same time, President Robert Mugabe could rightfully claim that he had dismantled the economic system over which the anti-colonial liberation war had been fought. The government’s economic strategy has proven extremely costly, however, leading to a macroeconomic crisis marked by the following features:
Copyright Afrobarometer 1
* Since the late 1990s, the country has been plagued by severe food shortages, caused partly by drought but also partly by the controversial land redistribution programme.1 In April 2003, food aid was being delivered to over 5.2 million people.2 And the United Nations World Food Programme forecast that the country had produced only half of its food grain needs for 2004.3 * Government controls that fixed the exchange rate of the Zimbabwe dollar undermined its value and led to emergence of a black market. Despite belated attempts at monetary reform,4 an overvalued currency has reduced exports and contributed to food, fuel and foreign exchange shortages.5 * Hyperinflation has caused extreme hardships for ordinary people. Since 2000, when it stood at around 60 percent, the annual inflation rate had shot up to 620 percent by November 2003.6 However, some economists find these figures too conservative, arguing that inflation was more likely to have peaked at over 1000 percent. * The collapse of many manufacturing and service industries has created mass unemployment and driven skilled labour from the country. Of the more than 2 million economic migrants who have left in search of greener pastures, some 14 percent have settled in Botswana and another 17 percent in South Africa.7 * Adding to these problems is the spectre of AIDS. The HIV prevalence rate is over 30 percent, making Zimbabwe one of Africa’s hardest hit countries. In urban areas, the infection rate is estimated to be around 40 percent and in the army, over 80 percent. With funeral attendance a cultural tradition, an estimated 2000 deaths per week further drag down economic productivity.8 * Only a decade ago, Zimbabwe’s health care system was among the best in Africa. Today, severe shortages of basic drugs and medical equipment are pushing hospitals and clinics close to ruin. Between 1999 and 2002, while infant mortality rates held steady in South Africa and declined in Malawi, they jumped by 15 percent in Zimbabwe.9
In sum, a once productive economy has been severely impaired. Indeed, the International Monetary Fund reports that Zimbabwe has the fastest shrinking economy in the world; its citizens have become “one third poorer in the last five years.”10
1 Overseas Development Institute, Food Security Crisis in Southern Africa: The Political Background to Policy Failure, http:/www.reliefweb.int/w/rwb.nsf/0, 2003. 2 Southern African Regional Poverty Network, Zimbabwe Emergency Food Security and Vulnerability Assessment, Report No.3, April, 2003. 3 Zimbabwe Vulnerability Assessment Committee, April 2004. Associated Press, “Zimbabwean Leaders Won’t Meet with UN,” June 15, 2004. 4 For example, the Reserve Bank of Zimbabwe announced a dual interest rate policy in November 2002 Under the policy, productive and export sectors received concessional credit, and rates for non-essential borrowing were determined by the market. 5 See International Monetary Fund, “IMF Concludes 2003 Article IV Consultation with Zimbabwe,” IMF Public Information Notice (PIN) no. 03/89, July 28, 2003 6 Government of Zimbabwe Central Statistical Office, Official Statistical Bulletin, 2003. 7 D.S. Tevera and J. Crush, “The New Brain Drain From Zimbabwe,” Migration Policy Series No.29, The Southern African Migration Project, 2003. 8 L. Bollinger, and J. Stover, R. Kerkhoven and D. Mukurazita, “The Economic Impact of Aids in Zimbabwe,” Features Group International and Centre for Development and Population Activities, 1999. 9 The United Nations Children’s Fund (UNICEF) as quoted in “Its Health System ‘In Tatters’, Zimbabwe Stands Defenceless,” New York Times, February 5, 2004. 10 The Economist, May 22, 2004, p. 43. See also IRINnews.org, http:/irinnews.org./report.asp.
Copyright Afrobarometer 2
A Political Crisis ZANU-PF has always justified its right to rule in terms of a nationalist ideology. In recent
years, the speeches of President Robert Mugabe have increasingly laid blame for Zimbabwe’s woes on a perceived coalition of external and internal enemies including the British government, white settlers, and a newly emerged opposition party, the Movement for Democratic Change (MDC). While Mugabe continues to claim leadership based on his credentials as an anti-imperialist freedom fighter, challenger Morgan Tsvangirai, president of the MDC, has sought to launch a new and alternative discourse. He argues that the leadership of the country should go to the political party with the most rational economic policies and the one that can win a free and fair election. Over the past five years, these differences between government and opposition have widened into violence and deadlock. This political crisis developed as follows: * The government was caught off guard in February 2000 when voters rejected a draft constitution that would have strengthened the powers of the presidency.11 This outburst of popular initiative inspired the labour movement and civil society to form a new political party. In the parliamentary elections of 2000, the MDC scooped almost half of the contested seats in the legislature. * In reaction to the erosion of its control over society, the government promulgated the Public Order and Security Act (POSA). Henceforth, any meeting of more than five people required the approval of the police and debate on political issues was effectively prohibited. Ironically, POSA restored many of the provisions of the colonial Law and Order Maintenance Act. * Fearing that young people were being attracted away by the opposition, the government drafted students bound for tertiary education into a National Youth Service. These “green bombers” were deployed to enforce public discipline, for example by punishing citizens for lacking party cards. Along with land invasions, these developments further established violence as a feature of Zimbabwean politics. * The presidential elections of 2002, which returned President Mugabe to office for a further six-year term, deepened the confrontation between government and opposition.12 ZANU-PF cadres disrupted opposition meetings and prevented campaigning in rural “no go” zones. Amid allegations of irregular voter rolls and a shortage of polling places in urban areas, election observers declared the elections “unfree and unfair.”13 * As the MDC mounted a court challenge to the election results and mobilized rolling mass work stoppages, ZANU-PF’s crackdown only intensified. The government charged Tsvangirai with treason over an alleged plot to kill Mugabe, harassed MDC MPs who tried to do their jobs as legislators, and arrested demonstrators who demanded a new constitution and changes in the country’s legal system. * In October 2003, against the backdrop of a bad harvest, international human rights monitors charged that the nation’s rulers were using food as a weapon by denying relief supplies to their critics.14 * Several attempts have been made to mediate the dispute between ZANU-PF and MDC, notably by the presidents of South Africa and Nigeria. But neither protagonist has budged from his entrenched position:
11 Masipula Sithole, “Fighting Authoritarianism in Zimbabwe,” Journal of Democracy 12 (2001): 160-169. 12 John Makumbe, “Zimbabwe’s Hijacked Election,” Journal of Democracy 13 (2002): 87-102. 13 See, for example, Southern African Development Community-Parliamentary Forum, 2002 Zimbabwe Presidential Election Observation Report, www.sadcpf.org. 14 Human Rights Watch, Not Eligible: The Politicisation of Food in Zimbabwe, New York, October 24, 2003.
Copyright Afrobarometer 3
President Mugabe insists on being recognized as the duly elected leader of the country; and Tsvangirai continues to call for unconditional negotiations and new elections.15 As the state has cracked down on society, citizens have lost civil liberties and political rights. Between 1998 and 2003, the country dropped down on the respected Freedom House Status of Freedom Index to a classification of squarely “not free.”16 According to this measure, the political environment in Zimbabwe today resembles that of contemporary Liberia, Cote d’Ivoire and the Democratic Republic of Congo. The Squeeze on the Media The closure of political space in Zimbabwe is starkly illustrated by the government’s effort to monopolize the flow of political information. The government has always owned a significant share of the news outlets in the mass media sector, with the Zimbabwe Broadcasting Corporation (ZBC) enjoying sole access to the television airwaves. The current period has seen a significant strengthening of government control over radio broadcasts and the print press as well. * From 1998 onwards, the government sought to impose a news blackout on its military expedition in the Democratic Republic of the Congo, which provoked direct confrontations with private newspapers, for example over casualties in the armed forces and profiteering by politicians. * To retaliate, the government charged the private press with distorting facts about the country and being on a mission to sabotage state security.17 Consistent with its nationalist ideology, the party paints private media houses as instruments of Western re-colonisation. * Before the February 2000 parliamentary elections, the state-controlled media launched a campaign to re-build national identity and appeal to young people to abide by the moral principles of the liberation struggle.18 The ZBC was restructured via a purge of journalists who refused to toe the new official line, and foreign program content was reduced to 25 percent. By December 2000, the state media added a communication strategy on land reform aimed at motivating people to apply for resettlement and to become productive farmers. * Following the 2002 presidential elections, control of the media was moved into the Office of the President, from where Minister of Information and Publicity oversaw the introduction of the toughest media laws in the country’s history. An Access to Information and Protection of Privacy Act (AIPPA) was promulgated, which requires the compulsory registration of journalists. Its enforcement has led to the prosecution of local journalists on flimsy grounds like “causing an article to be published” and to a blanket prohibition on the work of foreign correspondents. * In August 2002, the Harare offices of the “Voice of the People” radio station were firebombed. In September 2003, the government used AIPPA to force the closure of the Daily News, the most popular independent newspaper, which had an estimated daily readership of up to one million.
15 United States Institute of Peace, “Zimbabwe and the Prospects for Nonviolent Political Change,” Special Report No. 108, Washington D.C., August 2003. 16 Freedom House, Freedom in the World 2004 (New York: Rowman and Littlefield, 2004) gives Zimbabwe a score of 5 on both civil liberties and political rights in 1998 and a score of 6 on both in 2003. 17 M. Makoni, “Media Under Siege,” Moto, Issue No. 227/228, Dec.-Jan. 2000-2001. 18 Terence Ranger, “Nationalist Historiography, Patriotic History and the History of the Nation: The Struggle Over the Past in Zimbabwe,” Oxford University, St. Anthony’s College, 2004.
Copyright Afrobarometer 4
* In rural areas, where newspapers and television rarely reach, citizens were forced to attend rallies and overnight political orientation meetings (pungwes). Party youth lead the way in forcing villagers to chant pro-ZANU-PF and anti-MDC slogans. * To evade government restrictions, the opposition turned to the Internet to reach its urban supporters. Under a telecommunications act passed in 2002, Internet service providers have been closed down for failing to open their server records to government security departments. In June 2004, the government announced that it intended to censor “objectionable” e-mail messages. The net effect of the squeeze on the media is that most Zimbabweans – with the exception of the tiny fractions who read the remaining independent weeklies or own a short-wave radio or satellite TV – get only one side of the story. Because critics and opponents are prevented from getting their messages out, the majority of citizens hear only what the government wants them to hear. Thus, by 2003, the international Committee to Protect Journalists listed Zimbabwe among the 10 worst offenders of press freedom in the world.19 The Afrobarometer
The Afrobarometer is an independent, non-partisan research instrument that measures the social, political and economic atmosphere in Africa. By means of public opinion surveys administered to nationally representative samples of adult citizens, it reports what Africans think about conditions in their countries and the pressing policy issues of the day.
The project has three main objectives: to produce scientifically reliable data and analysis
on public attitudes; to build institutional capacity for survey research in Africa; and to broadly disseminate and apply results, especially among policy actors. The Afrobarometer operates as an international collaborative enterprise of the Institute for Democracy in South Africa (Idasa), the Center for Democratic Development (CDD-Ghana), and Michigan State University (MSU). In addition, the Afrobarometer Network includes national partners – independent research institutes in the university, NGO and private sectors – that execute surveys in each African country. In Zimbabwe, the Mass Public Opinion Institute (MPOI) administers Afrobarometer surveys. Round 1 of the Afrobarometer was completed between 1999 and mid-2001, with results from 12 countries, including Zimbabwe. The first survey in Zimbabwe was conducted from September to October 1999, that is, prior to the constitutional referendum and the land invasions. Round 2 involved 16 countries, with Zimbabwe being covered in 2004. The instrument asks a standard set of questions, which makes it possible to systematically compare countries and track trends over time. The survey collects data about attitudes and behaviour on the following topics: democracy, governance, livelihoods, economic policy, social capital, conflict and crime, political participation and national identity. Further information is available at www.afrobarometer.org.
19 Committee to Protect Journalists, Attacks on the Press 2003, www.cpj.org/attacks03
Copyright Afrobarometer 5
The Survey in Zimbabwe
With technical assistance from Idasa, MPOI conducted fieldwork for the Round 2 Afrobarometer survey in Zimbabwe between 26 April and 17 May, 2004. The target sample size was 1200 respondents, yielding a margin of sampling error of no more than plus or minus three percentage points. The sample was selected in four stages: the primary sampling unit, starting points, households, and individuals. Because each stage was conducted randomly, the sample represents a cross-section of the adult population of Zimbabwe aged 18 years or older. The frame for the sample was Zimbabwe’s official 2002 national population census.20 For primary sampling units, a total of 150 census enumeration areas were randomly selected with probability proportionate to population size. These enumeration areas were stratified by province and by residential location (urban or rural). To ensure an equal representation of respondents by gender, interviews were alternated between male and female respondents. The achieved gender distribution was therefore 50:50.
A summary of the intended sample is outlined in Table 1. Fieldwork occurred in all provinces of Zimbabwe and the full sample was achieved in
nine of the ten provinces. In the final days of the survey, however, the Central Intelligence Organisation disrupted fieldwork in Mashonaland Central Province. Only eight interviews were completed in one PSU and the survey had to be abandoned in the remaining 12 of the province’s 13 selected PSUs. Because Mashonaland Central Province is a stronghold of the ruling ZANU-PF party, the completion of the survey in this province would probably have yielded a higher proportion of pro-government responses than the results we report below. As a result of this incident, the final sample size was 1104. To avoid introducing further bias, however, we report results based on this slightly truncated sample rather than weighting the data to reflect the handful of responses already collected in Mashonaland Central. Table 1: Summary of Sample Mani-
caland Mash. Central
Mash. East
Mash. West
Mat. North
Mat. South
Mid- lands
Mas- vingo
Harare Bula- wayo
Total
NATIONAL % of National 13.6 8.6 9.7 10.5 6 5.6 12.6 11.3 16.4 5.8 100 PSUs 20 13 15 16 9 8 19 17 25 9 150 Interviews 163 103 116 126 72 67 151 136 197 70 1200 URBAN % Urban 17.0 10.8 10.8 28.6 12.9 11.8 26.7 9.3 100.0 100.0 PSUs 4 1 2 5 1 1 5 2 25 9 53 Interviews 28 11 13 36 9 8 40 13 197 70 424 RURAL % Rural 83.0 89.2 89.2 71.4 87.1 88.2 73.3 90.7 0 0 PSUs 16 12 13 11 8 7 14 15 0 0 97 Interviews 135 92 103 90 63 59 111 123 0 0 776 Eight interviews were conducted in each of the remaining 138 primary sampling units. Respondents chose the language – Shona, Ndebele, or English – in which they wished to be interviewed. Field workers were selected according to their fluency in the languages spoken in the areas in which they were deployed. We deliberately appointed nine women among the 16 interviewers because a group of
20 Government of Zimbabwe, Central Statistical Office, Census 2002 Zimbabwe: Preliminary Results Summary (Harare: Government Printer, 2003).
Copyright Afrobarometer 6
females attracts less suspicion when moving about a locality. Even so, interviewers’ written comments included following: “The respondent was a war veteran and just because of that I felt threatened” (Lupane District); “The respondent expressed great fear to really divulge his position on political questions” (Harare); “The respondent was highly interested in trying to figure out whether I was just an ordinary person or a member of the opposition” (Mashonaland East). Despite these valid concerns – which require the exercise of caution in the interpretation of survey results – three quarters of the interviewers reported receiving a “friendly” and “cooperative” reception (75 percent on both counts). Moreover, in more than six out of ten interviews, interviewers judged respondents to be “at ease” (66 percent) and “honest” (62 percent). The fact that only 9 percent of respondents were deemed “suspicious” of the survey and that only 6 percent were thought to offer “misleading” answers, suggests that most people were able to overcome their hesitations about answering survey questions. In the analysis that follows, however, we explicitly test for any effects of political fear on public opinion. Economic Deprivation In the opinion of ordinary Zimbabweans, daily life is a hard economic grind. More than half of all adults (54 percent) consider that their own living conditions in 2004 are “bad.” Only 27 percent consider them “good.” Indeed, only three out of every one hundred Zimbabweans can find it within themselves to pronounce their everyday standards of living as “very good” (Table 2). This downbeat mood is echoed in assessments of the condition of Zimbabwe’s national economy as a whole: in 2004, 48 percent say that the economy’s current plight is “bad,” as opposed to 31 percent “good.” Indeed, as with personal living conditions, less than one in twenty citizens regard national economic conditions as “very good.” Remaining respondents are either neutral on these questions or they admit that they “don’t know” enough about personal or national economic conditions to hazard an opinion. Table 2: Current Economic Conditions
Very Bad
Bad Neither Good Very Good
Don’t Know
Your own present living conditions 26 28 19 24 3 <1 The country’s economic condition 25 23 19 27 4 2
In general, how would you describe: a. your own present living conditions? b. the present economic condition of this country?
Public attitudes about economic life fail to improve much when survey respondents are asked to compare themselves to others (Table 3). Many more individuals report that they are “worse off” than their fellow Zimbabweans (46 percent) than those who consider themselves “better off” (29 percent). And when they widen their view to look at the country from a regional perspective, more than half of all adults think that prevailing economic conditions in Zimbabwe are “worse” than those in neighboring states (51 percent); again, just 29 percent think that conditions are “better” than those elsewhere in the region. It is likely that some respondents lack first-hand knowledge of conditions throughout in the subcontinent (8 percent “don’t know”). And we cannot be sure whether they are comparing Zimbabwe to poorer countries like Malawi or Mozambique, or wealthier ones like South Africa and Botswana. But, either way, the cross-country comparisons are not flattering for Zimbabwe.
Copyright Afrobarometer 7
Table 3: Economic Conditions Compared Much
Worse Worse Neither Better Much
Better Don’t Know
Your conditions compared to others
15 31 23 25 4 2
The country compared to others 18 33 12 25 4 8 In general, how do you rate:
a. your living conditions compared with other Zimbabweans? b. the economic conditions of this country compared to those in neighboring countries?
As an alternate method of gauging relative economic status, the Afrobarometer asks
people where they stand on a ladder of economic achievement. The ladder has eleven rungs running from 0 to 10, where 0 represents poor people and 10 represents rich people. The mean subjective poverty ratings of the survey respondents in Zimbabwe – as well as their ratings for their parents 10 years ago and for their children in the future – are presented in Table 4. These self-assessments are compared with the ratings provided by survey respondents in 15 other African countries, which were covered by Afrobarometer Round 2 (2002-3). Table 4: Subjective Poverty Ratings (mean on a scale of 0 – 10)
Yourself, Today
Your Parents, 10 Years Ago
Yourself Compared to Your Parents
Your Children,
In the Future
Your Children
Compared to Your Parents
Nigeria 4.8 5.2 - 0.4 9.1 + 3.9 South Africa 4.6 6.0 - 1.4 7.6 + 1.6 Namibia 4.0 4.2 - 0.2 7.0 + 2.8 Mali 4.0 4.7 - 0.7 7.5 + 2.8 Senegal 4.0 5.3 - 1.3 6.8 + 1.5 Kenya 3.8 4.1 - 0.3 7.6 + 3.5 Tanzania 3.7 3.5 + 0.2 5.6 + 2.1 Cape Verde 3.6 3.6 0.0 7.4 + 3.8 Botswana 3.5 3.3 + 0.2 7.2 + 3.9 Ghana 3.5 4.0 - 0.5 7.2 + 3.2 Zambia 3.4 4.9 -1.5 6.7 + 1.8 Uganda 3.3 3.9 - 0.6 5.5 + 1.6 Lesotho 2.7 3.7 - 1.0 4.0 + 0.3 Mozambique 2.6 3.2 - 0.6 5.2 + 2.0 Zimbabwe 2.5 4.7 -2.2 5.9 + 1.2 Malawi 1.9 2.5 - 0.6 4.1 + 1.6
On a scale between 0 and 10, where 0 are “poor” people and 10 are “rich” people, which number would you: a. give yourself today? b. give your parents 10 years ago? c. expect your children to attain in the future?
From this angle, Zimbabweans evidently feel they are among the most impoverished populations on the continent. To be sure, Africans everywhere tend to see themselves as poor since the average country score always falls below the midpoint of the scale (5.0). But Zimbabweans apparently see themselves as especially deprived. They give themselves a mean score of only 2.5 on the poverty scale. Moreover, 37 percent give themselves the lowest possible score (zero) while just 14 percent of other Africans do so. In other words, Zimbabweans are much more likely to think they are poor than the residents of relatively prosperous countries like South Africa and Namibia, and in this regard they even lag behind the populations of very poor countries like Tanzania, Zambia and Mozambique. We find that only Malawians think that they are worse off than Zimbabweans. This is not to say that Zimbabweans are
Copyright Afrobarometer 8
always objectively more deprived than other Africans, but they have surely experienced a greater deterioration in the quality of life as the national economy has shrunk in recent years. We therefore suspect that they consider themselves poor mainly in relation to higher standards of living that they enjoyed in the past.
This interpretation is supported by comparisons between one’s personal circumstances today and those of one’s parents 10 years ago. Like other Africans, adult Zimbabweans tend to think that their parents’ generation enjoyed a higher standard of living (Table 4, column 4). Strikingly, however, Zimbabweans are more inclined to make an invidious comparison with the past than any other group of Afrobarometer respondents, including now even Malawians. Adults in Zimbabwe today think they stand more than two rungs below their parents on the economic achievement ladder. The perceived drop in economic status across generations in Zimbabwe (-2.2) is much larger than in Malawi (-0.6), and larger even than in Nigeria (-0.4) or Zambia (-1.5), countries that fell from middle- to low-income status in the course of a generation. These gloomy self-assessments of growing impoverishment in Zimbabwe stand in particularly sharp contrast to at least two countries where adult Africans today think they have surpassed their parents’ living standards (Botswana and Tanzania). Moreover, the experience of falling living standards undermines the hopes that ordinary people hold for their children’s future. Like Africans elsewhere, Zimbabweans expect that their children will be richer than themselves and will even move above the midpoint on the poverty scale (to 5.9 in Zimbabwe). But Zimbabweans remain cautious about the economic future since they expect a smaller increment in the living standards of the next generation than almost any other Africans. Only Basotho, whose labor-export economy regularly loses its best young people via emigration to neighboring South Africa, feel more pessimistic about the economic future than do the denizens of Zimbabwe. In a continental setting where Nigerians and Batswana are especially optimistic about the economic future (+3.9), Zimbabweans are barely upbeat at all (+1.2).
Why, then, are Zimbabweans so pessimistic about economic conditions and prospects? The answer lies in part in the difficulty faced by ordinary people in gaining access to basic human needs. Take food, for example. At one time, Zimbabwe was self-sufficient in grain and occasionally exported surpluses to the region. But the country now finds itself in the company of other food-deficit economies in the Southern Africa region such as Zambia, Lesotho and Malawi. As food production has slumped, so hunger has grown. As Table 5 shows, only one out of four adult Zimbabweans (18 percent) report that they and their families “never” went hungry during the previous year. Instead, some 41 percent experienced a shortage of food at least “once or twice” or “several times,” with a further 41 percent going without food “many times” or “always.”
Indeed the proportion of the population that reports being permanently hungry (those who say they go without food “always”) is higher in Zimbabwe (8 percent) than in any other Afrobarometer country, including Mozambique and Malawi (both 5 percent). The harsh experience of hunger has a powerful effect on the popular economic mood, with shortages of food leading people to report that they are poor.21 For example, two-thirds of the people who report that they are “always” hungry also give themselves the lowest possible rating (zero) on the subjective poverty scale. The Afrobarometer tracks several aspects of human welfare in addition to the availability of food. Comparisons between the 1999 and 2004 results are presented in Table 6. These data show that Zimbabweans report a measure of improvement over the past five years in access to certain basic needs, including fuel for domestic uses and clean drinking water. Nonetheless, one half of all individuals say their households encountered a shortage of these resources on at least one occasion in the last year. 21 Pearson’s r = .401, significant at p <.001.
Copyright Afrobarometer 9
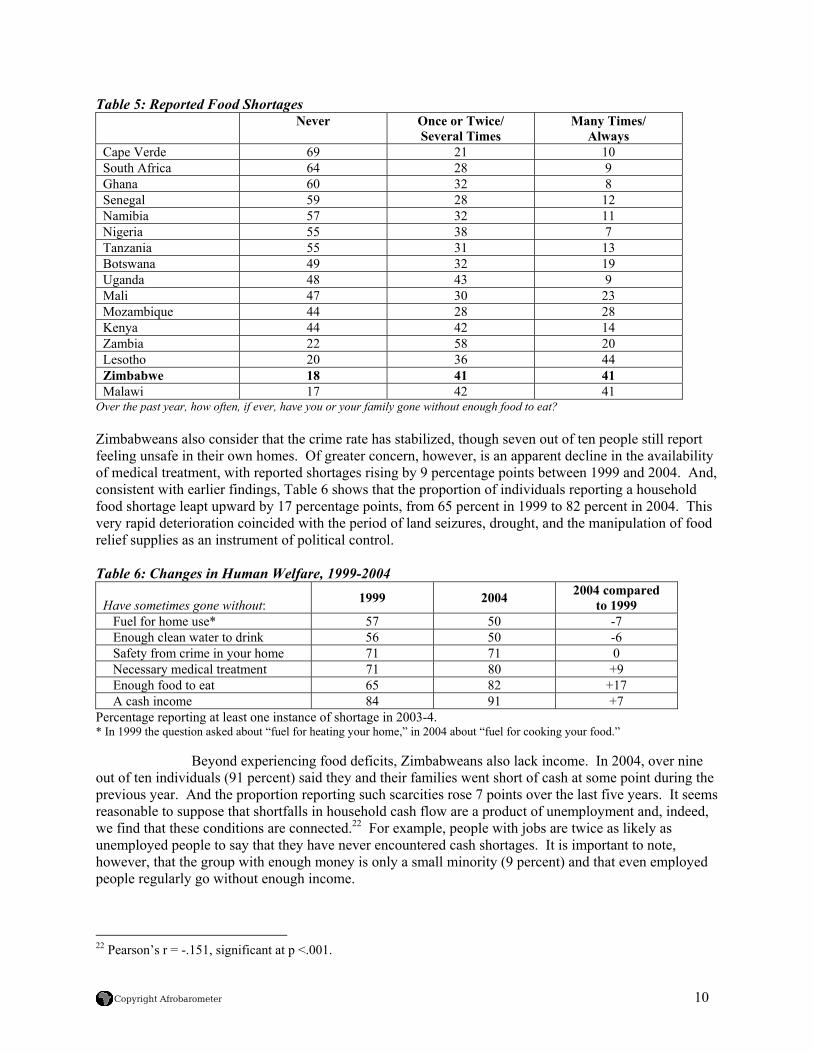
Table 5: Reported Food Shortages Never Once or Twice/
Several Times Many Times/
Always Cape Verde 69 21 10 South Africa 64 28 9 Ghana 60 32 8 Senegal 59 28 12 Namibia 57 32 11 Nigeria 55 38 7 Tanzania 55 31 13 Botswana 49 32 19 Uganda 48 43 9 Mali 47 30 23 Mozambique 44 28 28 Kenya 44 42 14 Zambia 22 58 20 Lesotho 20 36 44 Zimbabwe 18 41 41 Malawi 17 42 41
Over the past year, how often, if ever, have you or your family gone without enough food to eat?
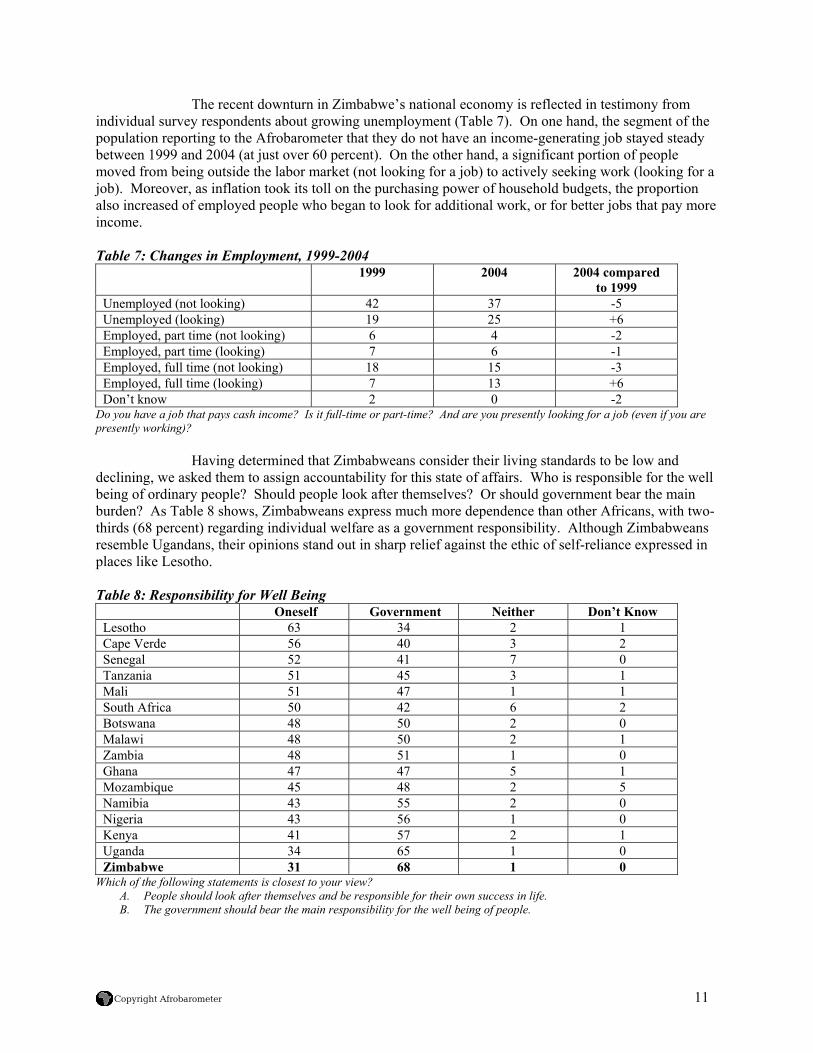
Zimbabweans also consider that the crime rate has stabilized, though seven out of ten people still report feeling unsafe in their own homes. Of greater concern, however, is an apparent decline in the availability of medical treatment, with reported shortages rising by 9 percentage points between 1999 and 2004. And, consistent with earlier findings, Table 6 shows that the proportion of individuals reporting a household food shortage leapt upward by 17 percentage points, from 65 percent in 1999 to 82 percent in 2004. This very rapid deterioration coincided with the period of land seizures, drought, and the manipulation of food relief supplies as an instrument of political control. Table 6: Changes in Human Welfare, 1999-2004
Have sometimes gone without: 1999 2004 2004 compared to 1999
Fuel for home use* 57 50 -7 Enough clean water to drink 56 50 -6 Safety from crime in your home 71 71 0 Necessary medical treatment 71 80 +9 Enough food to eat 65 82 +17 A cash income 84 91 +7
Percentage reporting at least one instance of shortage in 2003-4. * In 1999 the question asked about “fuel for heating your home,” in 2004 about “fuel for cooking your food.” Beyond experiencing food deficits, Zimbabweans also lack income. In 2004, over nine out of ten individuals (91 percent) said they and their families went short of cash at some point during the previous year. And the proportion reporting such scarcities rose 7 points over the last five years. It seems reasonable to suppose that shortfalls in household cash flow are a product of unemployment and, indeed, we find that these conditions are connected.22 For example, people with jobs are twice as likely as unemployed people to say that they have never encountered cash shortages. It is important to note, however, that the group with enough money is only a small minority (9 percent) and that even employed people regularly go without enough income.
22 Pearson’s r = -.151, significant at p <.001.
Copyright Afrobarometer 10
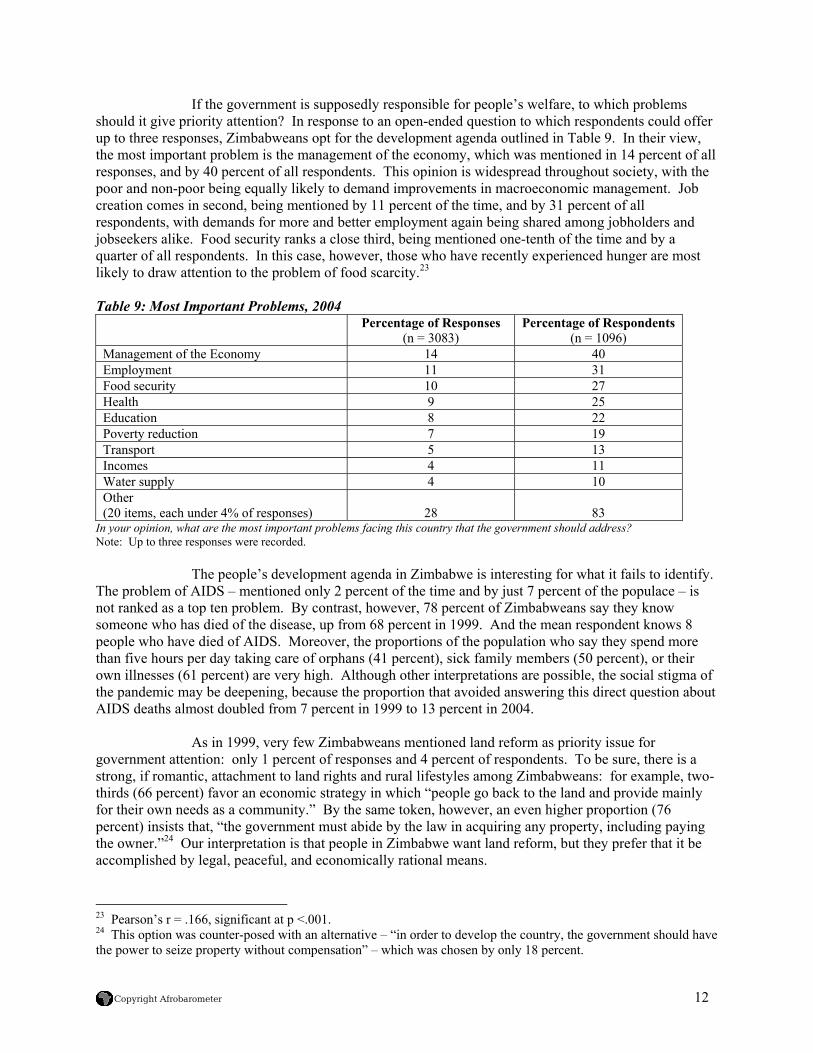
The recent downturn in Zimbabwe’s national economy is reflected in testimony from individual survey respondents about growing unemployment (Table 7). On one hand, the segment of the population reporting to the Afrobarometer that they do not have an income-generating job stayed steady between 1999 and 2004 (at just over 60 percent). On the other hand, a significant portion of people moved from being outside the labor market (not looking for a job) to actively seeking work (looking for a job). Moreover, as inflation took its toll on the purchasing power of household budgets, the proportion also increased of employed people who began to look for additional work, or for better jobs that pay more income. Table 7: Changes in Employment, 1999-2004
1999 2004 2004 compared to 1999
Unemployed (not looking) 42 37 -5 Unemployed (looking) 19 25 +6 Employed, part time (not looking) 6 4 -2 Employed, part time (looking) 7 6 -1 Employed, full time (not looking) 18 15 -3 Employed, full time (looking) 7 13 +6 Don’t know 2 0 -2
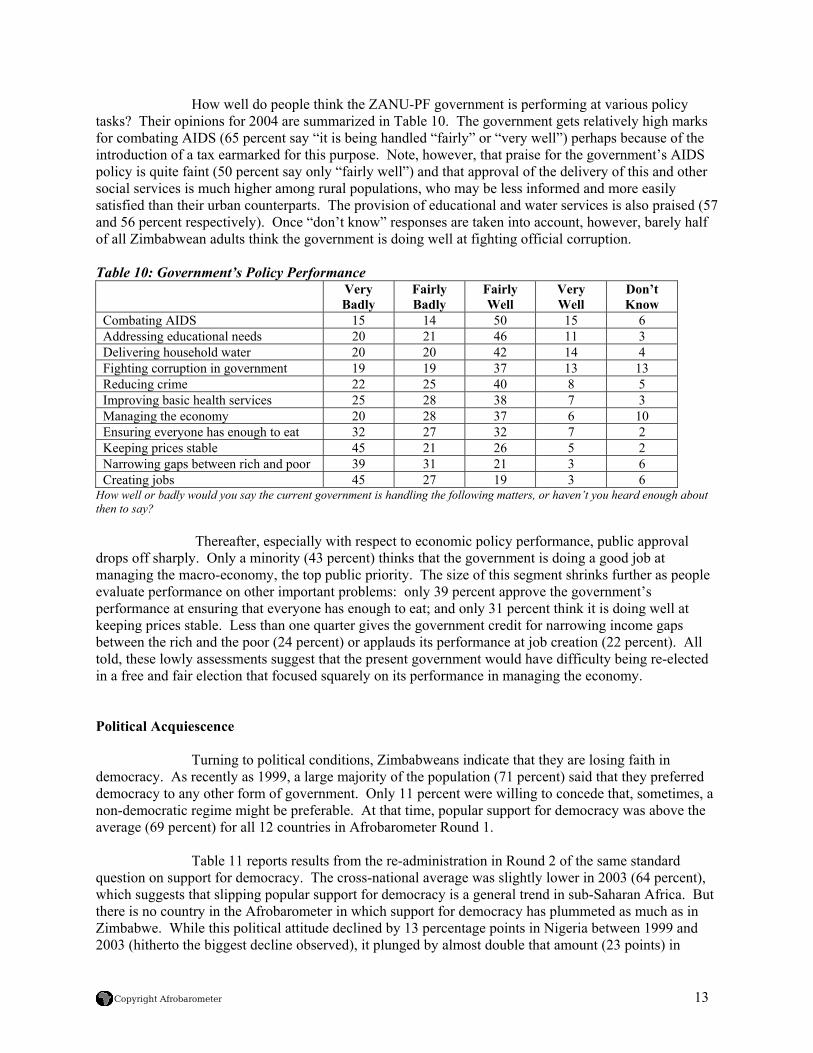
Do you have a job that pays cash income? Is it full-time or part-time? And are you presently looking for a job (even if you are presently working)? Having determined that Zimbabweans consider their living standards to be low and declining, we asked them to assign accountability for this state of affairs. Who is responsible for the well being of ordinary people? Should people look after themselves? Or should government bear the main burden? As Table 8 shows, Zimbabweans express much more dependence than other Africans, with two-thirds (68 percent) regarding individual welfare as a government responsibility. Although Zimbabweans resemble Ugandans, their opinions stand out in sharp relief against the ethic of self-reliance expressed in places like Lesotho. Table 8: Responsibility for Well Being
Oneself Government Neither Don’t Know Lesotho 63 34 2 1 Cape Verde 56 40 3 2 Senegal 52 41 7 0 Tanzania 51 45 3 1 Mali 51 47 1 1 South Africa 50 42 6 2 Botswana 48 50 2 0 Malawi 48 50 2 1 Zambia 48 51 1 0 Ghana 47 47 5 1 Mozambique 45 48 2 5 Namibia 43 55 2 0 Nigeria 43 56 1 0 Kenya 41 57 2 1 Uganda 34 65 1 0 Zimbabwe 31 68 1 0
Which of the following statements is closest to your view? A. People should look after themselves and be responsible for their own success in life. B. The government should bear the main responsibility for the well being of people.
Copyright Afrobarometer 11
If the government is supposedly responsible for people’s welfare, to which problems should it give priority attention? In response to an open-ended question to which respondents could offer up to three responses, Zimbabweans opt for the development agenda outlined in Table 9. In their view, the most important problem is the management of the economy, which was mentioned in 14 percent of all responses, and by 40 percent of all respondents. This opinion is widespread throughout society, with the poor and non-poor being equally likely to demand improvements in macroeconomic management. Job creation comes in second, being mentioned by 11 percent of the time, and by 31 percent of all respondents, with demands for more and better employment again being shared among jobholders and jobseekers alike. Food security ranks a close third, being mentioned one-tenth of the time and by a quarter of all respondents. In this case, however, those who have recently experienced hunger are most likely to draw attention to the problem of food scarcity.23 Table 9: Most Important Problems, 2004
Percentage of Responses (n = 3083)
Percentage of Respondents(n = 1096)
Management of the Economy 14 40 Employment 11 31 Food security 10 27 Health 9 25 Education 8 22 Poverty reduction 7 19 Transport 5 13 Incomes 4 11 Water supply 4 10 Other (20 items, each under 4% of responses)
28
83
In your opinion, what are the most important problems facing this country that the government should address? Note: Up to three responses were recorded. The people’s development agenda in Zimbabwe is interesting for what it fails to identify. The problem of AIDS – mentioned only 2 percent of the time and by just 7 percent of the populace – is not ranked as a top ten problem. By contrast, however, 78 percent of Zimbabweans say they know someone who has died of the disease, up from 68 percent in 1999. And the mean respondent knows 8 people who have died of AIDS. Moreover, the proportions of the population who say they spend more than five hours per day taking care of orphans (41 percent), sick family members (50 percent), or their own illnesses (61 percent) are very high. Although other interpretations are possible, the social stigma of the pandemic may be deepening, because the proportion that avoided answering this direct question about AIDS deaths almost doubled from 7 percent in 1999 to 13 percent in 2004. As in 1999, very few Zimbabweans mentioned land reform as priority issue for government attention: only 1 percent of responses and 4 percent of respondents. To be sure, there is a strong, if romantic, attachment to land rights and rural lifestyles among Zimbabweans: for example, two-thirds (66 percent) favor an economic strategy in which “people go back to the land and provide mainly for their own needs as a community.” By the same token, however, an even higher proportion (76 percent) insists that, “the government must abide by the law in acquiring any property, including paying the owner.”24 Our interpretation is that people in Zimbabwe want land reform, but they prefer that it be accomplished by legal, peaceful, and economically rational means.
23 Pearson’s r = .166, significant at p <.001. 24 This option was counter-posed with an alternative – “in order to develop the country, the government should have the power to seize property without compensation” – which was chosen by only 18 percent.
Copyright Afrobarometer 12
How well do people think the ZANU-PF government is performing at various policy tasks? Their opinions for 2004 are summarized in Table 10. The government gets relatively high marks for combating AIDS (65 percent say “it is being handled “fairly” or “very well”) perhaps because of the introduction of a tax earmarked for this purpose. Note, however, that praise for the government’s AIDS policy is quite faint (50 percent say only “fairly well”) and that approval of the delivery of this and other social services is much higher among rural populations, who may be less informed and more easily satisfied than their urban counterparts. The provision of educational and water services is also praised (57 and 56 percent respectively). Once “don’t know” responses are taken into account, however, barely half of all Zimbabwean adults think the government is doing well at fighting official corruption. Table 10: Government’s Policy Performance
Very Badly
Fairly Badly
Fairly Well
Very Well
Don’t Know
Combating AIDS 15 14 50 15 6 Addressing educational needs 20 21 46 11 3 Delivering household water 20 20 42 14 4 Fighting corruption in government 19 19 37 13 13 Reducing crime 22 25 40 8 5 Improving basic health services 25 28 38 7 3 Managing the economy 20 28 37 6 10 Ensuring everyone has enough to eat 32 27 32 7 2 Keeping prices stable 45 21 26 5 2 Narrowing gaps between rich and poor 39 31 21 3 6 Creating jobs 45 27 19 3 6
How well or badly would you say the current government is handling the following matters, or haven’t you heard enough about then to say? Thereafter, especially with respect to economic policy performance, public approval drops off sharply. Only a minority (43 percent) thinks that the government is doing a good job at managing the macro-economy, the top public priority. The size of this segment shrinks further as people evaluate performance on other important problems: only 39 percent approve the government’s performance at ensuring that everyone has enough to eat; and only 31 percent think it is doing well at keeping prices stable. Less than one quarter gives the government credit for narrowing income gaps between the rich and the poor (24 percent) or applauds its performance at job creation (22 percent). All told, these lowly assessments suggest that the present government would have difficulty being re-elected in a free and fair election that focused squarely on its performance in managing the economy. Political Acquiescence
Turning to political conditions, Zimbabweans indicate that they are losing faith in
democracy. As recently as 1999, a large majority of the population (71 percent) said that they preferred democracy to any other form of government. Only 11 percent were willing to concede that, sometimes, a non-democratic regime might be preferable. At that time, popular support for democracy was above the average (69 percent) for all 12 countries in Afrobarometer Round 1.
Table 11 reports results from the re-administration in Round 2 of the same standard
question on support for democracy. The cross-national average was slightly lower in 2003 (64 percent), which suggests that slipping popular support for democracy is a general trend in sub-Saharan Africa. But there is no country in the Afrobarometer in which support for democracy has plummeted as much as in Zimbabwe. While this political attitude declined by 13 percentage points in Nigeria between 1999 and 2003 (hitherto the biggest decline observed), it plunged by almost double that amount (23 points) in
Copyright Afrobarometer 13
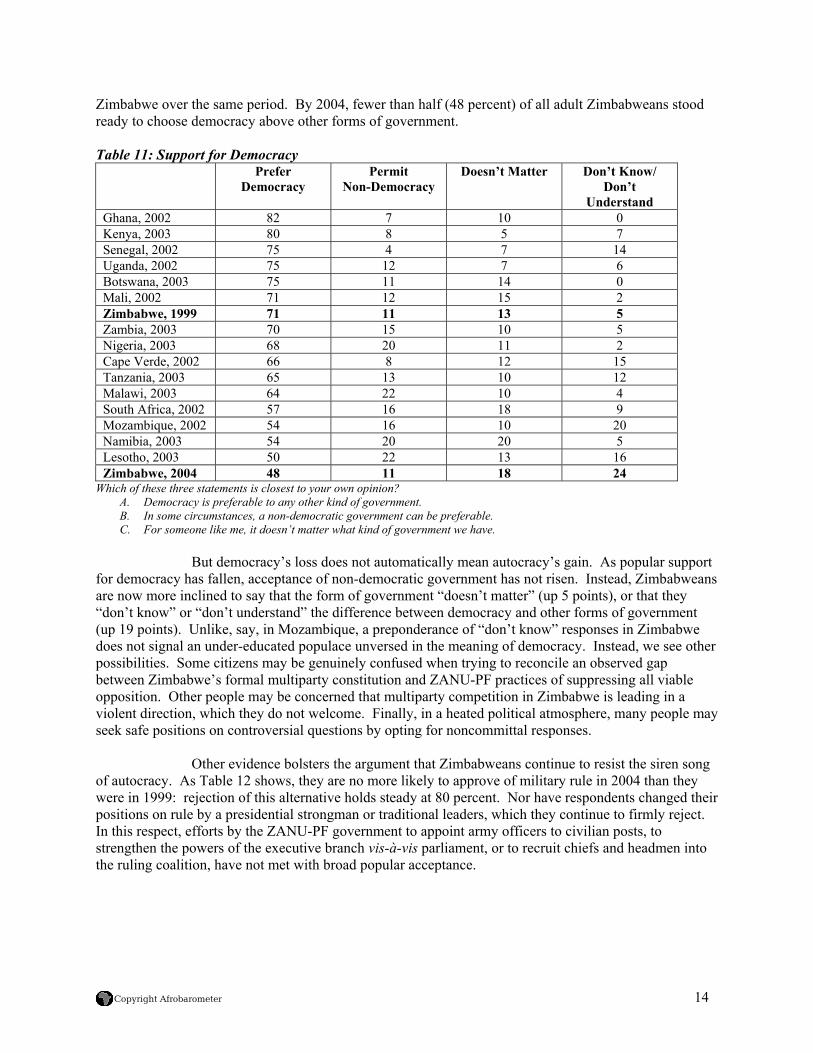
Zimbabwe over the same period. By 2004, fewer than half (48 percent) of all adult Zimbabweans stood ready to choose democracy above other forms of government.
Table 11: Support for Democracy
Prefer Democracy
Permit Non-Democracy
Doesn’t Matter Don’t Know/ Don’t
Understand Ghana, 2002 82 7 10 0 Kenya, 2003 80 8 5 7 Senegal, 2002 75 4 7 14 Uganda, 2002 75 12 7 6 Botswana, 2003 75 11 14 0 Mali, 2002 71 12 15 2 Zimbabwe, 1999 71 11 13 5 Zambia, 2003 70 15 10 5 Nigeria, 2003 68 20 11 2 Cape Verde, 2002 66 8 12 15 Tanzania, 2003 65 13 10 12 Malawi, 2003 64 22 10 4 South Africa, 2002 57 16 18 9 Mozambique, 2002 54 16 10 20 Namibia, 2003 54 20 20 5 Lesotho, 2003 50 22 13 16 Zimbabwe, 2004 48 11 18 24
Which of these three statements is closest to your own opinion? A. Democracy is preferable to any other kind of government. B. In some circumstances, a non-democratic government can be preferable. C. For someone like me, it doesn’t matter what kind of government we have.
But democracy’s loss does not automatically mean autocracy’s gain. As popular support
for democracy has fallen, acceptance of non-democratic government has not risen. Instead, Zimbabweans are now more inclined to say that the form of government “doesn’t matter” (up 5 points), or that they “don’t know” or “don’t understand” the difference between democracy and other forms of government (up 19 points). Unlike, say, in Mozambique, a preponderance of “don’t know” responses in Zimbabwe does not signal an under-educated populace unversed in the meaning of democracy. Instead, we see other possibilities. Some citizens may be genuinely confused when trying to reconcile an observed gap between Zimbabwe’s formal multiparty constitution and ZANU-PF practices of suppressing all viable opposition. Other people may be concerned that multiparty competition in Zimbabwe is leading in a violent direction, which they do not welcome. Finally, in a heated political atmosphere, many people may seek safe positions on controversial questions by opting for noncommittal responses.
Other evidence bolsters the argument that Zimbabweans continue to resist the siren song
of autocracy. As Table 12 shows, they are no more likely to approve of military rule in 2004 than they were in 1999: rejection of this alternative holds steady at 80 percent. Nor have respondents changed their positions on rule by a presidential strongman or traditional leaders, which they continue to firmly reject. In this respect, efforts by the ZANU-PF government to appoint army officers to civilian posts, to strengthen the powers of the executive branch vis-à-vis parliament, or to recruit chiefs and headmen into the ruling coalition, have not met with broad popular acceptance.
Copyright Afrobarometer 14
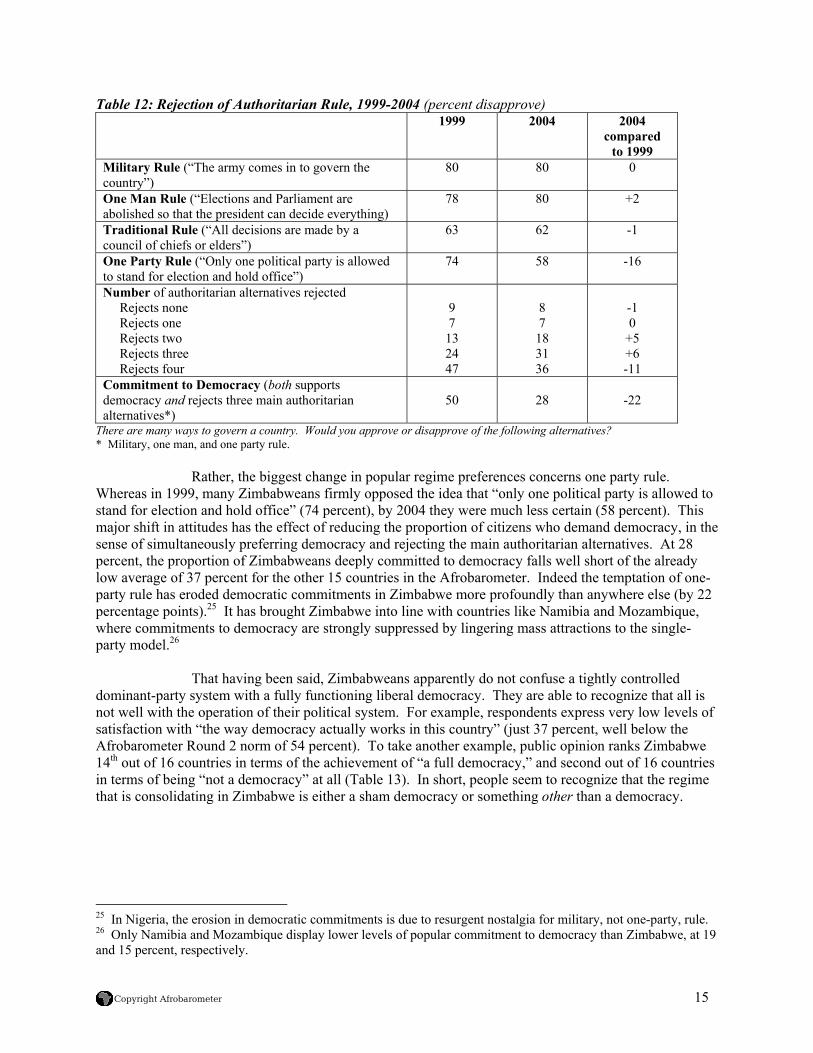
Table 12: Rejection of Authoritarian Rule, 1999-2004 (percent disapprove) 1999 2004 2004
compared to 1999
Military Rule (“The army comes in to govern the country”)
80 80 0
One Man Rule (“Elections and Parliament are abolished so that the president can decide everything)
78 80 +2
Traditional Rule (“All decisions are made by a council of chiefs or elders”)
63 62 -1
One Party Rule (“Only one political party is allowed to stand for election and hold office”)
74 58 -16
Number of authoritarian alternatives rejected Rejects none Rejects one Rejects two Rejects three Rejects four
9 7
13 24 47
8 7
18 31 36
-1 0
+5 +6 -11
Commitment to Democracy (both supports democracy and rejects three main authoritarian alternatives*)
50
28
-22
There are many ways to govern a country. Would you approve or disapprove of the following alternatives? * Military, one man, and one party rule.
Rather, the biggest change in popular regime preferences concerns one party rule.
Whereas in 1999, many Zimbabweans firmly opposed the idea that “only one political party is allowed to stand for election and hold office” (74 percent), by 2004 they were much less certain (58 percent). This major shift in attitudes has the effect of reducing the proportion of citizens who demand democracy, in the sense of simultaneously preferring democracy and rejecting the main authoritarian alternatives. At 28 percent, the proportion of Zimbabweans deeply committed to democracy falls well short of the already low average of 37 percent for the other 15 countries in the Afrobarometer. Indeed the temptation of one-party rule has eroded democratic commitments in Zimbabwe more profoundly than anywhere else (by 22 percentage points).25 It has brought Zimbabwe into line with countries like Namibia and Mozambique, where commitments to democracy are strongly suppressed by lingering mass attractions to the single-party model.26
That having been said, Zimbabweans apparently do not confuse a tightly controlled
dominant-party system with a fully functioning liberal democracy. They are able to recognize that all is not well with the operation of their political system. For example, respondents express very low levels of satisfaction with “the way democracy actually works in this country” (just 37 percent, well below the Afrobarometer Round 2 norm of 54 percent). To take another example, public opinion ranks Zimbabwe 14th out of 16 countries in terms of the achievement of “a full democracy,” and second out of 16 countries in terms of being “not a democracy” at all (Table 13). In short, people seem to recognize that the regime that is consolidating in Zimbabwe is either a sham democracy or something other than a democracy.
25 In Nigeria, the erosion in democratic commitments is due to resurgent nostalgia for military, not one-party, rule. 26 Only Namibia and Mozambique display lower levels of popular commitment to democracy than Zimbabwe, at 19 and 15 percent, respectively.
Copyright Afrobarometer 15
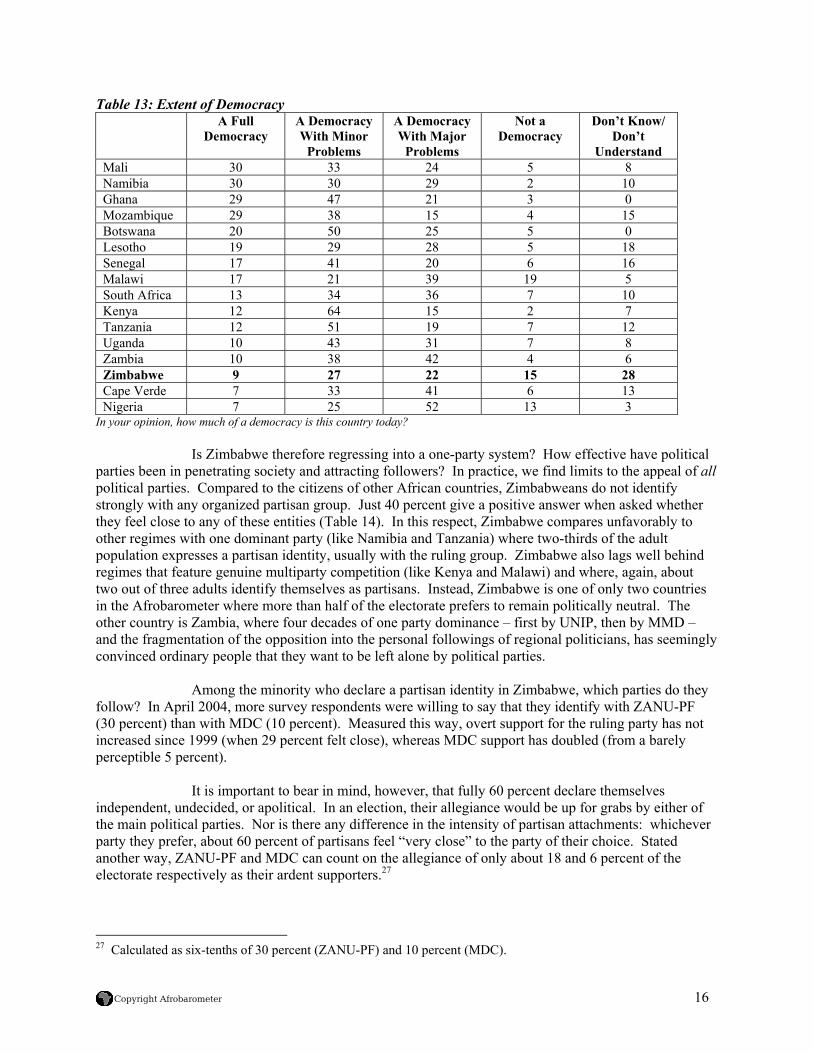
Table 13: Extent of Democracy A Full
Democracy A Democracy With Minor
Problems
A Democracy With Major
Problems
Not a Democracy
Don’t Know/ Don’t
Understand Mali 30 33 24 5 8 Namibia 30 30 29 2 10 Ghana 29 47 21 3 0 Mozambique 29 38 15 4 15 Botswana 20 50 25 5 0 Lesotho 19 29 28 5 18 Senegal 17 41 20 6 16 Malawi 17 21 39 19 5 South Africa 13 34 36 7 10 Kenya 12 64 15 2 7 Tanzania 12 51 19 7 12 Uganda 10 43 31 7 8 Zambia 10 38 42 4 6 Zimbabwe 9 27 22 15 28 Cape Verde 7 33 41 6 13 Nigeria 7 25 52 13 3
In your opinion, how much of a democracy is this country today?
Is Zimbabwe therefore regressing into a one-party system? How effective have political parties been in penetrating society and attracting followers? In practice, we find limits to the appeal of all political parties. Compared to the citizens of other African countries, Zimbabweans do not identify strongly with any organized partisan group. Just 40 percent give a positive answer when asked whether they feel close to any of these entities (Table 14). In this respect, Zimbabwe compares unfavorably to other regimes with one dominant party (like Namibia and Tanzania) where two-thirds of the adult population expresses a partisan identity, usually with the ruling group. Zimbabwe also lags well behind regimes that feature genuine multiparty competition (like Kenya and Malawi) and where, again, about two out of three adults identify themselves as partisans. Instead, Zimbabwe is one of only two countries in the Afrobarometer where more than half of the electorate prefers to remain politically neutral. The other country is Zambia, where four decades of one party dominance – first by UNIP, then by MMD – and the fragmentation of the opposition into the personal followings of regional politicians, has seemingly convinced ordinary people that they want to be left alone by political parties.
Among the minority who declare a partisan identity in Zimbabwe, which parties do they follow? In April 2004, more survey respondents were willing to say that they identify with ZANU-PF (30 percent) than with MDC (10 percent). Measured this way, overt support for the ruling party has not increased since 1999 (when 29 percent felt close), whereas MDC support has doubled (from a barely perceptible 5 percent).
It is important to bear in mind, however, that fully 60 percent declare themselves
independent, undecided, or apolitical. In an election, their allegiance would be up for grabs by either of the main political parties. Nor is there any difference in the intensity of partisan attachments: whichever party they prefer, about 60 percent of partisans feel “very close” to the party of their choice. Stated another way, ZANU-PF and MDC can count on the allegiance of only about 18 and 6 percent of the electorate respectively as their ardent supporters.27
27 Calculated as six-tenths of 30 percent (ZANU-PF) and 10 percent (MDC).
Copyright Afrobarometer 16
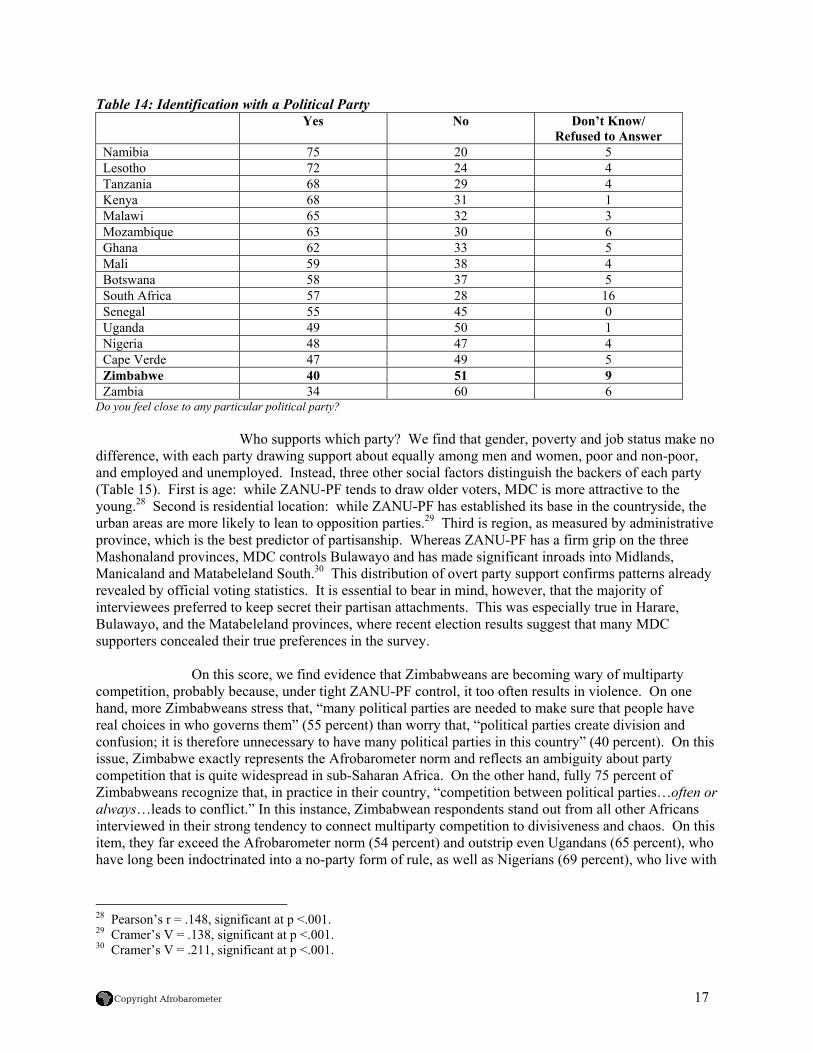
Table 14: Identification with a Political Party Yes No Don’t Know/
Refused to Answer Namibia 75 20 5 Lesotho 72 24 4 Tanzania 68 29 4 Kenya 68 31 1 Malawi 65 32 3 Mozambique 63 30 6 Ghana 62 33 5 Mali 59 38 4 Botswana 58 37 5 South Africa 57 28 16 Senegal 55 45 0 Uganda 49 50 1 Nigeria 48 47 4 Cape Verde 47 49 5 Zimbabwe 40 51 9 Zambia 34 60 6
Do you feel close to any particular political party?
Who supports which party? We find that gender, poverty and job status make no difference, with each party drawing support about equally among men and women, poor and non-poor, and employed and unemployed. Instead, three other social factors distinguish the backers of each party (Table 15). First is age: while ZANU-PF tends to draw older voters, MDC is more attractive to the young.28 Second is residential location: while ZANU-PF has established its base in the countryside, the urban areas are more likely to lean to opposition parties.29 Third is region, as measured by administrative province, which is the best predictor of partisanship. Whereas ZANU-PF has a firm grip on the three Mashonaland provinces, MDC controls Bulawayo and has made significant inroads into Midlands, Manicaland and Matabeleland South.30 This distribution of overt party support confirms patterns already revealed by official voting statistics. It is essential to bear in mind, however, that the majority of interviewees preferred to keep secret their partisan attachments. This was especially true in Harare, Bulawayo, and the Matabeleland provinces, where recent election results suggest that many MDC supporters concealed their true preferences in the survey.
On this score, we find evidence that Zimbabweans are becoming wary of multiparty competition, probably because, under tight ZANU-PF control, it too often results in violence. On one hand, more Zimbabweans stress that, “many political parties are needed to make sure that people have real choices in who governs them” (55 percent) than worry that, “political parties create division and confusion; it is therefore unnecessary to have many political parties in this country” (40 percent). On this issue, Zimbabwe exactly represents the Afrobarometer norm and reflects an ambiguity about party competition that is quite widespread in sub-Saharan Africa. On the other hand, fully 75 percent of Zimbabweans recognize that, in practice in their country, “competition between political parties…often or always…leads to conflict.” In this instance, Zimbabwean respondents stand out from all other Africans interviewed in their strong tendency to connect multiparty competition to divisiveness and chaos. On this item, they far exceed the Afrobarometer norm (54 percent) and outstrip even Ugandans (65 percent), who have long been indoctrinated into a no-party form of rule, as well as Nigerians (69 percent), who live with
28 Pearson’s r = .148, significant at p <.001. 29 Cramer’s V = .138, significant at p <.001. 30 Cramer’s V = .211, significant at p <.001.
Copyright Afrobarometer 17
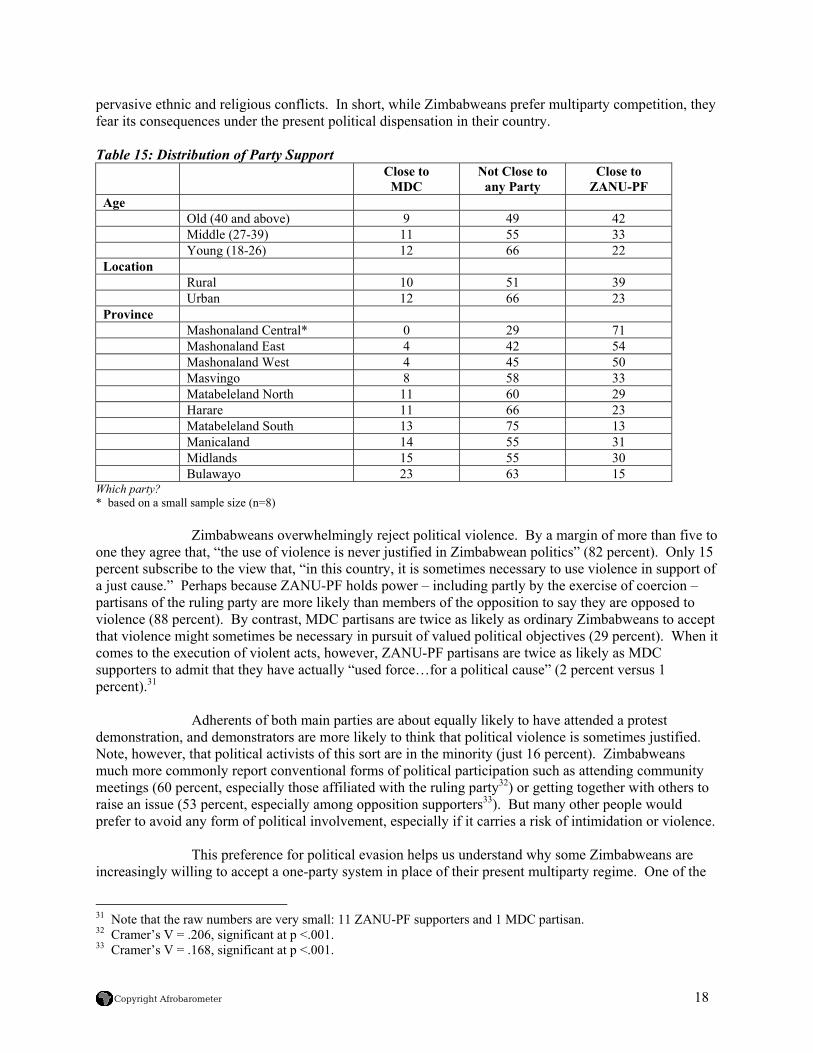
pervasive ethnic and religious conflicts. In short, while Zimbabweans prefer multiparty competition, they fear its consequences under the present political dispensation in their country. Table 15: Distribution of Party Support
Close to MDC
Not Close to any Party
Close to ZANU-PF
Age Old (40 and above) 9 49 42 Middle (27-39) 11 55 33 Young (18-26) 12 66 22 Location Rural 10 51 39 Urban 12 66 23 Province Mashonaland Central* 0 29 71 Mashonaland East 4 42 54 Mashonaland West 4 45 50 Masvingo 8 58 33 Matabeleland North 11 60 29 Harare 11 66 23 Matabeleland South 13 75 13 Manicaland 14 55 31 Midlands 15 55 30 Bulawayo 23 63 15
Which party? * based on a small sample size (n=8)
Zimbabweans overwhelmingly reject political violence. By a margin of more than five to
one they agree that, “the use of violence is never justified in Zimbabwean politics” (82 percent). Only 15 percent subscribe to the view that, “in this country, it is sometimes necessary to use violence in support of a just cause.” Perhaps because ZANU-PF holds power – including partly by the exercise of coercion – partisans of the ruling party are more likely than members of the opposition to say they are opposed to violence (88 percent). By contrast, MDC partisans are twice as likely as ordinary Zimbabweans to accept that violence might sometimes be necessary in pursuit of valued political objectives (29 percent). When it comes to the execution of violent acts, however, ZANU-PF partisans are twice as likely as MDC supporters to admit that they have actually “used force…for a political cause” (2 percent versus 1 percent).31
Adherents of both main parties are about equally likely to have attended a protest
demonstration, and demonstrators are more likely to think that political violence is sometimes justified. Note, however, that political activists of this sort are in the minority (just 16 percent). Zimbabweans much more commonly report conventional forms of political participation such as attending community meetings (60 percent, especially those affiliated with the ruling party32) or getting together with others to raise an issue (53 percent, especially among opposition supporters33). But many other people would prefer to avoid any form of political involvement, especially if it carries a risk of intimidation or violence.
This preference for political evasion helps us understand why some Zimbabweans are increasingly willing to accept a one-party system in place of their present multiparty regime. One of the
31 Note that the raw numbers are very small: 11 ZANU-PF supporters and 1 MDC partisan. 32 Cramer’s V = .206, significant at p <.001. 33 Cramer’s V = .168, significant at p <.001.
Copyright Afrobarometer 18
best predictors of approval of one-party rule is political partisanship, with ZANU-PF partisans offering the strongest support.34 Approval is especially strong in rural areas, where almost half (48 percent) say they could accept limitations on open multiparty competition.35 The largest majority in favor of one-party rule occurs in Mashonaland East (71 percent), though it is offset by strong resistance in Bulawayo (79 percent) and Harare (68 percent). Stirrings of support for one-party rule originate in good part from people who see party competition as a cause of conflict.36 This emergent attitude also arises – though less forcefully – from people who eschew political violence.37 Putting all these elements together, we see a rural populace that is sick and tired of being pressured politically and who accede to ZANU-PF rule in the faint hope that their acquiescence will restore peace and stability.
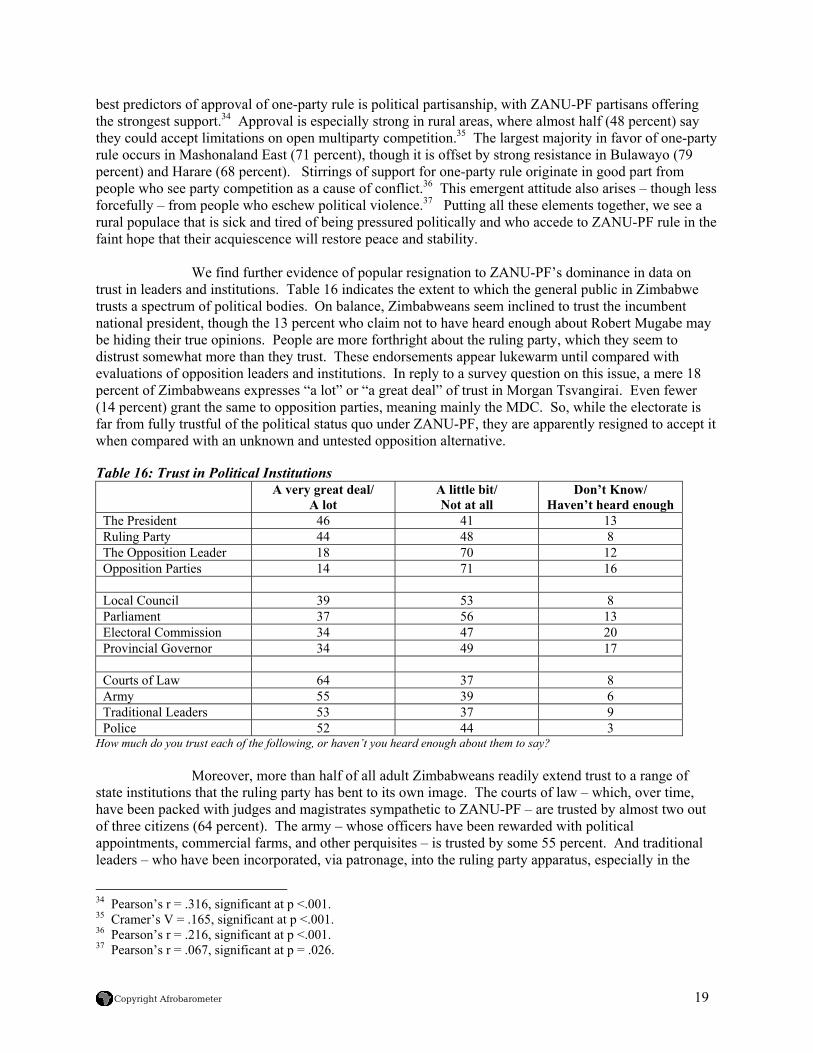
We find further evidence of popular resignation to ZANU-PF’s dominance in data on trust in leaders and institutions. Table 16 indicates the extent to which the general public in Zimbabwe trusts a spectrum of political bodies. On balance, Zimbabweans seem inclined to trust the incumbent national president, though the 13 percent who claim not to have heard enough about Robert Mugabe may be hiding their true opinions. People are more forthright about the ruling party, which they seem to distrust somewhat more than they trust. These endorsements appear lukewarm until compared with evaluations of opposition leaders and institutions. In reply to a survey question on this issue, a mere 18 percent of Zimbabweans expresses “a lot” or “a great deal” of trust in Morgan Tsvangirai. Even fewer (14 percent) grant the same to opposition parties, meaning mainly the MDC. So, while the electorate is far from fully trustful of the political status quo under ZANU-PF, they are apparently resigned to accept it when compared with an unknown and untested opposition alternative. Table 16: Trust in Political Institutions
A very great deal/ A lot
A little bit/ Not at all
Don’t Know/ Haven’t heard enough
The President 46 41 13 Ruling Party 44 48 8 The Opposition Leader 18 70 12 Opposition Parties 14 71 16 Local Council 39 53 8 Parliament 37 56 13 Electoral Commission 34 47 20 Provincial Governor 34 49 17 Courts of Law 64 37 8 Army 55 39 6 Traditional Leaders 53 37 9 Police 52 44 3
How much do you trust each of the following, or haven’t you heard enough about them to say? Moreover, more than half of all adult Zimbabweans readily extend trust to a range of state institutions that the ruling party has bent to its own image. The courts of law – which, over time, have been packed with judges and magistrates sympathetic to ZANU-PF – are trusted by almost two out of three citizens (64 percent). The army – whose officers have been rewarded with political appointments, commercial farms, and other perquisites – is trusted by some 55 percent. And traditional leaders – who have been incorporated, via patronage, into the ruling party apparatus, especially in the
34 Pearson’s r = .316, significant at p <.001. 35 Cramer’s V = .165, significant at p <.001. 36 Pearson’s r = .216, significant at p <.001. 37 Pearson’s r = .067, significant at p = .026.
Copyright Afrobarometer 19
Mashonaland provinces – retain the trust of almost as many. Most remarkably, the police – who have been at the forefront of the crackdown on opposition political activity, often by flouting the rule of law – are trusted by some 52 percent of the adult Zimbabwean population. In the face of this evidence, one can only conclude that ZANU-PF has achieved a measure of success in consolidating a monolithic party-state regime.
Finally, we focus analysis on the political leader who symbolizes the emergent regime, both internally to Zimbabweans and externally to the world. Are there reasons to think that President Mugabe’s popularity runs deeper than his lukewarm trust ratings would suggest? After all, his anti-colonial political message of radical land redistribution has populist appeal, including even among national leaders in certain neighboring countries.
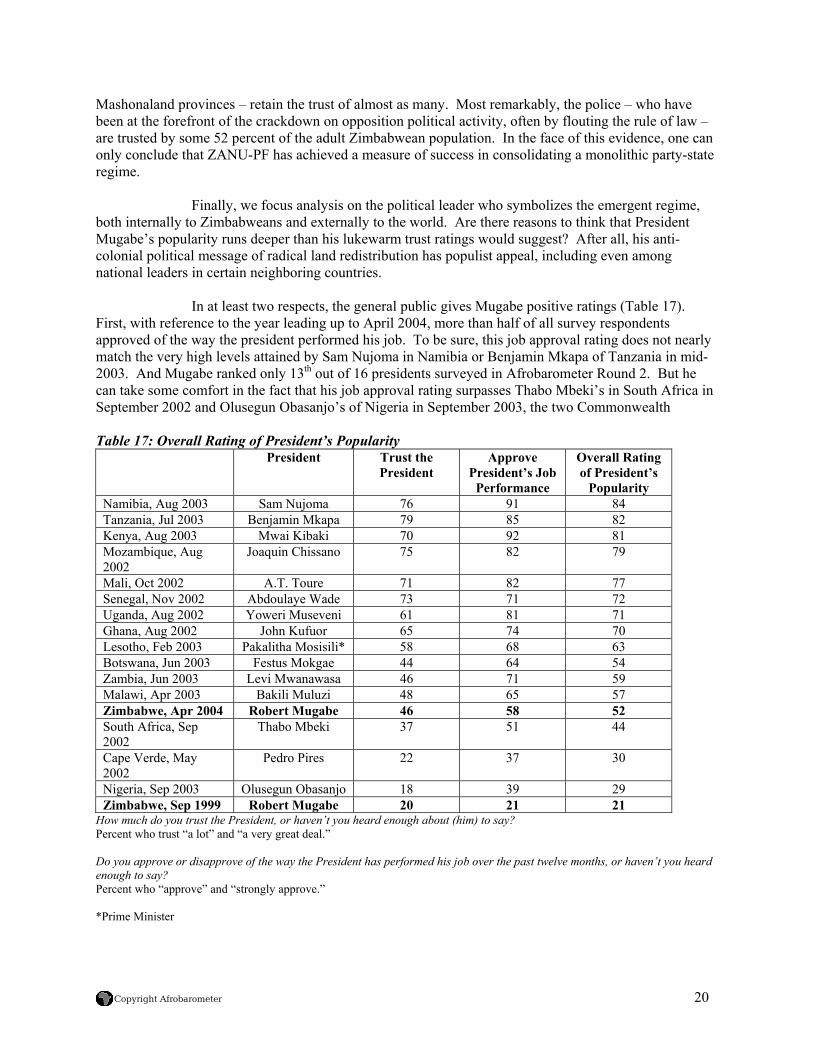
In at least two respects, the general public gives Mugabe positive ratings (Table 17).
First, with reference to the year leading up to April 2004, more than half of all survey respondents approved of the way the president performed his job. To be sure, this job approval rating does not nearly match the very high levels attained by Sam Nujoma in Namibia or Benjamin Mkapa of Tanzania in mid-2003. And Mugabe ranked only 13th out of 16 presidents surveyed in Afrobarometer Round 2. But he can take some comfort in the fact that his job approval rating surpasses Thabo Mbeki’s in South Africa in September 2002 and Olusegun Obasanjo’s of Nigeria in September 2003, the two Commonwealth
Table 17: Overall Rating of President’s Popularity
President Trust the President
Approve President’s Job
Performance
Overall Rating of President’s
Popularity Namibia, Aug 2003 Sam Nujoma 76 91 84 Tanzania, Jul 2003 Benjamin Mkapa 79 85 82 Kenya, Aug 2003 Mwai Kibaki 70 92 81 Mozambique, Aug 2002
Joaquin Chissano 75 82 79
Mali, Oct 2002 A.T. Toure 71 82 77 Senegal, Nov 2002 Abdoulaye Wade 73 71 72 Uganda, Aug 2002 Yoweri Museveni 61 81 71 Ghana, Aug 2002 John Kufuor 65 74 70 Lesotho, Feb 2003 Pakalitha Mosisili* 58 68 63 Botswana, Jun 2003 Festus Mokgae 44 64 54 Zambia, Jun 2003 Levi Mwanawasa 46 71 59 Malawi, Apr 2003 Bakili Muluzi 48 65 57 Zimbabwe, Apr 2004 Robert Mugabe 46 58 52 South Africa, Sep 2002
Thabo Mbeki 37 51 44
Cape Verde, May 2002
Pedro Pires 22 37 30
Nigeria, Sep 2003 Olusegun Obasanjo 18 39 29 Zimbabwe, Sep 1999 Robert Mugabe 20 21 21
How much do you trust the President, or haven’t you heard enough about (him) to say? Percent who trust “a lot” and “a very great deal.” Do you approve or disapprove of the way the President has performed his job over the past twelve months, or haven’t you heard enough to say? Percent who “approve” and “strongly approve.” *Prime Minister
Copyright Afrobarometer 20
presidents who have sought to broker talks between government and opposition in Zimbabwe. Second, Mugabe’s approval ratings have risen over time: trust in the president went up from 20 percent in 1999 to its present level of 46 percent; and his job performance score rose from 21 percent to 58 percent between 1999 and 2004. These changes coincide almost exactly with the period in which ZANU-PF has asserted its hegemony over the available political space in Zimbabwe. For purposes of further analysis, we combine popular trust in the president with approval of the president’s job performance. Displayed in the last column of Table 17, this construct is a simple average of the two preceding scores. We call this construct the overall rating of the president’s popularity and we seek to explain it in the last section of this report.38 Explaining a Paradox Public opinion in Zimbabwe in 2004 is a paradox. On the economic front, people feel deprived. They regard economic conditions in a generally negative light and worry – in the face of hunger, joblessness, and inflation – that their families are slipping into poverty. And they hold the government’s economic mismanagement responsible for perceived declines in public welfare. On the political front, however, Zimbabweans are acquiescing to Zanu-PF’s dominance. Even as they continue to reject one-man distatorship, they are losing faith in multiparty democracy as a solution to the country’s woes and are increasingly tempted, perhaps out of weariness, to try a single-party alternative. While ZANU-PF has not established itself as a widely trusted institution, Robert Mugabe’s popularity as president has gradually increased, especially when compared to low overt support for the opposition MDC and its leader.
In short, an economic decline of serious proportions has not prevented the Mugabe government from consolidating a tight political hold on the country. What accounts for this paradox? In the final section of this report we propose, and test, three possible explanations of the apparent acceptability of the incumbent president:
• The first is an economic explanation: perhaps those people who have benefited from ZANU-PF’s attempts at economic redistribution, or those who see the economic downturn easing in recent times, are ready to give the president the benefit of the doubt.
• The second explanation rests on political fear: perhaps Zimbabweans feel so intimidated by
ZANU-PF surveillance and control that they are unwilling to express political opinions honestly (especially in response to survey questions), instead saying what they think the government wants to hear.
• The last explanation concerns the power of propaganda: perhaps Zimbabweans have imbibed the
nationalists messages pumped out by the ruling party over the airwaves and in mass meetings and, accordingly, blame external and opposition forces rather than the government for their plight.
38 These items are highly correlated (Pearson’s r = .611, significant at p <.001). The construct is reliable at Alpha = .758.
Copyright Afrobarometer 21
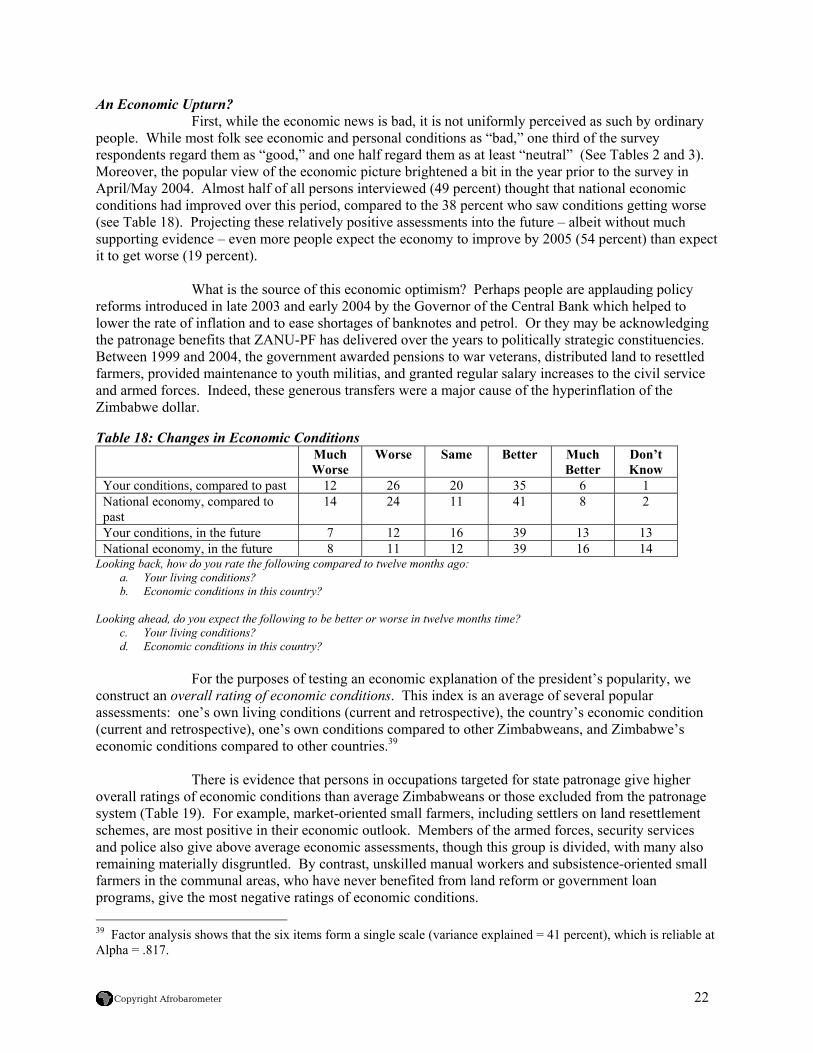
An Economic Upturn? First, while the economic news is bad, it is not uniformly perceived as such by ordinary people. While most folk see economic and personal conditions as “bad,” one third of the survey respondents regard them as “good,” and one half regard them as at least “neutral” (See Tables 2 and 3). Moreover, the popular view of the economic picture brightened a bit in the year prior to the survey in April/May 2004. Almost half of all persons interviewed (49 percent) thought that national economic conditions had improved over this period, compared to the 38 percent who saw conditions getting worse (see Table 18). Projecting these relatively positive assessments into the future – albeit without much supporting evidence – even more people expect the economy to improve by 2005 (54 percent) than expect it to get worse (19 percent).
What is the source of this economic optimism? Perhaps people are applauding policy reforms introduced in late 2003 and early 2004 by the Governor of the Central Bank which helped to lower the rate of inflation and to ease shortages of banknotes and petrol. Or they may be acknowledging the patronage benefits that ZANU-PF has delivered over the years to politically strategic constituencies. Between 1999 and 2004, the government awarded pensions to war veterans, distributed land to resettled farmers, provided maintenance to youth militias, and granted regular salary increases to the civil service and armed forces. Indeed, these generous transfers were a major cause of the hyperinflation of the Zimbabwe dollar. Table 18: Changes in Economic Conditions
Much Worse
Worse Same Better Much Better
Don’t Know
Your conditions, compared to past 12 26 20 35 6 1 National economy, compared to past
14 24 11 41 8 2
Your conditions, in the future 7 12 16 39 13 13 National economy, in the future 8 11 12 39 16 14
Looking back, how do you rate the following compared to twelve months ago: a. Your living conditions? b. Economic conditions in this country?
Looking ahead, do you expect the following to be better or worse in twelve months time?
c. Your living conditions? d. Economic conditions in this country?
For the purposes of testing an economic explanation of the president’s popularity, we construct an overall rating of economic conditions. This index is an average of several popular assessments: one’s own living conditions (current and retrospective), the country’s economic condition (current and retrospective), one’s own conditions compared to other Zimbabweans, and Zimbabwe’s economic conditions compared to other countries.39
There is evidence that persons in occupations targeted for state patronage give higher overall ratings of economic conditions than average Zimbabweans or those excluded from the patronage system (Table 19). For example, market-oriented small farmers, including settlers on land resettlement schemes, are most positive in their economic outlook. Members of the armed forces, security services and police also give above average economic assessments, though this group is divided, with many also remaining materially disgruntled. By contrast, unskilled manual workers and subsistence-oriented small farmers in the communal areas, who have never benefited from land reform or government loan programs, give the most negative ratings of economic conditions. 39 Factor analysis shows that the six items form a single scale (variance explained = 41 percent), which is reliable at Alpha = .817.
Copyright Afrobarometer 22
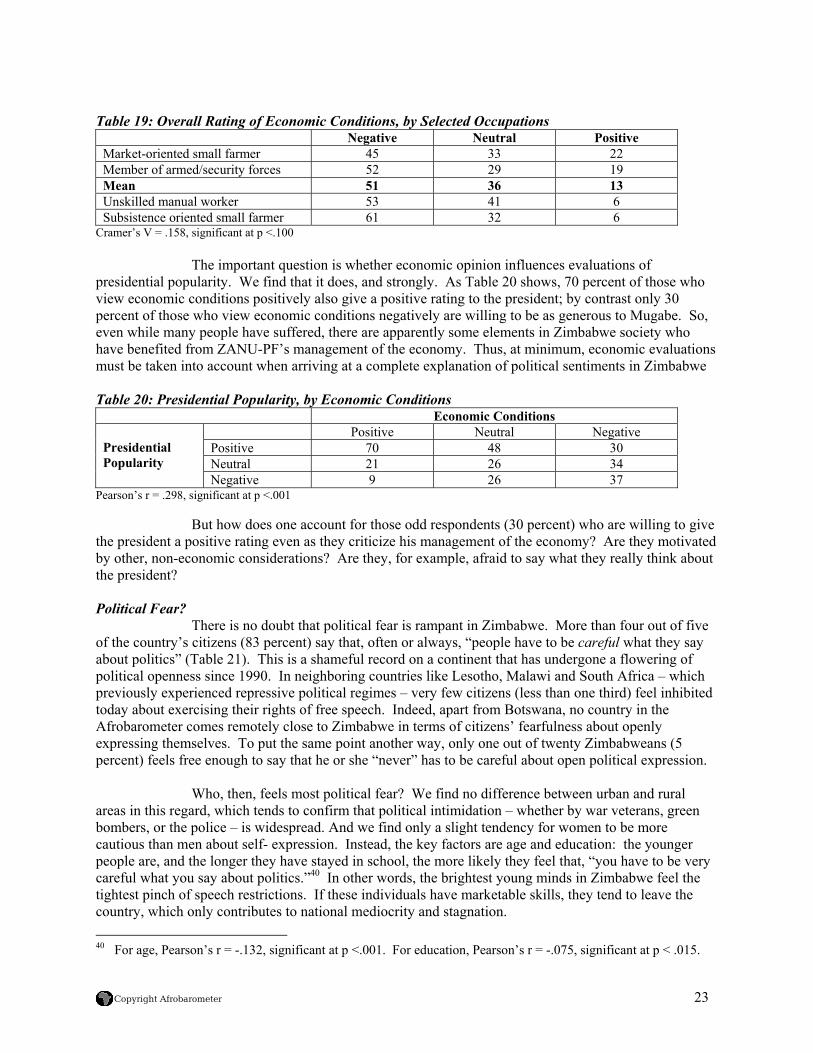
Table 19: Overall Rating of Economic Conditions, by Selected Occupations
Negative Neutral Positive Market-oriented small farmer 45 33 22 Member of armed/security forces 52 29 19 Mean 51 36 13 Unskilled manual worker 53 41 6 Subsistence oriented small farmer 61 32 6
Cramer’s V = .158, significant at p <.100 The important question is whether economic opinion influences evaluations of presidential popularity. We find that it does, and strongly. As Table 20 shows, 70 percent of those who view economic conditions positively also give a positive rating to the president; by contrast only 30 percent of those who view economic conditions negatively are willing to be as generous to Mugabe. So, even while many people have suffered, there are apparently some elements in Zimbabwe society who have benefited from ZANU-PF’s management of the economy. Thus, at minimum, economic evaluations must be taken into account when arriving at a complete explanation of political sentiments in Zimbabwe Table 20: Presidential Popularity, by Economic Conditions
Economic Conditions Positive Neutral Negative Positive 70 48 30 Neutral 21 26 34
Presidential Popularity
Negative 9 26 37 Pearson’s r = .298, significant at p <.001 But how does one account for those odd respondents (30 percent) who are willing to give the president a positive rating even as they criticize his management of the economy? Are they motivated by other, non-economic considerations? Are they, for example, afraid to say what they really think about the president? Political Fear? There is no doubt that political fear is rampant in Zimbabwe. More than four out of five of the country’s citizens (83 percent) say that, often or always, “people have to be careful what they say about politics” (Table 21). This is a shameful record on a continent that has undergone a flowering of political openness since 1990. In neighboring countries like Lesotho, Malawi and South Africa – which previously experienced repressive political regimes – very few citizens (less than one third) feel inhibited today about exercising their rights of free speech. Indeed, apart from Botswana, no country in the Afrobarometer comes remotely close to Zimbabwe in terms of citizens’ fearfulness about openly expressing themselves. To put the same point another way, only one out of twenty Zimbabweans (5 percent) feels free enough to say that he or she “never” has to be careful about open political expression.
Who, then, feels most political fear? We find no difference between urban and rural areas in this regard, which tends to confirm that political intimidation – whether by war veterans, green bombers, or the police – is widespread. And we find only a slight tendency for women to be more cautious than men about self- expression. Instead, the key factors are age and education: the younger people are, and the longer they have stayed in school, the more likely they feel that, “you have to be very careful what you say about politics.”40 In other words, the brightest young minds in Zimbabwe feel the tightest pinch of speech restrictions. If these individuals have marketable skills, they tend to leave the country, which only contributes to national mediocrity and stagnation. 40 For age, Pearson’s r = -.132, significant at p <.001. For education, Pearson’s r = -.075, significant at p < .015.
Copyright Afrobarometer 23
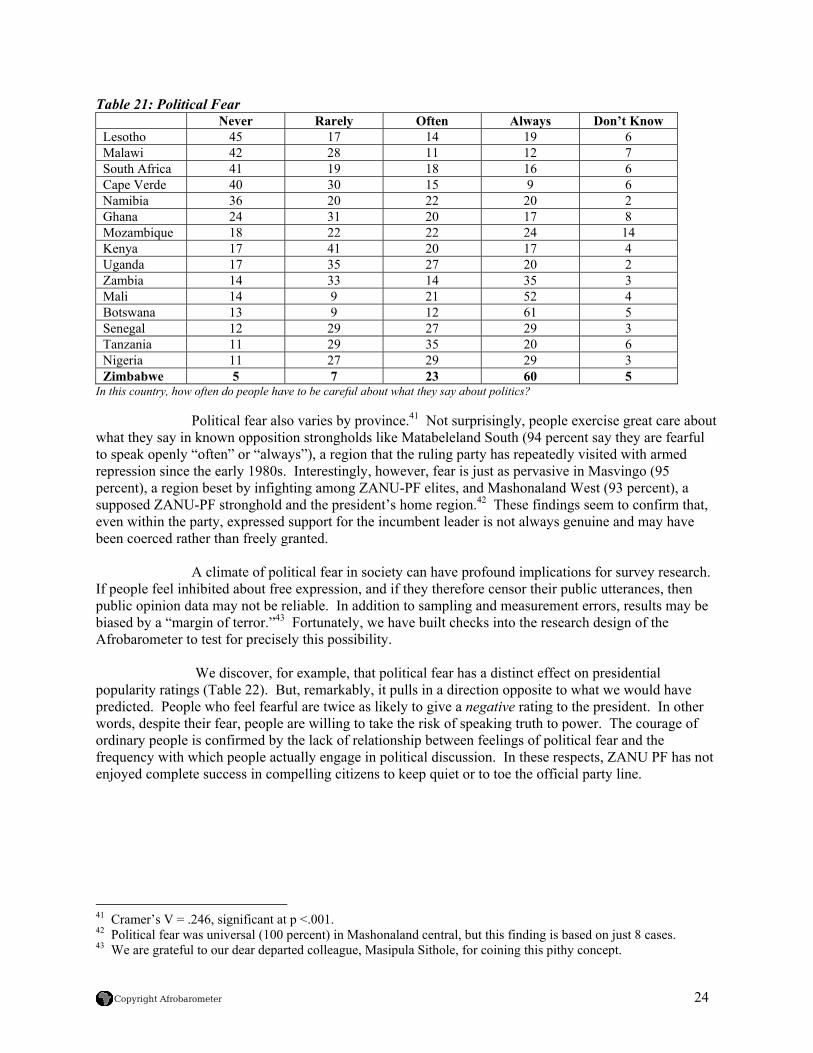
Table 21: Political Fear Never Rarely Often Always Don’t Know Lesotho 45 17 14 19 6 Malawi 42 28 11 12 7 South Africa 41 19 18 16 6 Cape Verde 40 30 15 9 6 Namibia 36 20 22 20 2 Ghana 24 31 20 17 8 Mozambique 18 22 22 24 14 Kenya 17 41 20 17 4 Uganda 17 35 27 20 2 Zambia 14 33 14 35 3 Mali 14 9 21 52 4 Botswana 13 9 12 61 5 Senegal 12 29 27 29 3 Tanzania 11 29 35 20 6 Nigeria 11 27 29 29 3 Zimbabwe 5 7 23 60 5
In this country, how often do people have to be careful about what they say about politics?
Political fear also varies by province.41 Not surprisingly, people exercise great care about what they say in known opposition strongholds like Matabeleland South (94 percent say they are fearful to speak openly “often” or “always”), a region that the ruling party has repeatedly visited with armed repression since the early 1980s. Interestingly, however, fear is just as pervasive in Masvingo (95 percent), a region beset by infighting among ZANU-PF elites, and Mashonaland West (93 percent), a supposed ZANU-PF stronghold and the president’s home region.42 These findings seem to confirm that, even within the party, expressed support for the incumbent leader is not always genuine and may have been coerced rather than freely granted.
A climate of political fear in society can have profound implications for survey research. If people feel inhibited about free expression, and if they therefore censor their public utterances, then public opinion data may not be reliable. In addition to sampling and measurement errors, results may be biased by a “margin of terror.”43 Fortunately, we have built checks into the research design of the Afrobarometer to test for precisely this possibility. We discover, for example, that political fear has a distinct effect on presidential popularity ratings (Table 22). But, remarkably, it pulls in a direction opposite to what we would have predicted. People who feel fearful are twice as likely to give a negative rating to the president. In other words, despite their fear, people are willing to take the risk of speaking truth to power. The courage of ordinary people is confirmed by the lack of relationship between feelings of political fear and the frequency with which people actually engage in political discussion. In these respects, ZANU PF has not enjoyed complete success in compelling citizens to keep quiet or to toe the official party line.
41 Cramer’s V = .246, significant at p <.001. 42 Political fear was universal (100 percent) in Mashonaland central, but this finding is based on just 8 cases. 43 We are grateful to our dear departed colleague, Masipula Sithole, for coining this pithy concept.
Copyright Afrobarometer 24
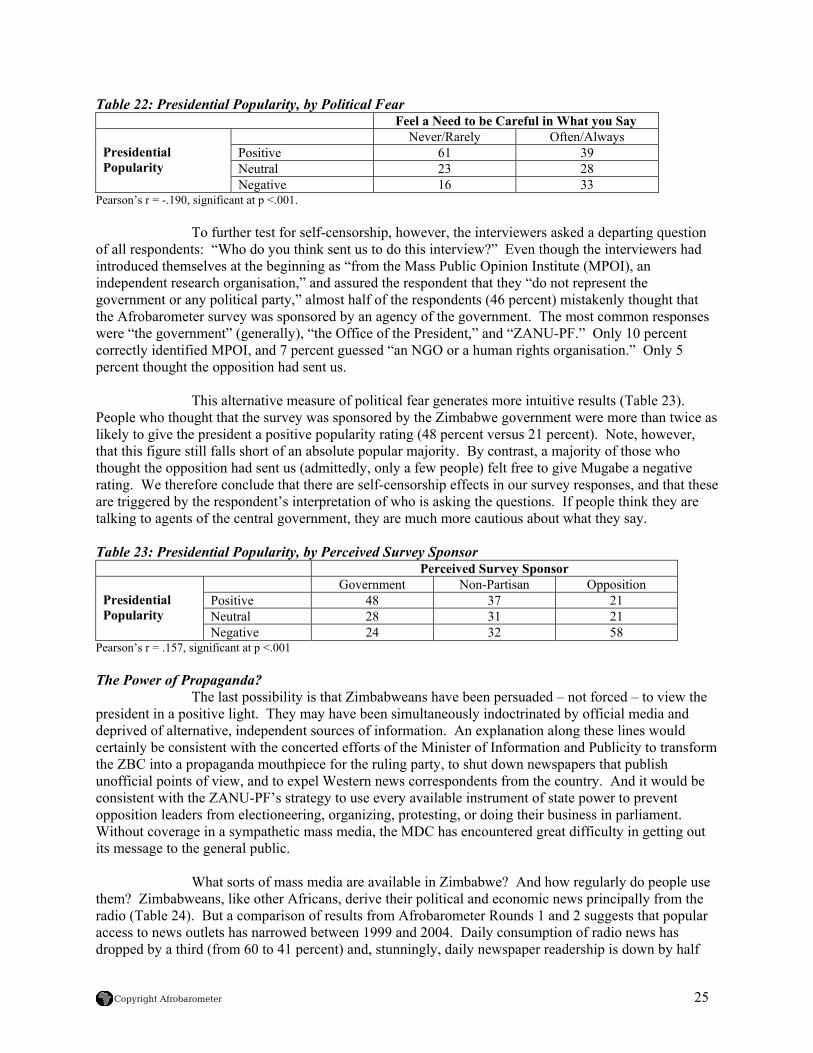
Table 22: Presidential Popularity, by Political Fear Feel a Need to be Careful in What you Say
Never/Rarely Often/Always Positive 61 39 Neutral 23 28
Presidential Popularity
Negative 16 33 Pearson’s r = -.190, significant at p <.001. To further test for self-censorship, however, the interviewers asked a departing question of all respondents: “Who do you think sent us to do this interview?” Even though the interviewers had introduced themselves at the beginning as “from the Mass Public Opinion Institute (MPOI), an independent research organisation,” and assured the respondent that they “do not represent the government or any political party,” almost half of the respondents (46 percent) mistakenly thought that the Afrobarometer survey was sponsored by an agency of the government. The most common responses were “the government” (generally), “the Office of the President,” and “ZANU-PF.” Only 10 percent correctly identified MPOI, and 7 percent guessed “an NGO or a human rights organisation.” Only 5 percent thought the opposition had sent us. This alternative measure of political fear generates more intuitive results (Table 23). People who thought that the survey was sponsored by the Zimbabwe government were more than twice as likely to give the president a positive popularity rating (48 percent versus 21 percent). Note, however, that this figure still falls short of an absolute popular majority. By contrast, a majority of those who thought the opposition had sent us (admittedly, only a few people) felt free to give Mugabe a negative rating. We therefore conclude that there are self-censorship effects in our survey responses, and that these are triggered by the respondent’s interpretation of who is asking the questions. If people think they are talking to agents of the central government, they are much more cautious about what they say. Table 23: Presidential Popularity, by Perceived Survey Sponsor
Perceived Survey Sponsor Government Non-Partisan Opposition Positive 48 37 21 Neutral 28 31 21
Presidential Popularity
Negative 24 32 58 Pearson’s r = .157, significant at p <.001 The Power of Propaganda? The last possibility is that Zimbabweans have been persuaded – not forced – to view the president in a positive light. They may have been simultaneously indoctrinated by official media and deprived of alternative, independent sources of information. An explanation along these lines would certainly be consistent with the concerted efforts of the Minister of Information and Publicity to transform the ZBC into a propaganda mouthpiece for the ruling party, to shut down newspapers that publish unofficial points of view, and to expel Western news correspondents from the country. And it would be consistent with the ZANU-PF’s strategy to use every available instrument of state power to prevent opposition leaders from electioneering, organizing, protesting, or doing their business in parliament. Without coverage in a sympathetic mass media, the MDC has encountered great difficulty in getting out its message to the general public. What sorts of mass media are available in Zimbabwe? And how regularly do people use them? Zimbabweans, like other Africans, derive their political and economic news principally from the radio (Table 24). But a comparison of results from Afrobarometer Rounds 1 and 2 suggests that popular access to news outlets has narrowed between 1999 and 2004. Daily consumption of radio news has dropped by a third (from 60 to 41 percent) and, stunningly, daily newspaper readership is down by half
Copyright Afrobarometer 25
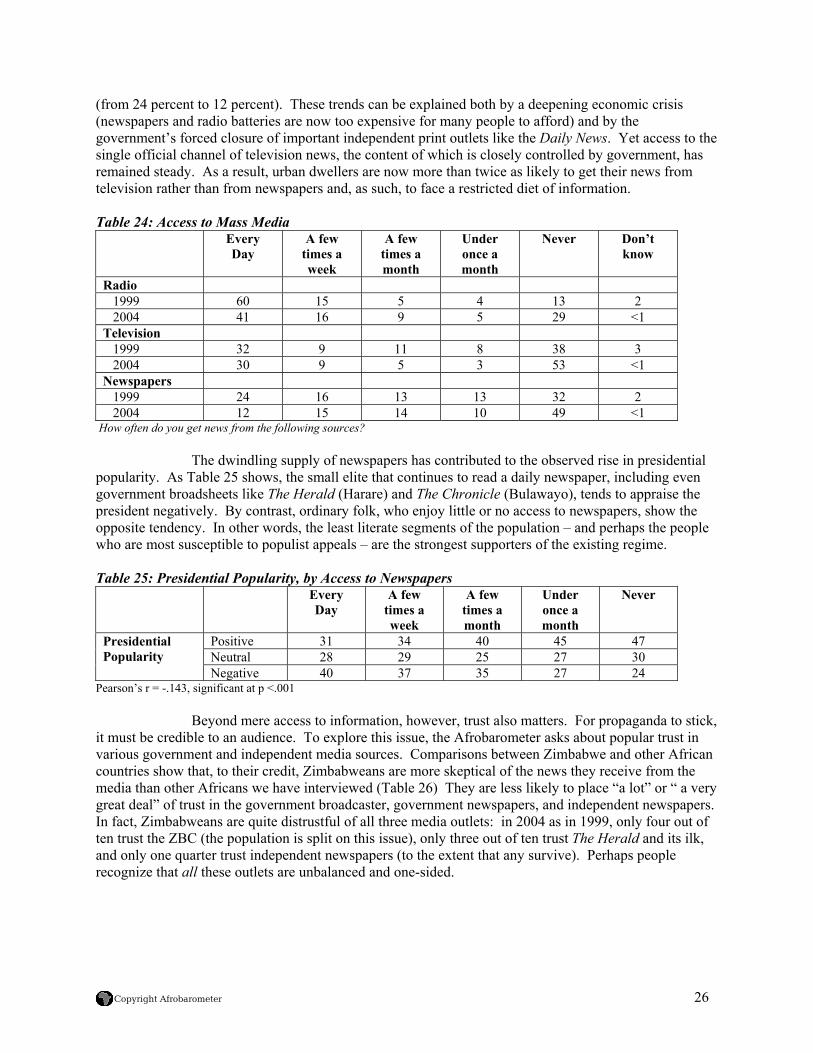
(from 24 percent to 12 percent). These trends can be explained both by a deepening economic crisis (newspapers and radio batteries are now too expensive for many people to afford) and by the government’s forced closure of important independent print outlets like the Daily News. Yet access to the single official channel of television news, the content of which is closely controlled by government, has remained steady. As a result, urban dwellers are now more than twice as likely to get their news from television rather than from newspapers and, as such, to face a restricted diet of information. Table 24: Access to Mass Media
Every Day
A few times a week
A few times a month
Under once a month
Never Don’t know
Radio 1999 60 15 5 4 13 2 2004 41 16 9 5 29 <1 Television 1999 32 9 11 8 38 3 2004 30 9 5 3 53 <1 Newspapers 1999 24 16 13 13 32 2 2004 12 15 14 10 49 <1
How often do you get news from the following sources? The dwindling supply of newspapers has contributed to the observed rise in presidential popularity. As Table 25 shows, the small elite that continues to read a daily newspaper, including even government broadsheets like The Herald (Harare) and The Chronicle (Bulawayo), tends to appraise the president negatively. By contrast, ordinary folk, who enjoy little or no access to newspapers, show the opposite tendency. In other words, the least literate segments of the population – and perhaps the people who are most susceptible to populist appeals – are the strongest supporters of the existing regime. Table 25: Presidential Popularity, by Access to Newspapers
Every Day
A few times a week
A few times a month
Under once a month
Never
Positive 31 34 40 45 47 Neutral 28 29 25 27 30
Presidential Popularity
Negative 40 37 35 27 24 Pearson’s r = -.143, significant at p <.001 Beyond mere access to information, however, trust also matters. For propaganda to stick, it must be credible to an audience. To explore this issue, the Afrobarometer asks about popular trust in various government and independent media sources. Comparisons between Zimbabwe and other African countries show that, to their credit, Zimbabweans are more skeptical of the news they receive from the media than other Africans we have interviewed (Table 26) They are less likely to place “a lot” or “ a very great deal” of trust in the government broadcaster, government newspapers, and independent newspapers. In fact, Zimbabweans are quite distrustful of all three media outlets: in 2004 as in 1999, only four out of ten trust the ZBC (the population is split on this issue), only three out of ten trust The Herald and its ilk, and only one quarter trust independent newspapers (to the extent that any survive). Perhaps people recognize that all these outlets are unbalanced and one-sided.
Copyright Afrobarometer 26
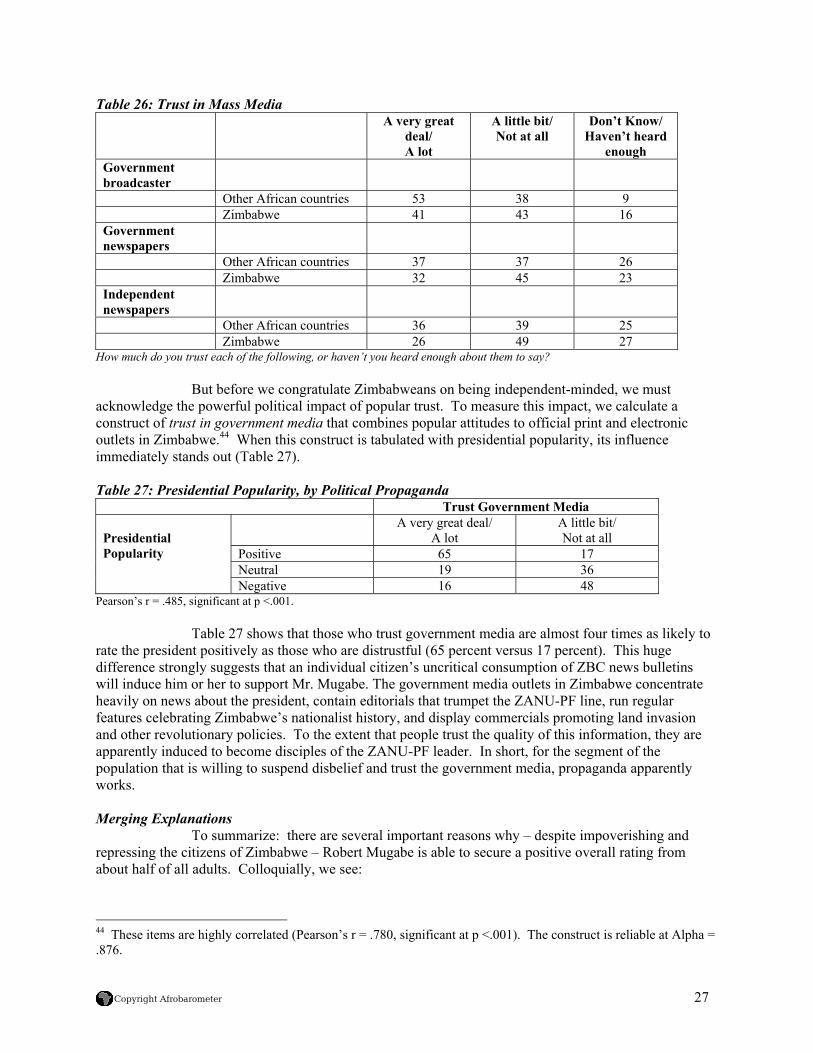
Table 26: Trust in Mass Media A very great
deal/ A lot
A little bit/ Not at all
Don’t Know/ Haven’t heard
enough Government broadcaster
Other African countries 53 38 9 Zimbabwe 41 43 16 Government newspapers
Other African countries 37 37 26 Zimbabwe 32 45 23 Independent newspapers
Other African countries 36 39 25 Zimbabwe 26 49 27
How much do you trust each of the following, or haven’t you heard enough about them to say? But before we congratulate Zimbabweans on being independent-minded, we must acknowledge the powerful political impact of popular trust. To measure this impact, we calculate a construct of trust in government media that combines popular attitudes to official print and electronic outlets in Zimbabwe.44 When this construct is tabulated with presidential popularity, its influence immediately stands out (Table 27). Table 27: Presidential Popularity, by Political Propaganda
Trust Government Media A very great deal/
A lot A little bit/ Not at all
Positive 65 17 Neutral 19 36
Presidential Popularity
Negative 16 48 Pearson’s r = .485, significant at p <.001.
Table 27 shows that those who trust government media are almost four times as likely to rate the president positively as those who are distrustful (65 percent versus 17 percent). This huge difference strongly suggests that an individual citizen’s uncritical consumption of ZBC news bulletins will induce him or her to support Mr. Mugabe. The government media outlets in Zimbabwe concentrate heavily on news about the president, contain editorials that trumpet the ZANU-PF line, run regular features celebrating Zimbabwe’s nationalist history, and display commercials promoting land invasion and other revolutionary policies. To the extent that people trust the quality of this information, they are apparently induced to become disciples of the ZANU-PF leader. In short, for the segment of the population that is willing to suspend disbelief and trust the government media, propaganda apparently works.
Merging Explanations To summarize: there are several important reasons why – despite impoverishing and repressing the citizens of Zimbabwe – Robert Mugabe is able to secure a positive overall rating from about half of all adults. Colloquially, we see:
44 These items are highly correlated (Pearson’s r = .780, significant at p <.001). The construct is reliable at Alpha = .876.
Copyright Afrobarometer 27
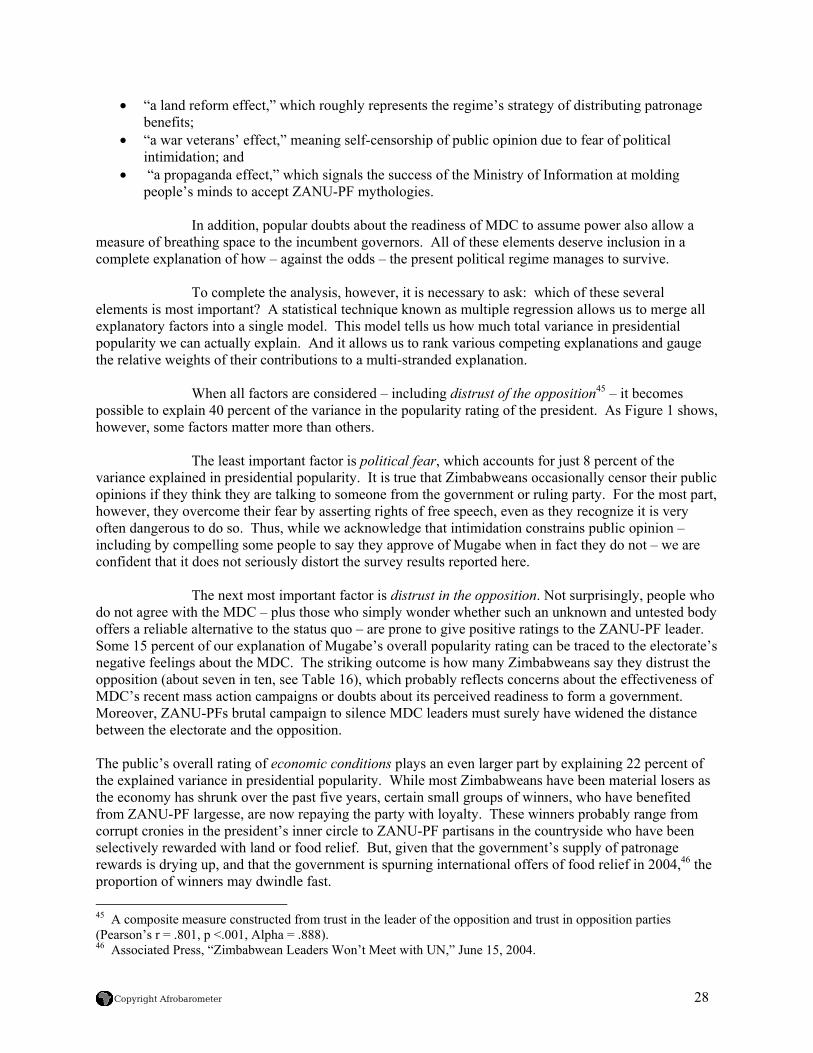
• “a land reform effect,” which roughly represents the regime’s strategy of distributing patronage benefits;
• “a war veterans’ effect,” meaning self-censorship of public opinion due to fear of political intimidation; and
• “a propaganda effect,” which signals the success of the Ministry of Information at molding people’s minds to accept ZANU-PF mythologies.
In addition, popular doubts about the readiness of MDC to assume power also allow a
measure of breathing space to the incumbent governors. All of these elements deserve inclusion in a complete explanation of how – against the odds – the present political regime manages to survive.
To complete the analysis, however, it is necessary to ask: which of these several elements is most important? A statistical technique known as multiple regression allows us to merge all explanatory factors into a single model. This model tells us how much total variance in presidential popularity we can actually explain. And it allows us to rank various competing explanations and gauge the relative weights of their contributions to a multi-stranded explanation.
When all factors are considered – including distrust of the opposition45 – it becomes
possible to explain 40 percent of the variance in the popularity rating of the president. As Figure 1 shows, however, some factors matter more than others.
The least important factor is political fear, which accounts for just 8 percent of the
variance explained in presidential popularity. It is true that Zimbabweans occasionally censor their public opinions if they think they are talking to someone from the government or ruling party. For the most part, however, they overcome their fear by asserting rights of free speech, even as they recognize it is very often dangerous to do so. Thus, while we acknowledge that intimidation constrains public opinion – including by compelling some people to say they approve of Mugabe when in fact they do not – we are confident that it does not seriously distort the survey results reported here.
The next most important factor is distrust in the opposition. Not surprisingly, people who
do not agree with the MDC – plus those who simply wonder whether such an unknown and untested body offers a reliable alternative to the status quo – are prone to give positive ratings to the ZANU-PF leader. Some 15 percent of our explanation of Mugabe’s overall popularity rating can be traced to the electorate’s negative feelings about the MDC. The striking outcome is how many Zimbabweans say they distrust the opposition (about seven in ten, see Table 16), which probably reflects concerns about the effectiveness of MDC’s recent mass action campaigns or doubts about its perceived readiness to form a government. Moreover, ZANU-PFs brutal campaign to silence MDC leaders must surely have widened the distance between the electorate and the opposition. The public’s overall rating of economic conditions plays an even larger part by explaining 22 percent of the explained variance in presidential popularity. While most Zimbabweans have been material losers as the economy has shrunk over the past five years, certain small groups of winners, who have benefited from ZANU-PF largesse, are now repaying the party with loyalty. These winners probably range from corrupt cronies in the president’s inner circle to ZANU-PF partisans in the countryside who have been selectively rewarded with land or food relief. But, given that the government’s supply of patronage rewards is drying up, and that the government is spurning international offers of food relief in 2004,46 the proportion of winners may dwindle fast. 45 A composite measure constructed from trust in the leader of the opposition and trust in opposition parties (Pearson’s r = .801, p <.001, Alpha = .888). 46 Associated Press, “Zimbabwean Leaders Won’t Meet with UN,” June 15, 2004.
Copyright Afrobarometer 28
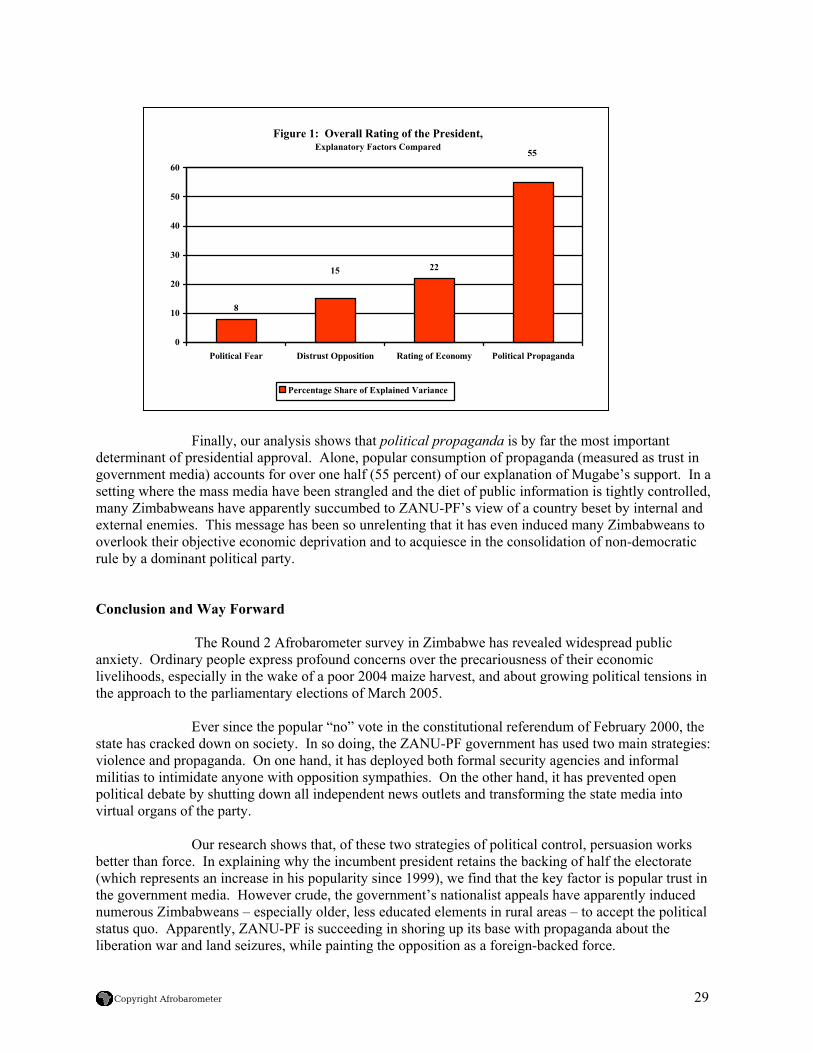
determingovernmsetting wmany Ziexternal overlookrule by a Conclus
anxiety. livelihoothe appro
state hasviolencemilitias tpolitical virtual o
better tha(which rethe govenumeroustatus quliberation
Copyrig
Figure 1: Overall Rating of the President,Explanatory Factors Compared
8
22
55
15
0
10
20
30
40
50
60
Political Fear Distrust Opposition Rating of Economy Political Propaganda
Percentage Share of Explained Variance
Finally, our analysis shows that political propaganda is by far the most important ant of presidential approval. Alone, popular consumption of propaganda (measured as trust in ent media) accounts for over one half (55 percent) of our explanation of Mugabe’s support. In a here the mass media have been strangled and the diet of public information is tightly controlled,
mbabweans have apparently succumbed to ZANU-PF’s view of a country beset by internal and enemies. This message has been so unrelenting that it has even induced many Zimbabweans to their objective economic deprivation and to acquiesce in the consolidation of non-democratic dominant political party.
ion and Way Forward
The Round 2 Afrobarometer survey in Zimbabwe has revealed widespread public Ordinary people express profound concerns over the precariousness of their economic ds, especially in the wake of a poor 2004 maize harvest, and about growing political tensions in ach to the parliamentary elections of March 2005.
Ever since the popular “no” vote in the constitutional referendum of February 2000, the cracked down on society. In so doing, the ZANU-PF government has used two main strategies: and propaganda. On one hand, it has deployed both formal security agencies and informal o intimidate anyone with opposition sympathies. On the other hand, it has prevented open debate by shutting down all independent news outlets and transforming the state media into rgans of the party.
Our research shows that, of these two strategies of political control, persuasion works
n force. In explaining why the incumbent president retains the backing of half the electorate presents an increase in his popularity since 1999), we find that the key factor is popular trust in
rnment media. However crude, the government’s nationalist appeals have apparently induced s Zimbabweans – especially older, less educated elements in rural areas – to accept the political o. Apparently, ZANU-PF is succeeding in shoring up its base with propaganda about the war and land seizures, while painting the opposition as a foreign-backed force.
ht Afrobarometer 29
By contrast, violence against citizens has been less politically productive, since it has
alienated more Zimbabweans than it has converted. To be sure, many rural dwellers, notably in Mashonaland, are acquiescing to the government’s strong-arm tactics and people everywhere have learned to be very cautious about self-expression. At the same time, the squeeze on the media has prevented the MDC from getting out its message about democratic transition, to the point that many people are questioning its effectiveness as an alternative to ZANU-PF.
The electorate remains deeply divided: although one half of all eligible voters approves
of Mugabe, the other half does not. And the government and opposition are not on speaking terms. Therefore, there is urgent need for dialogue. Indeed, Zimbabweans themselves say they want the two parties to engage in negotiations leading to political compromise. The Afrobarometer survey shows that, as of May 2004, two thirds of adult Zimbabweans consider that “problems in this country can only be solved if MDC and ZANU-PF sit down and talk with one another” (68 percent). They prefer reconciliation to either continued ZANU-PF resistance to talks (19 percent) or MDC’s call for new elections (8 percent).
It is in the interests of all parties to heed public opinion. ZANU-PF can only end its international political isolation and attract much needed investment and development capital by entering into genuine dialogue with the MDC. For its part, the opposition movement must recognize that, because it will likely lose seats in any parliamentary contest controlled by the ruling party, a comprehensive political solution is a prerequisite to arriving at a fair share of power. As for the weary Zimbabwean electorate, they would surely welcome a respite from violence and propaganda to which they have been subjected in recent years. They deserve an opportunity to freely select a government in an atmosphere of peace and security.
Copyright Afrobarometer 30
Recommended

![[XLS] · Web view45/03 SIPPEL ANDREAS RUDOLF LUDWIG 4604/03 SIRLON STEAKHOUSE & COFFEE BAR 478/96 504/04 SITHOLE MAITE AGNES 4427/01 SITHOLE SIPHO KENNETH & DUDUZILE FLORENCE 4485/03](https://img.pdfslide.us/doc/110x75/5b3485b47f8b9a6b548c3427/xls-web-view4503-sippel-andreas-rudolf-ludwig-460403-sirlon-steakhouse-.jpg)