HYDRAULICS BRANCH OFFICIAL FILE COPY
EROSION OF COHESIVE SEDIMENTS
A report prepared by the
BUREAU OF RECLAMATION HYDRAULIC LABORATORY
OFFICE FILE COPY
WHEN BORROWED RETURN PROMPTLY
Task Committee on Erosion of Cohesive Materials Committee on Sedimentation
June, 1967
American Society of Civil Engineers
Frank D. Masch, Chairman Ernest T. Smerdon Phil "F" Enger

..
TABLE OF CONTENTS
Introduction .
Laboratory Research on Eros ion Resistance
Field Observations in Natural Channels .
Sediment Load . Shapes of Natural Channels Effects of Structures . Climate and Temperature Effects Predicting Erosion or Deposition
Design of Non-Eroding Channels
Observations and Tests . Design Information Available
Problems of Agricultural Lands and Channels
Land Erosion . Erosion Loss Equation Soil Erodibility .
Scour in Agricultural Changes . Design of Farm Drain Ditches and Terrace Design of Farm Irrigation Systems
Conclusions and Needed Research .
Bibliography .
1
2
5
20
20 24 28 30
. 32
.35
35 .37
.47
. 48 49 .53
. 54 Channels . 55
. 56
. 60
.64

\,
INTRODUCTION
The Task Committee on Erosion of Cohesive Materials was
forrrted by the Sedimentation Committee of the Hydraulics Divis ion
of ASCE to review the literature and to establish what has been done
and what the research needs are relative to:
a. the fundamental understanding of principles and processes of erosion of cohesive sediments, and
b. the planning, design, construction and maintenance of channels in cohesive materials.
The need to define the fundamental principles involved in the
erosion process and to develop criteria and guides applicable to
field problems is indeed great. This has been clearly demonstrated
by the numerous river, irrigation and drainage, and channel stability
problems encountered when dealing with soils displaying varying
degrees of cohesiveness.
From an abstracted bibliography prepared by the Task
* Committee [ 1] , sever al trends of res ear ch on cohesive sediments
can be noted. Most of the work on cohesive sediments has been
carried on by hydraulic engineers, agricultural engineers and soil
scientists. In general, research by each of these groups has been
directed toward solutions of the problems most often encountered
'~ Numbers in brackets correspond to similarly numbered entries
in the bibliography, pages 64- 70.
2

..
'f
by the particular group. For example, hydraulic research efforts have
been directed toward determination of tractive force , channel stability
criteria and othe r da t a relate d t o c hanne l d e sign. Many of these
studies have involved either field observations, flume tests, or shear
tests in specially designe d apparatus. Usually , some measure of
resistance to eros i on or rate of e rosion has be e n r e lated to mechani -
cal properties of the cohes iv e sediment s , such as vane shear strength,
compressive strength, Atterburg limits , <l i spers ion ratio , etc.
Agricultural e ngineers have been more c oncerned with ero
sion control in irrigation channels and furrows and with ra indrop
erosion. In the agricultural discipline , rates of erosion hav e been
related to furrow size and slope , time of irrigation, extent of vege -
tation and soil type. Research by soil scientists has proceeded
along lines in whif h special study has been given to the chemical,
mineralogical , a n d physical properties of the soil.
Estuarine sedimentation is another area in which eng ineers
are concerned with cohesive sediment s. In estuaries , sediment
particles are mostly in the fine silt and clay - size range. In estuaries ,
however, the sed iment problem is fu r ther complicated by the unsteady
nature of the fl ow and by flo c culation problems caused by reactions
between sea wate r a n d claye y s e diments. The problems of e stuarine
3

sedimentation were beyond the scope of the activities of this Task
Committee, and are not discussed in this report.
Even from a cursory glance through the literature on cohesive
sediments, one is struck immediately with the interdisciplinary nature
of the erosion problem. As contrasted to noncohesive sediments in
which the weight and size of the particles are the principle sediment
factors controlling erosion, the resistance of c ohesive sediments to
erosion is related to the electrochemical bond between individual
particles. Thi s bond in turn depends on the ionic charge on the parti
cles, the presence of electrolytes, the mineralogy, temperature, pH,
ion exchange and absorption. These factors are usually not thought
of in the realm of Civil Engineering, but rather are left to the soil
chemists, mineralogists, and physicists. Still from an engineering
standpoint, it is desirable to have simple and readily measurable
properties to characterize the erosion resistance of cohesive sediments.
When considering the erosion of cohesive sediments, exclusive
of the estuarine problem, four broad catagories of study are particu
larly significant. These are:
1. laboratory research on erosion resistance.
2. field observat ions in natural channels.
3. design of non-eroding channels.
4. problems of agr icultural land and channels.
4

The following sections of this report are concerned primari
ly with each of these catagories, Much of the literature currently
available is reviewed briefly and recommendations are mad e for
practical application and for further res ear ch.
LABORATORY RESEARCH ON EROSION RESISTANCE
Much of the resear c h undertaken in the laboratory has been
directed toward determining relationships between a critical boundary
shear stress or a tractive force above which scour of a cohesive
material begins and pertinent soil prope rties and flow conditions.
Studies in specially designed apparatus and laboratory flumes have
attempted to define the mechanical soil properties which best charac-
terize the erosion resistance of var ious cohesive soils.
When concerned with stable c hannel design or localized scour
in beds of cohesive sediments, either a c r itical tractive forc e or a
safe permissible velocity is selected so that no undesirable erosion
occurs. These methods involve choosing the hydraulic variables
such that certain critical tractive forces or velocities are not ex-
ceeded. While it is generally understood that the scour resistance
of a cohesive sediment will depend in some fashion on the properties
5

of the sediment, the complete significance of such parameters as
density, moisture content, percent clay, vane shear strength, etc.
is not fully known at this time.
In work on the Klaralve'n, Sundborg [2] proposed that the
force resisting entrainment was proportional to the shear strength
of the sediment. In a similar manner , Dunn [3] related critical
tractive force at which erosion of a cohesive sediment was con-
sidered to have started to the vane shear strength of the soil. Dunn
tested samples of cohesive soils taken from channels in Colorado,
N ebraska and Wyoming. He subjected the samples to the erosive
action of a submerged jet and measured the magnitude of the boundary
shear stress causing scour by replacing the soil sample with a
shear plate coated with soil particles. Dunn's equation for the criti
cal tractive fo:itce, Tc' is given by
Tc ::: 0. 02 + Sv tan 8
1000
+ O. 18 tan 8
in which S'V is the vane shear strength and 8 is the inclination with
the horizontal of the linear relation between critical tractive force
and vane strength. Dunn then relates 8 to the percent of soil finer
than O. 06 mm, plasticity index, and to various statistical repre
sentations of the particle size distribution.
6
(1)

To help develop design criteria for unlined reaches of irri
gation canals, Carlson and Enger [ 4] performed field and laboratory
studies with various cohesive soils. Critical t ractive forces were
obtained from a test in which the soil samples were set into a well
flush with the bottom of a circular tank and water circulated over
the sample with a rotating impeller. Among the various properties
measured were liquid limit, plasticity index, soil density, percent
of maximum Proctor density, shrinkage limits, soil gradation, and
vane shear strength values. Several correlations between the vari
ables were obtained and recommendations for general use were
made for soils displaying properties similar to those tested. Ex
amples were also presented illustrating the use of the results in the
design of unlined canals in cohesive soils.
Enger [5] also reports on studies made in a boundary shear
flume. In these studies samples of cohesive sediments were tested
by gradually increasing the boundary shear stress acting on a sample
until the shear became critical and the sample began to erode. For
the soils tested, the boundary shear required to produce erosion was
found to be a function of the moisture content at which the soil was
compacted.
Moore and Mas ch [ 6] made a series of tests using a vertical
7

submerged jet to determine the relative scour resistance of various
kinds of sediments. In these tests , the c haracteristi cs of the scour
surface were observed on remolded and natural sediments , and the
rates of scour were measured by the weight loss from the sample.
Results from these tests indicated that the mean depth of erosion
was proportional to the logarithm of the t ime -dur ing which scour
occurred. This is a result similar to that found in experiments on
noncohesive sediments.
A number of flume tests also have been performed to deter -
mine the relationship between critical tractive force and various
soil properties . Among the most notable are those by Smerdon and
Beasley [7] and more recently by Abdel-Rahman [8]. In the Smerdon
and Beasley studies, data from hydraulic and physical tests on soils
were analyzed statistically to determine the apparent correlation
between critical tractive force and pertinent soil properties. For
the soils tested, the critical tractive for c es computed from the
energy slope and channel properti es were found to correlate with
plasticity index, dispersion ratio , mean particle size and percent
clay. These correlations are illustrated in Figures 1 through 4.
For the soils te ,sted, the critical tractive forces, Tc ' were found to
be best correlated with plasticity index and dispersion ratio , the
8

N --........ en
.D
Q)
0 ... 0 LL
a:, > -0 0 ... t-
0.100
0.050
0.020
0 u 0.010 +... (.)
0.005
~
3 5
9
/, ·-
/1 ~ I )
0 V o7
0/
vo 0
V
T = 0.0034(PI) 0.8 4 C
10 20 ~ 0 100 2 00
Plasticity Index
FIG. I CRITICAL TRACTIVE FORCE DETERMINED .FROM ENERGY SLOPE VS. PLASTICITY INDEX. (ofter Smerdon and Beoseley [ 7J)
0.100
N --........ en ~ 0.050
-0 C ... t-
0.020
8 0.010 -... u
0.005 3
~ ......
"'
5
~D Tc= 0.213(Dr)-0·63
I~ ~o
0~ ~
~
"""' ~ "
10 20 50 100 200
Dispersion Ratio
FIG. 2 CRITICAL TRACTIVE FORCE DETERMINED FROM ENERGY SLOPE VS.
DISPERSION RATIO. (after Smerdon and Beoseley [7])

(\J ..... -' II)
..Q
~
Cl) (.) ... Q ~
Cl)
> -(.) IC ... t-
0.100
0.050
0 .020
~ 0.010 -... u
0.005 3 5
10
~,
0 /i / )
0
o/o V
0 /o ~/ D 0
/0 'c = 0.0022(Pl)O.S2
10 20 50 100 200
Plasticity Index
FIG . 3 CRITICAL TRACTIVE FORCE DETERMINED FROM VELOCITY PROFILE VS. PLASTICITY INDEX. (after Smerdon and Beaseley [7J)
0.10 n
C\I --' II)
..Q 0.05 Q)
0 ... 0
0 Tc= O.IIO(Drf
0·57
-"""Ii
~ ') C
LL
Q),
> 0.02 -0
IC ... ~
IC 0.01 0 -...
0 ~o 0
0 "' "' 00
0 ' ~ u
0.00 I:;
3 5 10 20 50 ICO 2 00
Dispersion Ratio
FIG. 4 CRITICAL TRACTIVE FORCE DETERMINED FROM VELOCITY PROFILE VS. DISPERSION RATIO. ( after Smerdon and Beaseley C 7J)
'
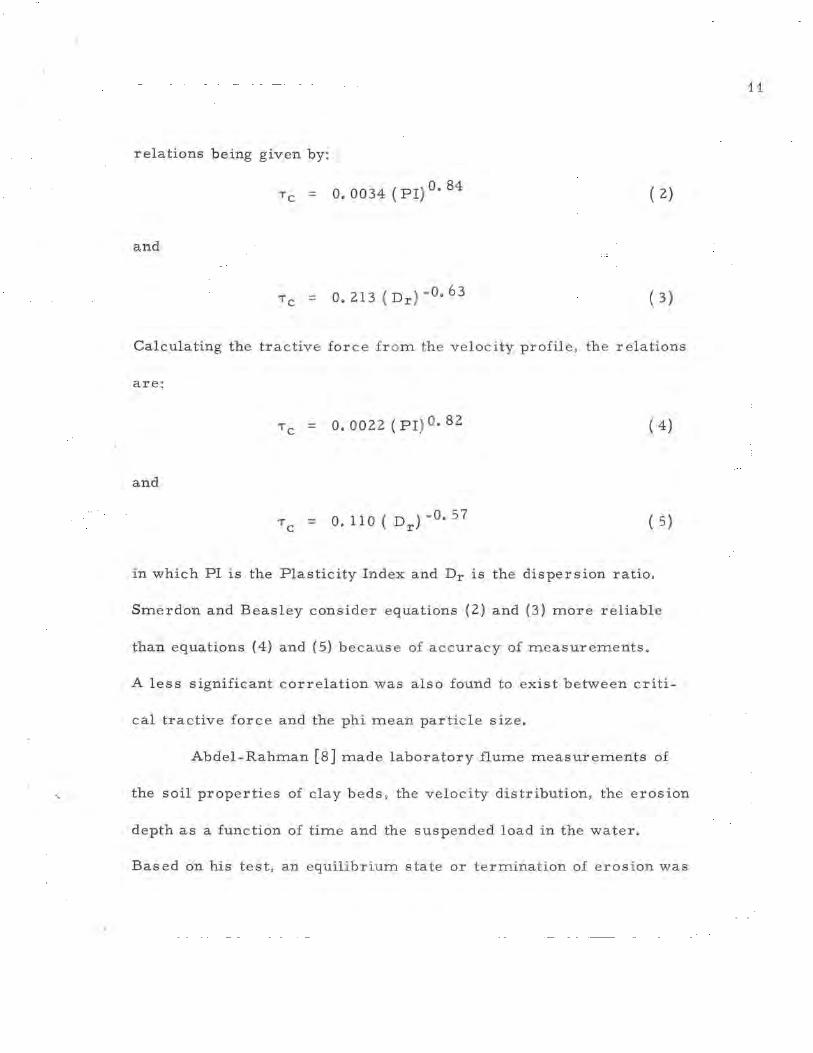
relations being given by:
O. 0034 { PI) O. 84 ( 2)
and
O. 213 ( Dr ) -O. 63 ( 3)
Calculating the tractive fo ·rce fr om the velocity profile , the relations
are :
Tc = o. 0022 { PI) o. 8 2 ( 4)
and
( 5)
in which PI is the Plasticity Index and Dr is the dispersion ratio.
Smerdon and Beasley consider equations (2) and (3) more reliable
than equations (4) and (5) because of a ccuracy of measurements.
A less significant correlation was also found to exist between criti
cal tractive force and the phi mean particle size •
. Abdel-Rahman [8] made laboratory flume measurements of
the soil properties of clay beds , the velocity distribution, the erosion
depth as a function of time and the suspended load in the water.
Based on his test , an equilibrium state or termination of erosion was
11

found to occur. Empirical equations were determined for beds of
Opalinuston clay that g ive information on the mean depth of erosion,
tm'.at ste ady state cond i tions a n d on the be d roughn e ss , Em· The s e
equations ar e:
and
:::: 0 . 83 X 10 - 4 + 2. 90 X 10 - 6
in which R is the hydraulic radius; Se the energy slope ; pa pressure
dependent on viscosity of flow and mineralogy of the soil; Sv the vane
shear strength of the bed material after the flow of water; p ithe densi
ty of water ; Yw the specific weight of water ; u* the friction velocity;
II
y s the submerged volume w e ight of the bed mate rial ; S0
the bed
slope ; µ the visco sity; and b1
is a constant. Abdel - Rahman 1 s tests
on mean erosion depth versus t ime show s imilar characteristics to
those determined b y Moore and Mas c h [6) in tests with the submerg e d
jet. Flume test w i th salt wa te r and e stuar ine s e d iments have also
12
(6)
(7)

been reported by Partheniades [9] who, contrary to the work of others,
reports that shear strength is not a factor in determining the resistance
of cohesive sediments.
It is not entirely clear whether tractive force measurements
made on soil samples set into a section of a smooth-bottom flume or
tank are totally representative of the boundary shear stress which
could cause erosion of a cohesive bed. As the flow over the bottom
suddenly encounters the soil sample , there is abrupt change in the
bed roughness which in turn can affect the velocity distribution. This
is particularly true when the surface of the soil sample is eroding.
Under these conditions, the average tractive force is not uniformly
distributed over the sample , and determinations of critical tractive
force from average channel and flow properties are not necessarily
representative of the boundary shear on the sample.
If the relationships between critical tractive force and vari
ous properties of cohesive soils are to be investigated, there is a
necessity to measure a mean shear stress or tractive force that is
nearly constant over the entire surface of the sample tested. With
this in mind, Moore and Masch [6] developed a small rotating cylin
der apparatu.s , Figure 5, which is useful in determining factors that
control the erosion resistance of cohesive sediments. In this appa -
13

14
Torsion Rod
Fluid
Upper End Piece
Soil Sample
----- Rotating Transparent Cylinder
Supporting Torque Tube
Lower End Piece
1-4------ Variable Speed Drive
.FIG. 5 DIAGRAM OF MODIFIED ROTATING CYLINDER TEST APPARATUS. (after Moore and Masc~ C6J)
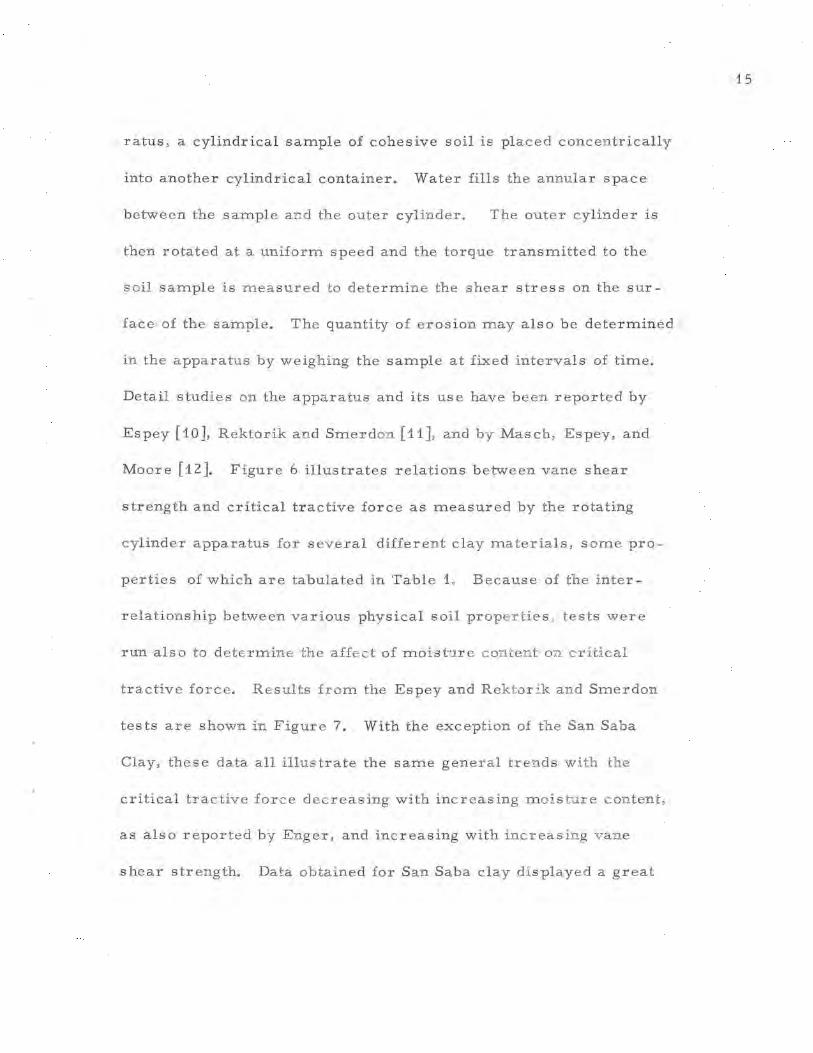
ratus, a cylindrical sample of cohesive soil is placed concentrically
into another cylindrical container. Water fills the annular space
betwe en the sample and the outer cylinder. The outer cylinde r is
then rotated at a uniform speed and the torque transmitted to the
soil sample is measured to determine the shear stress on the s u r-
face of the sample. The quantity of erosion may also b e determined
in the apparatus by weighing the sample at fixed intervals of time.
Detail studies on the apparatus and its use have been reported by
Espey [ 10 ], R ektorik and Smerdon [ 11 ], and by Mas ch, Espey, and
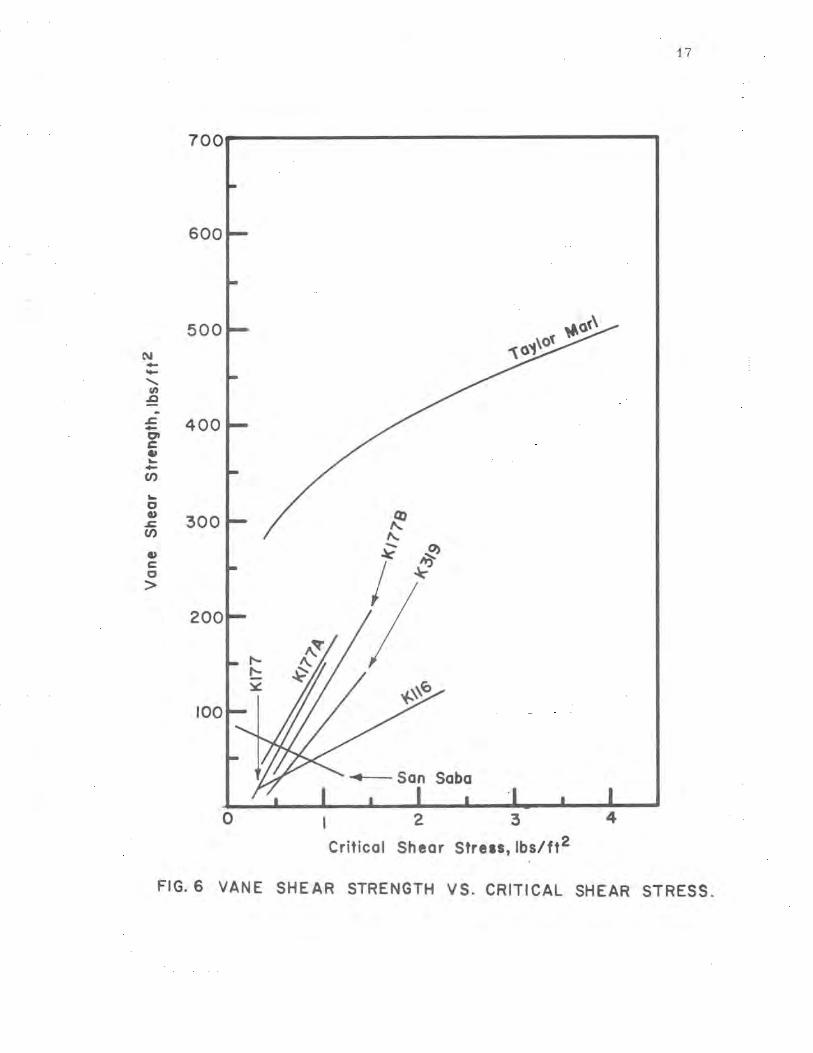
Moore [12]. Figure 6 illustrates relations between vane shear
strength and critical tractive force as measured by the rotating
cylinder apparatus for several different clay materials, some pro
perties of which are tabulated in Table 1. Because of the inter
relation ship between various physical soil properties, tests were
run also to determine the affect of moisture content on critical
tractive force. Results from the Espey and Rekto r ik and Smerdon
tests are shown in F igure 7. With the exception of the San Saba
Clay, these data all illustrate the same general trends with the
critical tractive force decreasing with increasing m oi s ture content,
as also reported by Enger, and increasing with increasing vane
shear strength. Data obtained for San Saba clay displayed a great
15

S oil Name and Number
Texture
Liqui d L im it
Plastic Limit
Plasticity Index
Percent Clay
Mean Particle S i ze, mm
TABLE 1. PHYSICAL PROPERTI ES OF SOME CLAY- TYPE SEDIMENTS (after ESPEY [ 10] AND REKTORIK AND SMERDON [11])
Lake Char le s Lufkin Houston Houston Hous ton K319 K116 K177 K177A K1 77 B
Clay o r Clay or Clay or Clay or Clay or S ilty Clay C lay Loam Silty Clay Silty Clay Silty Clay
56. 4 4 9. 4 43.7 44. 7 48 . 7
22. 0 15. 9 20. 5 17 0 7 18.0
34.4 33. 5 23. 2 27.0 30. 7
46. 2 40. 3 55. 5 55. 5 55. 5
0 . 0019 0 . 0084 0.0033 0 . 0033 0.0033
San Taylor Saba Marl
Silty Clay
47.7 47
22.0 21
25. 7 26
44. 7 50
0.0020 0.0048
17
100 ..... ---------------------------------,
600
500 ~ot\ ~\O(
N ~o --' (/)
~
~
..c 400 -g' .. ~ -en ~
C
~ Q)
300 ..c en I\.. - ~ Q) ,le' C
I ~ C >
200
,.... t:: ~
100
San Saba
0 2 3 4
Critical Shear Stress, lbs/ft2
FIG. 6 VANE SHEAR STRENGTH VS. CRITICAL SHEAR STRESS.

60
~ ',gc,
0 '?cs I c,~ -- ~ .,,
55 • I-... Cl) -.... <( -- 5 C • -C 0
(.)
• ... ::::, - 45 .,, 0 ~
40
2.0 3.0
Critical Shear Stress, lbs/ft2
FIG. 7 CRITICAL SHEAR STRESS VS. MOISTURE CONTENT.

amount of s catter and w hen fitted with a least squares regression, the
resulting relation showed an opposite trend to those found for the other
soils, No explanation has been offered for the reverse behavior of this
particular so i l.
Mar tin [13 ] , Griss inger [ 14], and others have repor ted on the
effects of chemical and physical properties on erosion resistance.
Ma rtin discuss es the effect of clay type and electrolyte on compress ive
s t rength a nd notes that a change in k inemati c v i scosity results as clay
ma terial goes into s us pension during eros ion and tha t this in turn i s a
fa ctor which may affect the tra c t ive fo rce. Data are presented by
Gris singe:t; _ and Asmussen [ 15 J on the effects o f the quantity o f water .··,I'
within the ,soil and the length of time the soi l sample has been at a
given wate.r content before testing. The results show tha t the rate
of erosion .decreases with wet age at the time o f he test, b ut increases
w ith the time after erosion beg ins. Bergt_ager and Ladd [16) conclude
that previous investigator s had not adeq ua tely controlled the engi-
neering pr operties of the clays be ing eroded and tha t relative soil
properties were not measured. They discus s drawbacks regardin g
the concept of the c r itical tractive for c e and stress the importance of
clay fabr ic a n d inner particle forces.
19
FIELD OBS ERV A TIO NS IN NATURAL CHANNELS
Generally, e rosion or depos iHon o c curring in a natural water
channel depends on the local f o r c es exe r t ed by the flowing water, the
geology a n d properties o f the mate:dal over which the water flows , and
on the sediment l oad being transpor ted. Seasonal changes may occur,
and lo c al s cour o r depos i tion may res ult d u e to man - made o r natural
structures.
Sediment Load
The impo rtanc e of sed iment l oa d in influencin g the c haracter
istics of natural streams has been re c ogni zed by most researchers.
Cons i derable stu dy has b een conduc t e d to establ i sh sed iment erodibility
and predict sediment loads. Anders on [ 17 , 18] obtaine d da ta from 14
watersheds on the west s i de of the C oas t Ran ge in S outhe r n California.
From regress ion a n aly s i s he found tha t the sed iment y ields of water
sheds depend on the wat ershed c h a racte r i s tic s , lan d u s e a n d c ondition,
and the nature of storms and streamflow. Results o f A n derson's
analysis were pr e sen ted b y fiv e equ a tio:ns , which are summarized in
Table 2. Correlati on co effici e n ts f o r th ese equ ati on s v ary from
about O. 85 to O. 89.
20

TABLE 2
EQUATIONS RELATING PHYSI CAL CHARACTERIS TICS OF SOI L AND COVER DENSIT Y TO EROSI ON
{after ANDERSON [ 17 ])
Equation
Log Eg == 3. 07 3 - 2. 430 log C + 3. 427 log Dr
Log Eg = 4. 786 - 2. 486 log C + 2. 47 3 log ER
Log E 8 = 11. 461 - 2. 524 iog C + 2. 189 log S - 3. 288 log ( s i + cl ) .
Log Eg = 2. 1 27 - 2. 341 log C + 3. 861 log Dr + 1. 3 53 log Coll
ME
Log Es :: 10. 279 - L 78 8 l og C + 1. 151 log S - 3 . 164 l o g C o ll
C o rrelation c oefficient
. 888
. 878
. 849
• 890
. 854
ln Table 2 , Eg i s t he a v erage suspended sediment c ontent o f stream flow
in ppm; C, the average cover d ensity on wa tershed in per cent; Dr , the
d i spers i on ratio; ER, th e e r o s ion ratio; S , the s u spens ion; ( s i + cl}, the
u ltimate silt plus cla y; C oll , the c olloid , a n d ME, the m o i sture equivalent.
Z e rni al and Laur s en [ 19 ] u sed an e mpirical for m ula to p re d ict
the sed im ent load from five western str eams for compar ison w i th field
m easurement data collected fr om the streams by the U. S. G eologic al
Survey. The f o rmula u s ed for the pr ediction was:
21

7/6
( I
T Q
T C
. in which c is the mean sed iment concent r ation, in percentage by weight;
Pa is the fraction of the bed ma te r ial having a mean particle s ize d in
I
feet ; y O is the d e pth of fl ow in feet. TO
des cribe s that part of the total
tractive force asso ciated w ith the sediment particle s ; T refers t o the C
c ritical tractive fo rce , in pounds p er square foot , a n d i s evaluated for
each fraction , Pd• as equal to 4 d; TO
i s the tractive force acting on the
bed , i n pounds per s quare foot , a n d i s evaluated as equal to Yw y 0 S
where Sis taken as the s lop e of the water s u rface ass u m ing uniform
flow; Y w is the spe cifi c we ight of wate r ; p i s the density of water ; and
w denotes the fa ll v eloci ty, in feet per second of a quar tz s phe re of
d iame ter d.
Some of the pr edic ted and meas u red values were in good ag ree-
ment, in Figu re 8 , b u t several c ases ind icated s o m e va riation, F igure
9. The var iability o f the load - dis charge c ha r a cteristic s was assessed ,
and the effects of cha nges in channel instab ility, temperature a n d bed -
mater ial fo r the five s tr earns were pr e s ented. Table s 3, 4 and 5
22
(8)

... Cl C
LL
GI C'I
" -C Cl u ... Cl a..
100
80
J
I 60
40
30 -10
d(min v-., - ,/
~ ~ t:,,,
V V d(min / ,, /
I / V ~! I I I
/ / if d(max) id(max)
I I ~ . I
I I J I -- -Measured Ii' I --Predicted
I
I (a) Section C2 ( b) Se c t ion C I I I
I -10 Mean Particle Diameter, mm
FIG. 8. PREDICTED AND MEASURED COMPOSITION OF SUSPENDED LOAD ON MIDDLE LOUP RIVER. (after Zernial and LaursenCl9J)
100 d(mln) ~~ d(m~ r ., -
/. ....
/
I/ ,1 ;,,. /
~
) ff d(max} I I ,
'/ d(max)
... 80 Cl C
iZ
/ ~ t/ Cl Cl
" 60 - ---Measured C ., ' -Predicted u ...
I Cl Q.
40 (a) Sho1hon i { b) Riverton
I I I
-10 -10 30
Mean Particle Diameter, mm
FIG. 9. PREDICTED AND MEASURED COMPOSITION OF SUSPENDED LOAD ON FIVEMILE CREEK. ( after Zernial and Laursen Cl9J)
23

s h ow these effects. It was concluded that the sediment load is a unique
function of the flow, fluid, and bed material characteristics and that
the watershed and stream characte r istics can be used to evaluate the
sediment yield.
Shapes of Natural Channels
Schumm [20, 21, 22] collected data at over 40 cross sections
located near Geological Survey gag ing stati ons throughout the Western
United States. The channel s were considered stable and info rmation
collected included: channel width (b), maximum channel depth (y}, mean
annual dis charge (Q), mean annual flood or the total dis charge with a /
recurrenc-e interval of 2. 33 years (Qb), and percent silt-clay in the
bed (Sc) and the banks (Sb). Fro m thi s information, a width - depth ratio
(F) and the' percent silt-clay in the per imeter of the channel (M) was
calculated. M was calculated as:
M = (Sc) (b) + (Sb) (2y)
b + 2y
{9)
Streams from which the data were collected varied in width-
depth ratio from about 2. 5 to '138, in per cent per imeter silt-clay
from about 1. 4 to 89 , and in m ean annual dis charge from about 5. 8
to 5,200 cfs.
24

TABLE 3. EFFECTS OF CHANNEL INSTABILITY
(after ZERNIAL AND LAURSEN [9 ]) I
I Approximate effects on Os, in percentage
-
( ) 7/6 I (VT: Change d -2.lL Loca t ion - 1 £
in Yo Yo C
I Middle Loup,
+10 -1 0 -25 +12 Section C
Middle Loup, +24
Section c 2 -22 -55 +22
Fivemile-+55 -40 -70 +55
Shoshoni
Fivemile-Riverton
+27 -24 -55 +29
Rio Grande-+20
Bernalillo -19 -34 +21
PJ Total
effects
-23
- 57
- 7 2
-56
-35
.-
N lJ1

'
I I I
TABLE 4. EFFECTS OF TEMPERATURE CHANGES
(after ZERNIAL AND LAURSEN [9 ])
Change in percentage
f ( Location
Change in Change -) To/ e temperature in w w
M i ddle Loup, - 54 -42 +236
Section C
Middle Loup, Section c 2
-54 -38 +190
Fivemile--59
-43a +230 Shoshoni -50b +110
Fivemile --58
-46a +294 Riverton _55b +135
Rio Grande--24
-17a + 51 Bernalillo _25b + 88
aMaximum probable size of bed material. bMinimum probable size of bed material.
)

TABLE 5. EFFECTS OF BED- MATERIAL VARIATIONS
(after ZERNIAL AND LAURSEN [9 ])
Approximate effects on Qs , in percentage
( y: )716 I 1(9 Location
Change Change ...2:.._Q_ - 1 in d in w T
C
M i ddle Loup, - 13 - 24
Se c tion C +13 -13 + 84
Middle Loup, I I -49 -68 +59 -30 +1160
Section c 2 I
Fivemile-- 49 - 71 +59 -29 +1400
Shoshoni
F ivemile--33 - 52
R iverton +39 -23 + 415
Rio Grande-- 49 -65
Bernalillo +59 -24 + 490
Total effec ts
+ 84
+1300
+1600
+ 450
+ 610
I
!
N --.J

Analyses of the data indicated that the mean annual flood and
the weighted mean percent silt-clay are most significantly related to
the width and a multiple correlation analysis yielde_d the equation,
b = Qb o. 45
5.76 ____ _ ( 10}
MO. 36
for the channel width.
Neither mean annual d i scharge nor the mean annual flood was
found to significantly affect the width-depth ratio. A regress ion line
was determined graphically for the data in Figure 10, resulting in the
equation:
F = 255M-1.0S ( 11}
for the wid,,th - depth ratio.
Effects of Structures
Frequently the upsetting of natural conditions by man causes
a cohesive channel to change its shape, erode, or deg r ad e. Often
comprehensive plans and manmade struc tures are necessary to alleviate
this problem, Miller and Borland [23] reported on a study and stabi
lization program on Fivemile and Muddy Creeks in central Wyoming.
Due to manmade changes, the d i scharge had increased from less than
5 ,000 acre -fee t to over 90 , 000 acre - feet on Fivemile Cre e k and over
28

•
600.0
100.0
LL
0 -0 a:: .s;;; -0. Cl)
C) I
.s;;; -,:, j
10.0
1.0 0.1
"" ' "'
~
'
" ", "\ • •
" ' . . , " J\..
'~ • • • • • '""' • • '
"' . • • ~ • • • ~, • • •• • . • " . ...
~ • • . V
. ' .. .. ' I\. • •
. " ~
~
1.0 10.0
Weiohted Mean Percent Silt-Clay (M)
F1G.IO WIDTH-DEPTH RATIO VS. MEAN PERCENT SILT-CLAY. (after Schumm C22J)
29
"I
~~ I'
100

20,000 acre-feet on Muddy Creek in a period of about 25 years. Due to
the increase in flow, erosion had greatly accelerated, and the streams
were contributing over 50 percent of the sediment being deposited in
Boysen Reservoir. A detailed field investigation was undertaken to
collect geologic, hydrologic and hydraulic data. Using the data collected,
control measures, including wooden and concrete jacks, groins and
jetties and vegetation, were designed. These measures proved successful
and resulted in a stabilized channel and a ninety percent reduction of
sediment inflow into Boysen Reservoir.
Woolheiser and Miller [24] present the results of a study of
channel eras ion above and below gully control structures, This study
was intended to do c ument present and past conditions a n d experiences
at several gully control structures in order to provide data which
would aid in the design of these structures. The study concentrated
primarily on the scour hole development at the principle spillway
outlet and changes in the channel bed profile downstream from the
structure along the line of maximum depth of flow in the stream,
Climate and Temperature Effec ts
Wallis and Willen [25] obtained O to 6-inch samples of soil from
2 58 locations in northern California ' s mountain lands. A part of their
30

analyses included relating clima tic parameters to textural and erodibility
measures of the soil. Although correlation was not highly significant,
they found from regression analysis that for the soils, a pr e d icition of
total clay (clayce> could be made , bas ed on the climate, from the equation:
clay ce = O. 343 + 0. 06201 (P) + O. 4213 (Kw)
0. 05764 (KwP ) - 0. 0003761 (P )2 ( 12)
O. 0002589 ( Kw )2 + 0. 0001781 (KwP) 2
in which P is the m ean annual precip itation in inches and Kw is the d is -
sociation constant of water summed for 12 m onths by using the mean
monthly temperature s calcula ted for each site.
I t was found that for the m ountain soils the surface aggregation
ratio (S/ A ), which expresses the amount of surface area of the particles
greater than sand size relative to the amount of aggregated s ilt and clay
that i s availabl e for aggrega te formation, was an effe ctive m easure of
the soil erodibility. Predictions o f the surface aggregation ra tio were
made from the c limate variables as :
S/ A = 322. 6 - 6. 39 (P) - 7. 52 (Kw ) + 2. 42 (KwP) +
0. 0404 {P) 2 + 0, 0553 (Kw)2
- O. 00693 (KwP )2 ( 13)
Wolman [26] found sev ere erosion in winter months when bankfull
31

flow attacked channel banks that were previously wet. He also noted
significant erosion from combinations of cold per i ods, wet banks,
frost action, and rises in stage, and that crystallization of ice and fre
quent thawing without a change of stage also produced some erosion.
Predicting Eros ion or Deposition
In a study on channel deter i oration of natural and artificial
drainageways 'in Nebraska and Iowa, Schroeder [27 J classified 121
test reaches as being (1) stable, {2) fairly stable or questionable,
and (3) deteriorating channels. Using the mean annual peak discharge
and stage-discharge relationships, the depth was obtained and tractive
forces were computed from:
{ 14)
where k is a variable dependent on the bed-depth ratio and the side
slope of the c hannel, y w the specific weight of water, y 0 the depth of
water in the channel, and S is the slope of water surface or c anal bed.
The percent densi ty of vegetative cover was re co rded for the channels ,
and soil tests of the channel material were conducted.
Curves were developed , Figures 11 and 12, showing limiting
tractive forces for the bed and banks of the c hannels. Curves of
tractive force versus plastic index are shown for no yegetal cover
32

I. ... Percent Range
Doubtful - of Vegetative Stable Stable =tion Cover Scour Chamel Channel - 0-25 0- t ~ t -25-50 6 ~ -0
,... 6- 50-75 --0 -0 ---<> -r:'.
75-100 C/ 9 ~ 4 5= I.
-~ 0-
0-- Recommended Limit
I. C\I --........ en
., For 100% Vegetation - I 0 . -- ·- >-- - . ~
V -
' -0-
.0 ~
~ • 0 I. ~
0 LL
~ r----r-- 0-0 r-- 9
0-r-- f-Q=.. ~ q - -• >
0- --r-- Transition Zone r-- ,_ --0 ~ )-
,_ ' -0
0 ~
I-
~ r-- -0 ~-~--- ---- _'1.__ - ~ , ( ;----7 J ,._ ,;--- " Recommenaec Limit 9
-0
... _ -;- For No Vegetation -- -
0-9 <) ( >- 0 ~ -.. i- - : ~ · i9 i-
h A-~ ... -...... ....... ,'
<>- Depositional Lint ·t ------ ;, _ ....
tr --z ... ~--6 >-4
1-0 ... ~ Allowable Limit Wet - ; )- 0-
-1'l ,.. -Channel Desian 0- <>-' -c ,-
I I - - I 9 ... - -.:'. I 0-~ - ... - ,,.....1 i-o- 0 - ,J,. - 0-
/ '/ / 0 i7~ K.; '"" Recommended Wtt 0-
/ ~ 77 -:, -, )- Channel DeslQn ~ .I -, / , , , , , , ,
"4 38 32 26 20 · 14 8 2 0 .03 • D .20 .3 0 Plastic Index Mean Grain Size, mm
N-0n Plastic FIG.I I LIMITING BED TRACTIVE FORCES FOR EPHEMERAL CHANNELS
(after Schroeder (27J)

1.9
1.7
N \,3 --' tn _g
~ ., u ... 0
LL .9 -~· -u C ... ~
.5
., 5
Percent Ran9e 0-
of Ve9etativ1 ~r~ Cover Sccu t
0-25 r 0- t t 25-50 6 50-75 ~ -0 --<> -a:\
75-100 ? ? ? 'r J.
)-
-~ - t--. Recommended Llmlt i-- 0 t-- t--. For 100 °/. Vet eta ion -~
~
I'-.. ~ ,-
r-,...__ -..._
r--,..... Reconvnended L1m1t 1,.. F'~r I o ''eg,1tn Inn -0
............ \ 0 'I' r--,......._ I - ) ') I I 0-
i"-l 0- 6 I r--,.....- "" I>-
~ ........... -?9 (~ i .. ~~~i!~~"--~ f~! 0:' ~ r---,..... -0 :>
I 9 r--... ... ,.., I - 0~
~- Sand bed I'? ()-~ ' 9 "\.. - 9 I)-<> 6~ 1\...-0 " I~
" " 1'·· Sand bed A lowoble L1m1t For y -n ~ ,)-¢-' ' Wet Channel Desian -~ ' - ... _ 9 .,~ tr - : µ-
'P - t-- ; 0 - -
/ i~ v/ ~ ~ ~ t7, ... ) ... ) 9 1 9 P- "" ' Rtcommendet wet
/ I'°/ 17" ;' .._ .... \ ~ Channel DHian , , , , , , , , ,
0 46 42 38 34 30 26 22 18 14 10 6 2 0.03 .06 .15 Plastic Index
FIG.12 Limitino Bank Tractive ForcH For Ephemeral Channels (after Schroeder C 27J}
Mean Grain Size, mm Non Plastic
0-0-
J"\ -s
.3 0

and 100 percent vegetal cover. Although there is a wide scatter of
points, these curves may be used as a guide for predicting conditions
of eras ion or d e position. Whe r e banks are flatter than a 5 to 1 slope
they should be consider e d essentially the same as a bed condition,
and where channels ar e quite sinuous , vegetation should not be con-
sidered a limiting factor. Th e wet channel design limits shown on ,t'
Figures 11 and 12 were obtained from limited data and, therefore ,
were not advocated for use in des ign.
Hjulstrom [28] has pres e nted a curve relating grain size and
erosion velocity from stu dies of the River Fyr i s. Much of the infor-
mation available for designed channels is also of considerable benefit
in predicting erosion conditions of a natural stream.
DESIGN OF NON - ERODING CHANNELS
Observations and Tests
Observations, tes ts, and data c olle ction have been conducted
on sever al canal syste ms with the objectives of developing satisfac tory
design methods. The U. S. Bureau of Reclama tion observed and tested
46 channel test reaches located throughout the Western United States
[ 4 , 29 , 30 , 31 , 32]. The cana l s and laterals had been in operation for
35

a number of years a n d discharges varied from 2 to 3,000 cfs. F i eld
data were obtained on both the hydraulic s and soils , and several soil
samples were obta ine d from each tes t site. Both s oil s and hydraulic
tests were conducted on the samples obta ined from the test reaches.
An electronic dig i tal compu ter was use d to inve stigate ab out 40 da t a
correlations from the reaches. These correlations were reported by
Carlson and Enger [ 4]. Correla ti on coefficients for the data corre
lations varied from "imaginary" to greater than O. 9. Thomas and
Enger [32] reported a c orrelation from this da t a which gave sati sfactory
results within certain limits . Their equation i s presented as equation ( 18)
in the following se ction, Design Information Ava i labl e.
Simon s and Alberts on [ 33] have u sed info rmation c ollected fr om
field observations to develop design crite r i a. The d e s ign information
developed also i s repor te d in the se ction, Des ign Info rmation A v a ilable.
Flaxman [3 4 ] conduc ted field ob s ervations along exi sting channels ,
and obtaine d soil samples from the c hannels for laboratory analysis. He
concluded that the un c onfined compress ive strength of soils i s a good
ind ica tor of erosion p o tentia l , and 11 that s oils of low strength are easily
susceptible to erosion in c han n el flow while those of h igh strength resist
hydraulic stresses of cons iderable magnitude. "
36
Des ign Information A vailable
In 1926 , Fortier and S cob ey [ 3 5] pr e sente d the final report of
the Special Committee on Irrig ation Hydraulics on Permi ss ible Canal
Velocities. The Special Commi ttee had submitted q uestionnar ie s to
a number of engineers who se exper i enc e qualified them to make esti-
mates of the maximum m ean velocities allowable in c a nal s o f various
materials. Constructive replies a n d suggestions were received from
10 engineers. From this a n d oth er available mater ial, the values in
Table 6 wer e re commend ed as maxim u m p erm is s ible mean ve l ocities.
In an attempt to more adeq uately p re d ict channel behavior , two
other des ign the o r ies, the regime theory and the tractive - force the o ry,
have b een studied. S imons and Albe rts on [33] have presented con
siderable information on des ign by the reg ime theory. Thi s theory
has evolved from the empirical equation of R. Go Kennedy:
V C m y
where C a n d m were thought of as c onstants, V represen t s the critical
mean veloci ty in feet per second for whic h no sil ting or s c ouring o f
the channel occurs, a n d y is the d epth in feet. The orig inal value
suggested for C was O. 84 , a nd for m, O. 640 Other values have been
37

TABLE 6
PERMISSIBLE CANAL VELO CITIES (after FORTIER AND SCOBEY [35))
Velocity in feet per se cond, after aging , of c anals c arrying:
Original material exc avated for c anal
Water transporting . Clear water ,
no detritus
( 1)
F ine sand (non-colloidal) ,, ..............• :
Sandy l oam (non -c olloidal} ............. . .. :
Silt l o am (non - colloidal) ......... . ........ :
Alluvial silts when non - colloidal ....... . .. .
O rdinary f i rm loam . , . , .. , ..... , , . . . . . . • . .
Volcanic ash .......•.......•..... • .......
Fine gravel. . , ........•••................
Stiff clay (very colloi dal ) •• • ............•..
Graded loam to cobbles , when non - colloidal •
A lluvial silts when colloidal. • ....••......•.
G rade d silt to cobbles , when colloidal. .... .
Coarse gravel (non-c olloidal ) .............. :
Cobbles and shingles ...................... :
Shales and hard - p ans •....•....•.......... :
(2 )
1. 50
1. 7 5
2. 00
2. 00
2. 50
2. 50
2. 50
3. 7 5
3.75
3. 7 5
4. 00
4. 00
5. 00
6. 00
Water trans - non -colloidal silts , porting
,colloidal silts (3 )
2. 50
2. 50
3.00
3. 50
3. 50
3. 50
5. 00
5. 00
5. 00
5. 00
5. 50
6. 00
5. 50
6. 00
sands , gravels , or rock fragments
(4 )
1. 50
2.00
2. 00
2. 00
2, 25
2. 00
3. 7 5
3. 00
5, 00
3. 00
5. 00
6. 50
6. 50
5. 00

suggested for these constants.
Using data obtained from canals in India and the Western
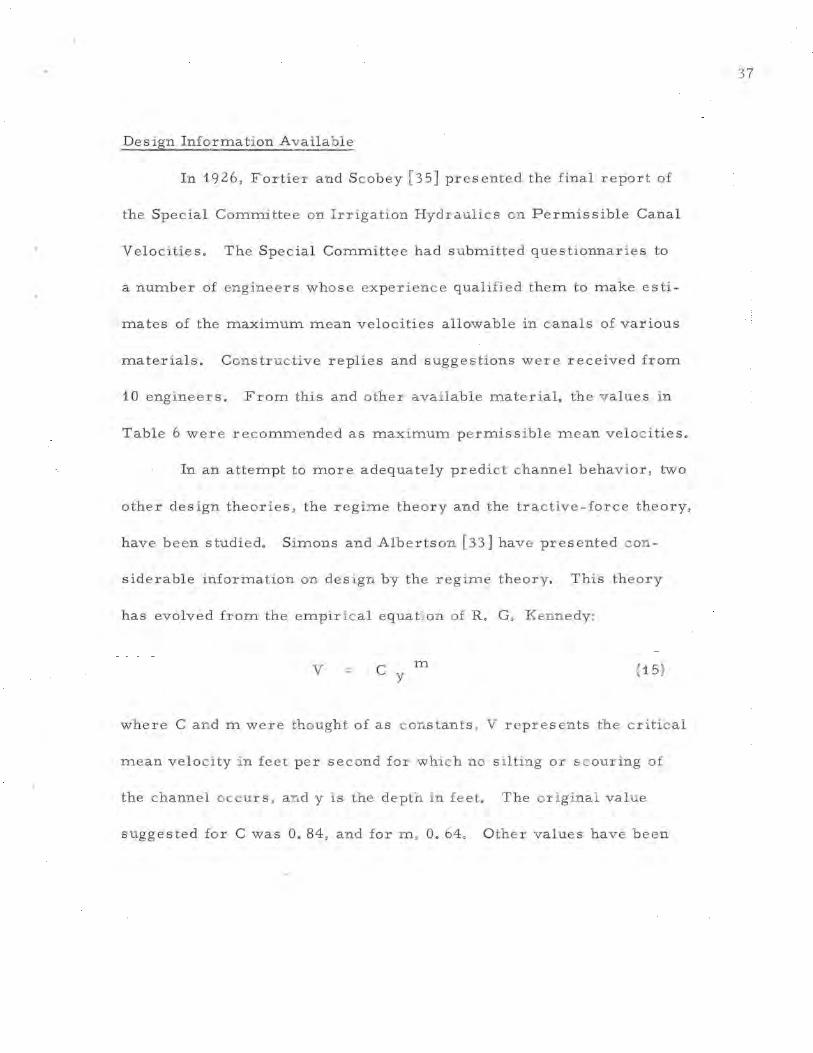
United States , Simons and Albertson [ 33] presented several plots
to aid in the design of canals. Reproductions of several of these
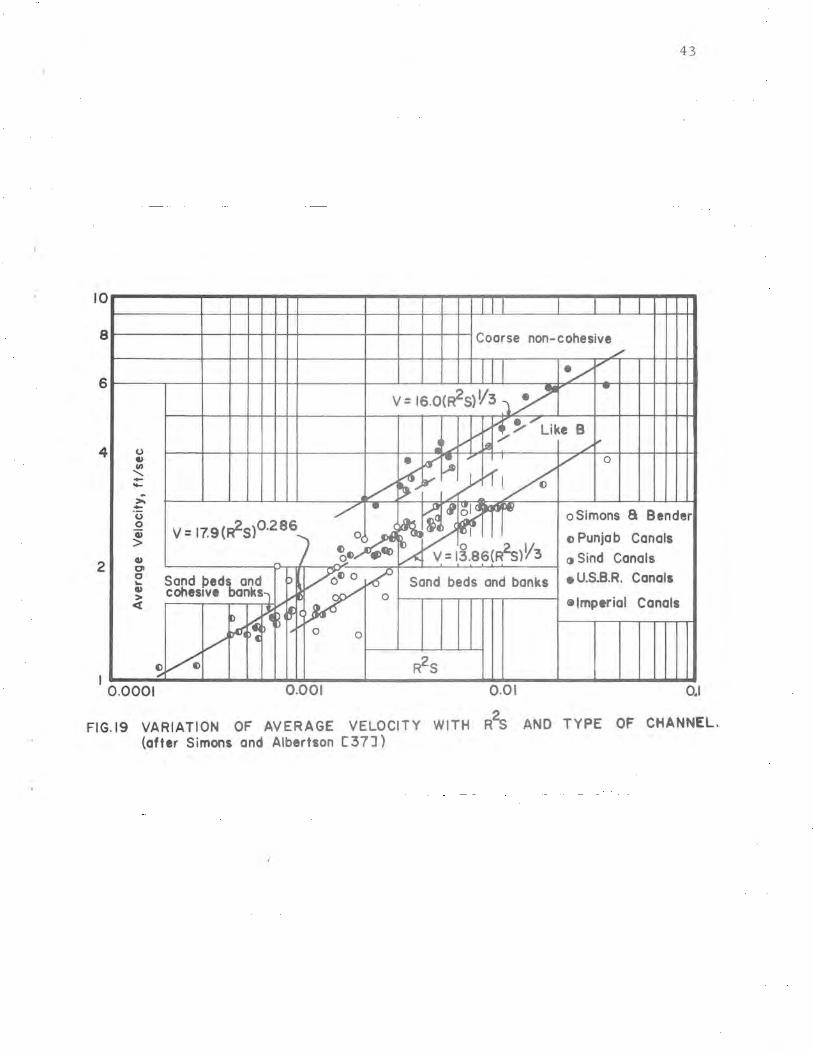
plots are presented i n Figures 13 through 19.
The curves shown in Figure 13 provide a means of estimating
the wetted perimeter for a given dis charge. After the wetted per -
imeter has been found , the average channel width may be determined
from Figure 14, and the top w i dth from Figure 15. For the given
/
disch~rge, , the hydraulic radius may be found directly from the curves
of Figure 16, and as the hydraulic radius and depth are closely related,
the aver~'.ge depth may be determined from Figure 17.
The required cross - sectional area may be determined from the
curves in Figure 18 , and knowing the d i scharge and area , an average
velocity 'may be determined, Us ing the average velocity, a value of
R 2S may' be estimated from the curves of Figur e 19, and utilizing the
hydraulic· radius found from 'F igure 16, the slope may be evaluated.
Utiliz ing this method , Simons and Albertson stated that canals
in the four following groups c ould be designed :
1. Canals formed in coarse non - cohes ive mater ial (charge < 500 ppm)
39
100
10
250
200
150
100
50
0 0
40
A Sand bed and banks
B Sand bed and p = 2.51 Q Q.512 -~ ~~ cohesive banks I,,
-,_ .;,,,, - C Cohesive bed - ~· .v .. and banks ~ fj ... ~E
~
D Coarse non- / • . ........ - cohesive material • ... E - ,,._ -E Imperial Doto r.. .... ~ _., --~ c/ - 10 )~ • like B
Q. Okd": L~ ~ y ".: -::Joi~ A~ ,,; ........ ., !a,:>1P• I
~ • 8~ L.....-rl' 8 I I I --• 12,i. ~/ 3t _. ' L..,,,L, L, o Simon 8 Bender
l) ~ ...... r'1).
0 Punjab
~ 6 i...rl Canals
<t Sind Canals A .... • U.S.B.R. Canals . -
...... • Imperial Canals ..
--.. .c 'C 3t
• 0 g ~ • > Cl
JT'(n . -
,o FIG.13
Al RO
.... 1Q
DischarQe, ch
100 1000 10000
VARIATION OF WETTED PERIMETER WITH DISCHARGE AND TYPE OF CHANNEL. (after Simons and Albertson C 37J)
~
....... ~.,
L
----.:;,, / ,_
/ -I/
~ ........ -
V 1W'
- V Simons a Bender o r
Sind Canals c, ... v ~"" - Imperial Canals 0 ....... .... ,.
/
.L A -
- V,
Dfa K, ;Qj "(.)
Wetted Perimeter. ft
50 100 150 200 250 300
FIG.14 VARIATION OF AVERAGE WIDTH WITH WETTED PERIMETER. (after Simons and Albertson C37J)

240
200
160
120
80
40
0
20
10
1.0 0.8
0.6
0.4
0.2
--.. .t:: .. ,, ·-~
• 0 C ... ., > ct
~
I. ,<
_rin . 20
A B -- C ..
• D ~
E " C a:: (.)
-~
C ... ,, >,
::c
41
(l I,"
.,,, .... ./
./
/
W=0.92Wt-2.0 / I/
V
- l,11" Ve>
V ....... oSimons a Bender ......
., .... e Punjab Canals
./
/ '-
/ V
/ /
,,cJ
..cl.Al _. .,..., ~ " ~·
Top Width, ft
60 100 140 180 · 220 260
FIG.15 VARIATION OF AVERAGE WIDTH WITH TOP WIDTH.
(ofter Simons and Albertson C 37])
Cohesive bed and banks R=0.4 30o.361 Sand bed and cohHive banks
Sand bed and banks ·-non-cohesive materials
n Coarse ·~ Imperial Data Like B - -- E -
l'l'O ~ ..
.... ~ ,__...-- - --1>' Ill~ 11.J - ....-- ... --~~ 7 .,:. $~
....... __........... -- -... ic.. "I)()~ i.,..--. & -.r. ... R= 0.247Q0.:36 I l...-4 ~~ ~ ' ,.., C -~ '8 ::; ( b -.--. r-1,..,,-"'i 8
300
It .. L,..,
~ ~ """'~ LJ ~ o Simons Bender
~ ~
e> Punjab Canals - - • -- <» Sind Cana Is ~
• U.S.B. R . Canals • ~ Imperial Canals
Discharge, c fs
4 10 100 1000 lOOOO
FIG.16 VARIATION OF HYDRAULIC RADIUS WITH DISCHARGE AND TYPE OF CHANNEL, ALL DATA·. (after Simons and Albertson C37J)

12
10
--8 .. "' .:! ~ 0 a::
6 u -:, 0 ... ~ >.
4 J:
2
N -1000 -~ 8 ·--u Cl)
en en "' . o ... u
100 ... CD -0 3 -0
0 CD ... <t
10
42
/ 'f /
(I.J ,,/ I (J
, ov
II. /
i.,,/'iP /
p ("\/
j5JJ u, Simons a Bender o lo~ 0 -8 /
// Sind Canals<»
Imperial Canalse
r/~
V :> e
)P 0
-~ oS 0
/ v"" CD p
Average Bed Depth, ft
2 4 6 8 10 12 14 FIG. 17 VARIATION OF HYDRAULIC RADIUS WITH DEPTH.
(after Simons and Albertson C37J )
I I ~ ~
I I I I I I I J
lJ lf A= l.076Q0,873 < i.,"" .... I
, Sand or cohesive bed -· ,
"'
15
and cohesive banks Coarse non-cohesive - --/
/ ~"' (t(~
~ ;wi
, Sand bed and banks ' "' ~" lA = 0.45Q0.873 ~14 r«. / -,.,
I I
~ " , -., .. o Simons a Bender u •/
/
-~ ..... o Punjab Canals ~.)
J ,_ ~/
<J$ind Canals let' v"'
~ • Cana ls / •U.S. B.R. /
I i.,,
/ ®Imperial Cana ls
• 'II" , / ,, Discharge, cfs I
10 100 IOOO 10000
FIG. 18 VARIATION OF AREA OF WATER CROSS-SECTION WITH DI SCHARGE AND TYPE OF CHANNEL. { after Simons and Albertson C 37J)
10
8
6
4
2
I
(.) Q> en
' --.;. -(.)
0 "ii > Q> O'I 0 ... Q> > ct
0.0001
43
Coarse non-cohesive / '
./ V
v = 1s.ocR2s> V3 1 ,Y •
/
.,,,..,,. ~-"., Like B I .SI /, . ~
• If'.. • I / 0
( t" ~)""_1' 1/o l/ /. ~g~
~ oSimons a Bender
V = 17.9(R2s)0.286 ~I
I
~e°j4: c Punjab Canals
- 0 V= l~.86{~)V3 c, Sind Canals - .,. /o~Of Sand beds and I:> Sand beds and banks • U.S.B.R. Canals
cohesive banks,
ic~
0 ),
I) ~>. ~·' Gt Imperial Canals
... vt,di~ C) ,,.
0 0
()~ R2S ,,,.
0.001 0.01 0.1
FIG.19 VARIATION OF AVERAGE VELOCITY WITH R2S AND TYPE OF CHANNEL.
(after Simons and Albertson C 37])

2. Canals formed in sandy material with sand beds and banks (charge < 500 ppm)
3. Canals possessing sand beds and slightly cohesive to cohesive banks (good results when charge < 500 ppm, qualitative results when charge > 500 ppm)
4. Canals having cohesive beds and banks (charge < 500 ppm).
A method of design by the tractive-force theory has been pre
sented by Doubt [36]. The method involves three phases: (1) a channel
is first designed to meet the capacity (maximum discharge) requiremenit,
(2) the channel is checked to determine if it meets the requirements for
stability, and (3) the economical proportions of the channel and its as -
s ociated structures are checked. When necessary, the original design
1s altered, thus resulting in a trial s elution.
The average unit frictional forces on the wetted perimeter
(which are equal to the average unit tractive forces but are oppositely
directed) are computed from;
( 16)
where f is the average unit frictional force in pounds per square foot,
'{ w the specific weight of water in pounds per cubic foot, R the actual
hydraulic radius in feet, and St is the rate of energy loss at the inter
face of the earth material and the flowing body of water, foot-pounds
per pound of water per foot of channel.
The value of St is computed from:
44

(1. 486) 2 A 2 R 4 / 3
where Q is the actual discharge in cubic feet per second; A the actual
flow area in square feet; and nt is the Manning's roughness - coefficient
for the earth material in the wetted perimeter (not to be confused with
Manning's coefficient n, which is usually larger than nt). Lane [37]
suggested the relationn = D75 1 / 6 /36, in which D75 is the size of
earth material in the wetted perimeter of which 7 5 percent is smaller
expressed in inches.
As the tractive forces are not distributed evenly around the
wetted perimeter of a channel, the maximum actual tractive force
is usually obtained from experimental data such as that also presented
by Lane [37], Figure 20.
Several methods have been suggested to determine the allowa -
ble tractive force, or the maximum tractive force that the channel
materials can safely withstand before erosion o c curs. Thomas and
Enger [32] found that, within given limits , the follow ing equation
provided satisfactory results for critical tractive force.
45
( 17)
I Tc = 0, 00124 + 0, 00081 PI + 0. 00030 Do/o + 0. 00022 Mcp o-;pkcp (18)

46
I. -....
Trapezoids SS = 2:1 a US:1-" I - I
""'
/ l.,...,--"'
/b
I /
.8 I
I I 0
<A >->,.. 0 ... ., u ... if • > :;:: o. u
I I
.6 J f-- Rectan9IH
4 I C ... ~
J
2 I I
o.
I
2 4 6 8 10
B/y Ratio
FIG. 20 MAXIMUM TRACTIVE FORCES IN TERMS OF yyS. ON BOTTOM OF CHANNELS. ( Lane C37J)

,,
where Tc is the critical tractive force in pounds per square foot, PI
the plasticity index, D% the in-place percent maximum soil density,
I and M<po-<pk<p is a description of soil gradation. The limits of equation
(18) are:
0 < PI < 22
65 < D % < 100
-12 < Mcpo-cj:,k' cp < 40
13 < LL < 42
in which LL is the liquid limit.
Dunn [3 ], Smerdon and Beasley [7] and Schroeder [27] have
also found the plasticity index to be a measure of the allowable tractive
force. However, to date, only empirical relations are a v ailable for
determining the allowable tractive force.
PROBLEMS OF AGRICULTURAL LAND AND CHANNELS
The problem of erosion of cohesive mater ials as related to agri -
cultural land can be d ivided into two general c atagories : The first per ;:.
tains to land erosion from rainfall and has historically be en viewed
from the point of view of the damage that erosion does to the produc-
tivity and value of agricultural la:p.d. Much less conce rn has been
47

focused on the ultimate disposal of the eroded sedimentso The second
eras ion category is related to design, operation and maintenance of
earthen water conveyance structures in agricultureo These include
field ditches and channels s ,uch as drainage ditches , farm irrigation
channels, terrace and diversion channels and i rrigation furrowso
Land Erosion
Erosion is generally thought of as a slow pro ce ss , but figures
representing the annual loss of soil are staggering. It is estimated
that, the annual rate of-soil loss for the Mississippi R iver Basin is
about 400 tons per square mile [38 ]. An annual rate as high as 97,740
tons per square mile was measured from a small watershed in western
Iowa. Each year one billion tons of suspended sediment are estimated
to be transported to the oceans from the United States. In addition,
vast qua1;1tities of eroded soil never reach the o c ean, but are depos ited
in the flood plains, in river c han nels, and in reservoi rs.
It is estimated that 380 million cub ic y ards of sediment are
dredged each year from the nation's harbors and waterways to keep
them clean [39]. The annual cost for this dredg ing is about $125
million. Reservoir capacity lost each year as a result of sedimentation
is difficult to determine accurately, but conservative estimates place
48
this loss at 1. 5 billion cubic yards. This amounts to an annual loss of
nearly one million acre-feet of reservo ir storage due to sedimentation- -
much of which i s ero ded soils from agricultural and forest lands.
In 1966 , Smith [40] reported that uncontrolled erosion in the
United States produced nearly 4 billi on tons of sediment e a c h year.
Considering the 19 55 estimate of one b i ll i on tons reaching the sea ,
then approximately 3 b i lli on tons of eroded material is deposited at
some point between the p oi nt where eros ion occurs a n d the sea, Smith
also reports that there is evidence that the pr inciple means of water
pollution from agricultural chemicals may be from erosion of cohesive
soils with the c h emicals adsorbed on the clay and organic fraction of
the soil.
The importance of erosion of c ohesive soil s from agr icultural
land i s obvious. Miuch rese,arc h has been a cc omplished b ut m uc h re
ma ins to be done if the erosion and res u ltant pollution fr o m ero ded
sediments are to be con trolled. Smith summarizes researc h on
eros ion of agricultural l and and sugg e?ts some pro m ising a pproaches
to erosion c::ontrol.
Erosion Loss Equati on. In 1961 , the Agr icultural Researc h
Service of .the USDA published a spe cial repor t entitled 11A Un iversal
Equ ation for Predicting Rainfall - Eros ion Losses 11 [41]. Thi s report
49

presented an empirical equation to predic t soil losses by erosion from
agricultural land derived from statisti c al analysis of erosion measure -
ments in the fie ld and under natural and simulated rainfall conditions.
The equation i s:
A ::: (RF ) (K) (LS ) ( C) ( PF} (19)
in which A is the average annual soil loss in tons per acre predicted
by the equation, RF the rainfall factor, K the soil erodibili ty factor,
LS the length and steepness of slope fac to r , C the c ropping and manage -,,
ment factor , and PF is the supporting c onservation practice factor
(te rracing , strip- crapping, contouring}.
'Phe rainfall factor, RF , in equation (19) was found to be de-
p endent dn two meas u rable rainfall characteristic s. One was the rain
fall energy which c ould be expressed in terms such as foot - tons per
acre-inch. Another index was rainfall intens i ty. The product of the
rainfall e:nergy times its maximum 30 minute intens i ty was found to
represent the rainfall in the erosion equation. This pr o duct was
called the rainfall erosion index. The rainfall erosion indic es have been
calculated for 181 l ocations in the Unite d States a n d were found to vary
as follows: Southeastern Sta tes, 142 to 779; Northeastern States, 62 to
220; and North Central States , 64 to 261.
50

The soil erodibility factor , K , is of primary importance in the
erosion of cohesive soils by rainfall. The factor was said to depend
on many soil chara c teristi cs. Values of this soil erodibil i ty fa c tor ,
which measures the relative erodibility o f soils, are being determined
for so-called "benchmark" soils where erosion losses have been mea -
sured. Wischmeier and Smith [ 42] have indicated that values of tp.e soil
erodibility factor range from O. 50 for soil high in silt content with a
weakly-formed and unstable struc ture , to 0. 10 or less for soils with a
high sand content and nearly permanent structural stabil i ty. Soil
erodibility factors average about O. 33 for silty loams and about O. 25 for
sandy loams. The higher soil erodibility factor ind icates a more
erosive soil.
The length and steepness of the slope fa c tor, LS , increases as
slope length increases or steepne ss of slope increases , but not at
uniform rat es. Increases in slope length of the fiel ds i s much m ore
critical where the s lope is great. The fa cto r , LS, can be estimated
by the empirical equation:
LS = O. 0177 (0. 4 3 + 0. 30S + O. 04 3S 2f'{£- (20)
in which f is the slope length in feet and S i s the predo m inent field
s lope expressed as percent [43 ].
51

The cropping management fa c to r, C , depends on s uc h man ageme nt
practices as crop rotations and the k inds of crops grown. S om e c rops
provide mor e p r otection against erosion than o thers. Fac t or s such as
seasonal d is tr ibuti'on of ra instorms , dates of plowing, se e d ing and
harvesting , residue managem ent pra c tice s , seedin g m ethods and tillage
procedures all m u st be known to c a lculate C .
The conservation practic es factor , PF , d e p ends on the conserva
t ion practice s us e d in fa r m ing. Such practice s as c ontou r farming and
str ip c r opping reduce the fa ctor , PF. Values of PF range from 0. 9 0
for contouring on steep slopes to 25 for contour str ip cropping on gentle
slopes [ 42], Terrace s , wh ile be ing a cons e rvation prac ti ce, are a ccounted
for by reducing the slope l e ng th fr om th at of the entire field to the hor i -
zontal d i stance between terraces.
The ·equation for es timating soil loss i s a valuabl e tool to d e
termine conservation p r a c t ices needed to con trol eros ion. Con serva tion
and manag e m ent p ractice s may be des ig n ed whic h will keep erosion to
a tolerable level , perhaps 1 to 5 ton s per a cr e per y ear. The e q uation
may also be us e d to estima te sed iment y i e ld although the a c tual sed imen t
yields from the fie ld may be m uch less than the calculated eros i on be
cause of depo sition in terra ce channels or at the b ottom of slop es.
The equati on for estimating s oil lo sses is constantly be ing re -
52

vised as additional erosion data are availa ble. But the method is quite
easily used and the procedure i s outlined and c urves and tables for the
various factors are presented in m o st Soil Conservation Service Hand
books and in a recent text by S chwa b, et, al. [ 4 3 ].
Soil Erodibility, In the 1930 1 s , researchers attempted to relate
soil erodibility to measurable physical characteristics of the soil.
Middleton [ 44] , in 19 30, found the <lispers ion ratio (a measure of the
stability of aggregates of cohe s iv e soils in water ) and what he called
the erosion ratio to be the mos t significant soil characteristic s influ
encing soil erodibility. His erosion ratio was the dispersion ratio
divided by the rati o of the total weight of silt and clay sized aggregates
in the nondispersed sample to the total we ight of silt a nd clay in the
dispersed sample. Middleton a l so s uggested that organic matter , the
silica -se squioxide rati o , and the total exc hangeable bases influ enced
the erodibility of soi ls. M i ddleton et, al. [45 , 46] group e d soil s fr o m
the ten or ig inal USDA er o sion sta tions a ccording to the above c riteria,
Lutz [4 7] in 1934, Yoder [ 48] in 193 6 , Peele [49 ] in 1937 , and
Peele et, al. [ 50 J in 1945, als o investigated aggregate stabil ity and
other soil properties including th e cla y in the so il and found them to
be related to s oil eros i on,
In more recent i nvestigations , Anderson [ 17 , 51] found M i ddleton's
53

..
dispersion ratio to be statistically signifi c ant in soil eros i on. Ander-
son [ 51] and Andre and Anders on [ 52] also defined the surface-aggre
gation ratio as a nothe r useful erosion index, Wallis a n d Stevan [53]
have shown these erosion indexes to be related to the c ation e·xchange
capacity of the soil and found calcium and magnesiu m to be particular
ly important.
In flumes or other special apparatus t o s imulate eros ion for c es
where cohesive soils wer e used, investigators have d e t e rmined that
many s oil properties are statistic ally correlated w i th erosion re
sistance of cohesive soils [11 , 7, 14 , 54, 55, 56]. Yet these tests have
all been run with disturbed soils and do not give information which can
readily be used in design. Thi s is exemplifie d by the fact that no de -
sign procedures for water c onveya nce structures c onsider all the indi
vidual soil properties whic h have been suggested from pas t research.
Most often the designs c onsider only the soil t exture o r a single mea
sure of the strength of c ohe s ive for c es suc h as the p lasticity ind ex
or the dispe rsion rati o. The se meas u res do , however , ass i st in making
estimates of the relative er od ibility of soils .
Scour in Agr icu ltural Channels
Most often the flow in agricultural c hannels 1s inte rmittent and
54

'
relatively shallow. The channel bed may have a vegetative covering
or may be tilled leaving the physical condition of the bed in different
states of erodibility at the time of a potential erosion producing event.
Stable channel design is qui te critical in these channels , but
the defin ition of channels s t ab l e aga inst scour may be slightly different
for an intermittently flowing channel than for one flowing continuously.
Sometimes low rates of scour during short periods of peak flow may
have the effect of cleaning sediments depos i ted in the channel during
low flow per i ods, Nonetheless , reasonable design criteria are needed
and some suggested procedures from the literature are given.
Design of Farm Drain Ditches and Terrace Channels I
Most farm drain ditches are designed on the basis of limiting
velocity. Typical suggested values are [ 57]:
Stiff clay s o ils - 4 feet per se c ond
Sandy loam soi ls 2. 5 feet per secon d
F ine sandy soils 1. 5 feet per se c ond
Published data on allowable tra c tive for c es in cohesive soil have
not been used to any extent in the design o f farm drains. However, the
use of tractive force data (or depth- slope produc t ) for the design of
dra in d i t c hes which are stable again st s cour has been suggested [58].
55

The suggested procedure considers that some shallow farm drain ditches
are cultivated, and this leaves the soil in a more erodible state. The
suggested des ign curves are shown in Figure 21. The product of depth
of flow and slope of the ditch should not exceed the values giv en. These
results can be converted to critical tra c tive force values by multiplying
the (y) (S) values by the specific weight of water.
Channel type terrace design i s generally based on limiting
velocities with values being about 1. 5 feet per second for erosive soils
and 2. 0 feet per second for most soils and 2. 5 feet per second for soils
with high organic content [59]. Using tractive forc e data, McCool and
Beasley [60] have presented a method for the design of channel type
terraces considering the spatially varied flow in the channel. The left
curve in Figure 21 , where the c hannel bot tom i s cultivated, could like
ly be used for the design of chann e l type terrac es .
. Design of Farm Irrigation Sy stems
Most surface irr igation systems are des igne d on the bas i s of
experience with similar soils as far as e ros ion is c once rned. In 1946 ,
data were presented by Gardne r , et. a l. [61] on c r i tic al fu rrow stream
56

40
30
,c ., 20 "'O
C
>, -u +-.,, C
n: 10
8
6
Relative Erosiveness of Soil
Erosion Resistant ·+ Moderately
Erosion Resistant
+ Erosive
+ Very Erosive
0.001 0.002 0.003
DX S, ft
0.006 0.01
FIG.21 DEPTH X SLOPE OF DITCH VS. PLASTICITY INDEX.
0.015
u-, --.J

sizes for different furrow slopes, The curves do not take into account
the relative erodibility of the soil. A rule - of - thumb suggested to de-
termine the maximum n onerosive furrow stream discharge in gallons
per minute i s 0. 10 divided by the furrow slope in feet/ feet [ 62 ]. For
border strips the maximum allowable noneros ive stream is suggested
as Q = 0, 0019 s - O, 7 5 where Q i s in cubic feet per second per foot of
border width and S is border strip slope in feet/ feet [ 6 3 ], Again, vari-
ations in soil e rodibility are not considered in the se gui delines.
Assuming Chezy' s equation c an be used to determine the rate
of flow in a furrow , then Q = CA V RS. If the channel is broad and
shallow, the hydraulic radius , R, is approximately equal to the depth
of flow, y. Therefore , the stream size, Q , is proportional to y 3 / 2 s1 / 2 .
The Soil Conservation Service rule-of- thumb for maximum furrow
stream s i ze converted from gallons per m inute to c ub i c feet per second
is:
0. 10 = 0 , 00023/S 449S
Us ing the Chezy equation for w i de shallow channel s
( 21 )
(22 )
in whi c h K1 is a c onstant representing the produc t of the Chezy C and
58

59
A / D, Equating equations (21) and (22) to determine the relationshi p of
y and S for the maximum noneros ive str e am in i rrigation furrows gives :
0. 0002 3/S = K1 y 3 / 2 s 112 (23)
or
Y3/ 2 8 3 / 2 = 0.00023 = K2 ( 24)
and
yS = (K2)2/3 = K3 ( 2 5)
in whi ch K2 and K3 are also c onstan ts. Therefore, the maximum non -
erosive stream occurs for some c onstant valu e of the pro d u ct y and S,
In other words , the r e is a maxi mum valu e of tra c t iv e f o r c e for non -
erosive irr i gat i on fu rrow streams s inc e t rac tive for ce i s proportional
to the produc t o f y a n d S. Thi s w ould c orr e spond t o t h e c ritical tractive
force.
At this t ime no fina lized values of lim iting tractlv e fo rce c an be
g iven for small agr icultural c hann els in c o h esive soil s. The v alues of
limiting t ractive for c e whic h c a n be used for the c hannels whi ch flow
intermittently will be greater than c a n safe ly be used in continuously

flowing larger c hannels. The reason for this is possibly because slow
rates of scour are not objectionable for the short p er i ods of time when
peak flow oc c urs in these channels.
C ONCL USIONS AND NEEDED RESEARCH
A great deal of resear ch has been conducte d into the basic
aspects of scour resistanc e of cohes ive sediments. Still the properties
which control erosion resistance of cohesive sediments have not b een
conclusively defined. The Task Committee considers that a major
research effort must be undertaken to d efine those propertie s whether
chemical, physical or environm ental that d ete rmin e the res i stance of
a cohesive sed iment to flowing water. The p orp erties of th ese sed im ents
which influenc e th eir ability to resist eros i on need to be better und er
stood. The m ineralogy of the clay fraction a nd the role of d ifferent
cations associated with the clays needs investigating. Also , the influ
ence of suspended sediment and its effe c t on the vis co sity of th e water
produ cing erosion needs to be better understood.
M uch prog ress has been made on appara t us to s imulate the
e rosion forces on c ohesive soils. Problems in transla ting the re
s u lts to design crite r ia are still e ssentially unsolved and more s tudy
60

is needed, Simple laboratory devices which permit soil conditions to be
easily controlled or undisturbed samples to be used need to be further
developed.
Cohesive soils have bonds which are related to the soil mineralogy
and chemistry. Consequently, water qual i ty can play an important role in
changing these bonds by chemical action. This is also important in
estuarine erosion where some research has been conducted, but still more
work is needed.
The immediate necessity of stable channel design does not allow
the designer to wait for the development of a complete method of analysis.
For practical purposes, though, design methods should be complete enough
to allow economical and useful designs to be made. The methods should
be sufficiently logical and simple to be readily understood and used and
should not require so much work as to make their use impra c t ical. For
very light sediment loads, sufficient design informa tion to meet these
requirements is probably available, However, thi s information should be
assembled and presented in a simple and logical manner , with design
examples.
Additional research whi ch may be of benefit for des ign purposes
is studies on stable channel shapes and the influenc e of heavy sediment
loads. Also , research into the stability of mixtures , such as cohes ive
61

sediments and gravels , may prove valu able.
More basic research, which may eventually provide informa
tion to improve des ign c riteria , should b e c onducted on the effect of
the mineralogical characteristics of very fine par ticles on c ohesion.
The remarkable variety of properties exhibited by the very fine
fractions may be the clue to the many varieties of results obtained
from past tests on cohesive so il s.
A great deal of research has also been c onducted on the erosion
of agricultural soils. Efforts to correlate the erodibility of soils to
soil properties have been attempted but the results are still not readi -
ly useable in routine design of water conveyance structures in farm
operations. Often the structures are shallow and re latively flat
bottomed and are tilled as a part of agricultural operations. This
changes the structure and resistanc e of the so il to e ros ion. The soil
is often no t saturate d when the flow event occurs s o s oil m oisture be
comes an important variabl e. Flow i s seldom uniform, b ut has lateral
inflow (as in channel type terrace s or drainage d itche s ) or lateral out
fl ow (as in infiltration from i r rigation furrows }, so flow is spati ally
varied and m or e complex to a nalyze , The flow i s shallow and ra infall
on the s u rfa c e of the flow may affe ct the res ulta n t channel erosion in
unexpe c ted ways.
62

From these and other factors, some critical areas of research
needed in agriculturally related problems include study of effects of
prior physical disturbances and research o:n shallow flow hydraulics.
The effect of physical activity on a soil prior to a potential erosion
producing event needs study. Among these effects are physical com
pacting forces such as traffic, tillage operations, freezing and thawing,
or effect of soil moisture variations and stress. Also , most agricultural
erosion occurs as a result of splash erosion or channel erosion with
relatively shallow flow. The importance of rain energy has not been
sufficiently considered in shallow channel flow and needs study.
Finally, the design of on-farm water conveyance structures 1s
based on empirical relationships and experienc e. Research is needed
to develop useful design procedures for these chann els taking into
account variability in soil conditions and vegetative cov er.
ACKNOWLEDGEMENTS
The committee wishes to express its appreciation to the Bureau
of Engineering Research at The University of Texas for their assistance
m the preparation of this manuscript.
63

[1]
[2]
[3]
[4]
[5]
[6]
[7]
[8]
BIBLIOGRAPHY
Task Committee on Erosion of Cohesive Materials , {F. D, Mas ch, Chrm.) ' 1Abstracte d B ibliography on Erosion of Cohesive Materials," Journal of the Hydraulics Divis ion, ASCE, Vol. 92, No. HY 2 , Mar c h , 1966, pp. 243 - 289.
Sundborg , A . , "The R ive r Klaralven A Stu dy of Fluvial Process es," Geografiska Annal e r , Arg . XXXVIII , Hafte 2-3, 1956 , pp. 127 -3 16.
Dunn, Irving S. , "T ractive R esistance of Cohesive Channels," Journal of So il Me chanics and Foundations Divis i on, ASCE, Vol. 85 , No. SM 3, Proc. Pape r 2062 , June , 1959 .
Carlson, E. J. , and Enger , P . F, , "Studies of Tractive Force s of Cohesive Soils in Earth Canals," U. S. De p t, of the Inte rior , Bur. of Reclam. , Hydraulic Branch Report No, Hyd - 504, Denver, Colo. , October, 1963.
Enger , Phillip F., "Canal Eros ion and Trac tive For ce Study - Analysis of Data Taken on a Boundary Shear Flume , 11 Bureau of Reclamation, H y draulic Branc h Report No. Hyd - 532, Denver, Colo. , F e bruary, 1964.
Moor e , W. L . , and Mas c h , F . D. , "Exper im ents on the Scour Resistance of Cohes ive S ediments , " Jou r n a l of Geophys ical R esearch,. Vol. 67, No. 4 , April , 19 62 , pp. 143 7 - 1449.
Smerdon, E. T. , and B easley, R, P. , "Tractiv e Force Theory Applied to Stability of Open Channels in C ohes ive Soils , 11 Agr i c ultural Experiment Sta t ion, Re sear c h Bulletin No. 715 , Univ. of M i ssouri , Columbia , Mo . , O c t ober , 1959 .
Abdel - Rahman, Nairn Mohamed , " The E ffe c t o f Flowing Wa ter on Cohesive Beds, 11 Thesi s p resented to Laboratory for Hydraulic R esearch and S o il M echani cs , Swiss Federal Institute of Te chnology, Zur ic h , Sw itzerland , 1962,
"Versuchsan stalt Fur Wass erbau und Erdbau, " Nr. 56 , Zur ich , Switzerland (no date available ; probably 1963 ), 144 pp.
64

[ 9] Partheniades , Emmanuel , "Eros ion and Deposition of Cohesive Soils, 11 Journal of the Hydrauli c s Divis i on, ASCE, Vol. 91 , No, HY 1 , Proc. Paper 4204 , January, 1965, pp. 105 - 1 39.
[10] Espey, W. H., Jr., 11A New Test to Measure the Scour of Cohes ive Sediments," Tech. Rep. No. Hyd 01-6 301, Hydraulic Engr. Lab. , Dept. of Civil Engr. , Univ. of Texas , A u s tin, Texas , April , 1963, 42 pp.
[ 11] Rektorik , R. J. and Smerdon, E. T., "Critical Shear Stress in Cohesive Soils from a Rotating Shear Apparatus , " Paper No. 6 4 - 21 6 , ASA E , June 21 - 2 4 , 1 9 6 4.
[ 12] Masch, F. D. , Espe y, W, H. , Jr., and Moore , W . L. , "Measurements of the Shear Res i s t a nce of Cohes ive Sed iments , 11 Pro ceediny;s o f the Federal Inter-Agency Sedimentation Conference, 1963, Agr icultural Resear ch Se rvic e , Washington, D. C., 1965 , pp. 151 - 155.
[13] Martin, R. T., Di s c ussion of "Experiments on the Scour Re s i s tance of Cohesive Sediments" by W. L. M oo re a nd F. D. Masch, Journal of Geophysic al Resear ch , Vol. 67, N o . 4, April , 19 62 , pp. 144 7 -1449.
[14] Grissinger , Earl H., "Resistance of Sele cte d Clay Sy s tems t o Erosion by Water , " Water Resou r c es Research, V ol. 2 , No. 1 , 1 9 6 6 , pp. 1 3 1 - 1 3 8,
[15] Grissinger , Earl H. and Asmu ss en, L. E ., Discuss i on of "Channel Stability in Und i s turbed Cohe s ive Soil s 11 by E . M. Flaxman, Journal of the Hydraulic s Division, ASCE, Vol. 89, No. HY6 , November , 1963 , pp. 259 - 264.
[16] Berghager , Di rk and Ladd , Charles C,, "Ero s ion of Cohesiv e Soils , 11 Res ear c h Repor t R 64 - 1 , School of Eng ineer ing , Dept. of Civil Engr. , MIT , Cambr i dge , Mass. , J a nuary, 1964.
[ 17] Anders on, Henry W. , "Phy s ical Ch ar a cteristics o f Soils Re lated to Eros i on," J ourn al of Soils a n d Water Con serv a tion, July, 19 51, pp. 129 - 133.
65

..
[18] Anderson, Henry W., "Relating Sediment Yield to Watershed Variables," Transactions , Amer ican Geophysical Union, Vol. 38, No. 6, December, 1957 , pp. 921-924.
[19]
[20]
[21]
[22]
[23]
[24]
[ 25 J
[26]
[27]
Zernial , G. A. , and Laur s en, E. M. , "Sediment-Transporting Characteristic s of Streams," J ournal of the Hydraulics Divis i on, ASCE, Vol. 89 , No. HY 1 , Proc . Paper 3396, January, 1963, pp. 117 - 1 38.
Schumn, S, A, , "Dimensions of Some Stable Alluvial Channels," Geological Survey Research, 1961 , pp, B - 26 to B-27.
Schumn, S. A. , "The Effect of Sediment Characteristics on Eros i on a n d Deposition in Ephemeral Stream Channels , " U" S. Geolggi.calSurvey Profess iona l Paper 35 2 ,.. C , 1961 , 70 pp.
Schumn, S. A. , "The Shape of Alluvial Channels in Relation to Sediment Type , " U, S. Geological Survey Profession al Paper 352-B, 1960, 30 pp.
Miller , C. R. and Bor land , W. M. , "Stabilization of Fivemile and Muddy Creeks , 11 Journal of the Hydraulics Division, ASCE, Vol. 89 , No. HY 1 , January, 1961, pp. 67-98.
Woolhiser , D. A. , and Miller , C. R. , " Case Histories of Gully Control Struc tures in Sou th- Western Wis consin, 11 No. ARS 41 - 60 , Agricultural Res ear ch Service , U. S. Dept. of Agr iculture, Washington , D, C., F ebruary, 196 3,
Wall i s , J. R. a n d W i llen, D. W. , 11 Variations in Di spe rs ion Ratios , Surface Aggregation Ra tio, and Texture of Some California Surface Soils as Related to Soil Forming Fac tors ," Bulletin of International Associati on of Scientific Hydrology, Vol. 8 , No. 4 , 1963 , pp. 48 - 58,
Wolman, G ordon M, , "Factors Influen cing Eros ion of a Cohesive River Ban ks ," American J ourna l of Sc ience , Vol. 257, March, 1959 , pp. 204 - 216.
Schroede r , K, B. , "Interim Report on Channe l De te r ioration Study of Natural and Artificial Drainageways in R e pub lic an, Loup, and Little Sioux R iver Areas - - Nebraska and Iowa , 11
Uni ted States Bureau of Reclamation , Hy dro l ogy Branch, Denver , Colo, , September , 19 53,
66

[28]
[29]
\
" [30]
[ 31]
[32]
[33]
[34]
[3 5]
Hjuls torm, F. , "Studies of the Morphology Activity of Rivers as Illustrated by River Fyris , 11 Upsala Univ. , Geological Institute Bulletin, Vol. XXV , 1935 , Chapter 3.
Enger , P, F, and Merriman, J, , Progress Report of Canal Eros ion and Tractive Force Study- - Lower Cost Canal Lining Program, U. S. Dept. of the Interior , Bur. of Reclam. , Hydrau lic Branch Report No. Hyd - 435 (Gen - 21 ), March, 19 57.
Enger , P. F., Merriman, J,, Prichard, D. A., and Ruffatti, M. E. , Progress Report No. 3 , Canal Erosion and Tractive Force Study - -Correlation of Laboratory Test Data -- Lower Cost Canal Lining Program, U. S. Dept. of the Interior , Bur. of Reclam. , Hydraulic Branch Report No. Hyd - 464 , October , 1960.
Merriman, J ., and Enger , P, F. , Progress Report No. 2 of Canal Erosion and Tractive F o r c e Study--Lower Cost Canal Lining Program, U, S. Dept. of the Interior , Bur. of Reclam., Hydrauli c Branch Report No. Hyd-443 (Gen - 22 ), February, 19 58.
Thomas , C. W. and Enger , P . F. , " Use of an Ele c tronic Computer to Analyze Data from Studies of Cr i tic al Tractive Forces for Cohesive Soils , 11 Paper presented t o the International Association for Hydraul i c Research, Ninth Conventi on, Belgrade , 1961.
Simons , D. B. and Alberts on , Mau r ic e L. , 11 Uniform Water Conveyance in Alluvial Mater ial ," Journal of the Hy__drau lic s Div i sion , ASCE, Vol. 86 , No. HY 5 , May , 1960 , pp. 33-71.
Flaxman, Elli ott M. , 11A Me thod of Determining the Erosion Potential of Cohes ive Soils , " Intern ational Ass ociati on of Scientific Hydrology, Commi ss i on of Land Eros ion, Publicati on No. 59, October , 1962 , pp. 114 - 12 3.
Fortier, S. and S c obey, F. C. , "Permi ss ib l e Canal Veloc ities , " Transact_i ons , Americ an Society of C ivil Eng ine er s ., Vol. 89 , Paper No. 1588 , 1926.
67

I
r
[36]
[37]
[38]
Doubt, P. D., "Design of Stable Channels in Erodible Mater ial," Proceedings of Federal Inter - Agency Sedimentation Conference , 1963, Agricultural Research Servic e , Miscellaneous Publication No. 970 , 1965, pp. 373 - 376.
Lane , E. W., "Design of Stable Channels , 11 Transactions, Amer ican Society of C ivil Engineers , Vol. 120 , 1955, pp. 1-34.
Gotts chalk, L. C. and J ones, Victor H. , "Valleys and Hills , Eros i on and Sedimentation, 11 Water, The Yearbook of Agriculture , 1955, U, S. Government Printing Office , 1955, pp. 135 - 143.
[39] Wright, J im , "Man, Earth and Water , 11 address at the Texas Water Conservation Associat i on Conventi on, Austin, Texas, March 13 , 1967 , 6 pp.
[ 40] Smith, Dwight D. , "Broad Aspects of Eros i on Resear c h," Paper No. 66-722 , ASAE, December 6-9, 1966. 15 pp.
[ 41] Anon. , "A Universal Equation for Predicting Rainfall - Erosion Losses, 11 ARS 22 - 66, ARS, USDA , Washington, D. C. , Mar c h, 1961 , 11 pp.
[42] Wischmeier , W. H. and Smith, D. D. , "Soil- Loss Estimation as a Tool in Soil and Water Management Planning , " Publication No. 59 , International Association of Scientific Hydrology, Commiss i on on Land Erosion, pp. 148 - 159.
[ 43] Schwab, Glenn O. et. al. , Soil and Water Conservation Engineer ing , Second edition, John Wiley and Sons , In c . , New York, 1966 , pp. 176 -184.
[44] Middleton, H, E. , "Properties of Soils which Influen c e Erosion, " Tech. Bulletin No. 178 ., USDA, Washington, D. C. , March, 1930 , p. 16.
[ 45 J Middleton, H. E. , et. al. , "Physic al and Chemical Characteristics of the Soils from the Eros ion Exper iment Stations , " Tech. Bulletin No. 316 , USDA, Washington, D. C. , June , 19 3 2 , 50 pp.
68

;,
[ 46] Middleton, H. E., et. al., "Physic al and Chemi cal Charac ter i stic s of the Soils from the Eros ion Experiment Stations, Second Report, " Tech. Bulletin No. 430, USDA , Washington, D. C. , August, 1934,
[47]
[48]
[ 49]
[50]
[51]
[52]
[53]
[54]
62 pp.
Lutz, J., F. , "The Physico - Chemical Properties of Soils Affecting Soil Erosion, 11 Agricultural Experiment Station Resear c h Bulletin No. 212, Univ. o f Missouri , Columbi a , Mo. , July, 1934 , 44 ,pp.
Yoder , Robert E., 11A Direct Method of Aggregate Analysis of Soils and a Study of the Physic al Nature of Erosion Losses , 11
Journal of the American Society of Agronomy, Vol , 28 , No. 5, May, 1936, pp. 337-351.
Peele , T. C. , 1 'The Relation of Certa in Phys i cal Characteristics to the Erodibility of Soils, 11 Proceedings , Soil S cience Society of America , Vol. 2 , 19 37 , pp. 97 - 100.
Peele , T. C. , et. al. , 11 Relation of the Physical Properties of Different Soil Types to Erodibility, 11 Bulletin No. 357, S. Carolina Agri. Exp. Sta. , 1945, 29 pp.
Anderson, H. W. , 1 1Suspended Sediment Discharge as Related to Streamflow, Topography, Soil and Land Use , " Transactions , American Geophysical Uni on, 3 5 (2 ) 19 54 , pp. 268 - 281.
Andre , J. E . a n d Anders on, W. H. , "Variation of So il Ero d ib ility with Geo log y, Geographic Z one , Elevation and Vegeta tion T y pe in No rtherri':.california W ildl ands , 11
· Journal of Geo physical Res e ar ch , Vol. .10 , O c tober , 1961 , pp. 33 51 -33 58.
Wallis, J. R. and Stevan, L ee, 1 'Erod ib ility of S ome Califo rni a Wildland Soils Related to The ir Me tallic Cation Exc hange Capacity, 11 Journal of Geophys ical Resear c h , V ol. 66, No. 4, April , 1961 , pp. 1225 -1 230.
Laflen, J . M. and Beas ley, R. P. , 11 Effe c ts of Compac tion on Cr i ti c al Tractive Forces in Cohes ive Soils., 11 Agricultur al Experimental Station Resea rch B u lletin No. 749 , Univ. of Montan a , September , 1960 , 8 pp.
69

• .,
I
I
[ 55]
[56]
Lyle , W. M. and Sme rdon, E. T ., " Relation of Compac tion and 6>ther Soil Propertie s to the Erosion Resistanc e of Soils ," Trans -a c tions , American Society of Agricultural E ngineers, Vol. 8 , 19 6 5, pp, 41 9 - 4 2 2.
Smerdon, E, T. , "Effec t of Rainfall on Critical Tractive For ces in Channels with Shallow F l ow , 11 Transac tions , Americ an Society of Agric ultural E nginee rs , V o l. 7 , 19 64, pp, 287 - 290,
[57] Anon. , "Engineer ing Handbook for Work Unit Staffs - - Texas," SCS, USDA, Temple , Texas , 1956.
[ 58] Smerdon, Ernest T . , 11 Des ign of Drainage Ditches Stable Against Scour , 11 D e partment of Agric u ltural E n gineer ing, Texas A and M Univ. , 1966 , (Multi lithe d }.
[59] American Society o f Agr icultural Enginee rs , Terracing Committee, 11ASAE Recommen dation R 268 , 11 ASAE Yearbook, 1966 , pp. 380-382.
[60] McCool , D. ·K, and Beasley, R. P ,, 11 Terrace Channel Design Using Spatially Varied Flow a n d Trac tive F o rce Theo r ie s , 11 Agricultural Experiment Sta tion R e sear c h B ulle tin No. 778, Univ. of M issouri, Columbia , Mo. , July , 1961 , 33 pp.
[61] Gardner , Willard, eL al. , 11 Ra infall and Irrigation in Rela tion to Soil Erosion, 11 Agricultural Expe r iment S tati on Bulletin 326 , Utah State Univ. , L o gan, Utah, De c ember, 1946 , 12 pp.
[62] Cr iddle , Wayne , 1 1A P ractical Method of D e t erm in ing P roper Lengths of Runs , S izes of F u rrow S t reams a n d Spacing of Furrows on I rr igated Lands , 11 USDA, Soil Con servati on Service, revised October , 19 50 , 23 pp .
[ 63] Criddle , Wayne , et. al. , 11 Methods for E valuating Irrigati on Systems , 11 Agr icultural Han dbook 82 , SCS , USDA, April , 1956 , 24 pp.
70
Recommended