Embed Size (px)
Citation preview
31st Conference of the European Working Group on Acoustic Emission (EWGAE) – Th.2.A.1
1 License: http://creativecommons.org/licenses/by/3.0/
Laboratory Shear Stimulation and Hydraulic Fracture Characterization Using Acoustic
Emission
Jesse HAMPTON *, Luis MATZAR *, Yanhui HAN **, Norm WARPINSKI ***, Mike MAYERHOFER ***
* Halliburton, Houston, USA ** Shell, Houston, USA
*** Pinnacle, Houston, USA
Abstract. Enhancing formation permeability through hydraulic fracturing (HF) has become a proven tool for hydrocarbon extraction in shale as well as geothermal heat extraction from hot, dry rock reservoirs. Permeability in the nanodarcy range is possible in many unconventional oil and gas reservoirs, requiring production to greatly depend on the existence of natural fractures (NFs) and the additional surface area generated by hydraulic fracturing. Although HF in NF reservoirs has become common practice, in depth understanding of the HF/NF interaction is limited. Multiple laboratory injection tests were performed at true-triaxial loading conditions in granite, while passively monitoring acoustic emissions (AE). Subcritical breakdown pressure injection tests were performed in a naturally fractured medium to replicate the acoustic emissions typically observed throughout a shear stimulation procedure. Above critical breakdown pressure injection tests were also performed in a non-NF homogenous medium to induce AE associated with HF initiation and propagation. Using the information gained from the previous tests, above critical breakdown HF tests were performed in blocks containing a large natural discontinuity to observe AE induced from HF/NF interactions. Experimental setup and boundary conditions were determined through numerical simulation to keep NFs in a critical shear state prior to wellbore injection. The acoustic emission events recorded through the three types of tests were compared, and an in depth post-analysis was performed to gain a clearer understanding of the HF/NF interaction. Source mechanism studies were performed to compare the micro-cracking resulting from the complex fracture network generation to the controlled shear stimulation tests and HF tests. Post-test sample coring and slicing along with computerized tomography (CT) scanning was performed to validate the AE event source locations and determine the geometries of the induced fracture network.
1. Introduction
Hydrocarbon extraction and geothermal heat extraction from enhanced geothermal systems is typically performed using unconventional stimulation techniques to increase the fracture complexity and surface area of wellbore connected fractures. Unconventional stimulation techniques include HF, shear stimulation (SS), acid fracturing, matrix acidizing, propellant fracturing, and thermal stimulation, among others. HF is performed by injecting fluids into
Mor
e In
fo a
t Ope
n A
cces
s D
atab
ase
ww
w.n
dt.n
et/?
id=
1755
3
2
a wellbore at sufficient flow rates and pressures to create new fractures. Shear stimulation is described as long-term injection of fluids at pressures lower than critical values so as to not induce new fractures but rather induce shear failures along pre-existing discontinuities.
Monitoring HF and SS is of utmost importance to ensure the reservoir has been properly stimulated and is ready for production operations. Typical data monitored and monitoring methods employed throughout HF and SS include wellbore pressures, pump pressures, flow rates, microseismic (MS), distributed temperature sensing (DTS), distributed acoustic sensing (DAS), distributed strain sensing (DSS), tilt-meter mapping, and others. Other than the standard hydraulic data acquisition, the most used method for monitoring HF and SS treatments is MS sensing. MS monitoring is the act of observing small earthquakes, or microseisms, caused by downhole processes [1]. Information gained from the traces of the microseisms and the algorithms that process them include individual MS event location, magnitude, energy, source mechanism, microfracture length, volume, and orientation and direction of microfracture slip directions. Although a wealth of information can be gained from MS monitoring of HF and SS treatments, it is still very unclear whether each individual MS event stems from the main HF opening, shearing of pre-existing discontinuities, secondary fractures from non-uniform stress at the fracture face, fluid leakoff and shear, or non-hydraulically connected stress induced fracturing at some distance from the productive zone of interest.
AE is the irreversible release of stress energy caused by numerous things, including dislocation along grain boundaries, fracture, friction, and earthquakes, among others. AE and MS are two terms describing the same fundamental phenomena. Multiple names for the same principle exist because of the simultaneous development of AE in numerous fields. For instance, MS was used in seismology and the mining industry, while material science and work with metals described this phenomena as AE. Mogi described AE as elastic shock is some of his early work [2].
In efforts to understand the fracturing process and the AE associated with HF and SS, multiple laboratory fracturing tests were performed using design considerations from the fracture flow-discrete element method (DEM), coupling geomechanical simulations [3]. The goal of the tests was to confine the boundary conditions such that the majority of the AE observed would result from only one or two types of fracture mechanisms described previously. This would hopefully shed light on the AE mechanisms, why they occur, and under what conditions. This study is the second paper in a series, [3] that will describe and draw conclusions from the AE responses in multiple laboratory conditions for the purpose of fracture characterization.
2. Laboratory Fracture Testing
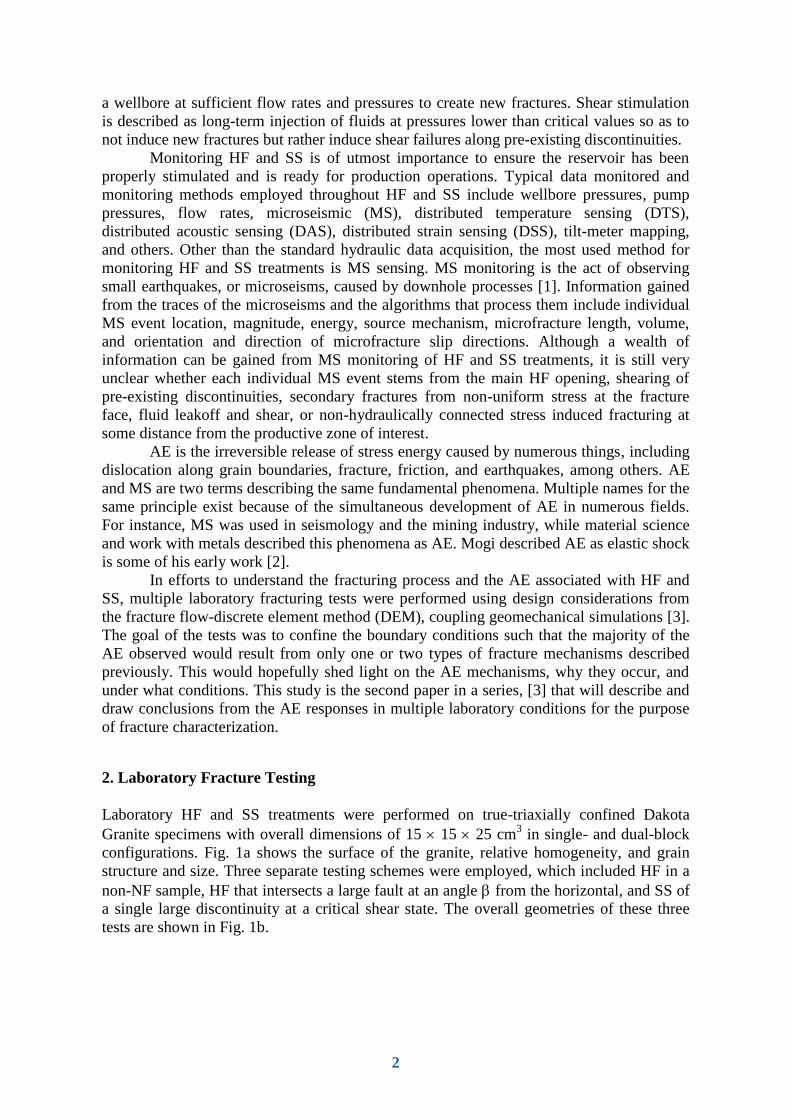
Laboratory HF and SS treatments were performed on true-triaxially confined Dakota Granite specimens with overall dimensions of 15 15 25 cm3 in single- and dual-block configurations. Fig. 1a shows the surface of the granite, relative homogeneity, and grain structure and size. Three separate testing schemes were employed, which included HF in a non-NF sample, HF that intersects a large fault at an angle from the horizontal, and SS of a single large discontinuity at a critical shear state. The overall geometries of these three tests are shown in Fig. 1b.
3
Fig. 1. (a) Partial image of Dakota Granite specimen showing crystalline structure. (b) Testing scheme for
each of the three boundary conditions employed. Test A shows a true-triaxially confined non-naturally faulted rock block being hydraulically fractured and corresponding AE. Test B shows a true-triaxially confined NF rock block being hydraulically fractured and corresponding AE. Test C shows a NF rock block subjected to sub-critical breakdown pressure SS while constant normal stress and shear stress boundary conditions exist.
Drawings are conceptual and not to scale.
2.1 Hydraulic Fracture Testing—Test A
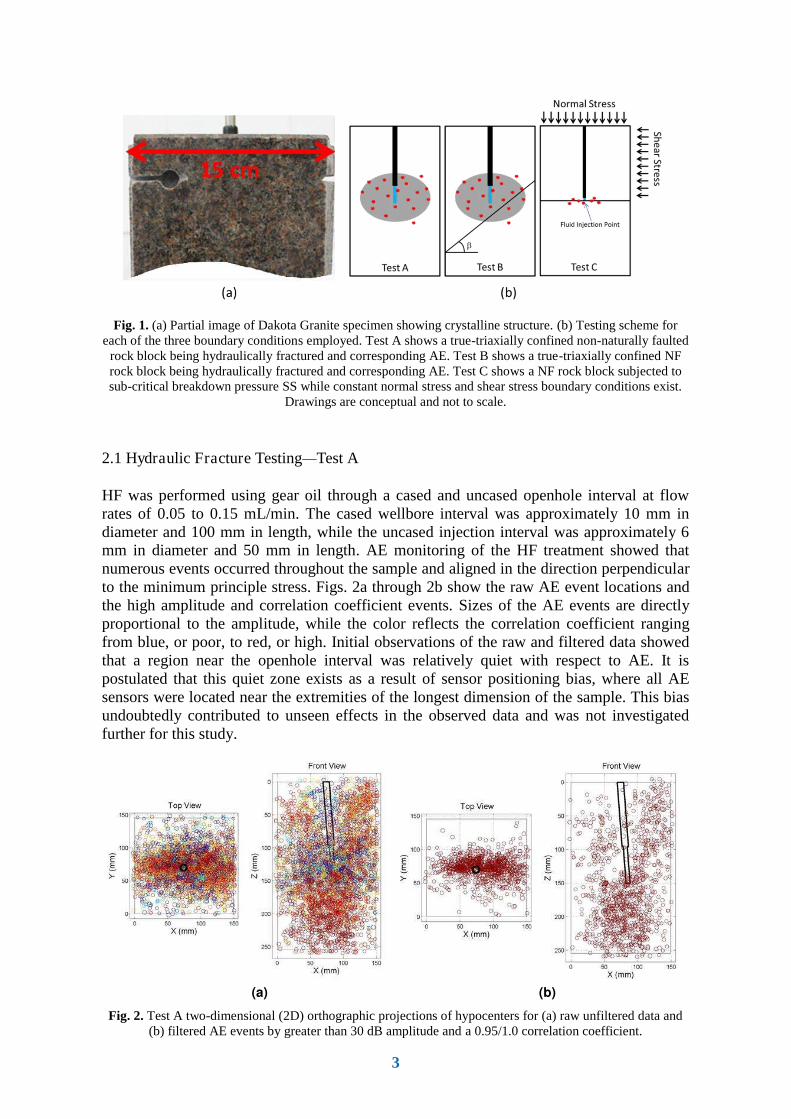
HF was performed using gear oil through a cased and uncased openhole interval at flow rates of 0.05 to 0.15 mL/min. The cased wellbore interval was approximately 10 mm in diameter and 100 mm in length, while the uncased injection interval was approximately 6 mm in diameter and 50 mm in length. AE monitoring of the HF treatment showed that numerous events occurred throughout the sample and aligned in the direction perpendicular to the minimum principle stress. Figs. 2a through 2b show the raw AE event locations and the high amplitude and correlation coefficient events. Sizes of the AE events are directly proportional to the amplitude, while the color reflects the correlation coefficient ranging from blue, or poor, to red, or high. Initial observations of the raw and filtered data showed that a region near the openhole interval was relatively quiet with respect to AE. It is postulated that this quiet zone exists as a result of sensor positioning bias, where all AE sensors were located near the extremities of the longest dimension of the sample. This bias undoubtedly contributed to unseen effects in the observed data and was not investigated further for this study.
(a) (b)
Fig. 2. Test A two-dimensional (2D) orthographic projections of hypocenters for (a) raw unfiltered data and (b) filtered AE events by greater than 30 dB amplitude and a 0.95/1.0 correlation coefficient.
4
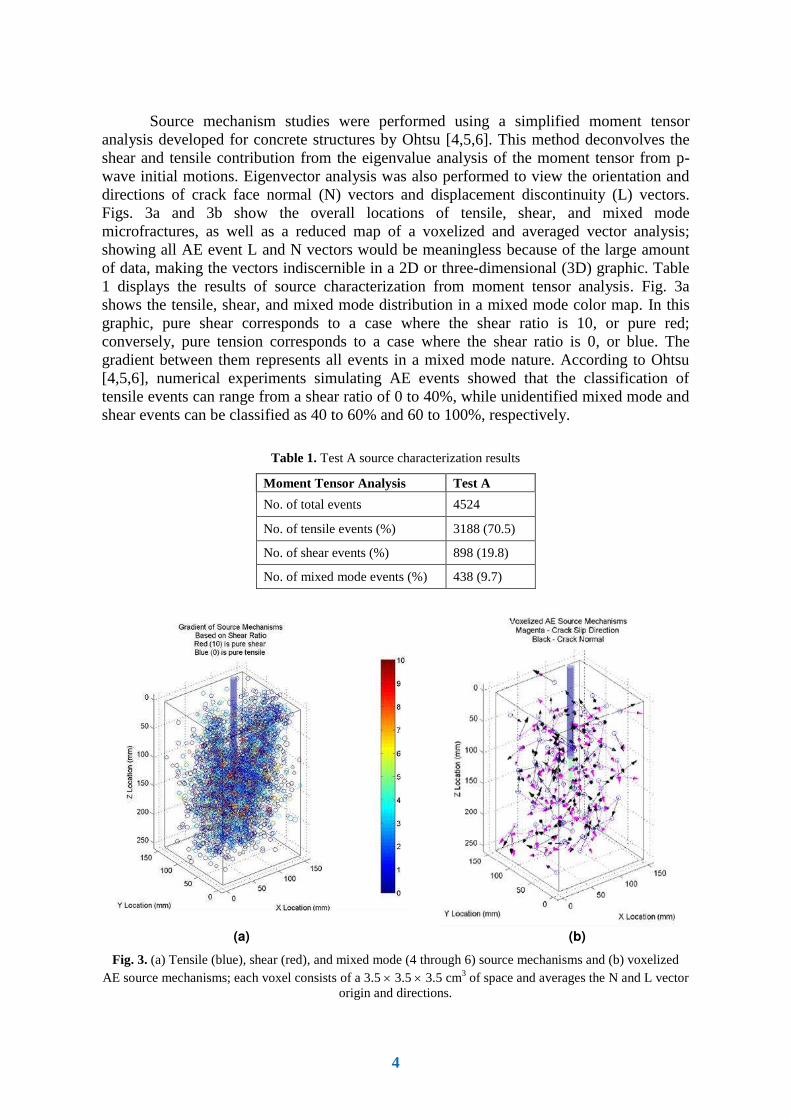
Source mechanism studies were performed using a simplified moment tensor
analysis developed for concrete structures by Ohtsu [4,5,6]. This method deconvolves the shear and tensile contribution from the eigenvalue analysis of the moment tensor from p-wave initial motions. Eigenvector analysis was also performed to view the orientation and directions of crack face normal (N) vectors and displacement discontinuity (L) vectors. Figs. 3a and 3b show the overall locations of tensile, shear, and mixed mode microfractures, as well as a reduced map of a voxelized and averaged vector analysis; showing all AE event L and N vectors would be meaningless because of the large amount of data, making the vectors indiscernible in a 2D or three-dimensional (3D) graphic. Table 1 displays the results of source characterization from moment tensor analysis. Fig. 3a shows the tensile, shear, and mixed mode distribution in a mixed mode color map. In this graphic, pure shear corresponds to a case where the shear ratio is 10, or pure red; conversely, pure tension corresponds to a case where the shear ratio is 0, or blue. The gradient between them represents all events in a mixed mode nature. According to Ohtsu [4,5,6], numerical experiments simulating AE events showed that the classification of tensile events can range from a shear ratio of 0 to 40%, while unidentified mixed mode and shear events can be classified as 40 to 60% and 60 to 100%, respectively.
Table 1. Test A source characterization results
Moment Tensor Analysis Test A
No. of total events 4524
No. of tensile events (%) 3188 (70.5)
No. of shear events (%) 898 (19.8)
No. of mixed mode events (%) 438 (9.7)
(a) (b)
Fig. 3. (a) Tensile (blue), shear (red), and mixed mode (4 through 6) source mechanisms and (b) voxelized AE source mechanisms; each voxel consists of a 3.5 3.5 3.5 cm3 of space and averages the N and L vector
origin and directions.
5
2.2 Hydraulic Fracture Intersecting Discontinuity—Test B
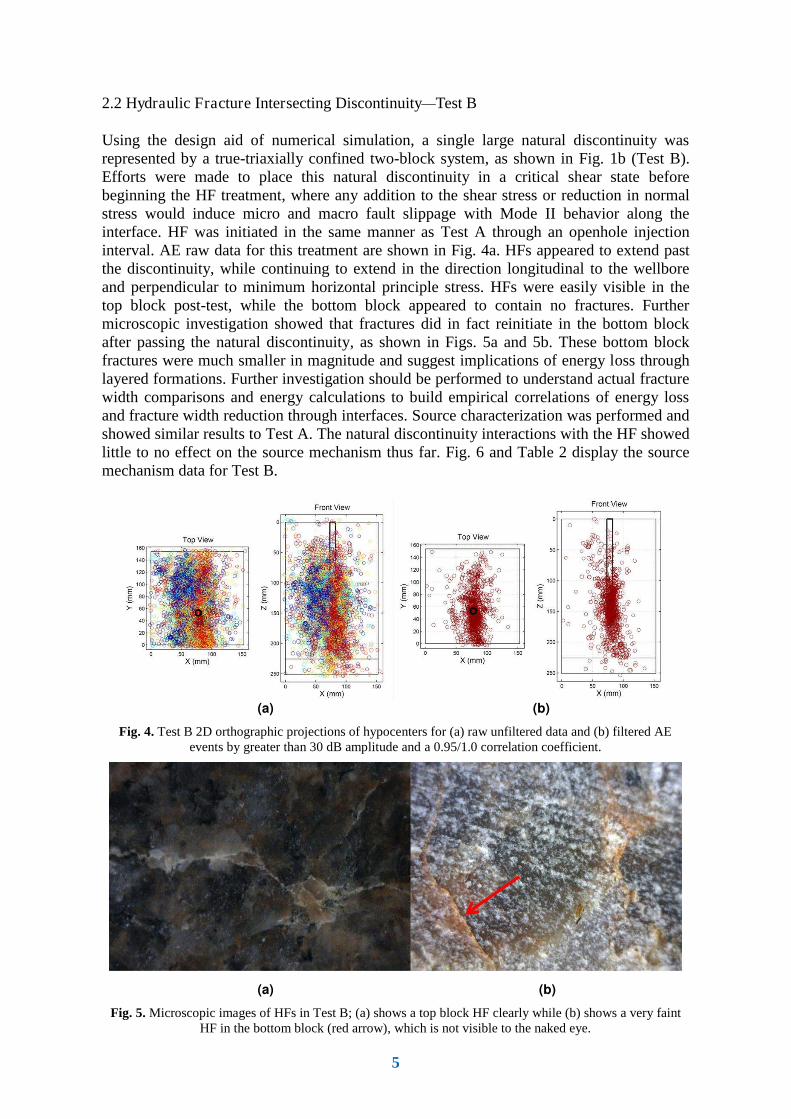
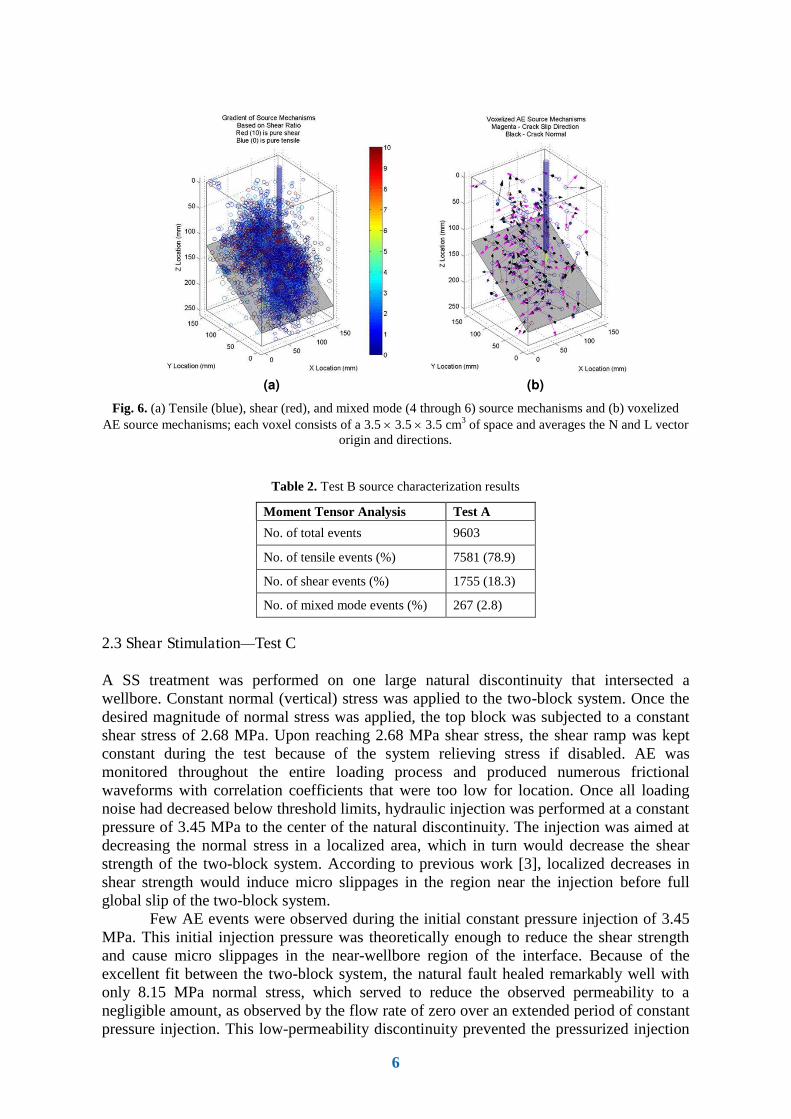
Using the design aid of numerical simulation, a single large natural discontinuity was represented by a true-triaxially confined two-block system, as shown in Fig. 1b (Test B). Efforts were made to place this natural discontinuity in a critical shear state before beginning the HF treatment, where any addition to the shear stress or reduction in normal stress would induce micro and macro fault slippage with Mode II behavior along the interface. HF was initiated in the same manner as Test A through an openhole injection interval. AE raw data for this treatment are shown in Fig. 4a. HFs appeared to extend past the discontinuity, while continuing to extend in the direction longitudinal to the wellbore and perpendicular to minimum horizontal principle stress. HFs were easily visible in the top block post-test, while the bottom block appeared to contain no fractures. Further microscopic investigation showed that fractures did in fact reinitiate in the bottom block after passing the natural discontinuity, as shown in Figs. 5a and 5b. These bottom block fractures were much smaller in magnitude and suggest implications of energy loss through layered formations. Further investigation should be performed to understand actual fracture width comparisons and energy calculations to build empirical correlations of energy loss and fracture width reduction through interfaces. Source characterization was performed and showed similar results to Test A. The natural discontinuity interactions with the HF showed little to no effect on the source mechanism thus far. Fig. 6 and Table 2 display the source mechanism data for Test B.
(a) (b)
Fig. 4. Test B 2D orthographic projections of hypocenters for (a) raw unfiltered data and (b) filtered AE events by greater than 30 dB amplitude and a 0.95/1.0 correlation coefficient.
(a) (b)
Fig. 5. Microscopic images of HFs in Test B; (a) shows a top block HF clearly while (b) shows a very faint HF in the bottom block (red arrow), which is not visible to the naked eye.
6
(a) (b)
Fig. 6. (a) Tensile (blue), shear (red), and mixed mode (4 through 6) source mechanisms and (b) voxelized AE source mechanisms; each voxel consists of a 3.5 3.5 3.5 cm3 of space and averages the N and L vector
origin and directions.
Table 2. Test B source characterization results
Moment Tensor Analysis Test A
No. of total events 9603
No. of tensile events (%) 7581 (78.9)
No. of shear events (%) 1755 (18.3)
No. of mixed mode events (%) 267 (2.8)
2.3 Shear Stimulation—Test C
A SS treatment was performed on one large natural discontinuity that intersected a wellbore. Constant normal (vertical) stress was applied to the two-block system. Once the desired magnitude of normal stress was applied, the top block was subjected to a constant shear stress of 2.68 MPa. Upon reaching 2.68 MPa shear stress, the shear ramp was kept constant during the test because of the system relieving stress if disabled. AE was monitored throughout the entire loading process and produced numerous frictional waveforms with correlation coefficients that were too low for location. Once all loading noise had decreased below threshold limits, hydraulic injection was performed at a constant pressure of 3.45 MPa to the center of the natural discontinuity. The injection was aimed at decreasing the normal stress in a localized area, which in turn would decrease the shear strength of the two-block system. According to previous work [3], localized decreases in shear strength would induce micro slippages in the region near the injection before full global slip of the two-block system.
Few AE events were observed during the initial constant pressure injection of 3.45 MPa. This initial injection pressure was theoretically enough to reduce the shear strength and cause micro slippages in the near-wellbore region of the interface. Because of the excellent fit between the two-block system, the natural fault healed remarkably well with only 8.15 MPa normal stress, which served to reduce the observed permeability to a negligible amount, as observed by the flow rate of zero over an extended period of constant pressure injection. This low-permeability discontinuity prevented the pressurized injection
7
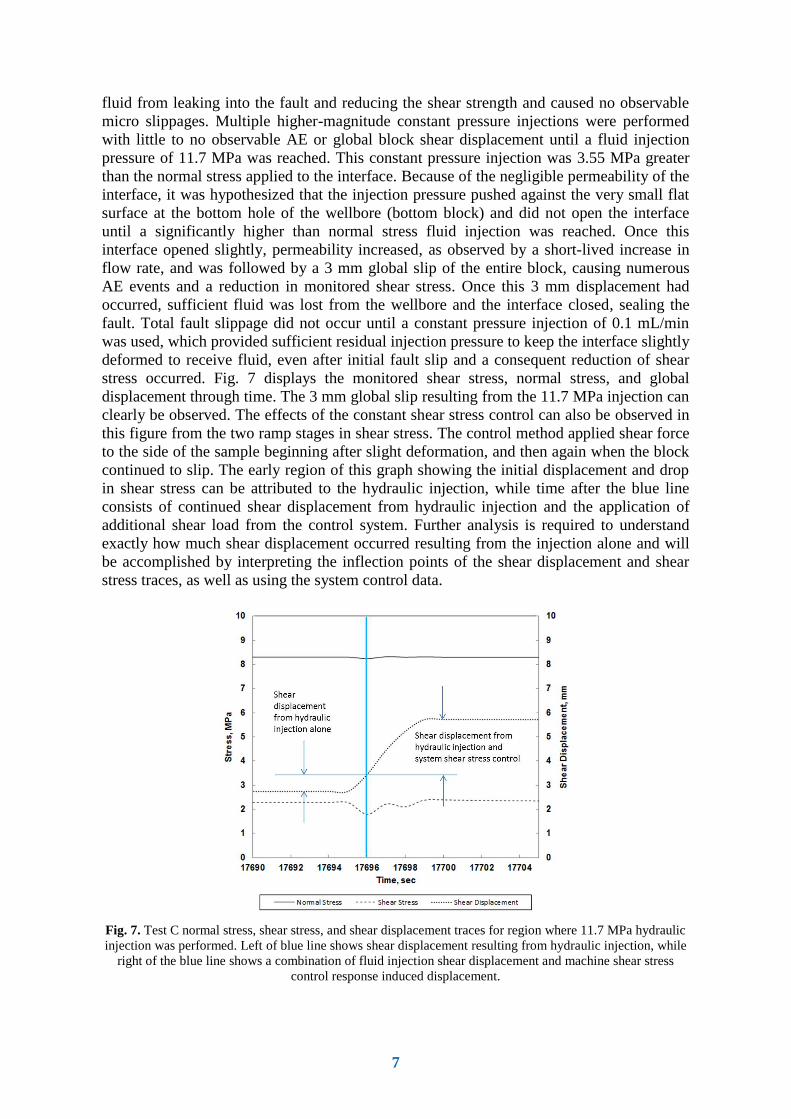
fluid from leaking into the fault and reducing the shear strength and caused no observable micro slippages. Multiple higher-magnitude constant pressure injections were performed with little to no observable AE or global block shear displacement until a fluid injection pressure of 11.7 MPa was reached. This constant pressure injection was 3.55 MPa greater than the normal stress applied to the interface. Because of the negligible permeability of the interface, it was hypothesized that the injection pressure pushed against the very small flat surface at the bottom hole of the wellbore (bottom block) and did not open the interface until a significantly higher than normal stress fluid injection was reached. Once this interface opened slightly, permeability increased, as observed by a short-lived increase in flow rate, and was followed by a 3 mm global slip of the entire block, causing numerous AE events and a reduction in monitored shear stress. Once this 3 mm displacement had occurred, sufficient fluid was lost from the wellbore and the interface closed, sealing the fault. Total fault slippage did not occur until a constant pressure injection of 0.1 mL/min was used, which provided sufficient residual injection pressure to keep the interface slightly deformed to receive fluid, even after initial fault slip and a consequent reduction of shear stress occurred. Fig. 7 displays the monitored shear stress, normal stress, and global displacement through time. The 3 mm global slip resulting from the 11.7 MPa injection can clearly be observed. The effects of the constant shear stress control can also be observed in this figure from the two ramp stages in shear stress. The control method applied shear force to the side of the sample beginning after slight deformation, and then again when the block continued to slip. The early region of this graph showing the initial displacement and drop in shear stress can be attributed to the hydraulic injection, while time after the blue line consists of continued shear displacement from hydraulic injection and the application of additional shear load from the control system. Further analysis is required to understand exactly how much shear displacement occurred resulting from the injection alone and will be accomplished by interpreting the inflection points of the shear displacement and shear stress traces, as well as using the system control data.
Fig. 7. Test C normal stress, shear stress, and shear displacement traces for region where 11.7 MPa hydraulic injection was performed. Left of blue line shows shear displacement resulting from hydraulic injection, while
right of the blue line shows a combination of fluid injection shear displacement and machine shear stress control response induced displacement.
8
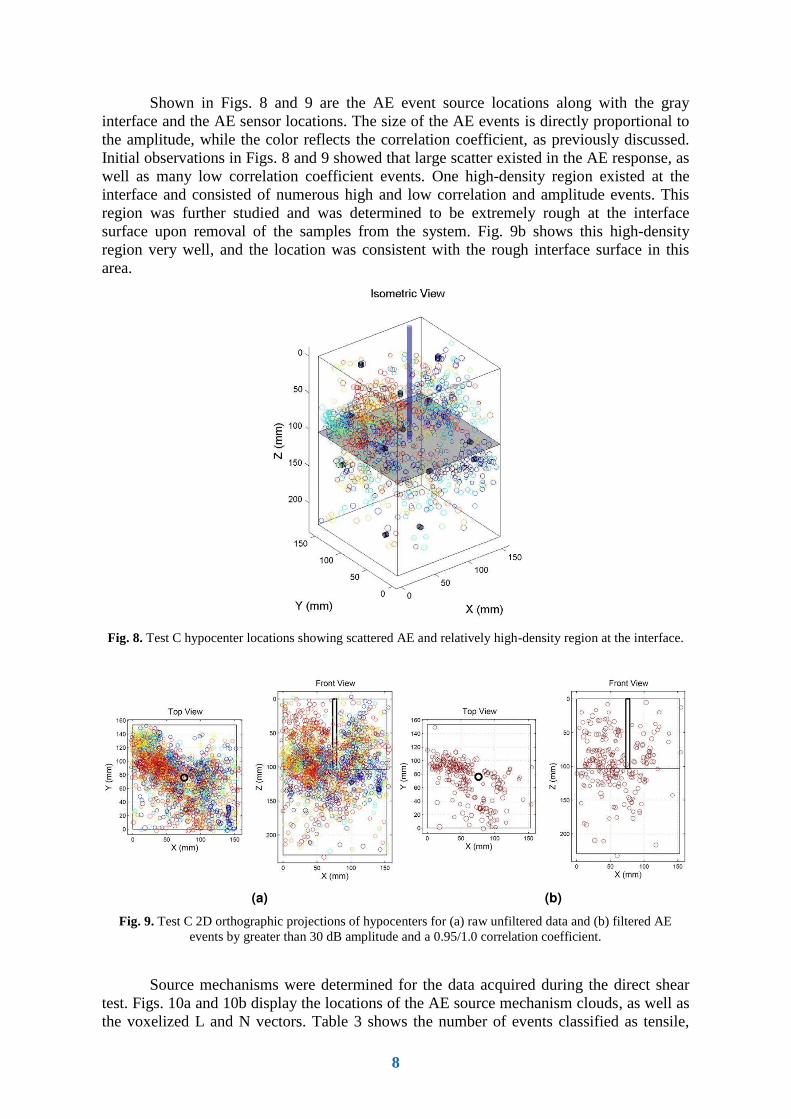
Shown in Figs. 8 and 9 are the AE event source locations along with the gray interface and the AE sensor locations. The size of the AE events is directly proportional to the amplitude, while the color reflects the correlation coefficient, as previously discussed. Initial observations in Figs. 8 and 9 showed that large scatter existed in the AE response, as well as many low correlation coefficient events. One high-density region existed at the interface and consisted of numerous high and low correlation and amplitude events. This region was further studied and was determined to be extremely rough at the interface surface upon removal of the samples from the system. Fig. 9b shows this high-density region very well, and the location was consistent with the rough interface surface in this area.
Fig. 8. Test C hypocenter locations showing scattered AE and relatively high-density region at the interface.
(a) (b)
Fig. 9. Test C 2D orthographic projections of hypocenters for (a) raw unfiltered data and (b) filtered AE events by greater than 30 dB amplitude and a 0.95/1.0 correlation coefficient.
Source mechanisms were determined for the data acquired during the direct shear test. Figs. 10a and 10b display the locations of the AE source mechanism clouds, as well as the voxelized L and N vectors. Table 3 shows the number of events classified as tensile,
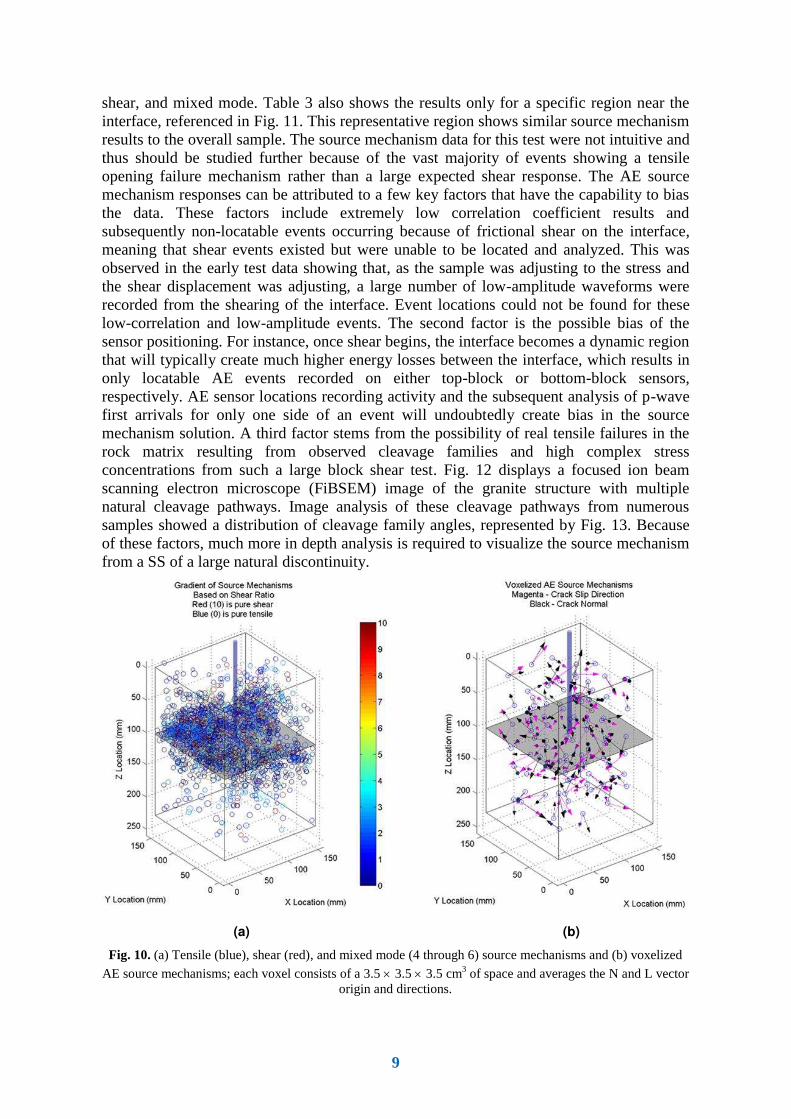
9
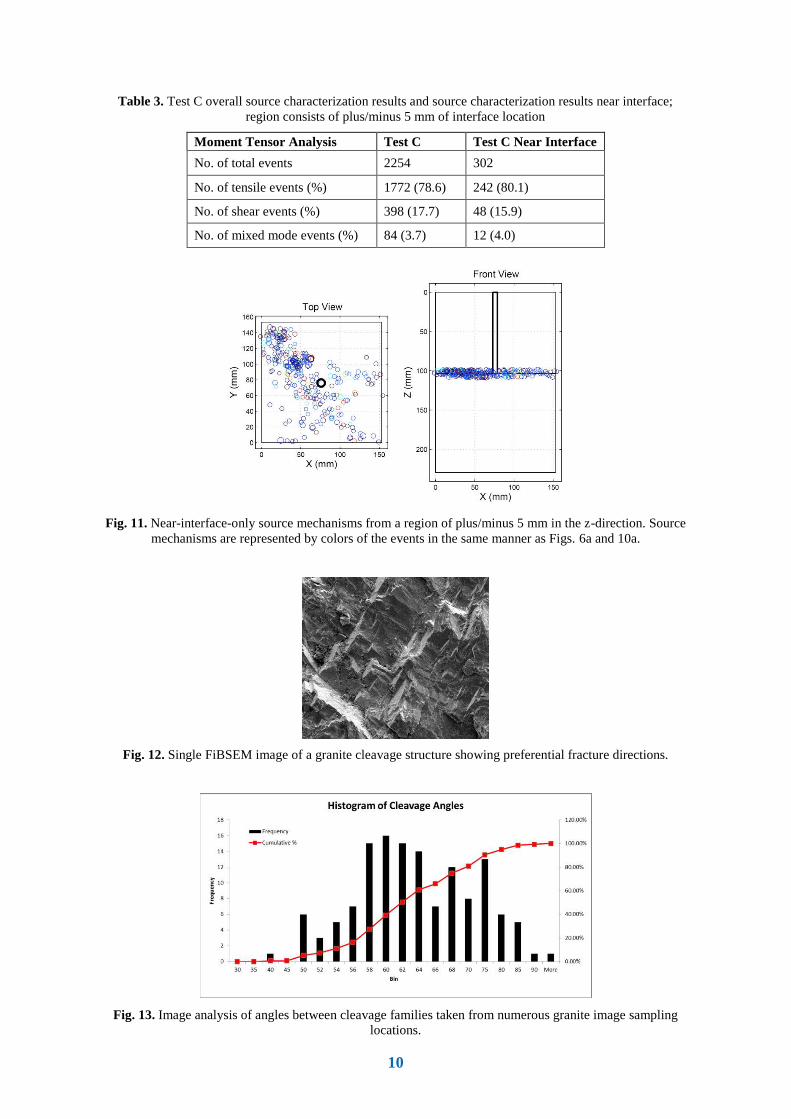
shear, and mixed mode. Table 3 also shows the results only for a specific region near the interface, referenced in Fig. 11. This representative region shows similar source mechanism results to the overall sample. The source mechanism data for this test were not intuitive and thus should be studied further because of the vast majority of events showing a tensile opening failure mechanism rather than a large expected shear response. The AE source mechanism responses can be attributed to a few key factors that have the capability to bias the data. These factors include extremely low correlation coefficient results and subsequently non-locatable events occurring because of frictional shear on the interface, meaning that shear events existed but were unable to be located and analyzed. This was observed in the early test data showing that, as the sample was adjusting to the stress and the shear displacement was adjusting, a large number of low-amplitude waveforms were recorded from the shearing of the interface. Event locations could not be found for these low-correlation and low-amplitude events. The second factor is the possible bias of the sensor positioning. For instance, once shear begins, the interface becomes a dynamic region that will typically create much higher energy losses between the interface, which results in only locatable AE events recorded on either top-block or bottom-block sensors, respectively. AE sensor locations recording activity and the subsequent analysis of p-wave first arrivals for only one side of an event will undoubtedly create bias in the source mechanism solution. A third factor stems from the possibility of real tensile failures in the rock matrix resulting from observed cleavage families and high complex stress concentrations from such a large block shear test. Fig. 12 displays a focused ion beam scanning electron microscope (FiBSEM) image of the granite structure with multiple natural cleavage pathways. Image analysis of these cleavage pathways from numerous samples showed a distribution of cleavage family angles, represented by Fig. 13. Because of these factors, much more in depth analysis is required to visualize the source mechanism from a SS of a large natural discontinuity.
(a) (b)
Fig. 10. (a) Tensile (blue), shear (red), and mixed mode (4 through 6) source mechanisms and (b) voxelized
AE source mechanisms; each voxel consists of a 3.5 3.5 3.5 cm3 of space and averages the N and L vector origin and directions.
10
Table 3. Test C overall source characterization results and source characterization results near interface; region consists of plus/minus 5 mm of interface location
Moment Tensor Analysis Test C Test C Near Interface
No. of total events 2254 302
No. of tensile events (%) 1772 (78.6) 242 (80.1)
No. of shear events (%) 398 (17.7) 48 (15.9)
No. of mixed mode events (%) 84 (3.7) 12 (4.0)
Fig. 11. Near-interface-only source mechanisms from a region of plus/minus 5 mm in the z-direction. Source
mechanisms are represented by colors of the events in the same manner as Figs. 6a and 10a.
Fig. 12. Single FiBSEM image of a granite cleavage structure showing preferential fracture directions.
Fig. 13. Image analysis of angles between cleavage families taken from numerous granite image sampling
locations.
11
3. Conclusions
Extensive experimentation was performed in an effort to confine boundary conditions in such a way as to observe multiple types of AE fracture events. In depth AE analysis was performed on each experiment to elucidate the individual fracture source mechanisms and the orientations and directions of L and N vectors. Post-test sample characterization was performed to validate AE event cloud predictions of fracture location and orientation. The initial conclusions of this work include the following:
It was observed that a HF passing through a large natural discontinuity resulted in a substantial reduction in fracture dimensions, which has implications when performing HF treatments in highly NF reservoirs. AE sensor positioning also affected geometry and source characterization analysis and must always be considered when testing in the laboratory because of the possibility of biased source solutions. Subcritical hydraulic injection into healed fractures or faults requires higher than anticipated injection pressures to cause slip on these pre-existing discontinuities, especially when the fault is healed to an almost zero permeability for the injection fluid used. The injection pressure and fault slip in this situation will not only be governed by the stress regime at the interface and the fault interface material properties but will also rely on the bulk matrix elastic properties on each side of the interface, as this must deform in some cases to receive fluid to initiate fault slip.
Further analysis and testing is required to elucidate the fracture mechanism
distribution around these natural discontinuities under HF and SS procedures.
References
[1] Warpinski, N.R. 2009. Microseismic Monitoring: Inside and Out. Journal of Petroleum Technology. Distinguished Author Series. 61 (11): 80–85. [2] Mogi, K. 2007. Experimental Rock Mechanics. London: Taylor & Francis. [3] Han, Y., Hampton, J., Li, G., Warpinski, N.R., Mayerhofer, M. 2013. Geomechanics Mechanisms in Microseismicity Generation Near Natural Fractures Induced by Hydraulic Fracturing. SPE Unconventional Resources Conference. Calgary, CA. [4] Ohtsu, M. 1995. Acoustic Emission Theory for Moment Tensor Analysis. Res Nondestr Eval. 6 (3): 169–184. [5] Manthei, G. 2004. Characterization of Acoustic Emission Sources in Rock Salt Specimen Under Triaxial Load. Journal of Acoustic Emission. (Acoustic Emission Working Group). 22: 173–189. [6] Grosse, C.U. (Ed.) and Ohtsu, M. (Ed.). 2010. Acoustic Emission Testing: Basics for Research – Applications in Civil Engineering, first edition. New York: Springer.