Company: Brierty Limited:
Brierty Limited provides civil and mining contracting, and land development services in Australia. The company
operates through three segments: Civil, Mining, and Land Development. The Civil segment undertakes various civil
construction projects, including highways and roads, railway formations, airport runways, site works, concrete and
pavement works, earthworks, drainage and service installation, sewer reticulation, and road works and sub divisional
infrastructure for the creation of housing lots. The Mining segment offers mining services, such as surface mining,
including site preparation services, which comprise stripping overburden, site works for building infrastructure, road
works, tailings dams, residue disposal areas, airstrips, drilling and blasting, ore haulage rehandling, train loading,
tailings and water storage facilities, and vegetation clearing. The Land development segment develops residential
lands. It provides civil construction and mining services solutions to government and private industry. Brierty
Limited was founded in 1981 and is headquartered in South Perth, Australia.
Source: http://www.brierty.com.au/about-us/our-history.html
Part 1:
Executive Summary:
Overview of Subject Matter: The process of evaluation of the financial information contained in the
financial statements in order to understand and make decisions regarding the operations of the firm is
called ‘Financial Statement Analysis’. It is the process of identify ing the financial strengths and
weaknesses of the firm by establishing relationships between the items of the balance sheet and the
statement of profit and loss.
THE PUROSE OF FINANCIAL STATEMENTS
The preparation of profit and loss statement and balance sheet is a very valuable exercise for an
organization. The purposes of these financial statements are as outlined below:
• To inform owners about the financial position of the organization.
• To inform managers the achievements/shortfalls in the performance of the business.
• To secure finance and maintain finance.
• To monitor performance of the business periodically.
• To fulfill statutory obligations.
• To assess tax liability.

Source: http://seminarprojects.org/t-finacial-statement-analysis
SCOPE OF STUDY:
The study mainly attempts to analyze the financial performance of the company selected for the study.
The financial authorities can use this for evaluating their performance in future, which will help to
analyze financial statements and help to apply the resources of the company properly for the
development of the company and its employees to bring overall growth. The present study attempt to
develop a trend analysis model for Sales and Working Capital and Profit and Loss Accounts.
RESEARCH METHODOLGY
Methods of data collection;-
Secondary data the secondary data is derived from the annual reports, Business line and finance
newspapers websites.
Methods of analysis: The most commonly used techniques of financial analysis are as follows:
Comparative Statements
Common Size Statements
Trend Analysis
Ratio Analysis
Cash Flow Analysis
COMPARATIVE STATEMENT ANALYSIS:
Comparative statement is those statements, which have designed in a way, so as to
provide time perspective to the consideration of the various elements of financial position
embodied in such statements. In such statements figures for two or more periods are placed
side by side to facilitate comparison. The two statements are proposed for comparison. They are
comparative income statement and comparative Balance Sheet.
METHODS OF LEAST SQUARES (TREND VALUES)
By the method of lease square, a straight line trend can be fitted to the given time series of
data. It is a mathematical, as well as, analytical method. With its help, economic and business
time series data can be fitted and this helps in forecasting and predicting. The trend line is called
the line of best fit. The sum of deviations of the actual values of Y and the trend value (Yc) is 0
and sum of square of deviations of the actual value and the trend value is the least. (Y-Yc) = 0
and (Y- Yc) = least. So this method is called the least squares method or the line of best fit.
RATIO ANALYSIS:
Ratio Analysis is widely used tool of financial analysis. It is defined as the systematic use of ratio
to interpret the financial statements so that the strength and weakness of a firm as well as its

historical performance and current financial condition can be determined. The term ratio refers
to the numerical or quantitative relationship between two items/ Variable. This relation can be
expressed as.
a. Percentages
b. Fractions
c. Proportion of numbers.
Types of financial Ratios:
Liquidity ratios
Leverages ratios
Activity ratios
Profitability ratios
Liquidity Ratio:
Liquidity Ratio measures the firm’s ability to meet current obligations, and are
calculated by establishing relationships between current assets and current liabilities.
Leverage ratio:
Leverage ratios measure the proportion of outsider’s capital in financing the firm’s
assets, and are calculated by establishing relationships between borrowed capital and equity
capital.
Activity Ratio:
Activity ratio reflects the firm’s efficiency in utilizing its assets in generating sales and is
calculated by establishing relationships between sales and assets.
Profitability Ratio:
Profitability ratios measure the overall performance of the firm by deterring the
effectiveness of the firm in generating profit, and are calculated by establishing relationships
between profit figures on the one hard, and sales and assets on the other.
Source: http://www.ncert.nic.in/ncerts/l/leac204.pdf
Findings:
Revenue and earnings impacted by delayed project starts and tight margins given the current
operating environment.
WTS2 establishment investment resulted in increased capital expenditure and associated debt
as expected.
Targeted increased cash generation and associated debt reduction in FY16 as major projects
transition from setup phase to delivery or completion.
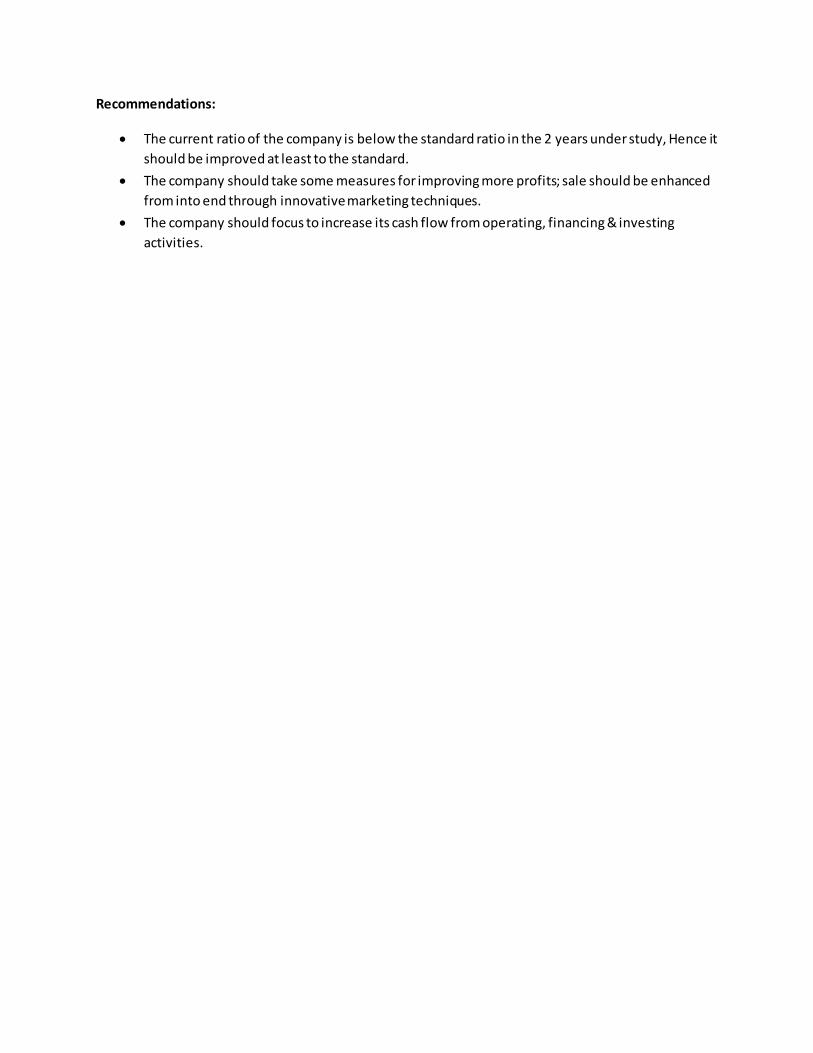
Recommendations:
The current ratio of the company is below the standard ratio in the 2 years under study, Hence it
should be improved at least to the standard.
The company should take some measures for improving more profits; sale should be enhanced
from into end through innovative marketing techniques.
The company should focus to increase its cash flow from operating, financing & investing
activities.

Part 2
Consolidated Statement of Financial Position as at 30 June 2015
Source: http://www.brierty.com.au/investors -and-media/invester-information/financial-snapshot.html
Current assets are balance sheet accounts that represent the value of all assets that can be converted
into cash within one year. Current assets include cash and cash equivalents, accounts receivable,
inventory, marketable securities, prepaid expenses and other assets that can be readily converted to
cash.

Non-current assets are those that will not have their full value realized within 12 months of the balance
sheet date. Examples of noncurrent assets include investments in another company, intangible
assets such as goodwill, brand recognition and intellectual property, and property, plant and equipment.
Current liabilities are debts and obligations of the company that are due within a year.
Bonds, mortgages and loans that are payable over a term, more than one year would be fixed
liabilities or long-term liabilities.
FINDINGS:
Increase in Current Assets:
$ 77,400,439- $72,080,044/ $72,080,044*100 = 7.38%
Increase in non- current assets:
$90,412,428- $55,574,094/ $55,574,094* 100 = 62.68%
Increase in Current Liabilities:
$82,098,983- $48,884,243/ - $48,884,243* 100 = 67.94%
Increase in non- current liabilities:
$28,957,540- $19,638,312/ $19,638,312* 100 = 47.45%
Decrease in equity:
$56,756,344 – $59,131,583/ $59,131,583* 100 = -4.01%
Decrease in equity can be a reason of worry for the management. Even both the current and non-current
values have gone up in year 2015 as compared to previous year.

Part 3: Consolidated Statement of Comprehensive Income for year ended 30 June 2015:
Source: http://www.brierty.com.au/investors -and-media/invester-information/financial-snapshot.html FINDINGS:
The Profit and Loss statement (P&L) is generally prepared annually and forms part of the accounting
documents a limited company and sole trader need to produce to satisfy the tax authorities. It shows
revenues and costs and how much profit has been made by the business over the period it has been
prepared for.

The profit and loss statement consists of these major components:-
· Gross sales - the total resources generated by the firm's products and services
· Net sales - the revenues received by the firm after subtracting returns and discounts (such as trade,
quantity, cash)
· Cost of goods sold - the cost of merchandise sold by the manufacturer or retailer.
· Gross margin (profit) - the difference between sales and the cost of goods sold: consists of operating
expenses plus net profits
· Operating expenses - the costs of running a business, including marketing
· Net profit before taxes - the profit earned after all costs have been deducted. The above snapshot
shows a pro forma trading and profit and loss account.

Part 4
Statement of cash flows:
The cash flow statement shows how much cash comes in and goes out of the company over
the quarter or the year. At first glance, that sounds a lot like the income statement in that it records
financial performance over a specified period. But there is a big difference between the two.
Source: http://www.investopedia.com/university/fundamentalanalysis/fundanalysis8.asp
Source: http://www.brierty.com.au/investors -and-media/invester-information/financial-snapshot.html
Terminologies:
Cash Flow from Operations This is the key source of a company's cash generation. It is the cash that the company produces internally as opposed to funds coming from outside investing and financing activities. In this section of the cash flow statement, net income (income statement) is adjusted for non-cash charges and the

increases and decreases to working capital items - operating assets and liabilities in the balance sheet's current position.
Cash Flow from Investing For the most part, investing transactions generate cash outflows, such as capital expenditures for plant, property and equipment, business acquisitions and the purchase of investment securities. Inflows come from the sale of assets, businesses and investment securities. For investors, the most important item in this category is capital expenditures (more on this later). It's generally assumed that this use of cash is a prime necessity for ensuring the proper maintenance of, and additions to, a company's physical assets to support its efficient operation and competitiveness.
Cash Flow from Financing Debt and equity transactions dominate this category. Companies continuously borrow and repay debt. The issuance of stock is much less frequent. Here again, for investors, particularly income investors, the most important item is cash dividends paid. It's cash, not profits, that is used to pay dividends to shareholders.
Operating Cash Flow/Net Sales This ratio, which is expressed as a percentage of a company's net operati ng cash flow to its net sales, or revenue (from the income statement), tells us how many dollars of cash we get for every dollar of sales. Source: http://www.investopedia.com/articles/stocks/07/easycashflow.asp
FINDINGS:
Net Cash inflow from operating activities:
-$ 1,787,474– $28,466,646 = -$30,254,120 (Decrease)
The company needs to focus on their operations as the cash inflow has dipped in one year.
Net cash outflow from investing activities:
-$1,995,728- (-$879,777) = -$1,115,951 (Decrease)
The company’s investment activities has gone down which is not all a healthy sign. The management has
to look into this matter.
Net cash inflow from financing activities:
-$20,635,650 – (-$13,893,595) =- $6,742,055 (Decrease)
This decrease shows that the company is unable to get funds from the market.

Part 5
Stockholders' equity:
Equity
Equity represents what shareholders own, so it is often called shareholder's equity. As described above,
equity is equal to total assets minus total liabilities.
Equity = Total Assets – Total Liabilities
The two important equity items are paid-in capital and retained earnings. Paid-in capital is the amount
of money shareholders paid for their shares when the stock was first offered to the public. It basically
represents how much money the firm received when it sold its shares. In other words, retained earnings
are a tally of the money the company has chosen to reinvest in the business rather than pay to
shareholders. Investors should look closely at how a company puts retained capital to use and how a
company generates a return on it.
Source: Accounting – Author B.S. Raman
Components of Shareholder's Equity Also known as "equity" and "net worth", the shareholders' equity refers to the shareholders' ownership interest in a company.
Usually included are:
Preferred stock - This is the investment by preferred stockholders, which have priority over common shareholders and receive a dividend that has priority over any distribution made to common shareholders. This is usually recorded at par value.
Additional paid-up capital (contributed capital) - This is capital received from investors for stock; it is equal to capital stock plus paid-in capital. It is also called "contributed capital".
Common stock - This is the investment by stockholders, and it is valued at par or stated value. Retained earnings - This is the total net income (or loss) less the amount distributed to the
shareholders in the form of a dividend since the company's initiation. Other items - This is an all-inclusive account that may include valuation allowance and
cumulative translation allowance (CTA), among others. Valuation allowance pertains to noncurrent investments resulting from selective recognition of market value changes.

Cumulative translation allowance is used to report the effects of translating foreign currency transactions, and accounts for foreign affiliates.
Source: Accounting – Author B.S. Raman
Source: http://www.brierty.com.au/investors -and-media/invester-information/financial-snapshot.html
This statement consists of four major categories:
Capital Stock --- This category reflects the equity financing decision, different classes of equity stocks,
and can also include more esoteric items such as ESOP’s (see below)
Accumulated Other Comprehensive Income (AOCI) --- Described above in terms of transactions (other
than Accounting Income transactions) that impact stockholders’ equity without stockholders’ being
involved in the transaction.
Retained Earnings ---- Results from Accounting Income and Dividend payments
Treasury Stock --- in the US a company can trade its own stock.
Source: https://www.stock-analysis-on.net/NASDAQ/Company/Alphabet-Inc/Financial-
Statement/Liabilities-and-Stockholders-Equity
FINDINGS:
By analyzing the statement, we can conclude that, share capital has dipped in 2015 as compared to
2014:
$56,756,344 - $59,131,583 = -$2,375,238
This is a massive decrease which states that company has not been successful in multiplying its goodwill.
Recommended