Bode Plot for G1(s) with Gain Margin (GM) and Phase Margin (øM)
Bode Plot for G2(s) with Gain Margin (GM) and Phase Margin (øM)
Mag
nitu
de (d
B)
-60
-50
-40
-30
-20
-10
0
10
10-1 100 101
Phas
e (d
eg)
-270
-225
-180
-135
-90
-45
0
Bode DiagramGm = 12 dB (at 1.73 rad/s) , Pm = 67.6 deg (at 0.766 rad/s)
Frequency (rad/s)
Mag
nitu
de (d
B)
-120
-100
-80
-60
-40
-20
0
20
10-2 10-1 100 101 102
Phas
e (d
eg)
-270
-225
-180
-135
-90
-45
0
Bode DiagramGm = 4.86 dB (at 1.73 rad/s) , Pm = 22.3 deg (at 1.38 rad/s)
Frequency (rad/s)

Bode Plot for G3(s) with Gain Margin (GM) and Phase Margin (øM)
Step Response for G1(s) and a 2nd order approximation of G1(s) in Unity Feedback (T1(s))
Mag
nitu
de (d
B)
-140
-120
-100
-80
-60
-40
-20
0
20
10-2 10-1 100 101 102 103
Phas
e (d
eg)
-270
-225
-180
-135
-90
-45
0
Bode DiagramGm = 19.9 dB (at 5.07 rad/s) , Pm = 89.4 deg (at 1.08 rad/s)
Frequency (rad/s)
0 2 4 6 8 10 12 14 16 180
0.1
0.2
0.3
0.4
0.5
0.6
0.7
0.8
0.9T1 (Original)T1 (2nd Order)
Step Response
Time (seconds)
Ampl
itude

Step Response for G2(s) and a 2nd order approximation of G2(s) in Unity Feedback (T2(s))
Step Response for G3(s) and a 2nd order approximation of G3(s) in Unity Feedback (T3(s))
0 5 10 15 20 25 30 35 400
0.2
0.4
0.6
0.8
1
1.2T2 (Original)T2 (2nd Order)
Step Response
Time (seconds)
Ampl
itude
0 0.5 1 1.5 2 2.5 3 3.5 4 4.50
0.1
0.2
0.3
0.4
0.5
0.6
0.7
0.8T3 (Original)T3 (2nd Order)
Step Response
Time (seconds)
Ampl
itude


Bode Plot for G(s) with Gain Margin (GM) and Phase Margin (øM)
Mag
nitu
de (d
B)
-160-140-120-100
-80-60-40-20
02040
10-4 10-3 10-2 10-1 100 101 102 103
Phas
e (d
eg)
-270
-225
-180
-135
-90
-45
0
Bode DiagramGm = 30.4 dB (at 7.11 rad/s) , Pm = 63.5 deg (at 0.921 rad/s)
Frequency (rad/s)

Bode Plot for GCG(s) with GC(s) = 10 (s / 0.03 + 1) / (s / 0.003 + 1).
Step Response for G(s) (eSS = 0.01) and GCG(s) (eSS = 0.001) in unity feedback.
Mag
nitu
de (d
B)
-150
-100
-50
0
50
100
10-4 10-3 10-2 10-1 100 101 102 103
Phas
e (d
eg)
-270
-225
-180
-135
-90
-45
0
Bode DiagramGm = 30 dB (at 6.99 rad/s) , Pm = 61.8 deg (at 0.921 rad/s)
Frequency (rad/s)
0 1 2 3 4 5 6 70
0.2
0.4
0.6
0.8
1
1.2TTc
Step Response
Time (seconds)
Ampl
itude
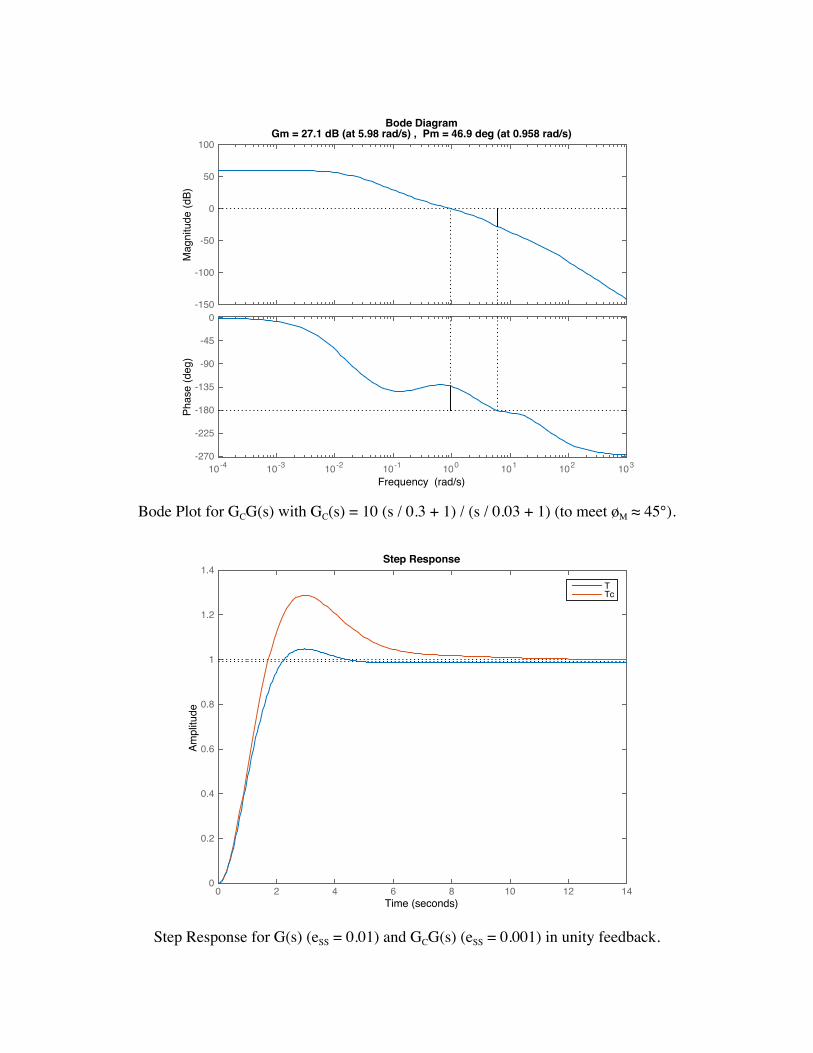
Bode Plot for GCG(s) with GC(s) = 10 (s / 0.3 + 1) / (s / 0.03 + 1) (to meet øM ≈ 45°).
Step Response for G(s) (eSS = 0.01) and GCG(s) (eSS = 0.001) in unity feedback.
Mag
nitu
de (d
B)
-150
-100
-50
0
50
100
10-4 10-3 10-2 10-1 100 101 102 103
Phas
e (d
eg)
-270
-225
-180
-135
-90
-45
0
Bode DiagramGm = 27.1 dB (at 5.98 rad/s) , Pm = 46.9 deg (at 0.958 rad/s)
Frequency (rad/s)
0 2 4 6 8 10 12 140
0.2
0.4
0.6
0.8
1
1.2
1.4TTc
Step Response
Time (seconds)
Ampl
itude


0 0.1 0.2 0.3 0.4 0.5 0.6 0.7 0.8 0.90
0.2
0.4
0.6
0.8
1
1.2
1.4
1.6
UncompensatedCompensated
Step Response
Time (seconds)
Am
plit
ud
e

Time0 0.5 1 1.5 2 2.5 3 3.5
Va
lue
0
0.2
0.4
0.6
0.8
1
1.2
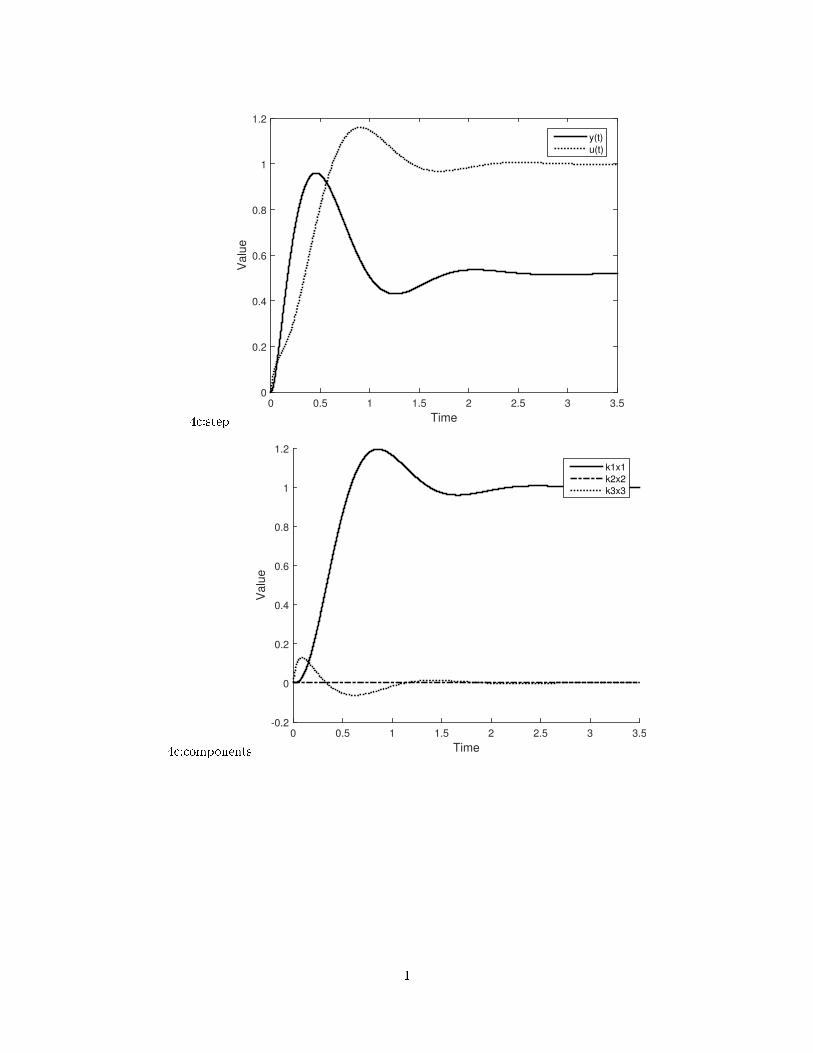
y(t)u(t)
Time
0 0.5 1 1.5 2 2.5 3 3.5
Valu
e
-0.2
0
0.2
0.4
0.6
0.8
1
1.2
k1x1
k2x2
k3x3


Recommended