Embed Size (px)
Citation preview


Bode Plot for G1(s) with Gain Margin (GM) and Phase Margin (øM)
Bode Plot for G2(s) with Gain Margin (GM) and Phase Margin (øM)
Mag
nitu
de (d
B)
-60
-50
-40
-30
-20
-10
0
10
10-1 100 101
Phas
e (d
eg)
-270
-225
-180
-135
-90
-45
0
Bode DiagramGm = 12 dB (at 1.73 rad/s) , Pm = 67.6 deg (at 0.766 rad/s)
Frequency (rad/s)
Mag
nitu
de (d
B)
-120
-100
-80
-60
-40
-20
0
20
10-2 10-1 100 101 102
Phas
e (d
eg)
-270
-225
-180
-135
-90
-45
0
Bode DiagramGm = 4.86 dB (at 1.73 rad/s) , Pm = 22.3 deg (at 1.38 rad/s)
Frequency (rad/s)

Bode Plot for G3(s) with Gain Margin (GM) and Phase Margin (øM)
Step Response for G1(s) and a 2nd order approximation of G1(s) in Unity Feedback (T1(s))
Mag
nitu
de (d
B)
-140
-120
-100
-80
-60
-40
-20
0
20
10-2 10-1 100 101 102 103
Phas
e (d
eg)
-270
-225
-180
-135
-90
-45
0
Bode DiagramGm = 19.9 dB (at 5.07 rad/s) , Pm = 89.4 deg (at 1.08 rad/s)
Frequency (rad/s)
0 2 4 6 8 10 12 14 16 180
0.1
0.2
0.3
0.4
0.5
0.6
0.7
0.8
0.9T1 (Original)T1 (2nd Order)
Step Response
Time (seconds)
Ampl
itude

Step Response for G2(s) and a 2nd order approximation of G2(s) in Unity Feedback (T2(s))
Step Response for G3(s) and a 2nd order approximation of G3(s) in Unity Feedback (T3(s))
0 5 10 15 20 25 30 35 400
0.2
0.4
0.6
0.8
1
1.2T2 (Original)T2 (2nd Order)
Step Response
Time (seconds)
Ampl
itude
0 0.5 1 1.5 2 2.5 3 3.5 4 4.50
0.1
0.2
0.3
0.4
0.5
0.6
0.7
0.8T3 (Original)T3 (2nd Order)
Step Response
Time (seconds)
Ampl
itude


Bode Plot for G(s) with Gain Margin (GM) and Phase Margin (øM)
Mag
nitu
de (d
B)
-160-140-120-100
-80-60-40-20
02040
10-4 10-3 10-2 10-1 100 101 102 103
Phas
e (d
eg)
-270
-225
-180
-135
-90
-45
0
Bode DiagramGm = 30.4 dB (at 7.11 rad/s) , Pm = 63.5 deg (at 0.921 rad/s)
Frequency (rad/s)

Bode Plot for GCG(s) with GC(s) = 10 (s / 0.03 + 1) / (s / 0.003 + 1).
Step Response for G(s) (eSS = 0.01) and GCG(s) (eSS = 0.001) in unity feedback.
Mag
nitu
de (d
B)
-150
-100
-50
0
50
100
10-4 10-3 10-2 10-1 100 101 102 103
Phas
e (d
eg)
-270
-225
-180
-135
-90
-45
0
Bode DiagramGm = 30 dB (at 6.99 rad/s) , Pm = 61.8 deg (at 0.921 rad/s)
Frequency (rad/s)
0 1 2 3 4 5 6 70
0.2
0.4
0.6
0.8
1
1.2TTc
Step Response
Time (seconds)
Ampl
itude
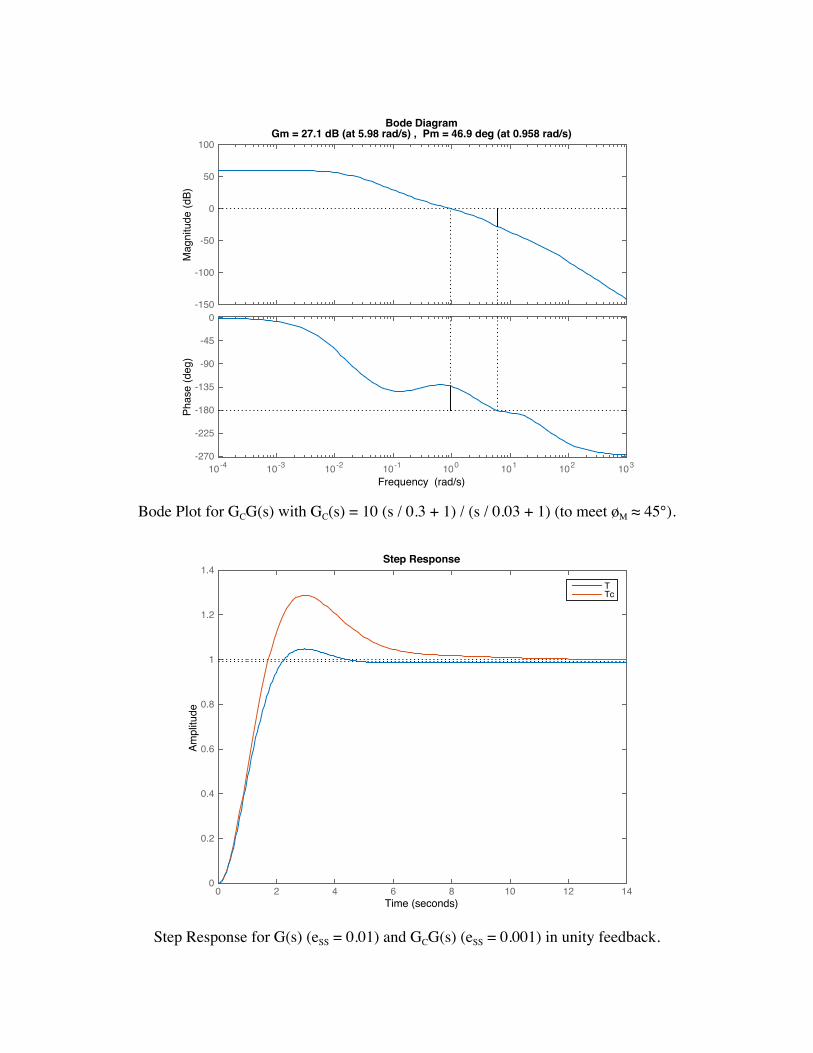
Bode Plot for GCG(s) with GC(s) = 10 (s / 0.3 + 1) / (s / 0.03 + 1) (to meet øM ≈ 45°).
Step Response for G(s) (eSS = 0.01) and GCG(s) (eSS = 0.001) in unity feedback.
Mag
nitu
de (d
B)
-150
-100
-50
0
50
100
10-4 10-3 10-2 10-1 100 101 102 103
Phas
e (d
eg)
-270
-225
-180
-135
-90
-45
0
Bode DiagramGm = 27.1 dB (at 5.98 rad/s) , Pm = 46.9 deg (at 0.958 rad/s)
Frequency (rad/s)
0 2 4 6 8 10 12 140
0.2
0.4
0.6
0.8
1
1.2
1.4TTc
Step Response
Time (seconds)
Ampl
itude


0 0.1 0.2 0.3 0.4 0.5 0.6 0.7 0.8 0.90
0.2
0.4
0.6
0.8
1
1.2
1.4
1.6
UncompensatedCompensated
Step Response
Time (seconds)
Am
plit
ud
e

Time0 0.5 1 1.5 2 2.5 3 3.5
Va
lue
0
0.2
0.4
0.6
0.8
1
1.2
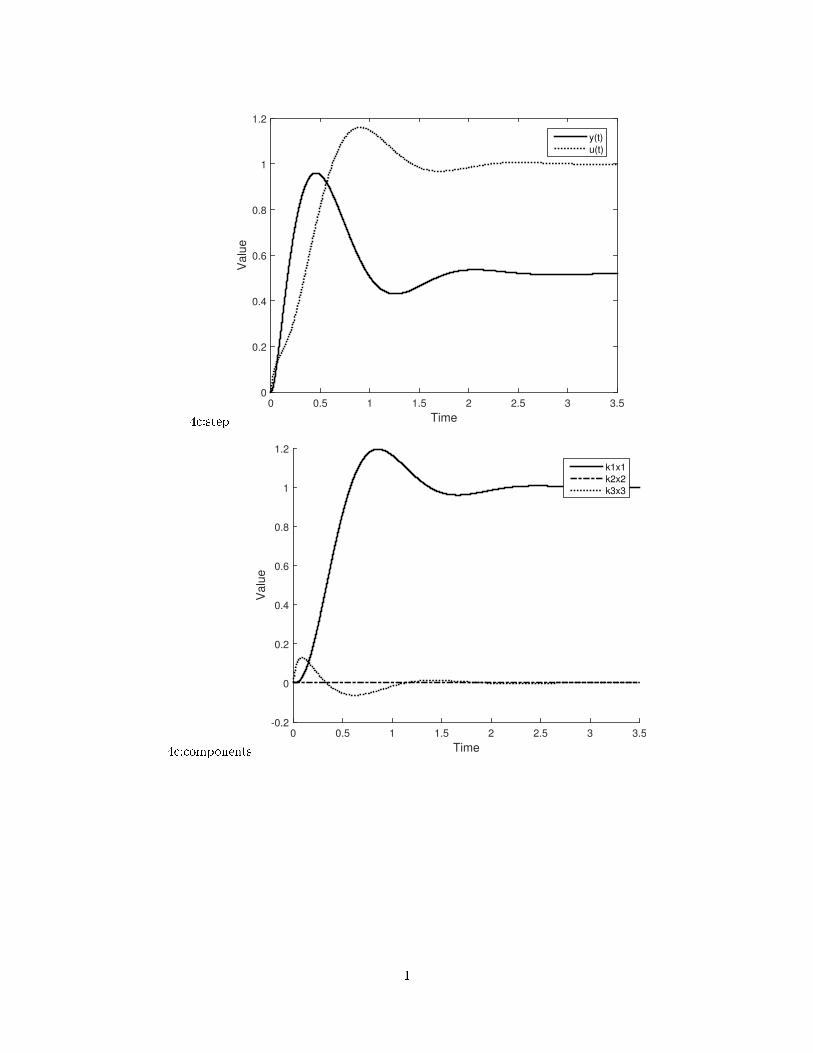
y(t)u(t)
Time
0 0.5 1 1.5 2 2.5 3 3.5
Valu
e
-0.2
0
0.2
0.4
0.6
0.8
1
1.2
k1x1
k2x2
k3x3