dcasip.medicine.duke.edu
Blood Culture Utilization MetricsRebekah Moehring, MD, MPHBobby Warren, MPS
Current practice: Question 1 Does your hospital routinely review or track Blood culture utilization
data?
Metrics of volume Who uses and reviews the data? Automated or manual tracking?
2

Current practice: Question 2 Does your hospital routinely review or track Blood culture
contamination data?
Metrics of skin contaminant pathogens Who uses and reviews the data? Automated or manual tracking?
3

What metrics and Best Practice standards are there? “I’m not aware of benchmarking recommendations for blood culture utilization /
denominator and imagine it would be hard to recommend or apply given the wide variation in bacteremia risk between clinical syndrome, populations, units, and institutions.”
CLSI M47 (5/2007, update pending) <3% BCx contamination rate – CAP Survey and IDSA GL for the Micro Lab Cumulative Techniques and Procedures in Clinical Microbiology (Cumitech)
from ASM (2005) Purpose: “to provide consensus recommendations regarding the judicious use of clinical
microbiology and immunology laboratories and their role in patient care.”
Others?
4

CLSI M47-A “Example QA Indicators” 10.1.1 Patient Evaluation “…every organization [should develop] guidelines to identify appropriate patients
for blood culture…” 10.1.2 Test Selection and Ordering Example QA Indicator 1: Proportion of patients with Blood Cultures who have the
recommended number of blood culture sets submitted. Collection of 2 or 3 blood culture sets is recommended per episode.
Example QA Indicator 2: Proportion of patients with more than the recommended number of blood cultures submitted. Collection of 2 or 3 blood culture sets is recommended per episode for the initial patient
evaluation. Collection of another 2 or 3 blood culture sets may be indicated after 48-72h if the initial
cultures were noninformative. “Surveillance” cultures are not recommended.
5
CLSI M47-A. May 2007

CLSI M47-A “Example QA Indicators” 10.1.3 Sample Collection Example QA Indicator 1: Blood culture contamination rate.
Goal is less than 3% whether analyzed overall or stratified by location, phlebotomist, etc.
Example QA Indicator 2: Proportion of blood culture bottles inoculated with more or less than the recommended volume of blood. Adults = 10mL recommended.
6

IDSA Guidelines on Use of the Microbiology Lab: BSI and Cardiovascular system Volume of blood collected, not timing, is most critical. Disinfect the venipuncture site with chlorhexidine or 2% iodine tincture in adults and
children >2 months old (chlorhexidine NOT recommended for children <2 months old), using povidone-iodine and alcohol).
Draw blood for culture before initiating antimicrobial therapy. Catheter-drawn blood cultures have a higher risk of contamination (false positives). Do not submit catheter tips for culture without an accompanying blood culture
obtained by venipuncture. Never refrigerate blood prior to incubation. Use a 2- to 3-bottle blood culture set for adults, at least 1 aerobic and 1 anaerobic;
use 1–2 aerobic bottles for children and consider aerobic and anaerobic when clinically relevant.
Streptococcus pneumoniae and other gram-positive organisms and facultatively anaerobic organisms may grow best in the anaerobic bottle (faster time to detection).
7
Miller et al. CID 2018:67
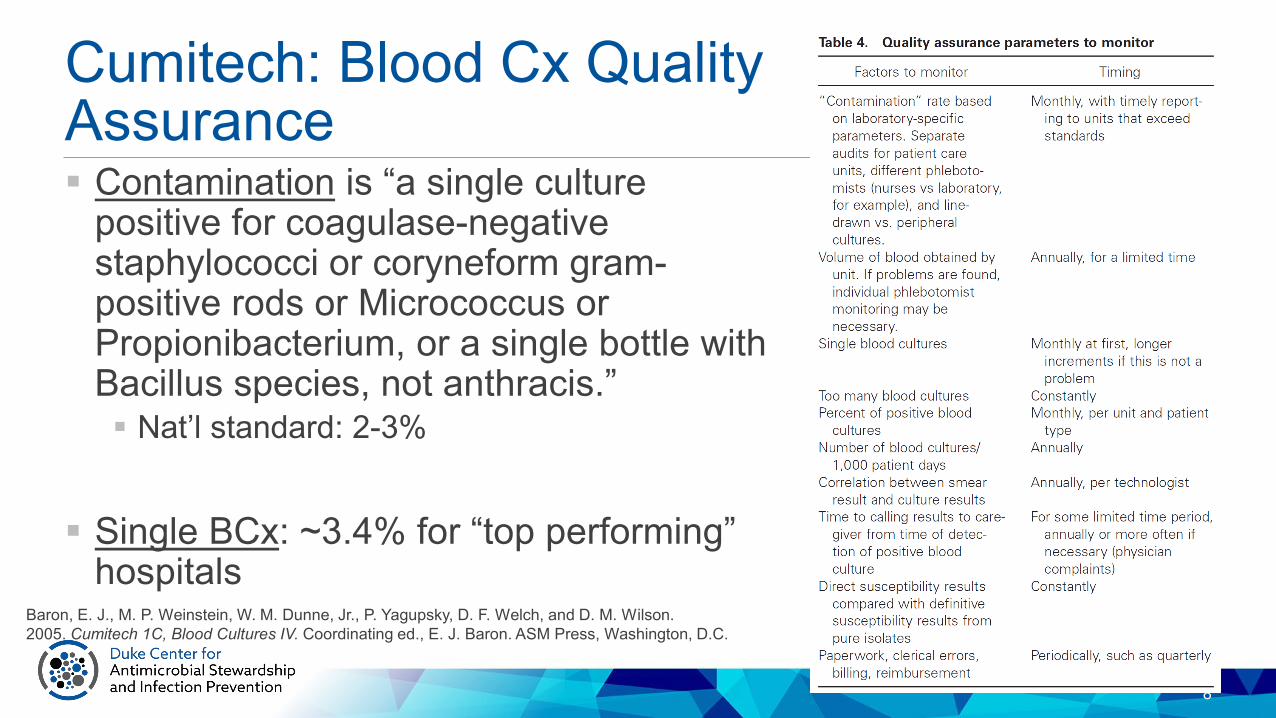
Cumitech: Blood Cx Quality Assurance
8
Baron, E. J., M. P. Weinstein, W. M. Dunne, Jr., P. Yagupsky, D. F. Welch, and D. M. Wilson.2005. Cumitech 1C, Blood Cultures IV. Coordinating ed., E. J. Baron. ASM Press, Washington, D.C.
Contamination is “a single culture positive for coagulase-negative staphylococci or coryneform gram-positive rods or Micrococcus or Propionibacterium, or a single bottle with Bacillus species, not anthracis.” Nat’l standard: 2-3%
Single BCx: ~3.4% for “top performing” hospitals

Cumitech: Blood Cx Quality Assurance
9
Percent positive: 7.7-8.2% (sample of 650 labs). Range cutoffs suggested for investigation of
BCx appropriateness: 5% and 15%.
BCx/1000ptd: hospital-level sample (1999) ranged between 103-188. “A number between these two extremes is
recommended.”
Baron, E. J., M. P. Weinstein, W. M. Dunne, Jr., P. Yagupsky, D. F. Welch, and D. M. Wilson.2005. Cumitech 1C, Blood Cultures IV. Coordinating ed., E. J. Baron. ASM Press, Washington, D.C.

Pediatric ICU: BCx guideline
10
Woods-Hill. JAMA Pediatrics 2017;171(2):157-164.
Hopkins PICU Before/After Study
Goals: Reduce BCx Use and Reduce BCx draws off of catheters
Intervention: 1. Fever/sepsis screening
checklist.2. BCx decision algorithm
Result: 16.1 vs 8.8 cultures per 100 ptd(46% reduction)

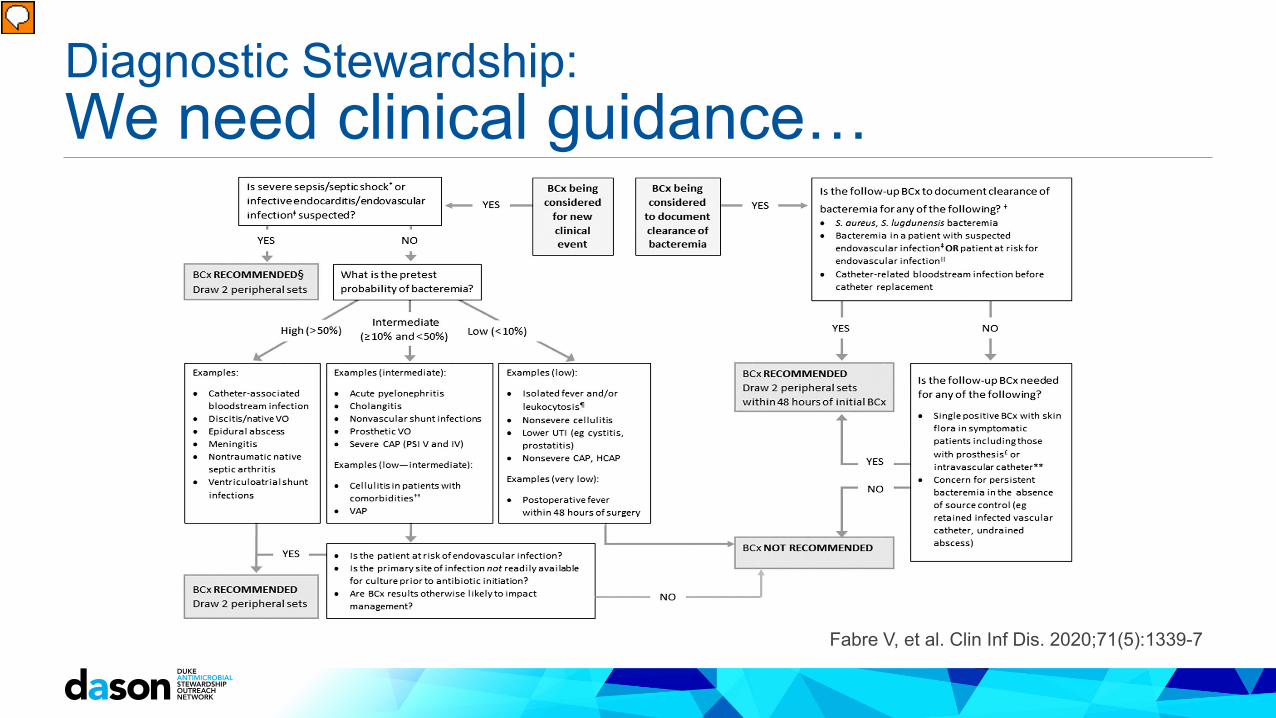
Diagnostic Stewardship: We need clinical guidance…
<5% (Very Low) <10% (Low) 10% - 20% (Low-Mod) 20% - 50% (Moderate) >50% (High)
Fever ≤48hrs of surgery
Uncomplicated cellulitis
Cellulitis in pts w severe comorbidities
CholangitisPyogenic liver
abscess
Discitis / VOEpidural abscess
Isolated fever on non-ICU ward Lower UTI VAP Acute pyelo Acute native septic
joints
CAP / HCAP Severe CAP Meningitis
Non-vascular shunt infections VP shunt infections
Severe sepsis Septic shock
Rigors in a febrile patient Catheter related BSI
Fabre V, et al. Clin Inf Dis. 2020;71(5):1339-7
Pretest probability of Bacteremia in Common Clinical Scenarios
Diagnostic Stewardship: We need clinical guidance…
Fabre V, et al. Clin Inf Dis. 2020;71(5):1339-7

Diagnostic Stewardship: We need clinical guidance… DISTRIBUTE study: Reduced BCx rates decreased from 27.7 to 22.8 BCx / 100 pt days in MICU Reduced 10.9 to 7.7 BCx / 100 pt days in the 5 medicine units No change in inappropriate BCx BCx positivity went up from 8 to 11%, P<0.001 in MICU Solitary BCx decreased by 21% Compliance with BCx component of the SEP-1 measure was similar on the
med units and actually improved in the MICU (not significant)
Fabre V, et al. J Clin Micro. Oct 2020
Conclusion: These results suggest that we can optimize the use of blood cultures with education and practice guidance without affecting
sepsis quality metrics

dcasip.medicine.duke.edu
Example Data: Blood Culture Utilization at Six Southeastern United States Hospitals

Overview Population: Six southeastern United States hospitals 1 academic (Hospital A) and 5 community hospitals (B-F) May 2019 to April 2020 Inpatient and ED blood cultures
Primary Outcome: Hospital-level blood culture utilization rate* Secondary Outcomes (based on observations from DETOURS
Trial): Day of the week – targeted AS opportunities? Seasonality – links with influenza season? Other available patient- or practice-level factors (e.g. age, unit)
15

Definitions Patient days – A count of the number of days for all patients in an
inpatient care location during the study time period. Inpatient location – Locations defined as inpatient by the CDC in
the instructions for mapping patient care locations excluding procedural, operating and perioperative, behavioral, rehabilitation, psychiatric units. Inpatient Admission – A distinct visit in a study hospital of at least
one calendar day on an inpatient unit.
16
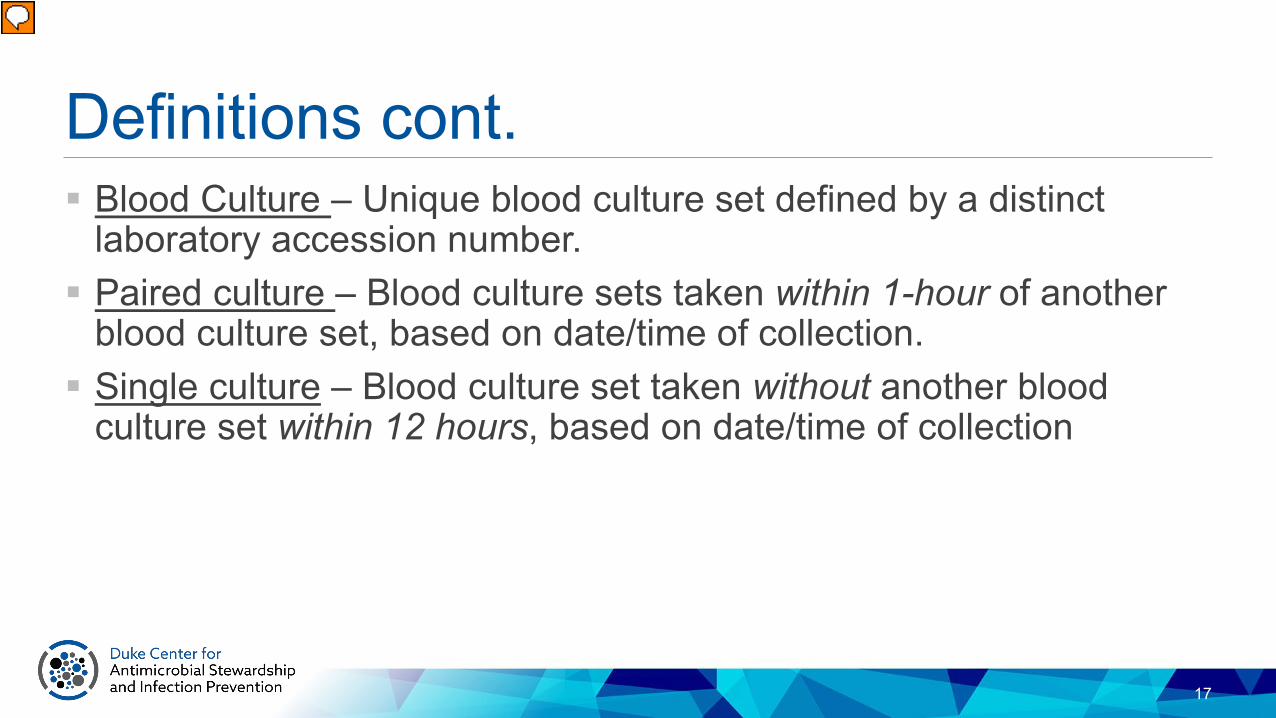
Definitions cont. Blood Culture – Unique blood culture set defined by a distinct
laboratory accession number. Paired culture – Blood culture sets taken within 1-hour of another
blood culture set, based on date/time of collection. Single culture – Blood culture set taken without another blood
culture set within 12 hours, based on date/time of collection
17

Definitions cont. Positive blood culture – Blood culture sets processed positive for an
organism considered to be a pathogen or positive for a common skin commensal*, in 1 of 1 (or more) blood cultures collected on separate date/time occasions. Blood culture contamination event – One of two, three, or more, blood
cultures collected in the same calendar day positive for a common skin commensal*, and not identified from a second or more blood culture on separate date/time occasion.
18
*Centers for Disease Control and Prevention, NHSN Bloodstream Infection Event (Central Line-Associated Bloodstream Infection and Non-central Line Associated Bloodstream Infection). Common Commensal List. January 2021. https://www.cdc.gov/nhsn/pdfs/pscmanual/4psc_clabscurrent.pdf

Blood Culture Utilization Rate (BCUR) Original metric: Blood cultures per 1,000 patient days Inflated when more paired cultures were taken -- practice that should be
encouraged! Sensitivity analysis: Minimal difference in clinical value within 12-hour
window
New metric: Blood culture events per 1,000 patient days Blood culture event: An initial blood culture and all subsequent drawn within
12 hours within an inpatient encounter
19

20
Age and Single Cultures
Pediatrics have different culturing practice than Adults.Only 1 hospital had peds.So…We excluded pediatrics from hospital-level comparisons.
IDSA Guidelines for Micro Lab Use CID 2018

21
Overall BCUR
NOTE: BCUR included cultures collected in the emergency department (ED) and inpatient areas divided by inpatient days.
Excluding pediatricsPooled Rate
Blood Culture Events Per 1,000 Patient Days 92.4
Blood Cultures Per 1,000 Patient Days 196.0

22
Overall Overalln (%)
N=52550Median Blood Culture Events Per Admission (Range) 1 (1-31)BCE with only a single culture 3594 (7)BCE that began in ED 28985 (55)BCE in first 3 HD 40400 (77)BCE after first 3 HD 11585 (22)
Overalln (%)
N=111520
Percent Positive Blood Cultures 8583 (7.7)Percent Contaminated Blood Cultures 2297 (2.1)Number of Initial Blood Cultures Collected after Initiation of Antibiotics 6596 (5.9)Number of Follow up Blood Cultures Collected after Initiation of Antibiotics 33628 (30.2)
Overall Blood Culture Event Data
Overall Blood Culture Data

23
Proportion of Blood Culture Events per Hospital Day
Skewed distribution mirrors LOS.

Hospital-Level Blood Culture Utilization Rate
24
Hospital A B C D E F Overall
Blood Cultures Per 1,000 Patient Days 168.3 206.3 533.3 261.6 126.5 248.5 196.0
Blood Culture Events Per 1,000 Patient Days 84.9 97.7 154.8 123.5 63.5 124.2 92.4
0
100
200
300
400
500
600
A B C D E F Overall
BCU
R
Hospital
BCUR by Hospital and Numerator
Cultures Per 1,000 Patient Days Events Per 1,000 Patient Days

Hospital-Level Blood Culture Event Data
HospitalA
n (%)N=20883
Bn (%)
N=3592
Cn (%)
N=3954
Dn (%)
N=6307
En (%)
N=8606
Fn (%)
N=9208
Overalln (%)
N=52550
Median Blood Culture Events Per Admission (Range) 1 (1-31) 1 (1-5) 1 (1-5) 1 (1-6) 1 (1-11) 1 (1-6) 1 (1-31)
Events with ≥ 1 Paired Culture 16162 (78) 2887 (80) 3887 (98) 5924 (94) 7974 (93) 7848 (85) 44682 (85)Events with only a Single culture 2489 (12) 220 (6) 61 (2) 231 (4) 275 (3) 318 (3) 3594 (7)Events that Began in ED 7952 (38) 2637 (73) 2434 (62) 4702 (75) 4056 (47) 7204 (78) 28985 (55)BCE in First 3 HD 12950 (62) 3344 (93) 3647 (92) 5622 (89) 6401 (74) 8436 (82) 40400 (77)BCE after First 3 HD 7563 (36) 241 (7) 290 (7) 649 (10) 2099 (24) 753 (8) 11585 (22)
25

Hospital-Level Blood Culture Data
HospitalA
n (%)N=41365
Bn (%)
N=7585
Cn (%)
N=13625
Dn (%)
N=13356
En (%)
N=17162
Fn (%)
N=18427
Overalln (%)
N=111520
Percent Positive Blood Cultures 3481 (8.4) 343 (4.5) 954 (7.0) 1203 (9.0) 1537 (9.0) 1065 (5.8) 8583 (7.7)Percent Contaminated Blood Cultures 626 (1.5) 145 (1.9) 418 (3.1) 425 (3.2) 216 (1.3) 467 (2.5) 2297 (2.1)Number of Initial Blood Cultures Collected after Initiation of Antibiotics 2476 (5.9) 403 (5.3) 480 (3.5) 756 (5.7) 1454 (8.5) 1027 (5.6) 6596 (5.9)Number of Follow up Blood Cultures Collected after Initiation of Antibiotics 16931 (40.7) 1347 (17.8) 3103 (22.8) 2361 (17.7) 5541 (32.3) 4345 (23.6) 33628 (30.2)
26
27
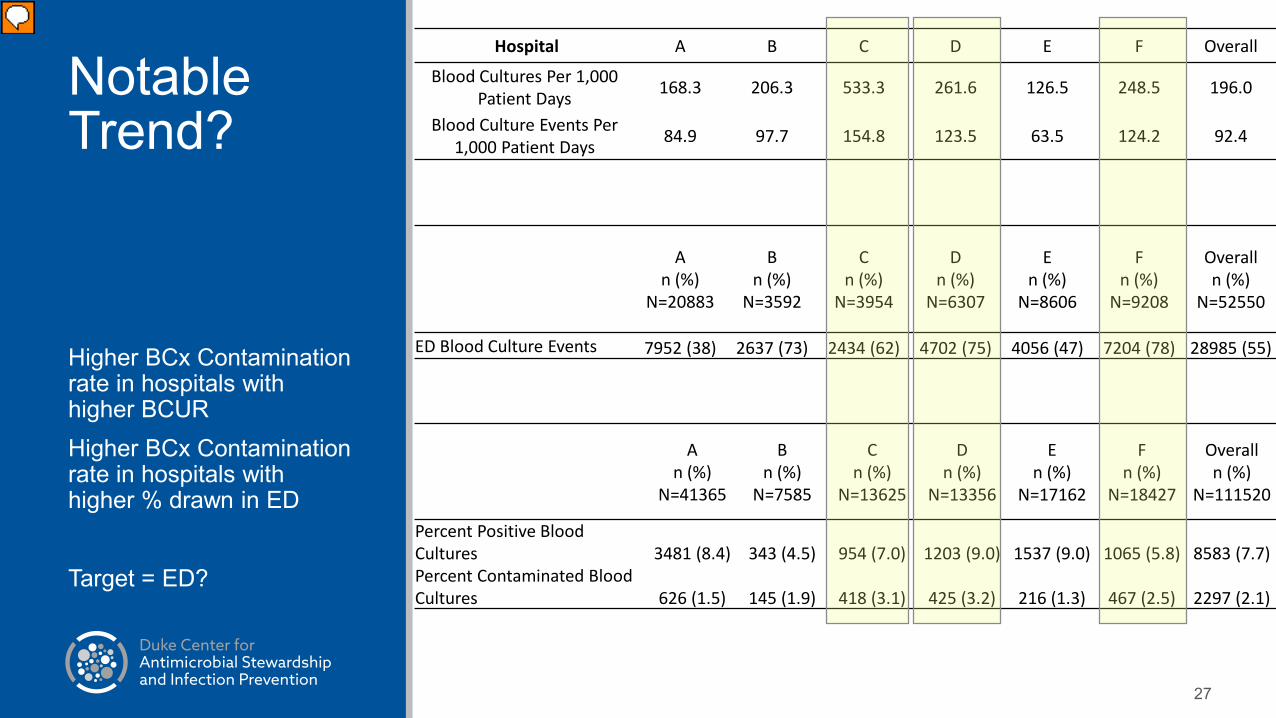
Notable Trend?
Higher BCx Contamination rate in hospitals with higher BCURHigher BCx Contamination rate in hospitals with higher % drawn in ED
Target = ED?
Hospital A B C D E F Overall
Blood Cultures Per 1,000 Patient Days 168.3 206.3 533.3 261.6 126.5 248.5 196.0
Blood Culture Events Per 1,000 Patient Days 84.9 97.7 154.8 123.5 63.5 124.2 92.4
An (%)
N=20883
Bn (%)
N=3592
Cn (%)
N=3954
Dn (%)
N=6307
En (%)
N=8606
Fn (%)
N=9208
Overalln (%)
N=52550
ED Blood Culture Events 7952 (38) 2637 (73) 2434 (62) 4702 (75) 4056 (47) 7204 (78) 28985 (55)
An (%)
N=41365
Bn (%)
N=7585
Cn (%)
N=13625
Dn (%)
N=13356
En (%)
N=17162
Fn (%)
N=18427
Overalln (%)
N=111520
Percent Positive Blood Cultures 3481 (8.4) 343 (4.5) 954 (7.0) 1203 (9.0) 1537 (9.0) 1065 (5.8) 8583 (7.7)Percent Contaminated Blood Cultures 626 (1.5) 145 (1.9) 418 (3.1) 425 (3.2) 216 (1.3) 467 (2.5) 2297 (2.1)
28
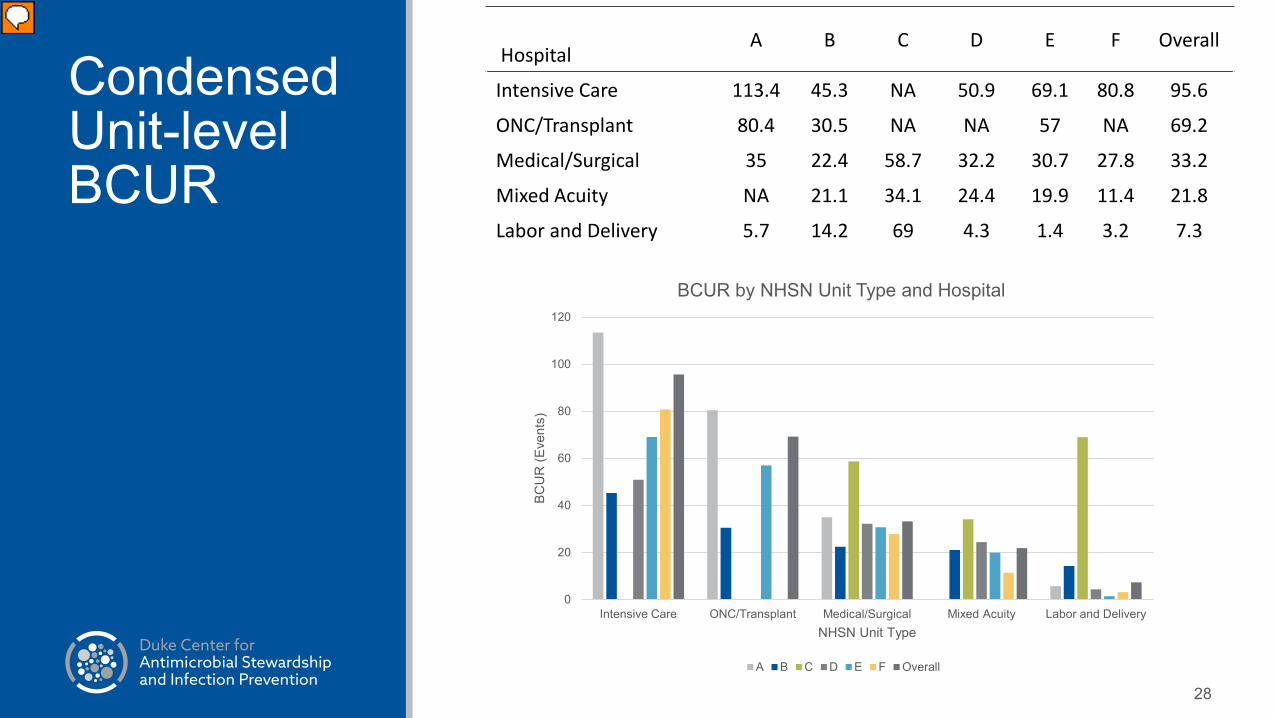
Condensed Unit-level BCUR
HospitalA B C D E F Overall
Intensive Care 113.4 45.3 NA 50.9 69.1 80.8 95.6
ONC/Transplant 80.4 30.5 NA NA 57 NA 69.2
Medical/Surgical 35 22.4 58.7 32.2 30.7 27.8 33.2
Mixed Acuity NA 21.1 34.1 24.4 19.9 11.4 21.8
Labor and Delivery 5.7 14.2 69 4.3 1.4 3.2 7.3
0
20
40
60
80
100
120
Intensive Care ONC/Transplant Medical/Surgical Mixed Acuity Labor and Delivery
BCU
R (E
vent
s)
NHSN Unit Type
BCUR by NHSN Unit Type and Hospital
A B C D E F Overall
29
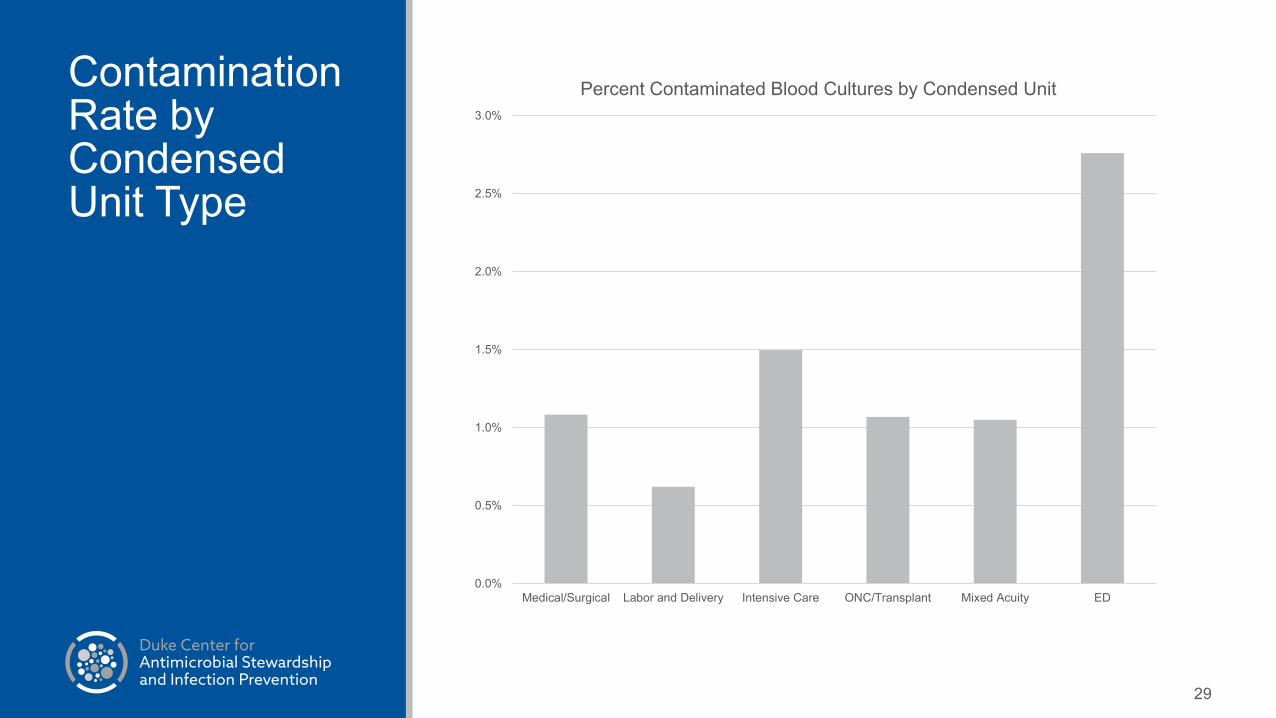
Contamination Rate by Condensed Unit Type
0.0%
0.5%
1.0%
1.5%
2.0%
2.5%
3.0%
Medical/Surgical Labor and Delivery Intensive Care ONC/Transplant Mixed Acuity ED
Percent Contaminated Blood Cultures by Condensed Unit

30
Proportion of Contaminated Cultures by Condensed Unit
Medical/Surgical10%
Labor and Delivery0%
Intensive Care9%
ONC/Transplant3%
Mixed Acuity1%
ED77%
Proportion of Contaminated Cultures by Condensed Unit
Medical/Surgical Labor and Delivery Intensive Care ONC/Transplant Mixed Acuity ED
31
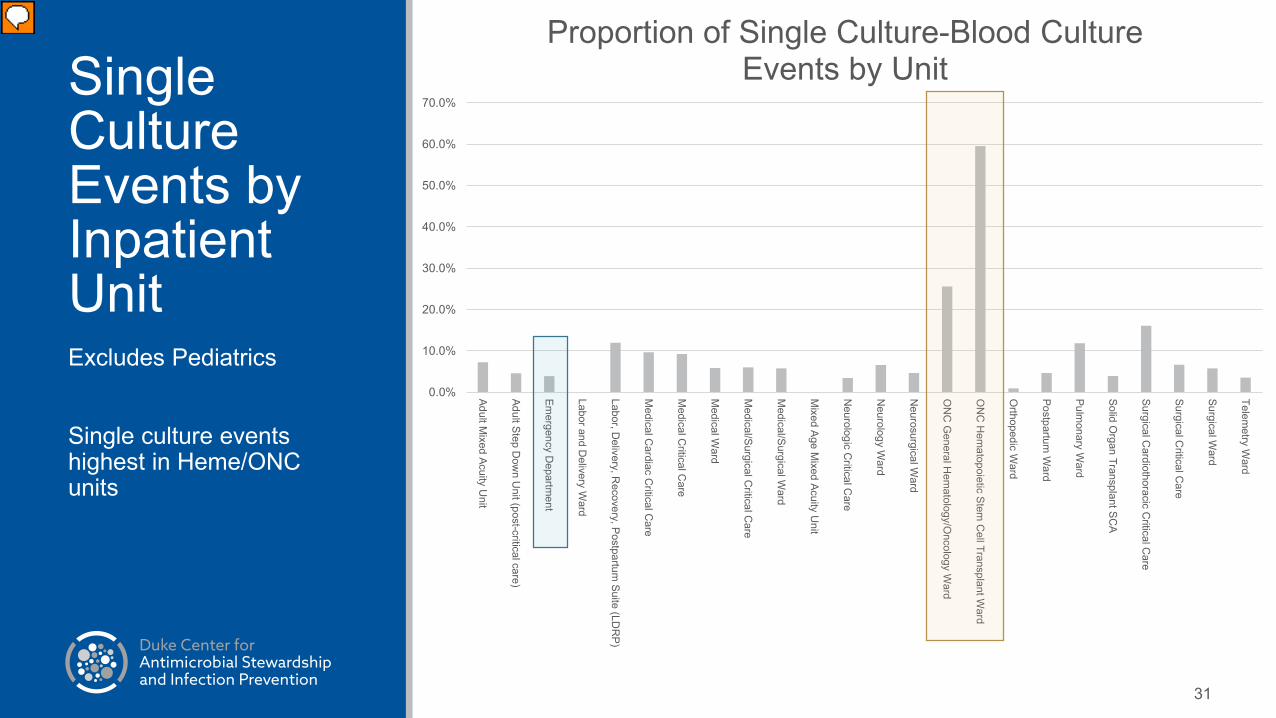
Single Culture Events by Inpatient UnitExcludes Pediatrics
Single culture events highest in Heme/ONC units
0.0%
10.0%
20.0%
30.0%
40.0%
50.0%
60.0%
70.0%
Adult Mixed Acuity U
nit
Adult Step Dow
n Unit (post-critical care)
Emergency D
epartment
Labor and Delivery W
ard
Labor, Delivery, R
ecovery, Postpartum Suite (LD
RP)
Medical C
ardiac Critical C
are
Medical C
ritical Care
Medical W
ard
Medical/Surgical C
ritical Care
Medical/Surgical W
ard
Mixed Age M
ixed Acuity Unit
Neurologic C
ritical Care
Neurology W
ard
Neurosurgical W
ard
ON
C G
eneral Hem
atology/Oncology W
ard
ON
C H
ematopoietic Stem
Cell Transplant W
ard
Orthopedic W
ard
Postpartum W
ard
Pulmonary W
ard
Solid Organ Transplant SC
A
Surgical Cardiothoracic C
ritical Care
Surgical Critical C
are
Surgical Ward
Telemetry W
ardProportion of Single Culture-Blood Culture
Events by Unit
32
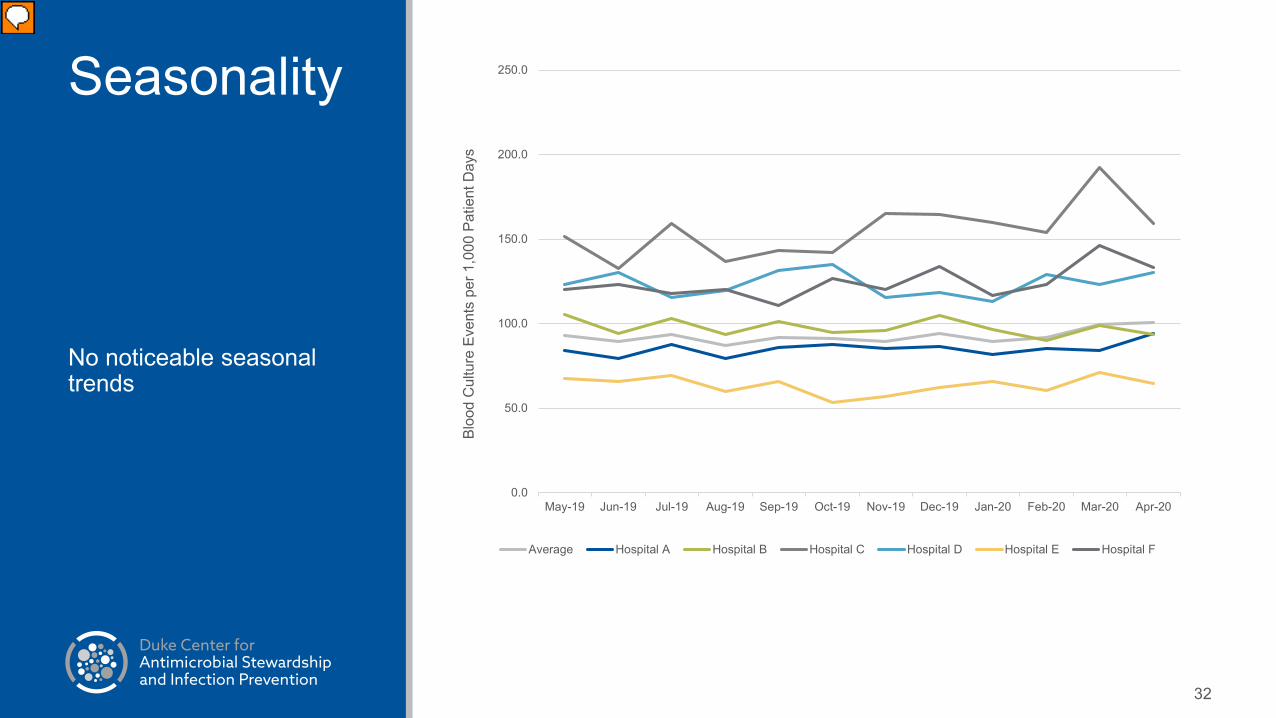
Seasonality
No noticeable seasonal trends
0.0
50.0
100.0
150.0
200.0
250.0
May-19 Jun-19 Jul-19 Aug-19 Sep-19 Oct-19 Nov-19 Dec-19 Jan-20 Feb-20 Mar-20 Apr-20
Bloo
d C
ultu
re E
vent
s pe
r 1,0
00 P
atie
nt D
ays
Average Hospital A Hospital B Hospital C Hospital D Hospital E Hospital F

33
Day of the Week
Relatively high number of events on Mondays
Lower on weekends
However…
93.2
102.8
97.396.7
93.5
96.5
92.4
86.0
88.0
90.0
92.0
94.0
96.0
98.0
100.0
102.0
104.0
Sunday Monday Tuesday Wednesday Thursday Friday Saturday
Bloo
d C
ultu
re E
vent
s pe
r 1,0
00 P
atie
nt D
ays

34
Day of the Week
Monday/Weekend pattern driven by ED
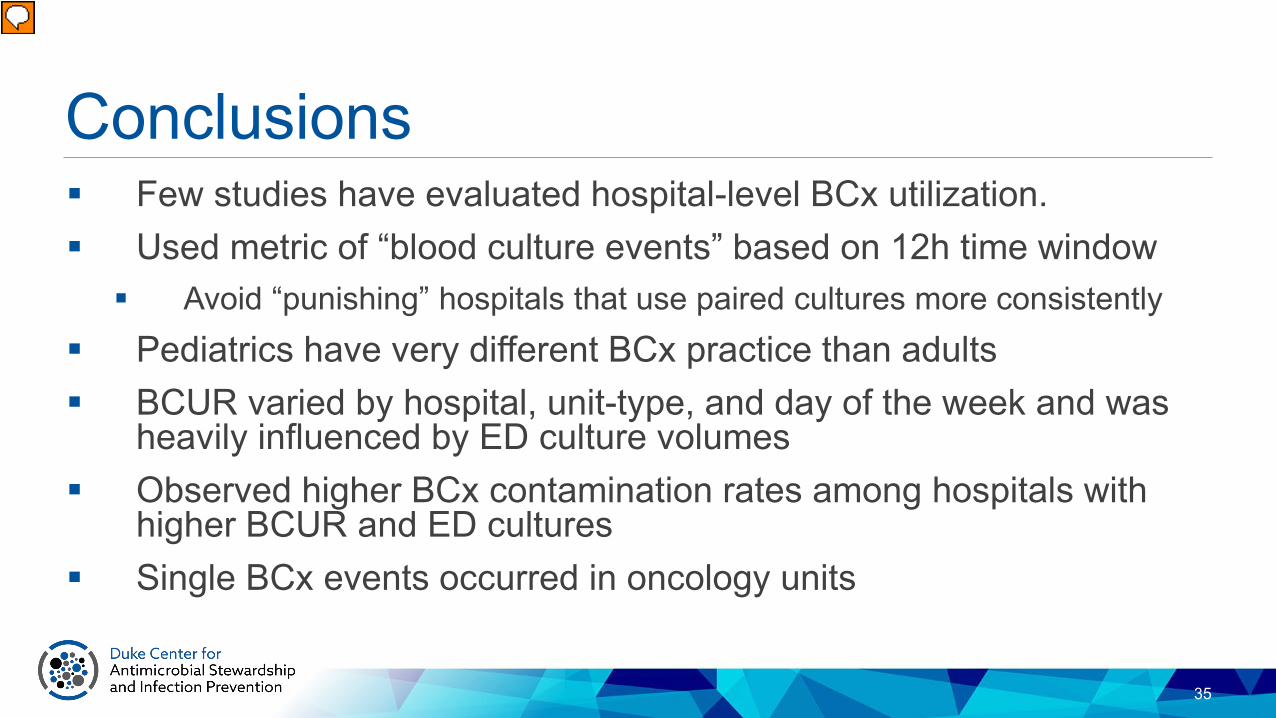
Conclusions Few studies have evaluated hospital-level BCx utilization. Used metric of “blood culture events” based on 12h time window Avoid “punishing” hospitals that use paired cultures more consistently
Pediatrics have very different BCx practice than adults BCUR varied by hospital, unit-type, and day of the week and was
heavily influenced by ED culture volumes Observed higher BCx contamination rates among hospitals with
higher BCUR and ED cultures Single BCx events occurred in oncology units
35

Discussion Question 1 What metric(s) “spoke” to you the most in reviewing hospital-level data?
What do you find to be meaningful?
Overall Blood cultures/ 1,000 patient days Blood culture events/ 1,000 patient days % ED % drawn from catheters Antibiotics prior to blood culture Single blood culture events Unit-level stratified utilization rates or Single BCx events
36

Discussion Question 2 Do hospital comparisons help? What if there is minimal adjustment for patient mix?
Factors that can influence BCx utilization: Age Unit-type Diagnosis Acuity Others?
37

Discussion Questions 3 What group would you want to take blood culture utilization and/or
contamination data back to for discussion and planning? What if your hospital is ALREADY at the national goal <3%? Do you think the ED should be separated from the hospital in
comparative analyses?
38

Discussion Question 4 What data feedback strategies have you used for BCx utilization or
contamination data at your hospital?
More details to come in the “Success Stories” Session
39

Contaminated Blood Cultures

Contaminated Blood Cultures

Contaminated Blood Cultures – by collector

43
Recommended