Embed Size (px)
Citation preview
CONFIDENTIAL ©2014 PAREXEL INTERNATIONAL CORP. ALL RIGHTS RESERVED.
Quality Metrics for BioPharma
and DevicesCarmen Medina, MPH, Ph.D. ( c )
Vice President, Technical Services
Former FDA Investigator
Mark Matis, Principal Consultant
PAREXEL International
Machelle Eppler, Principal Consultant
PAREXEL International

Roadmap
Understanding FDA’s Quality Metrics Initiative
• Links to FDA Safety and Innovation Act (FDASIA) and cGMPs for the 21st
Century: A Risk-Based Approach
• Compliance Requirements & Consequences of Not Complying
• Pilot Program:
– Risk-based Scheduling
– Blinded industry comparisons
Developing Advanced Quality Metrics for Product Quality Lifecycle
• FDA’s six system inspection elements
• Lagging versus future quality indicators.
• Triggers: BPDRs, FARs, Recalls and APRs
• Cost-effectively track and evaluate key metrics company-wide
2

Roadmap
Link to Lifecycle Process Validation
• Trend critical quality attributes and process parameters
• Establish alert and action limits
Alternative Metrics
• Key quality systems and their effectiveness
• Measure Quality Culture Index
Advanced Quality Metrics
• Business Analytics (BA)
• Pareto Principle and Trend Charting
Industry Case Study
• Machelle’s slides
Group Exercise
• Break into three groups: Bio; device and pharma3
Roadmap
Understanding FDA’s Quality Metrics Initiative
4
FDA’s Intentions
• Expects program will reduce surveillance inspections
• Focus on firms with known problems and risks
• Increase cadre of specialized investigators
• Risk-based FDA work-plans and inspection scheduling Early resolution of quality problems
• Reduce adverse events; MDRs, SAEs, and drug shortages
• FDA establishing infrastructure needed to support program, data analysis, and data comparisons
Major Implications for CMO and contract lab oversight.
5
FDA’s Intentions
• FDA may require the submission of data and information inadvance, or in lieu, of an inspection.
• FDA expects quality metrics to be objective and meaningfulin assessing overall state of processes, product quality, andquality systems.
• FDA intends to use quality metrics to measure the inherentrisk of a site and its products, with the goal of improving drugquality and preventing drug shortages.
Currently CBER and CDER focused, can be expanded to devices.
6
FDA’s Intentions
• Data provided will be verified during on-site inspections. (Beware of inconsistencies).
• FDA expects quality metrics, in conjunction with trigger data,
will provide an accurate backdrop of a firm’s quality culture.
• Linked to two key FDA Initiatives:
– Pharmaceutical cGMPs for the 21st Century: A Risk-Based Approach
– FDA Safety and Innovation Act (FDASIA)
• Non-complying firms = earlier inspections
• Pilot Program
– Will attempt blinded industry comparisons
7

FDA’s Intentions
• Quality Metrics to consider:– Lot Acceptance Rate
– Rework and Reprocessing Rate– Product Quality Complaint Rate
– Confirmed and Invalidated Out-of-Specification (OOS) Rates
– On time rates of Annual Product Review (APR) or Product Quality Review (PQR)
• QM must include relevant process trends and quality ofincoming materials or components, in-process materials,and finished products.
Data should be statistically trended and reviewed by trained personnel.
8
FDA’s Intentions
Lot acceptance rate:– The number of lots attempted of the product.
– The number of specification-related rejected lots of theproduct, rejected during or after manufacturing.
– The number of attempted lots pending disposition formore than 30 days. (Deviations /non-conformances)
– The number of OOS results for the product, includingstability testing.
– The number of lot release and stability tests conductedfor the product.
– The number of OOS results for lot release and stabilitytests for the product that is invalidated due to lab error.
9
FDA’s Intentions
• Quality attributes related to all aspects of the operation:facilities, utilities, equipment, processes, quality data(complaints, recalls, returns, laboratory investigations, etc.
• Enterprise-wide quality metrics that shift overall mindset atall levels of the company towards customer-orientedculture.
Proactive tracking of key metrics throughout all levels of the company.
10
FDA’s Intentions
• Correlation of data, such as EM excursions with bioburden failures; deviations against complaints, OOS results against specification drift, etc.
• Robust quality systems:– Meaningful data and meta-data
– Trending
• Expect to submit one report for each FP, and eachAPI; including QM from each establishmentgenerating requested data.
• Combine the data so that a single report is submittedfor each Finished Drug / API.
11
FDA’s Intentions
• Firms not included:
– Blood and blood components for transfusion
– Vaccines
– Cell therapy products
– Gene therapy products
– Allergenic extracts
– Human cells & tissues
– Cellular and tissue based products
– Non-recombinant versions of plasma derived products.
12
FDA’s Intentions
• Reporting expectations:
– Reports would be submitted within 60 days of the enddate of the reporting period. For example, if the requestscalled data for the period October 1, 2016 to September30, 2017, data reports would be due by December 1,2017. Via FDA Electronic Submissions Gateway (ESG)
13
Roadmap
Developing Advanced Quality Metrics for Product Quality Lifecycle
14

Link to FDA’s Inspection Metrics
• FDA’s six system inspection elements:– Batch Rejection Rate
– Rework and Reprocessing Rate
– Confirmed out of Specification (OOS) Rate
– Un-confirmed OOS Rate
– “Critical” Complaint Rate
– % Annual Product Quality Reviews Completed on time
All lagging quality indicators.
15
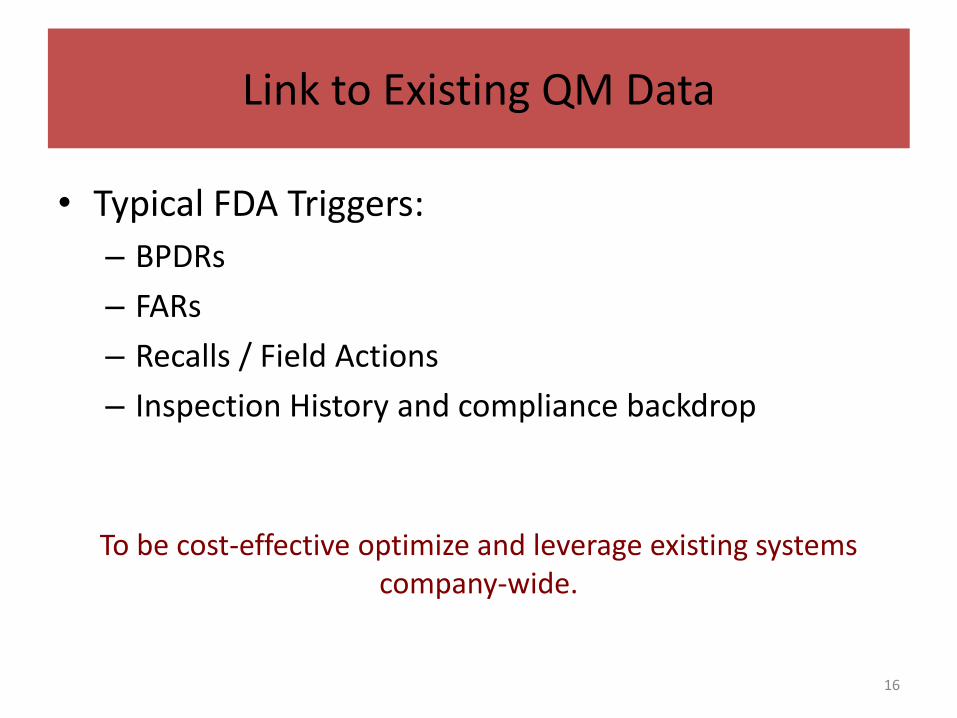
Link to Existing QM Data
• Typical FDA Triggers:
– BPDRs
– FARs
– Recalls / Field Actions
– Inspection History and compliance backdrop
To be cost-effective optimize and leverage existing systems company-wide.
16
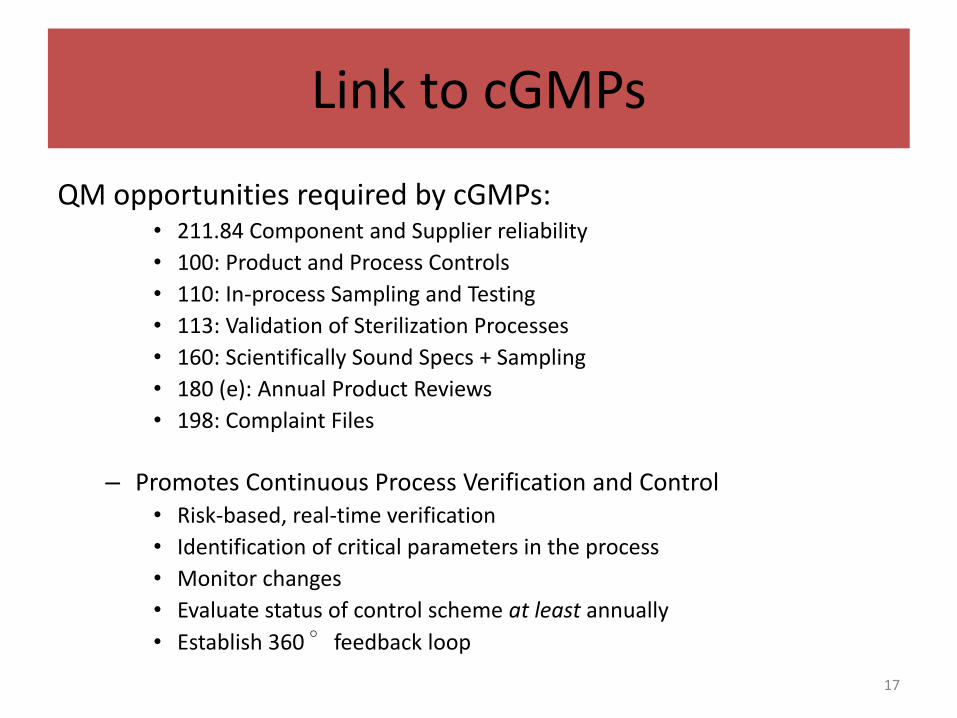
Link to cGMPs
QM opportunities required by cGMPs:• 211.84 Component and Supplier reliability
• 100: Product and Process Controls
• 110: In-process Sampling and Testing
• 113: Validation of Sterilization Processes
• 160: Scientifically Sound Specs + Sampling
• 180 (e): Annual Product Reviews
• 198: Complaint Files
– Promotes Continuous Process Verification and Control• Risk-based, real-time verification
• Identification of critical parameters in the process
• Monitor changes
• Evaluate status of control scheme at least annually
• Establish 360°feedback loop
17
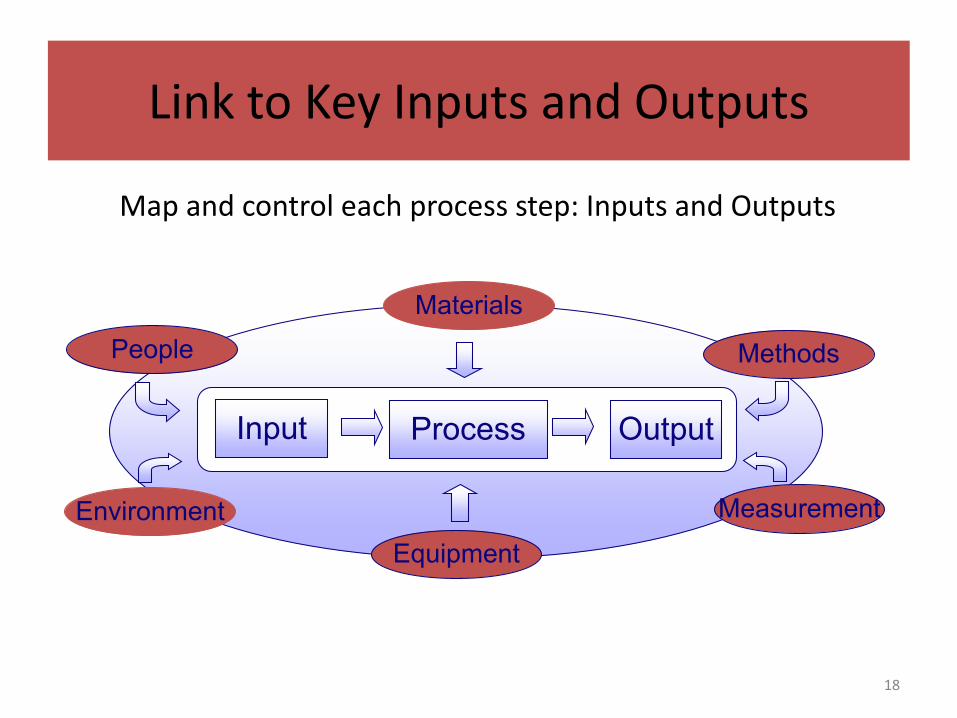
Process Characterization
Map and control each process step: Inputs and Outputs
Materials
MethodsPeople
Environment
Equipment
Measurement
Input Process Output
Link to Key Inputs and Outputs
18
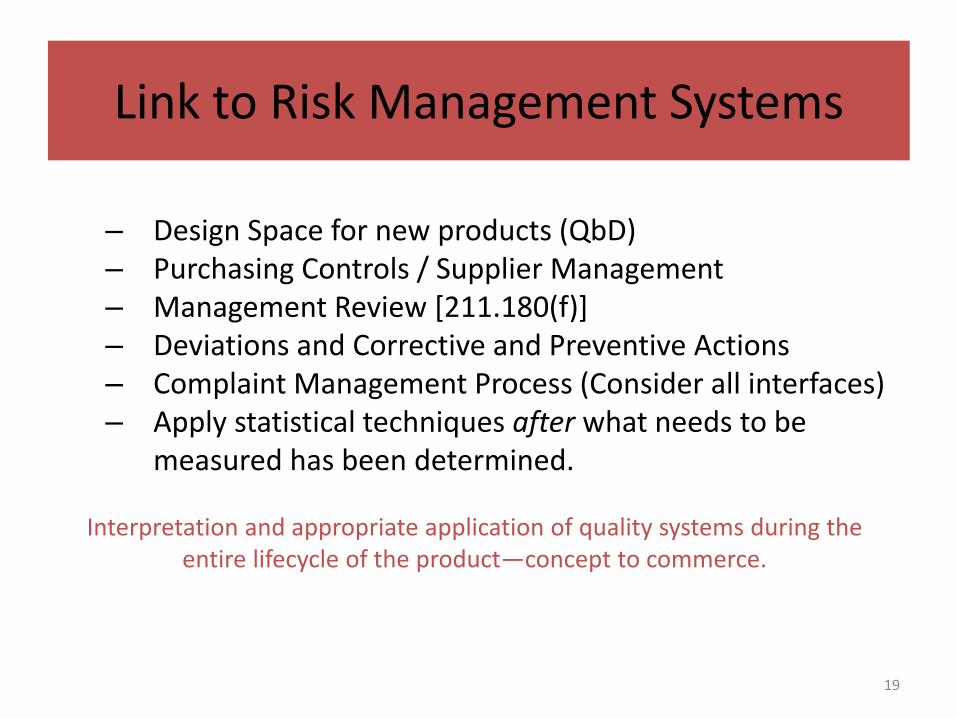
Link to Risk Management Systems
– Design Space for new products (QbD)– Purchasing Controls / Supplier Management – Management Review [211.180(f)]– Deviations and Corrective and Preventive Actions– Complaint Management Process (Consider all interfaces)– Apply statistical techniques after what needs to be
measured has been determined.
Interpretation and appropriate application of quality systems during the entire lifecycle of the product—concept to commerce.
19

Roadmap
Link to Lifecycle Process Validation
20
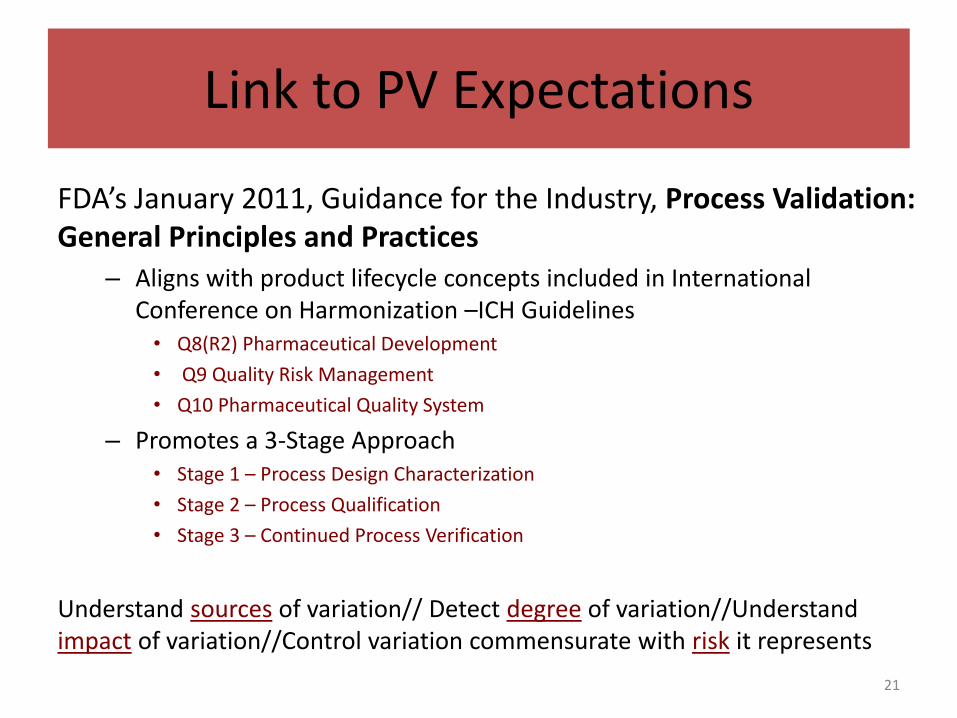
Link to PV Expectations
FDA’s January 2011, Guidance for the Industry, Process Validation: General Principles and Practices
– Aligns with product lifecycle concepts included in International Conference on Harmonization –ICH Guidelines • Q8(R2) Pharmaceutical Development
• Q9 Quality Risk Management
• Q10 Pharmaceutical Quality System
– Promotes a 3-Stage Approach• Stage 1 – Process Design Characterization
• Stage 2 – Process Qualification
• Stage 3 – Continued Process Verification
Understand sources of variation// Detect degree of variation//Understand impact of variation//Control variation commensurate with risk it represents
21

Link to PV Expectations
Forward Quality Indicators: • Trend critical quality attributes (CQAs) and process
parameters (CPPs)
• Monitor Control Range: The ability of the control system to regulate a defined set point.
• Key Process Parameter (KPP): A process parameter that, when varied within the Characterization Range, has a significant impact on process consistency or on a key or critical performance attribute.
• Establish alert and action limits
Gauge process capability feedback loop.
22
Roadmap
Consider Alternative Metrics
23

Quality Metrics
• Alternative Metrics– Company Quality Index
– Senior Management Engagement
– CAPA Effectiveness
– Process Capabilities/Performance
– Right First Time
– % GMP training on time
– Unplanned Down Time
– On Hold Batch Rate / Quality Holds
– Method Variability
– Incidents versus Deviations and non-conformances
24
Roadmap
Advanced Quality Metrics
• Business Analytics (BA)
• Trend Charting
• Pareto Principle and Charts
25
Advanced Quality Metrics
Business Analytics (BA):
• Refers to the skills, technologies, practices for continuous iterative exploration and investigation of past business performance to gain insight and drive business planning:
– Develops new insights of performance based on data
– Uses statistical analysis, including explanatory and predictive modeling, and fact-based management to drive decision making
Drives human or fully automated decisions.
26

Advanced Quality Metrics
In other words, data that can answer questions such as:
– What happened? How many? How often? Where is theproblem? What actions are needed? Why is this happening?What if these trends continue? What will happen next?What is the best possible outcome?
Offers Predicative and Optimization opportunities!
• Business analytics require sufficient volumes of high quality data, but, difficult to:– Ensure data quality is integrating and reconciling data across different
systems
– Decide what subsets of data to make available
27

Advanced Quality Metrics
Types of analytics:
– Decisive Analytics: Supports human decisions with visual analytics the user models to reflect reasoning.
– Descriptive Analytics: Gain insight from historical data with reporting, scorecards, clustering, etc.
– Predictive Analytics: Predictive modeling using statistical and machine learning techniques
– Prescriptive Analytics: Recommend decisions using optimization, simulation, etc.
28
Advanced Quality Metrics
Business Analytics aligns with FDA’s Quality Metrics:
• Compare present with past; forecast into the future.
• Monitor and identify trends (positive or negative) that impact business processes and product quality and continuity.
Think about vaccines and the current egg supply.
• Continuous Improvement
Cannot scale in a controlled manner without knowing processes capabilities.
29

Advanced Quality Metrics
Process Capability: • A process is a unique combination of tools, materials, methods, and
people engaged in producing a measurable output.
• All processes have inherent statistical variability which can be evaluated by statistical methods.
The process capability is a measurable property of a process to thespecification, expressed as a process capability (Cpk or Cpm) or processperformance index (Ppk or Ppm). The output of this measurement isusually illustrated by a histogram and calculations that predict howmany parts will be produced out of specification. The process capabilityindex is the ability of a process to produce output within specificationlimits. The concept of process capability only holds meaning forprocesses that are in a state of statistical control.
30
Advanced Quality Metrics
Two parts of process capability: 1) Measure the variability of the output of a process2) Compare that variability with a proposed specification or
product tolerance
• The input of a process usually has at least one or more measurable characteristics that are used to specify outputs. These can be analyzed statistically; where the output data shows a normal distribution the process can be described by the process mean (average) and the standard deviation.
• A process needs to be established with appropriate process controls in place. A control chart analysis is used to determine whether the process is in statistical control. If the process is not in statistical control then capability has no meaning. Therefore, the process capability involves only common cause variation and not special cause variation.
31
Advanced Quality Metrics
Capability Study:• The output of a process is expected to meet customer requirements,
specifications, or engineering tolerances. Engineers can conduct a processcapability study to determine the extent to which the process can meetthese expectations.
• The ability of a process to meet specifications can be expressed as a singlenumber using a process capability index or it can be assessed using controlcharts. Either case requires running the process to obtain enoughmeasurable outputs so that engineering is confident that the process isstable and so that the process mean and variability can be reliablyestimated.
• Statistical process control defines techniques to properly differentiatebetween stable processes, processes that are drifting (experiencing a long-term change in the mean of the output), and processes that are growingmore variable.
32

Advanced Quality Metrics
Trend Charting for Quality Metrics:• Average, standard deviation with historical data to set
objectives for CAPA and complaint aging, training compliance, change control and deviation aging.
• Risk Assessment Tools:– Cause and Effect Diagram (‘fishbone’, Ishikawa diagram)
– Check Sheet (at point qualitative or quantitative real time data collection)
– Control Chart (Statistical Process Control (SPC) charts)
– Histogram (probable distribution)
– Pareto Charts (highest frequency in a set of factors)
– Scatter diagram (display data with two variable values)
– Stratification (sampling from populations/sub populations, variance reduction)
33
Advanced Quality Metrics
Pareto Chart:In 1896, as the chair of Political Economy at the University of Lausanne (Switzerland), Vilfredo Pareto observed:
• 80% of the property in Italy was owned by 20% of the people
• He developed the principle by observing that 20% of the peapods in his garden contained 80% of the peas
Later generalized by Juran as the Pareto Principle or 80-20 rule:
• 20% of process parameters are responsible for 80% of process control.
• 20% of deviations are causing 80% of problems.
34
Advanced Quality Metrics
35
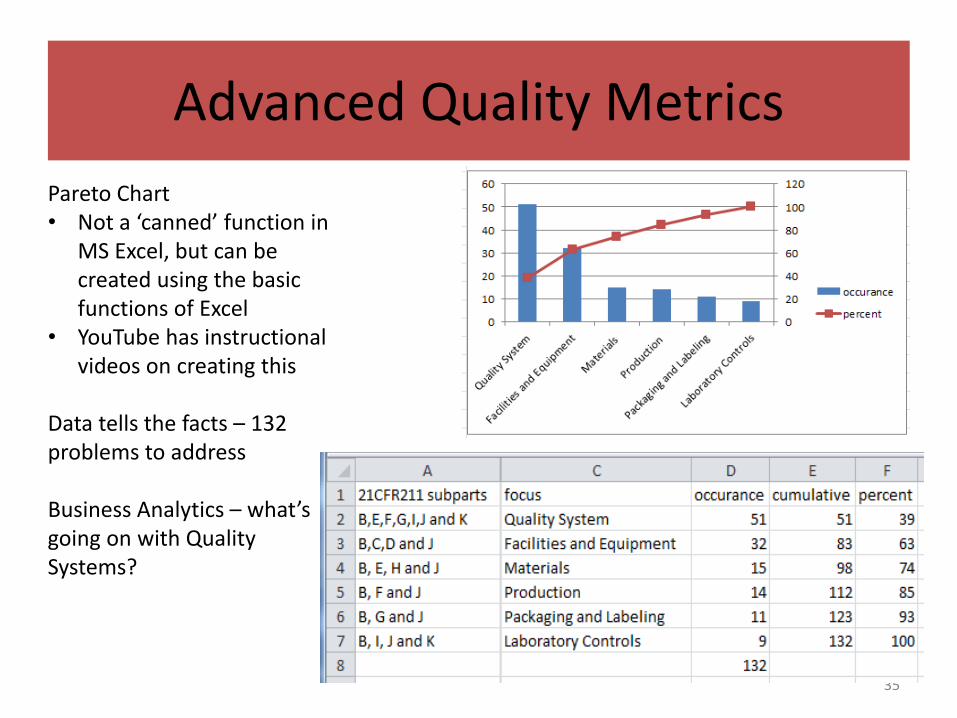
Pareto Chart• Not a ‘canned’ function in
MS Excel, but can be created using the basic functions of Excel
• YouTube has instructional videos on creating this
Data tells the facts – 132 problems to address
Business Analytics – what’s going on with Quality Systems?

Advanced Quality Metrics
36
Statistical Process Control (SPC) ChartUWL – upper warning limit (+3σ)UCL – upper control limit (+2σ)LCL – lower control limit (-2σ)LWL – lower warning limit (-3σ)
Data tells the facts –We are in control
Business Analytics asks – what is going on Tuesday and Friday mornings?
Advanced Quality Metrics
• Business Analytics can measure and improve a controlled processes – Using graphic models (charts) to display and report this data increases
the level of understanding and comprehension of the data across many different business disciplines.
• Business Analytics should be applied and managed enterprise-wide in order to facilitate awareness and improvements – For example, when measuring days to close deviations; which would
you prefer: “Getting better” or “Averaging 2.3 days with a range of +/-0.7 days which is a 12% improvement over the last 30 days”
37
Advanced Quality Metrics
38
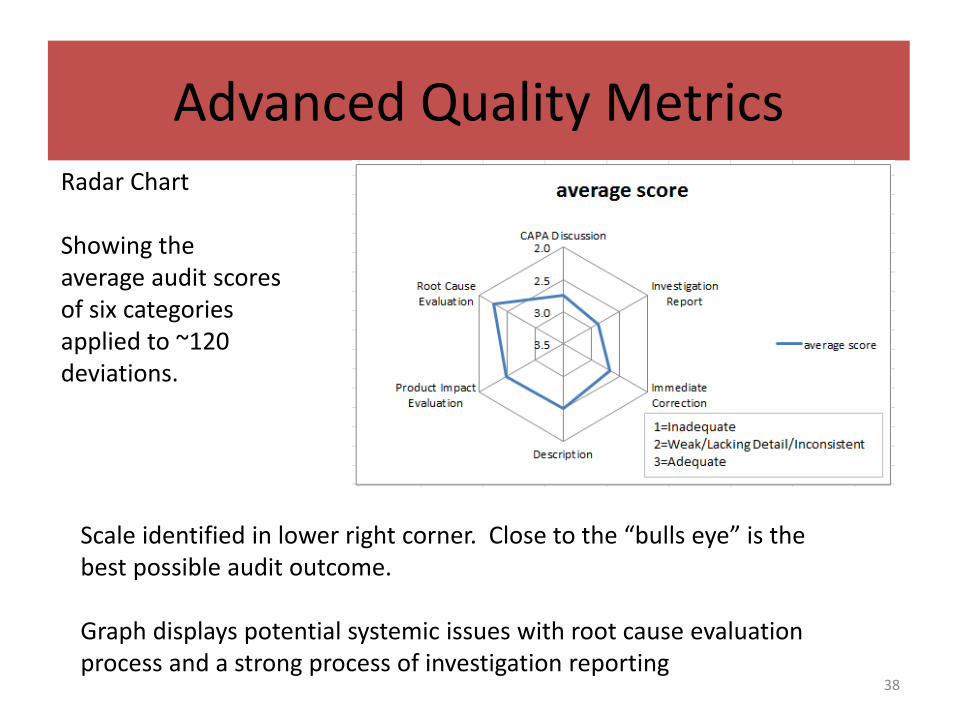
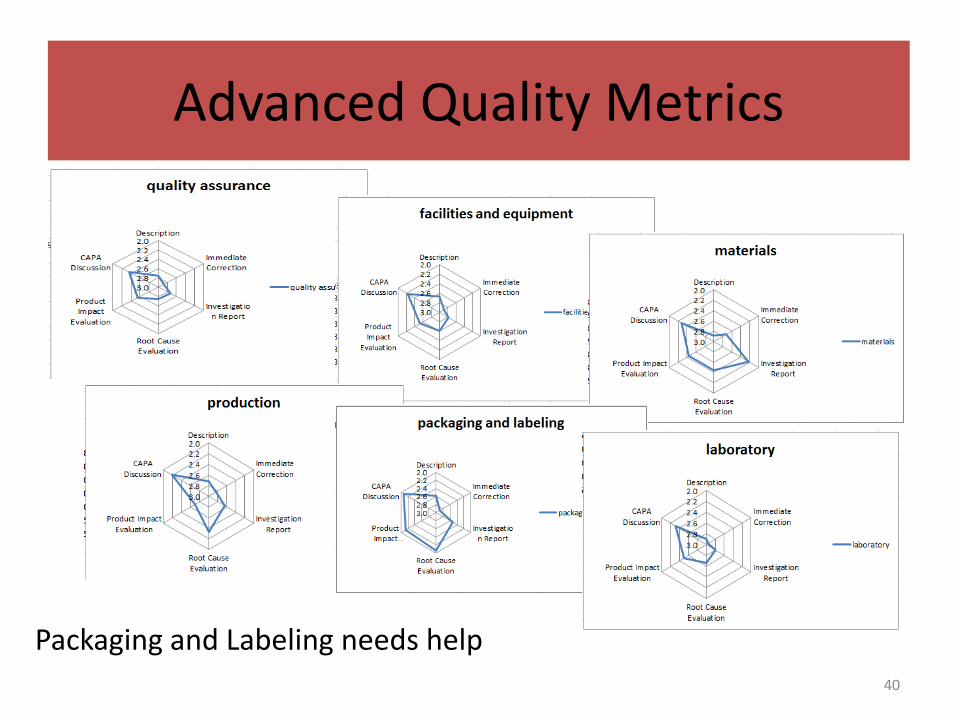
Radar Chart
Showing the average audit scores of six categories applied to ~120 deviations.
Scale identified in lower right corner. Close to the “bulls eye” is the best possible audit outcome.
Graph displays potential systemic issues with root cause evaluation process and a strong process of investigation reporting

Advanced Quality Metrics
39
Pareto chart from earlier represents the total number of individual audit scores across all categories.Range of scores is between 0.0 and 3.0 – 80% are between 2.0 and 3.0
Pareto shows the number of audit scores that make up the data.
Business analytics digs into determining this 20% is contributed from an individual/smaller set of the audit criteria (e.g., root cause evaluation) or is this from a certain group/department that the audit was performed (e.g., scored from the laboratory or manufacturing group).
Advanced Quality Metrics
40
Packaging and Labeling needs help

Advanced Quality Metrics
Data Collection Tips
• Decide what data is worth collecting: Be discerning.
• Viable data must be accurate, complete, reliable and traceable.
• Collect data to tell the whole story, not just the story you wish to tell.
Periodically verify integrity of data.
41
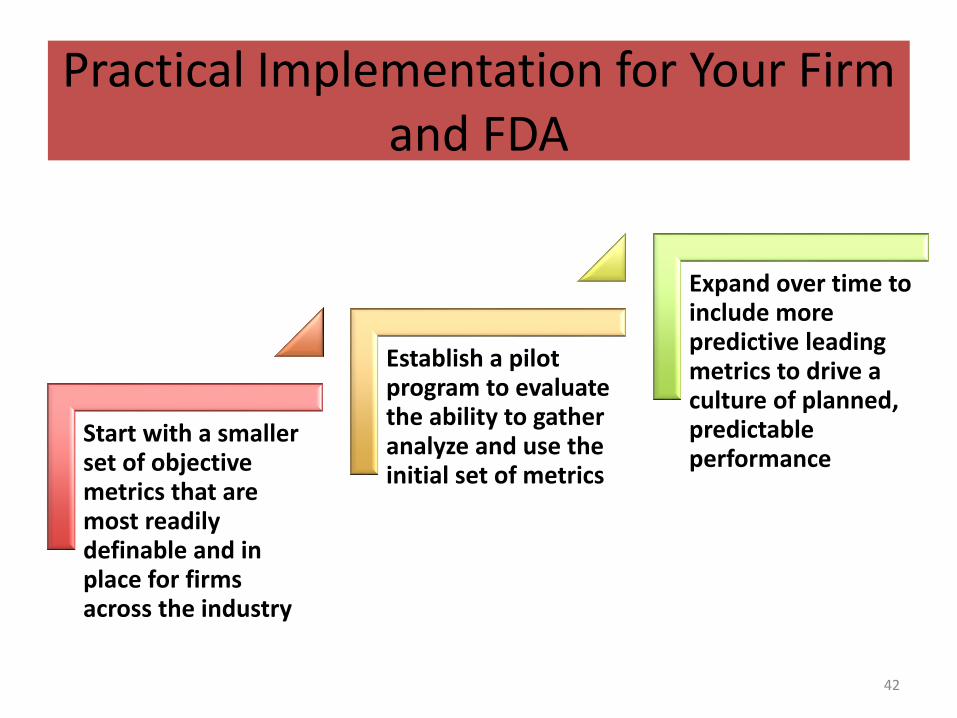
Practical Implementation for Your Firm and FDA
42
Start with a smaller set of objective metrics that are most readily definable and in place for firms across the industry
Establish a pilot program to evaluate the ability to gather analyze and use the initial set of metrics
Expand over time to include more predictive leading metrics to drive a culture of planned, predictable performance
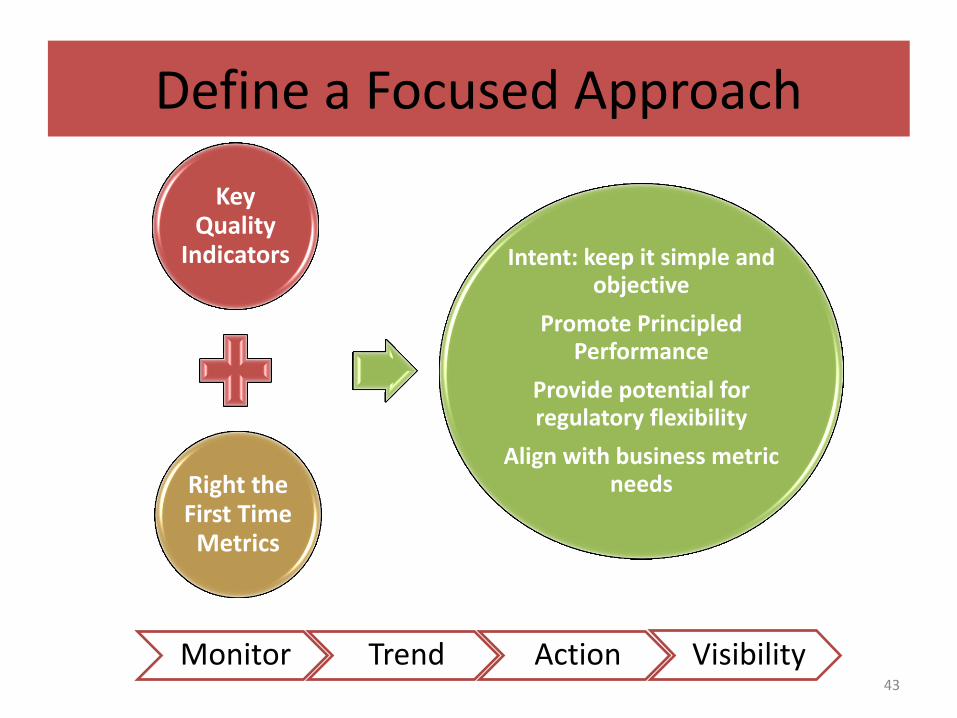
Define a Focused Approach
43
Key Quality
Indicators
Right the First Time
Metrics
Intent: keep it simple and objective
Promote Principled Performance
Provide potential for regulatory flexibility
Align with business metric needs
Monitor Trend Action Visibility
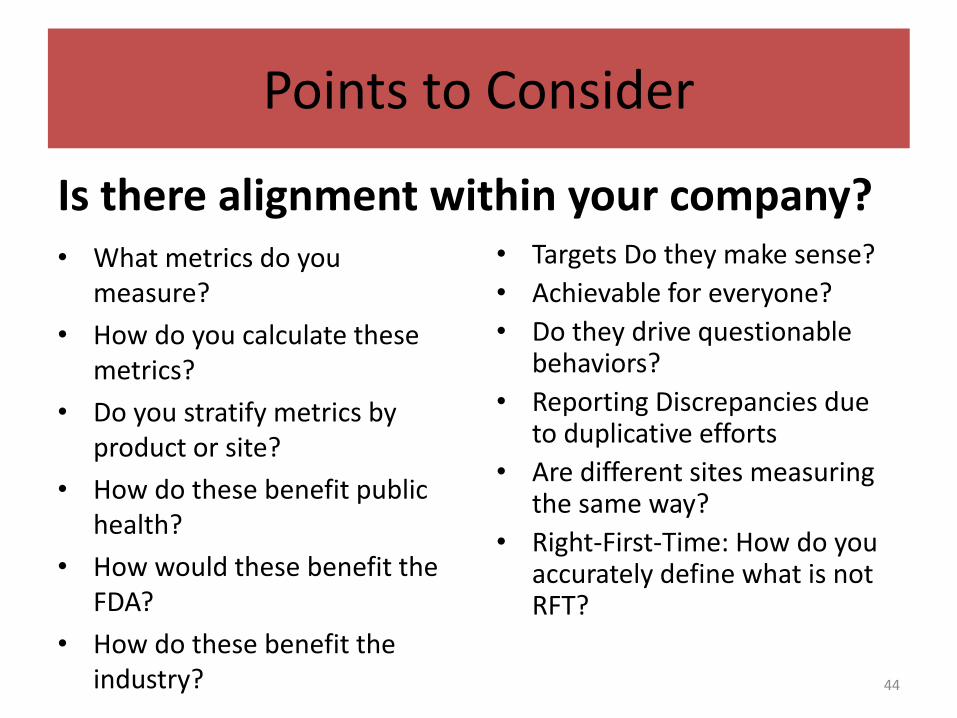
Points to Consider
Is there alignment within your company? • Targets Do they make sense?
• Achievable for everyone?
• Do they drive questionable behaviors?
• Reporting Discrepancies due to duplicative efforts
• Are different sites measuring the same way?
• Right-First-Time: How do you accurately define what is not RFT?
44
• What metrics do you measure?
• How do you calculate these metrics?
• Do you stratify metrics by product or site?
• How do these benefit public health?
• How would these benefit the FDA?
• How do these benefit the industry?
Incorporate into Routine Metric Reporting & Management Review
45
• Establish a system to collect and monitor data• Define and standardize reporting and monitoring
frequency at the department, site and global level• Incorporate metric review into Quality Council
and/or Management Review Meetings
46
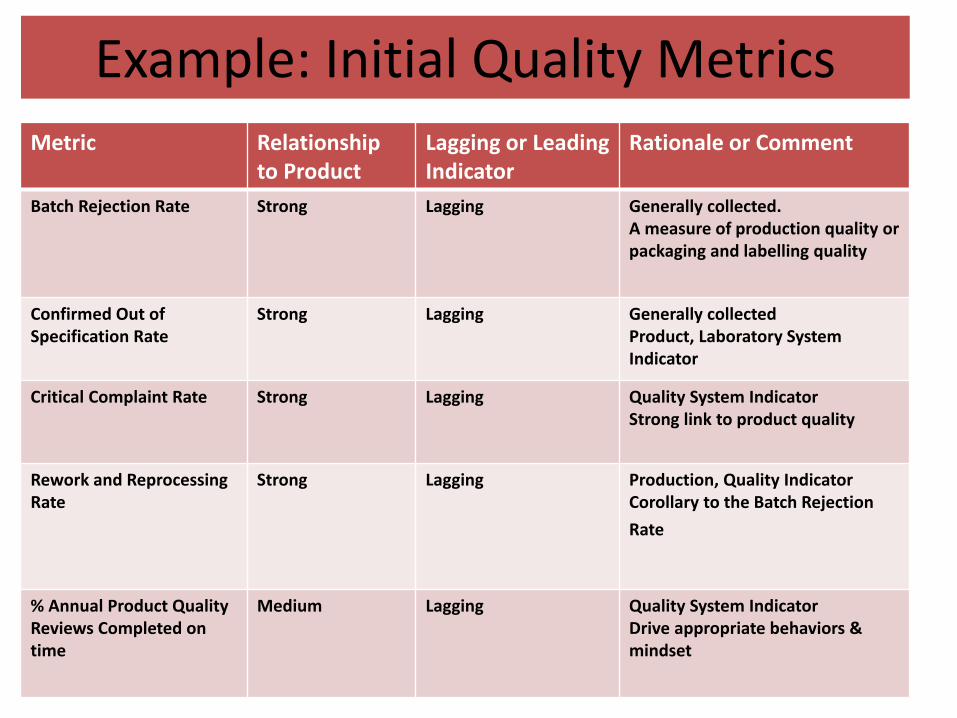
Metric Relationship to Product
Lagging or Leading Indicator
Rationale or Comment
Batch Rejection Rate Strong Lagging Generally collected.A measure of production quality or packaging and labelling quality
Confirmed Out of Specification Rate
Strong Lagging Generally collectedProduct, Laboratory System Indicator
Critical Complaint Rate Strong Lagging Quality System IndicatorStrong link to product quality
Rework and ReprocessingRate
Strong Lagging Production, Quality IndicatorCorollary to the Batch Rejection
Rate
% Annual Product Quality Reviews Completed on time
Medium Lagging Quality System Indicator Drive appropriate behaviors & mindset
Example: Initial Quality Metrics
47
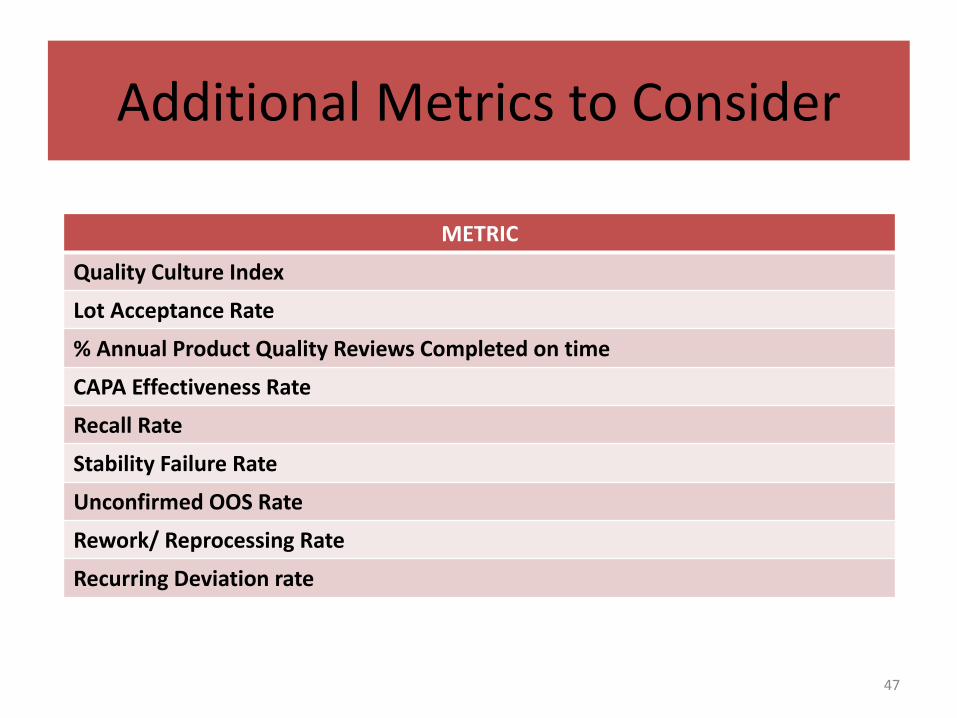
METRIC
Quality Culture Index
Lot Acceptance Rate
% Annual Product Quality Reviews Completed on time
CAPA Effectiveness Rate
Recall Rate
Stability Failure Rate
Unconfirmed OOS Rate
Rework/ Reprocessing Rate
Recurring Deviation rate
Additional Metrics to Consider
Q & A
Thank you
48