Better Understanding of the Pinellas County Jail Population
Pinellas County Data CollaborativePinellas County, Florida
Policy and Services Research Data CenterDepartment of Mental Health Law & PolicyLouis de la Parte Florida Mental Health Inst.
University of South Florida

The three important factors driving the need for higher bed capacity are:
1) the number of inmates is increasing over time
2) the length of stays are increasing over time
3) the number of repeat offenders is increasing over time
4) Other factors for Inmate Population growth is the growth in Pinellas County and mandatory sentencing laws/Policies.

DEMOGRAPHICS
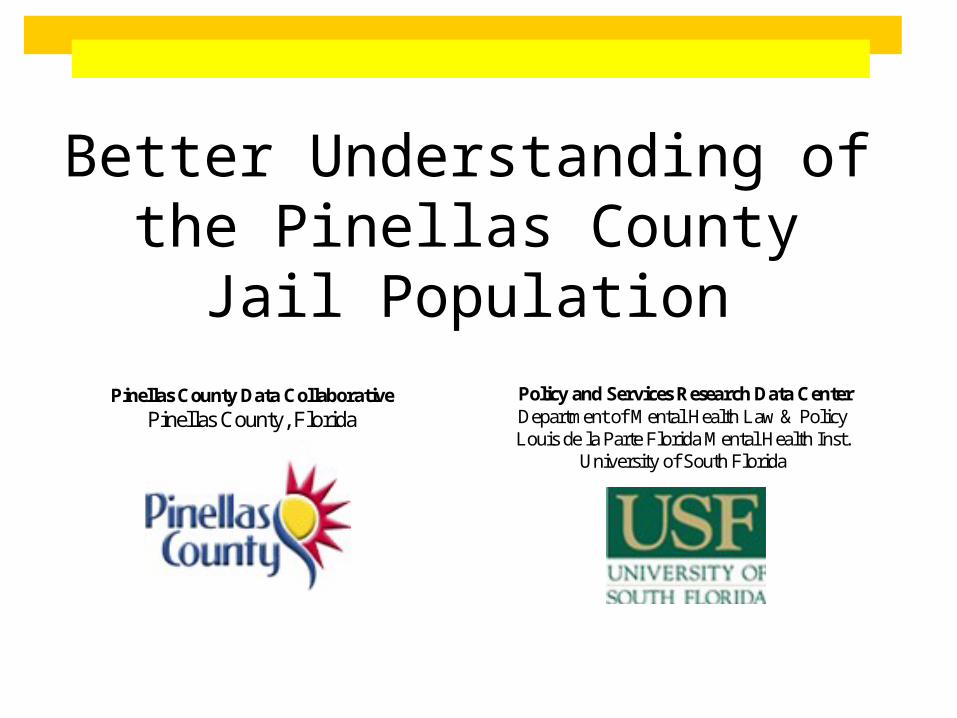
The proportion distribution by demographics has not changed significantly over time, which means there is no one demographic characteristic driving the increase of inmates or length of stays.
Although there are the following findings:
•The largest age group population (18 to 25 Year Olds) is also shows the highest growth (10% a year)
• Although females are still only a small portion of the inmate population their number (85%) have increase proportionately faster than the males (50%)
• 77% of the inmate population reside in Pinellas County, Another 12% reside in the three adjacent counties (Hillsborough, Manatee, Pasco). The other 11% reside mostly in the other Florida Counties and in the other U.S. states
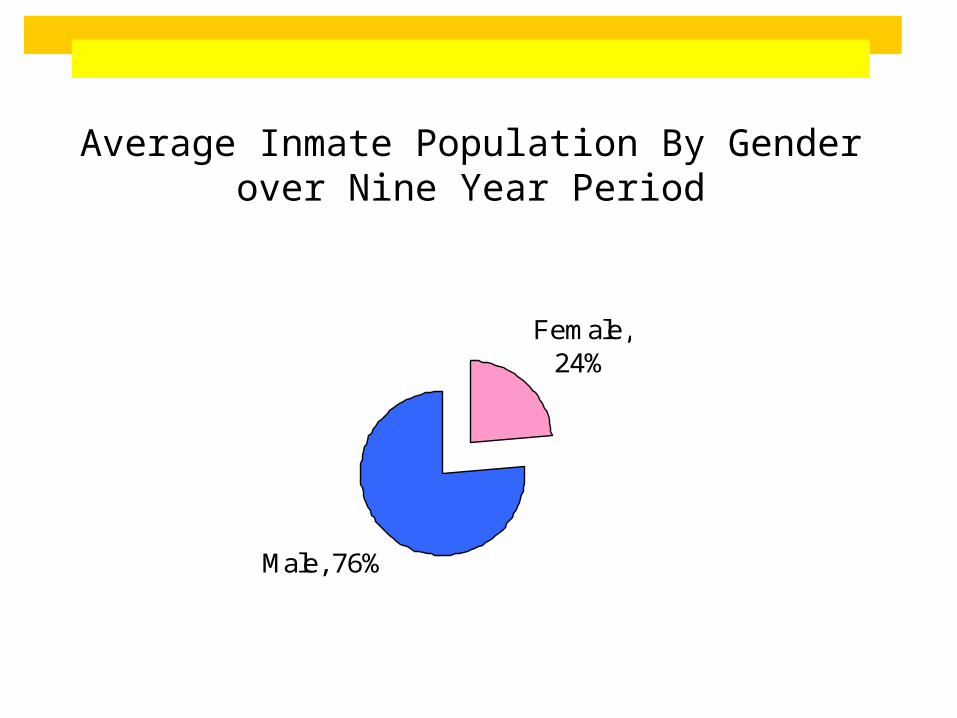
Average Inmate Population By Gender over Nine Year Period
Female, 24%
Male, 76%

Average Inmate Population By Race over nine year period
(1998-2006)
Black, 26.07% White, 73.04%
American Indian, 0.01%
Asian, 0.33%
Unknown, 0.55%

Age Group By Gender Over TimeMALES
0
500
1,000
1,500
2,000
2,500
3,000
3,500
4,000
<=17 18to25 26to35 36to45 46to64
65to88 89+ Unknown
<=17 33 32 42 52 77 82 100 114 142
18to25 1,863 1,812 1,974 2,142 2,504 2,684 2,778 2,995 3,363
26to35 2,402 2,193 2,217 2,266 2,258 2,359 2,410 2,459 2,630
36to45 2,127 2,025 2,029 2,084 2,181 2,201 2,253 2,270 2,428
46to64 648 634 725 771 859 942 1,002 1,081 1,129
65to88 46 36 44 42 29 47 61 38 66
89+ 0 0 3 0 0 0 0 0 3
Unknown 6 5 2 3 6 4 0 4 28
1998 1999 2000 2001 2002 2003 2004 2005 2006

Age Group By Gender Over TimeFEMALE
0
2,000
4,000
6,000
8,000
10,000
12,000
<=17 18to25 26to35 36to45 46to64 65to88 89+ Unknown
<=17 201 256 306 423 537 627 712 829 967
18to25 6,463 6,561 7,004 7,679 8,151 8,703 9,240 9,669 10,434
26to35 7,767 7,008 6,821 6,922 6,710 6,802 6,988 6,798 7,108
36to45 6,667 6,370 6,451 6,609 6,570 6,397 6,486 6,530 6,422
46to64 3,061 2,979 3,124 3,223 3,357 3,421 3,597 3,694 3,742
65to88 277 256 234 237 253 218 262 228 250
89+ 0 0 1 0 2 0 1 0 3
Unknown 16 11 8 8 4 4 5 10 42
1998 1999 2000 2001 2002 2003 2004 2005 2006
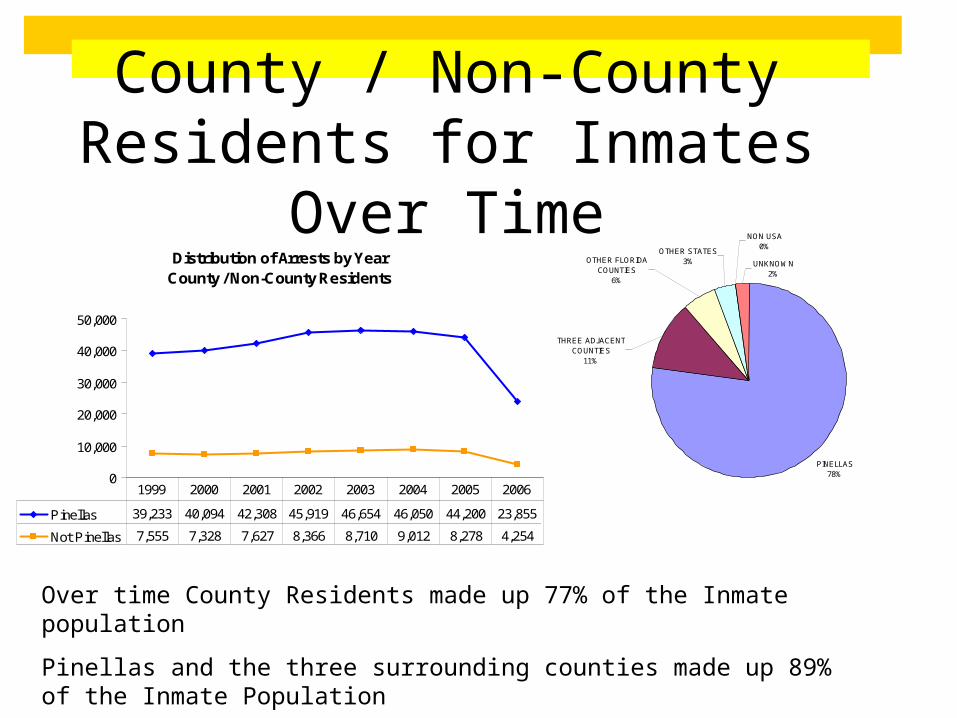
County / Non-County Residents for Inmates Over Time
PINELLAS78%
THREE ADJACENT COUNTIES
11%
OTHER FLORIDA COUNTIES
6%
NON USA0%
UNKNOWN2%
OTHER STATES3%
Over time County Residents made up 77% of the Inmate population
Pinellas and the three surrounding counties made up 89% of the Inmate Population
Distribution of Arrests by YearCounty / Non-County Residents
0
10,000
20,000
30,000
40,000
50,000
Pinellas 39,233 40,094 42,308 45,919 46,654 46,050 44,200 23,855
Not Pinellas 7,555 7,328 7,627 8,366 8,710 9,012 8,278 4,254
1999 2000 2001 2002 2003 2004 2005 2006
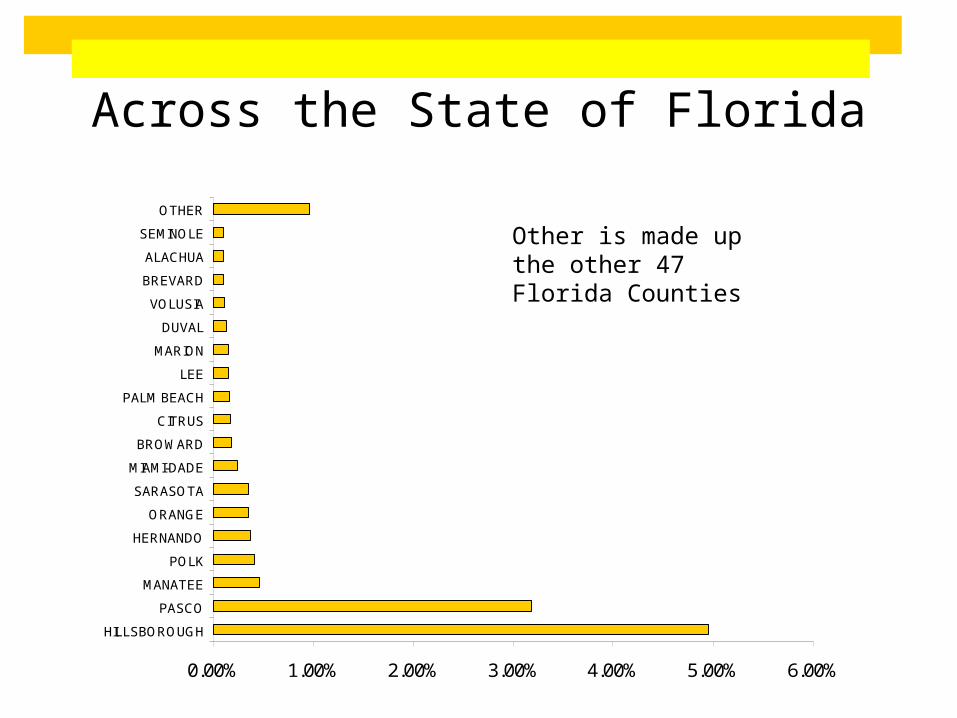
Across the State of Florida
0.00% 1.00% 2.00% 3.00% 4.00% 5.00% 6.00%
HILLSBOROUGH
PASCO
MANATEE
POLK
HERNANDO
ORANGE
SARASOTA
MIAMI-DADE
BROWARD
CITRUS
PALM BEACH
LEE
MARION
DUVAL
VOLUSIA
BREVARD
ALACHUA
SEMINOLE
OTHER
Other is made up the other 47 Florida Counties

Across the USA
0.00% 2.00% 4.00% 6.00% 8.00% 10.00% 12.00%
GEORGIA
NEW YORK
OHIO
MICHIGAN
ILLINOIS
TEXAS
PENNSYLVANIA
NORTH CAROLINA
TENNESSEE
INDIAN
VIRGINIA
ALABAMA
CALIFORNIA
KENTUCKY
MARYLAND
SOUTH CAROLINA
MISSOURI
LOUISIANA
ARIZONA
WISCONSIN
MISSISSIPPI
ARKANSAS
The only state not showing up is New Hampshire
These state make up 89% of those USA residents who were arrested in Pinellas County.
All other states were less than 1%
Average Number of Inmates Per Day

Average Inmates per Day Overtime by Gender
1998-2006
2202 2202 22602457 2563 2555
27612922
3302
362 373 410 436 513 515 562 604 667
0
500
1000
1500
2000
2500
3000
3500
1998 1999 2000 2001 2002 2003 2004 2005 2006
Male
Female
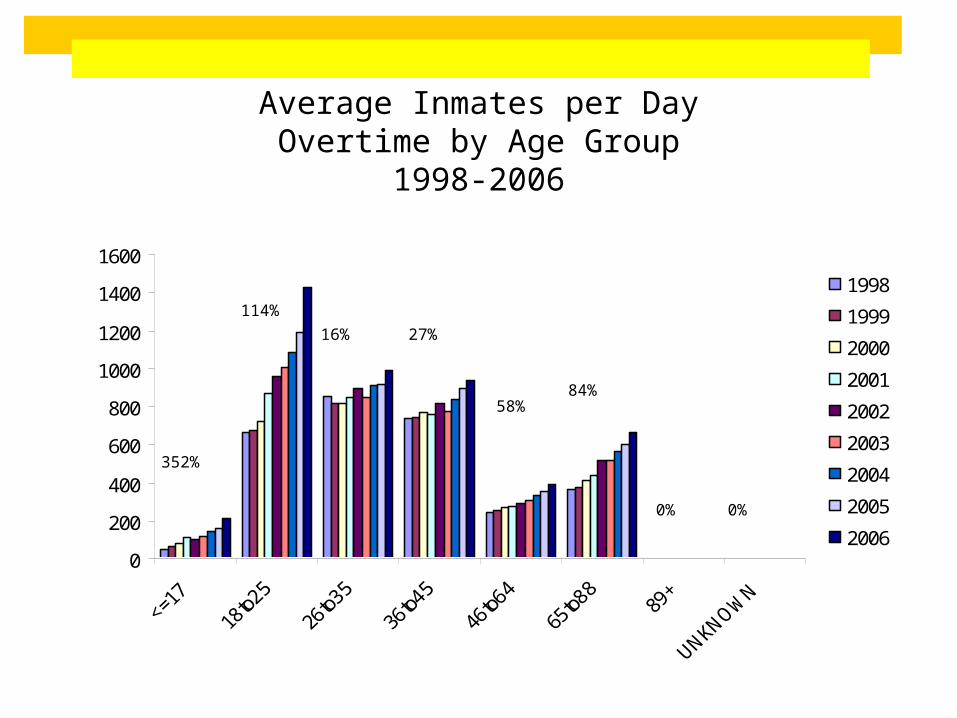
Average Inmates per DayOvertime by Age Group
1998-2006
0
200
400
600
800
1000
1200
1400
1600
1998
1999
2000
2001
2002
2003
2004
2005
2006
352%
114%
16% 27%
58%84%
0% 0%
Non-Demographic Indicators
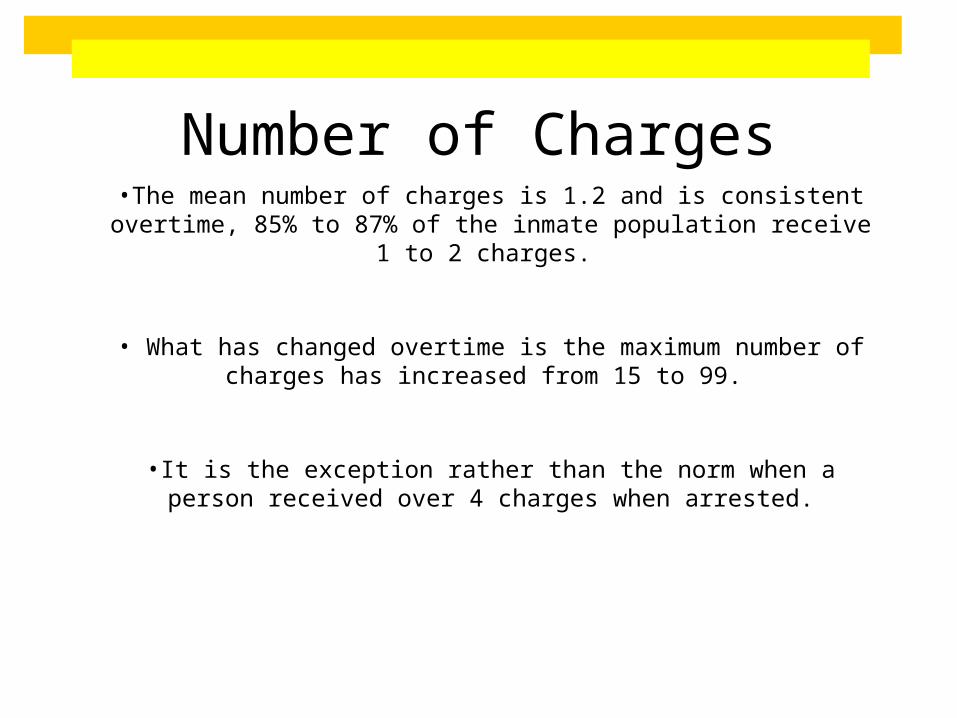
Number of Charges•The mean number of charges is 1.2 and is consistent overtime, 85% to
87% of the inmate population receive 1 to 2 charges.
• What has changed overtime is the maximum number of charges has increased from 15 to 99.
•It is the exception rather than the norm when a person received over 4 charges when arrested.

Repeat , 45%
No Repeat, 55%
How big is the problem of repeat offenders?
• Males (47%) are more likely to be a repeat offender than females (39%)
• African American (57%) are more likely to be a repeat offender than other groups (12%-42%)
• African American Males whose age is <= 17 at their first arrests (72%) are the most likely to be repeat offenders.
• The younger you are at your first arrest (63%) the more likely you are to be a repeat offender then other age groups (11%-49%)
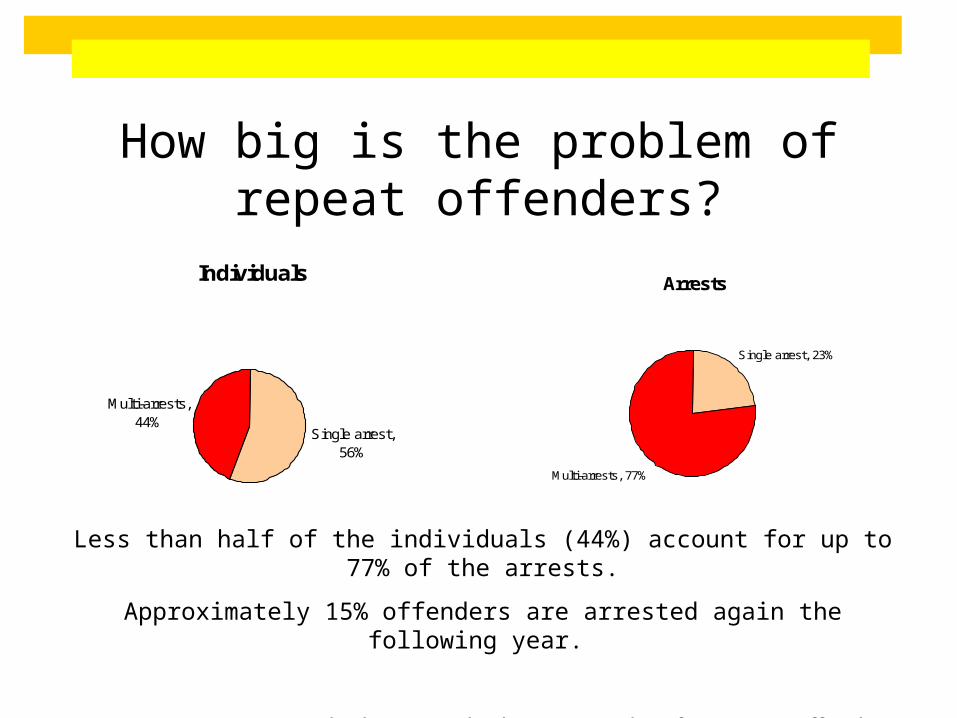
Arrests
Single arrest, 23%
Multi-arrests, 77%
How big is the problem of repeat offenders?
Less than half of the individuals (44%) account for up to 77% of the arrests.
Approximately 15% offenders are arrested again the following year.
Note: It is necessary to look over multiple years to identify a repeat offender
Individuals
Single arrest, 56%
Multi-arrests, 44%
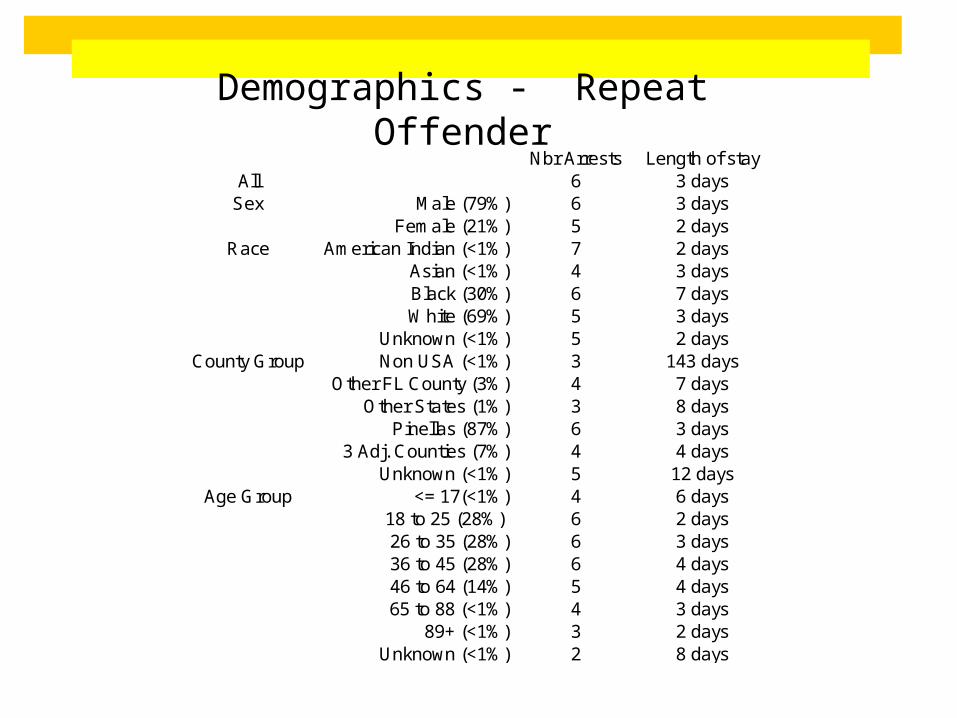
Demographics - Repeat OffenderNbr Arrests Length of stay
All 6 3 daysSex Male (79%) 6 3 days
Female (21%) 5 2 daysRace American Indian (<1%) 7 2 days
Asian (<1%) 4 3 daysBlack (30%) 6 7 daysWhite (69%) 5 3 days
Unknown (<1%) 5 2 daysCounty Group Non USA (<1%) 3 143 days
Other FL County (3%) 4 7 daysOther States (1%) 3 8 days
Pinellas (87%) 6 3 days3 Adj. Counties (7%) 4 4 days
Unknown (<1%) 5 12 daysAge Group <= 17(<1%) 4 6 days
18 to 25 (28%) 6 2 days26 to 35 (28%) 6 3 days36 to 45 (28%) 6 4 days46 to 64 (14%) 5 4 days65 to 88 (<1%) 4 3 days
89+ (<1%) 3 2 daysUnknown (<1%) 2 8 days

Days, 206
Days, 2 Days, 2 Days, 5 Days, 7 Days, 8 Days, 9 Days, 9 Days, 10
Days, 105
Days, 134
Days, 91
Days, 80 Days, 71 Days, 64Days, 62
1st 2nd 3rd 4th 5th 6th 7th 8th
Median Number of days to next arrest
Repeat offenders show to have a shorter time between release from jail and their next arrests with each additional. For example, at their first arrest, they are incarcerated two days and the median days before their next arrest is 206 days (6-7 months). They repeat this pattern then number of median days before their next arrests decreases, until they are spending more an more days in jail when arrested and less and less days out of jail before being re-arrested. For the 7th arrests the median days incarcerated was 9 and then the median number of day out of jail before being re-arrested was 64 days (2 months).
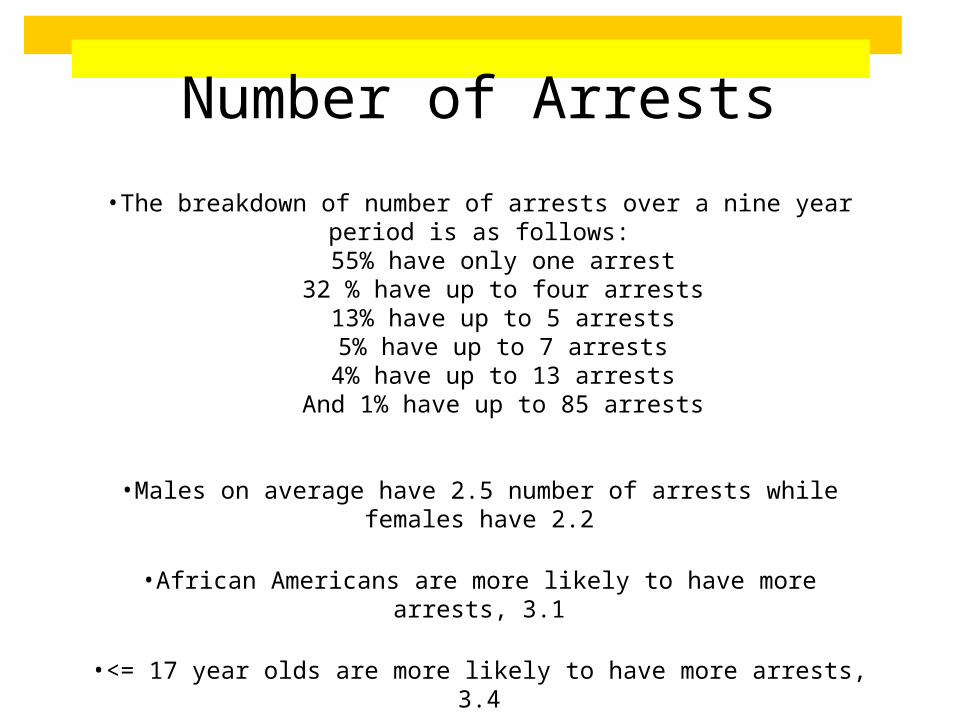
Number of Arrests
•The breakdown of number of arrests over a nine year period is as follows:
55% have only one arrest32 % have up to four arrests
13% have up to 5 arrests5% have up to 7 arrests
4% have up to 13 arrestsAnd 1% have up to 85 arrests
•Males on average have 2.5 number of arrests while females have 2.2
•African Americans are more likely to have more arrests, 3.1
•<= 17 year olds are more likely to have more arrests, 3.4
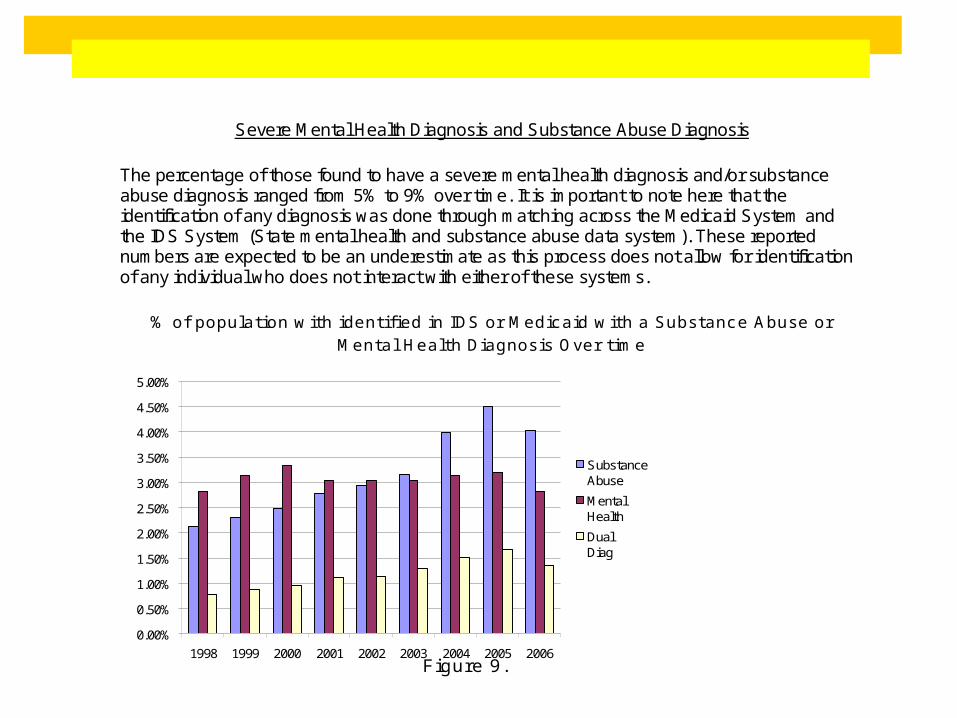
Severe Mental Health Diagnosis and Substance Abuse Diagnosis The percentage of those found to have a severe mental health diagnosis and/or substance abuse diagnosis ranged from 5% to 9% over time. It is important to note here that the identification of any diagnosis was done through matching across the Medicaid System and the IDS System (State mental health and substance abuse data system). These reported numbers are expected to be an underestimate as this process does not allow for identification of any individual who does not interact with either of these systems.
% of population with identified in IDS or Medicaid with a Substance Abuse or
Mental Health Diagnosis Over time
0.00%
0.50%
1.00%
1.50%
2.00%
2.50%
3.00%
3.50%
4.00%
4.50%
5.00%
1998 1999 2000 2001 2002 2003 2004 2005 2006
SubstanceAbuse
MentalHealth
DualDiag
Figure 9.
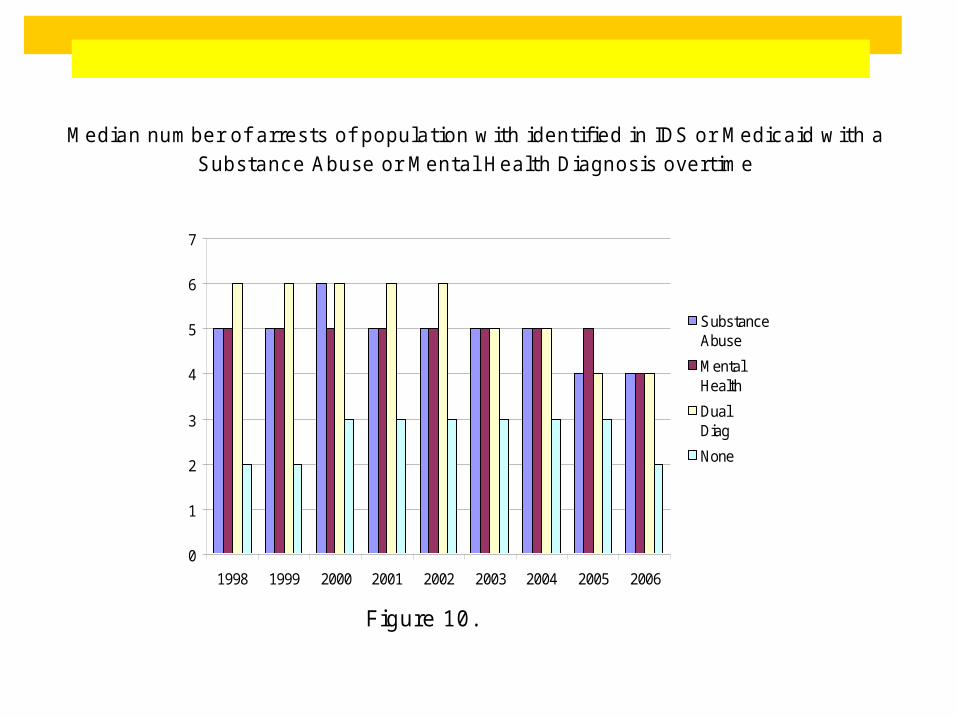
Median number of arrests of population with identified in IDS or Medicaid with a Substance Abuse or Mental Health Diagnosis overtime
0
1
2
3
4
5
6
7
1998 1999 2000 2001 2002 2003 2004 2005 2006
SubstanceAbuse
MentalHealth
DualDiag
None
Figure 10.
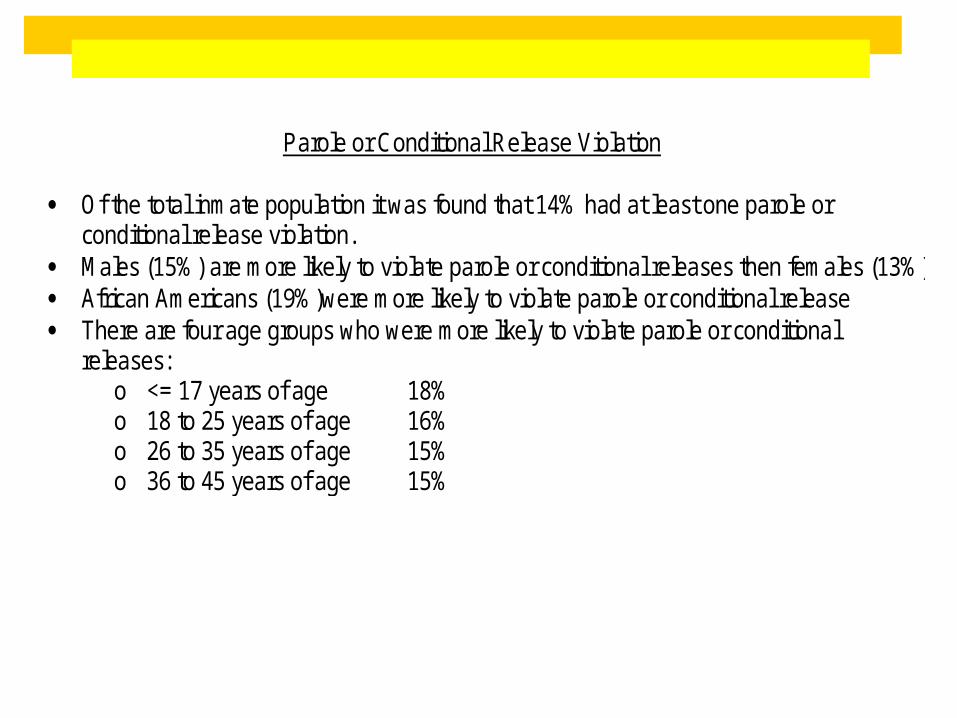
Parole or Conditional Release Violation
Of the total inmate population it was found that 14% had at least one parole or conditional release violation.
Males (15%) are more likely to violate parole or conditional releases then females (13%) African Americans (19%)were more likely to violate parole or conditional release There are four age groups who were more likely to violate parole or conditional
releases: o <= 17 years of age 18% o 18 to 25 years of age 16% o 26 to 35 years of age 15% o 36 to 45 years of age 15%

Felony and Misdemeanor Charges
64% of the inmate population have only misdemeanor charges 18% of the inmate population have only Felony charges 18% of the inmate population have both felony and misdemeanor charges < 1% have neither a felony or misdemeanor charge
35% of inmates have had at least one felony charge Males (37%) are more likely to have a felony charge than females (30%) African Americans (52%)are more likely to have a felony charge Three age groups who are more likely to have a felony charge are:
o <= 17 years olds 38% o 18 to 25 year olds 37% o 26 to 35 year olds 37%

Using the Arrest Statutes Literal six types of Crime were created.
Drug Sex Property
Moving Violent Other
How they were defined and created can be found in Appendix B in the Report

Drug 41% of the inmate population has at least one crime type of drug Males (43%) are more likely than females to have a crime type of drug American Indian (43%) are more likely to have a crime type of drug Whites (43%) are more likely to have a crime type of drug Ages 36 to 45 (44%), and ages 46 to 64 (43%) are more likely to have a crime type of
drug
Moving
22% of the inmate population had at least one crime type of moving Males (24%) were more likely than females to have a crime type of moving African American (28%) were more likely to have a crime type of moving Ages <= 17 (55%), and ages 18 t o25 (28%), and ages 26 to 35 (24%), ages 89+ (36%)
were more likely to have a crime type of moving
Property 29% of the inmate population had at least one crime type of property Females (35%) were more likely than males to have a crime type of property African American (34%) were more likely to have a crime type of property American Indians (43%) were more likely to have a crime type of property Ages <= 17 and ages 18 to 25 (33%) were more likely to have a crime type of property
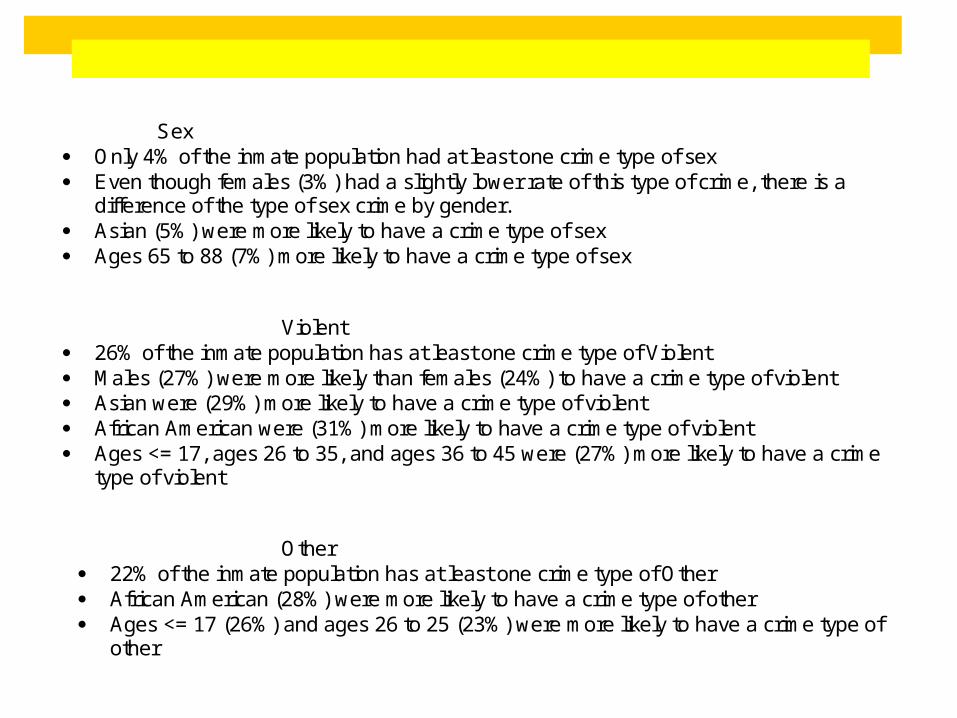
Sex Only 4% of the inmate population had at least one crime type of sex Even though females (3%) had a slightly lower rate of this type of crime, there is a
difference of the type of sex crime by gender. Asian (5%) were more likely to have a crime type of sex Ages 65 to 88 (7%) more likely to have a crime type of sex
Violent
26% of the inmate population has at least one crime type of Violent Males (27%) were more likely than females (24%) to have a crime type of violent Asian were (29%) more likely to have a crime type of violent African American were (31%) more likely to have a crime type of violent Ages <= 17, ages 26 to 35, and ages 36 to 45 were (27%) more likely to have a crime
type of violent Other
22% of the inmate population has at least one crime type of Other African American (28%) were more likely to have a crime type of other Ages <= 17 (26%) and ages 26 to 25 (23%) were more likely to have a crime type of
other

Violent Weapon Involved
Less than 2% of the inmate population showed to have a violent weapon during the crime arrest
Males (2%) were more likely than females (0.73%) to have a violent weapon during the crime arrest
African American (3%) were more likely to have a violent weapon during the crime arrest
Ages <= 17 (4%) were more likely to have a violent weapon during the crime arrest
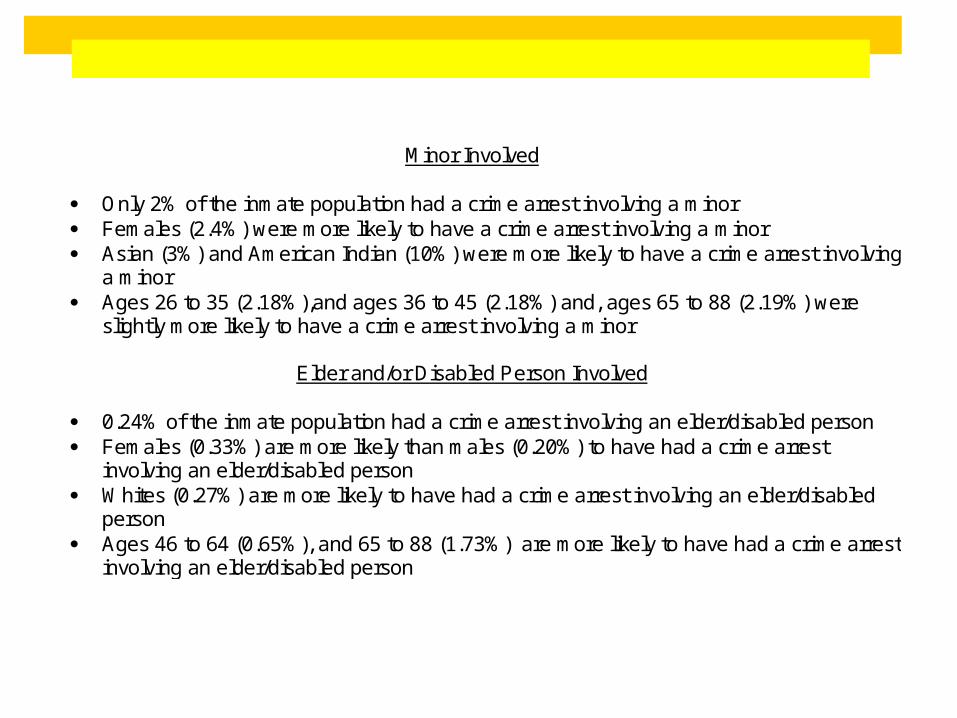
Minor Involved
Only 2% of the inmate population had a crime arrest involving a minor Females (2.4%) were more likely to have a crime arrest involving a minor Asian (3%) and American Indian (10%) were more likely to have a crime arrest involving
a minor Ages 26 to 35 (2.18%),and ages 36 to 45 (2.18%) and, ages 65 to 88 (2.19%) were
slightly more likely to have a crime arrest involving a minor
Elder and/or Disabled Person Involved
0.24% of the inmate population had a crime arrest involving an elder/disabled person Females (0.33%) are more likely than males (0.20%) to have had a crime arrest
involving an elder/disabled person Whites (0.27%) are more likely to have had a crime arrest involving an elder/disabled
person Ages 46 to 64 (0.65%), and 65 to 88 (1.73%) are more likely to have had a crime arrest
involving an elder/disabled person

Other Systems Interaction
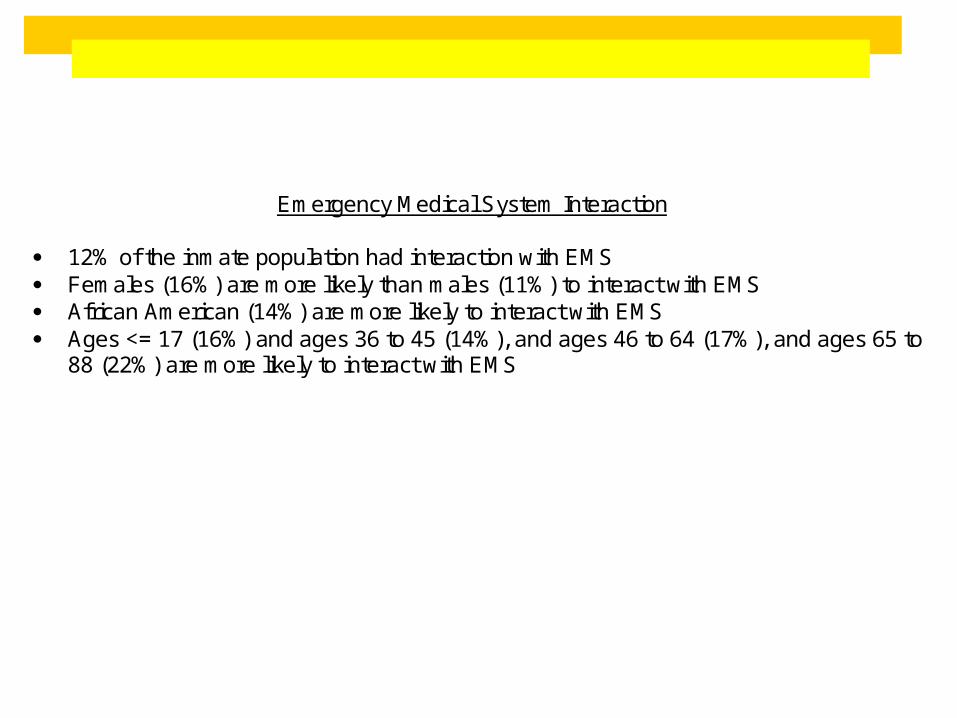
Emergency Medical System Interaction
12% of the inmate population had interaction with EMS Females (16%) are more likely than males (11%) to interact with EMS African American (14%) are more likely to interact with EMS Ages <= 17 (16%) and ages 36 to 45 (14%), and ages 46 to 64 (17%), and ages 65 to
88 (22%) are more likely to interact with EMS
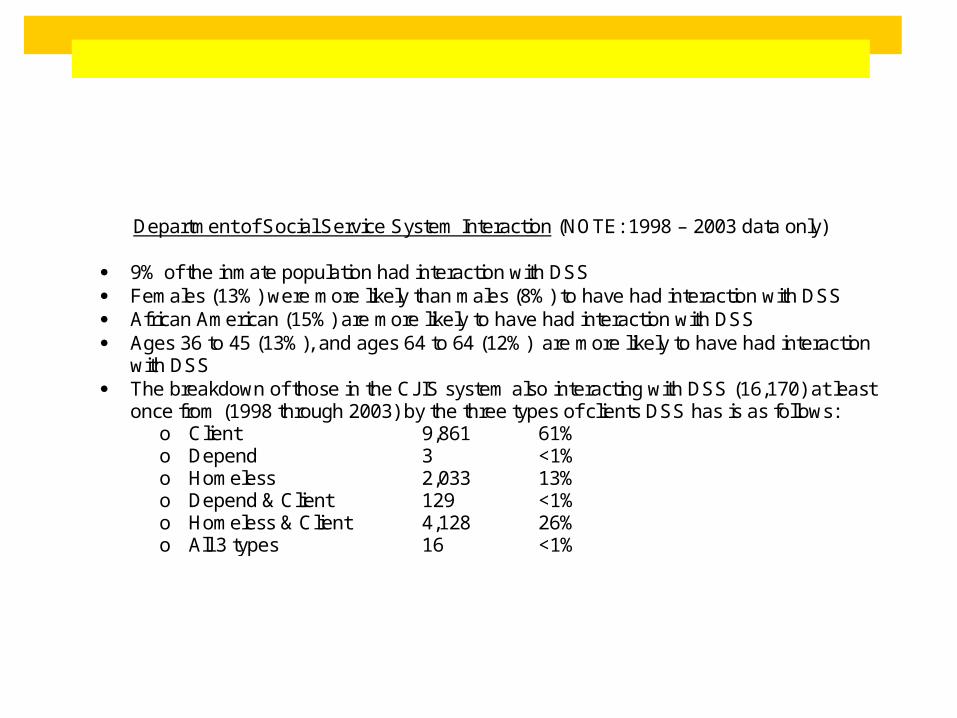
Department of Social Service System Interaction (NOTE: 1998 – 2003 data only)
9% of the inmate population had interaction with DSS Females (13%) were more likely than males (8%) to have had interaction with DSS African American (15%) are more likely to have had interaction with DSS Ages 36 to 45 (13%), and ages 64 to 64 (12%) are more likely to have had interaction
with DSS The breakdown of those in the CJIS system also interacting with DSS (16,170) at least
once from (1998 through 2003) by the three types of clients DSS has is as follows: o Client 9,861 61% o Depend 3 <1% o Homeless 2,033 13% o Depend & Client 129 <1% o Homeless & Client 4,128 26% o All 3 types 16 <1%
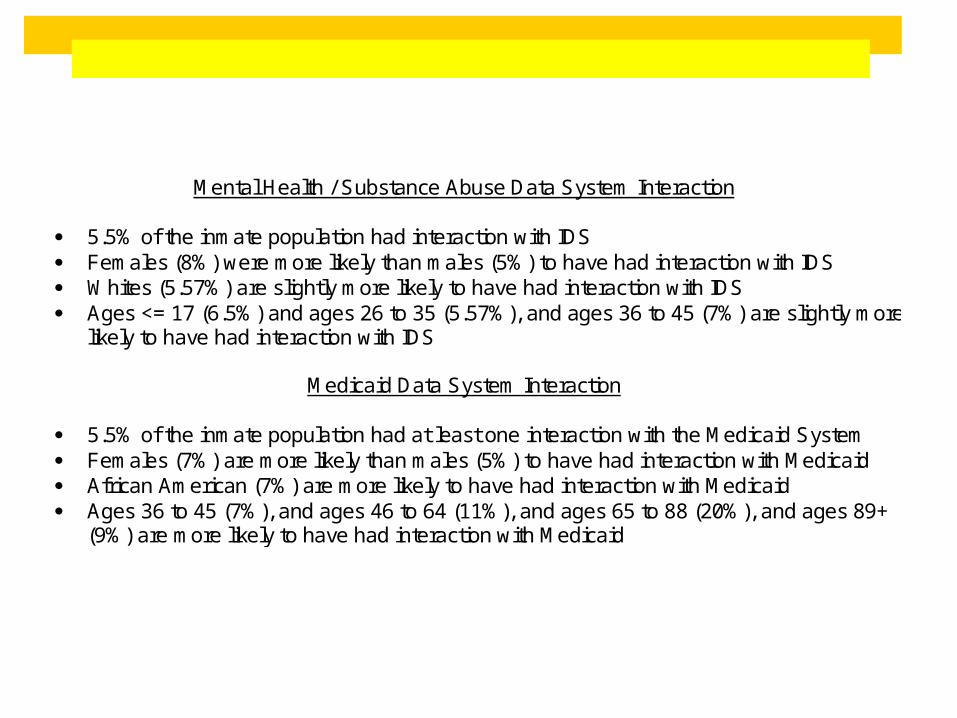
Mental Health / Substance Abuse Data System Interaction
5.5% of the inmate population had interaction with IDS Females (8%) were more likely than males (5%) to have had interaction with IDS Whites (5.57%) are slightly more likely to have had interaction with IDS Ages <= 17 (6.5%) and ages 26 to 35 (5.57%), and ages 36 to 45 (7%) are slightly more
likely to have had interaction with IDS
Medicaid Data System Interaction
5.5% of the inmate population had at least one interaction with the Medicaid System Females (7%) are more likely than males (5%) to have had interaction with Medicaid African American (7%) are more likely to have had interaction with Medicaid Ages 36 to 45 (7%), and ages 46 to 64 (11%), and ages 65 to 88 (20%), and ages 89+
(9%) are more likely to have had interaction with Medicaid

Baker Act System
Approximately 1% to 3% of the inmate population in any of the nine years has interacted with the Baker Act System. This is the Florida Involuntary 72-hours commitment process where individuals are placed in an agency to have a mental health assessment of danger to themselves or others.
Also note that the custody status of mental health commitment of inmates has increased from .08% to 0.20% over the last nine years.
Note: There are not identifiable information other than date of birth and gender in this file to link across systems by individuals. Probabilistic Population Estimation (PPE) was used to examine the overlap between the Baker Act System to the CJIS system as well as using those inmates who could be identified using the Medicaid and Statewide Mental Health and Substance Abuse Systems (9,514 inmates identified), 3,330 inmates in the CJIS/Jail System were identified in the Baker Act System (35%). Figure 11. Inmates Arrested who also have receiving a Baker Act Initiation at some
point in time over the nine years
Nbr Inmates
643
1,438 1,4701,695
1,954
2,256
2,572
1,815
0
500
1,000
1,500
2,000
2,500
3,000
1999 2000 2001 2002 2003 2004 2005 2006
Nbr Inmates

Average Length of StayOvertime

Length of Stay Table 7. Overall Number of Arrests Length of Stay
Number of Arrests
Total Population
Repeat Offenders
Total Population
Repeat Offenders
All 4 6 2 days 3 days Sex Male 4 6 3 days 3 days
Female 3 5 2 days 3 days Race American Indian 1 4 2 days 2 days
Asian 2 4 2 days 3 days Black 5 6 4 days 6 days White 3 5 2 days 3 days Unknown 1 3 2 days 4 days
Age Group <= 17 3 4 2 days 3 days
18 to 25 4 5 2 days 2 days 26 to 35 4 5 2 days 3 days 36 to 45 4 5 3 days 4 days 46 to 64 3 5 2 days days 65 to 88 2 4 2 days 3 days 89+ 1 2 1 days 1.5 days Unknown 1 2 2 days 3 days
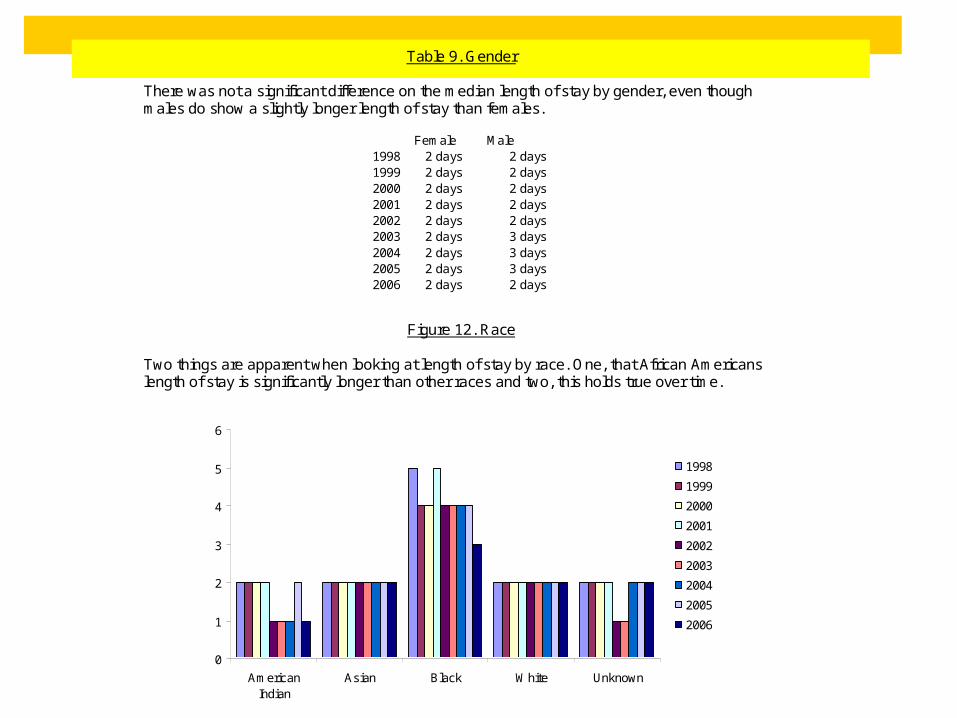
Table 9. Gender There was not a significant difference on the median length of stay by gender, even though males do show a slightly longer length of stay than females.
Female Male 1998 2 days 2 days 1999 2 days 2 days 2000 2 days 2 days 2001 2 days 2 days 2002 2 days 2 days 2003 2 days 3 days 2004 2 days 3 days 2005 2 days 3 days 2006 2 days 2 days
Figure 12. Race Two things are apparent when looking at length of stay by race. One, that African Americans length of stay is significantly longer than other races and two, this holds true over time.
0
1
2
3
4
5
6
AmericanIndian
Asian Black White Unknown
1998
1999
2000
2001
2002
2003
2004
2005
2006
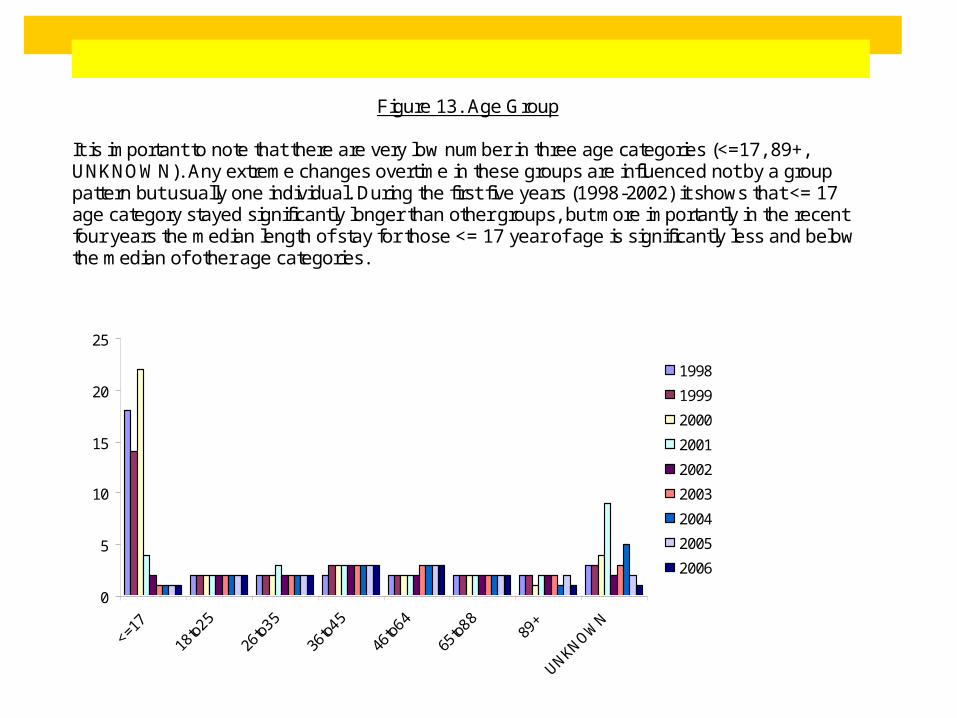
Figure 13. Age Group It is important to note that there are very low number in three age categories (<=17, 89+, UNKNOWN). Any extreme changes overtime in these groups are influenced not by a group pattern but usually one individual. During the first five years (1998-2002) it shows that <= 17 age category stayed significantly longer than other groups, but more importantly in the recent four years the median length of stay for those <= 17 year of age is significantly less and below the median of other age categories.
0
5
10
15
20
25
1998
1999
2000
2001
2002
2003
2004
2005
2006

Table 9. The number of charges The median length of stay does increase as a function of increases in the number of charges. Note that 85%-87% receive only 1 to 2 charges and 99% of individuals never receive more than 5 charges during one arrest. In 2006, if an individual was arrested and had four to five charges, the median length of stay was approximately 17 to 20 days. Charge Counts
1 2 3 4 5 6 7 8 9 10 > 101998 2 9 11 22 20 22 46 35 16 49 351999 2 9 16 23 25 22 21 48 15 28 382000 2 9 13 14 25 22 54 16 22 29 232001 2 11 22 14 38 28 16 9 54 52 402002 2 12 20 26 39 35 50 23 36 22 532003 2 10 14 17 20 22 62 14 37 12 442004 2 10 12 18 27 21 44 47 102 29 392005 2 8 12 20 22 17 24 42 56 43 122006 2 9 13 20 17 22 61 6 14 63 23
The number of arrests
The median length of stay does increase with the number of arrests, but is not a strong factor that drives length of stay.
An individual with one arrests the median length of stay is 2 days An individual with 4 arrests the median length of stay is 3 days. An individual with 5 arrests the median length of stay is 4 days An individual with 7 arrests the median length of stay is 5 days An individual with 13 arrests the median length of stay is 8 days

Figure 17. Receiving a Parole or Conditional Release Violation
Having a parole or conditional release violation is highly correlated to the number of days incarcerated.
0
2
4
6
8
10
12
14
1998 1999 2000 2001 2002 2003 2004 2005 2006
Parole and/or Cond. ReleaseViolation
No Parole and/or Cond.ReleaseViolation
Failure to Appear
The was no significant difference in length of stay due and Failure to Appear, although analysis did show those with Failure to Appear spent less time incarcerated than the average median stay. This maybe due to their type of crime.
Alcohol Involved in Arrest
There was no significant difference in the length of stay and alcohol involvement during the arrest.
Drugs Involved in Arrest
Drugs being involved in the arrests show to significantly increase the length of stay. The
median number of days incarcerated for arrests where drugs were found to be involved is 6 days.
Felony Charge
Having a felony charge at the time of arrest significantly correlated with an increase the
length of stay. The median number of days incarcerated for arrests where there was at least one felony charge is 13 days.

Table 11. Crime Type
Length of stay did have a significant increase not only for the felony by crime type. The highest length of stays being for sex and violent crime types, then drug crimes and lastly moving crimes.
Drug (F) Moving (F) Other (F) Property (F) Sex (F) Violent (F)
1998 11 days 3 days 13 days 14 days 22 days 16 days 1999 12 days 3 days 14 days 15 days 28 days 16 days 2000 10 days 3 days 14 days 13 days 22 days 15 days 2001 14 days 5 days 14 days 17 days 29 days 18 days 2002 16 days 4 days 11 days 20 days 31 days 22 days 2003 13 days 3 days 10 days 17 days 24 days 17 days 2004 14 days 3 days 10 days 15 days 23 days 16 days 2005 13 days 2 days 8 days 10 days 32 days 15 days 2006 12 days 2 days 6 days 9 days 57 days 12 days
Violent Weapon Involved
Having a violent weapon at the time of arrest show significantly increase the length of stay. The median number of days incarcerated for arrests where there was a violent weapon at the time of arrest is 12 days.
Crimes involving Minors, Elders, and/or Disabled persons
Crimes involving Minors, Elders and/or Disabled persons did not have an influencing
factor to the length of stay.

Interaction with Emergency Medical Services System
Those who interact with EMS have a median total days of 11 compared to the median total days of 3 for those who do not show having interacted with EMS.
Interaction with Dept. of Social Services System
Those who interact with DSS have a median total days of 34 compared to the median
total days of 3 for those who do not show having interacted with DSS.
Interaction with Medicaid System
Those who interact with Medicaid have a median total days of 10 compared to the median total days of 4 for those who do not show having interacted with Medicaid.
Interaction with State Mental Health and Substance Abuse System
Those who interact with IDS have a median total days of 27 compared to the median
total days of 3 for those who do not show having interacted with IDS
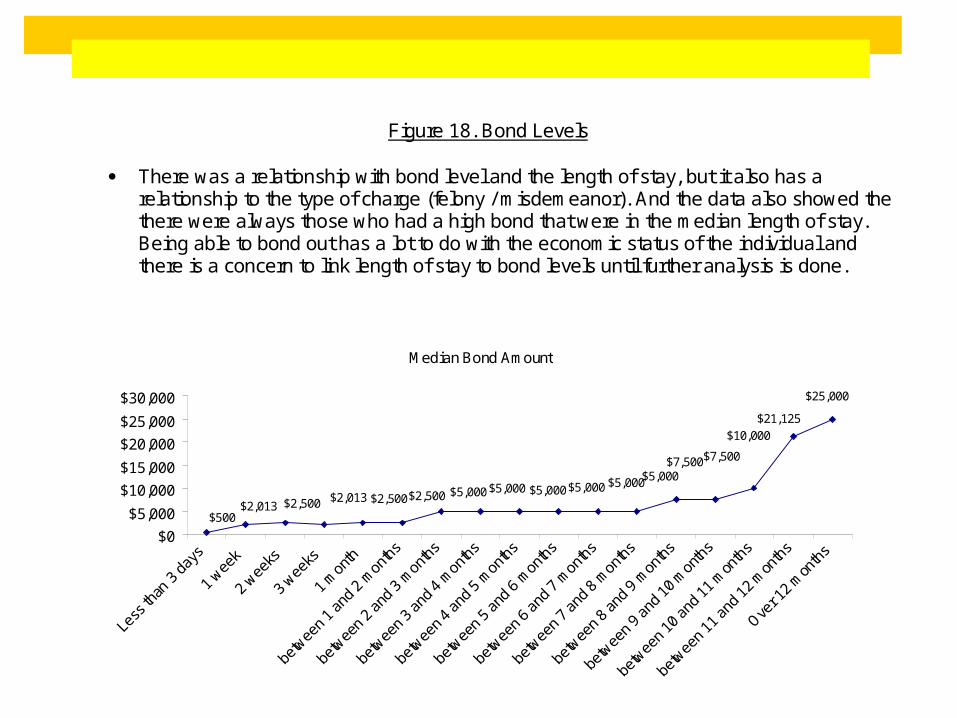
Figure 18. Bond Levels
There was a relationship with bond level and the length of stay, but it also has a relationship to the type of charge (felony / misdemeanor). And the data also showed the there were always those who had a high bond that were in the median length of stay. Being able to bond out has a lot to do with the economic status of the individual and there is a concern to link length of stay to bond levels until further analysis is done.
Median Bond Amount
$500$2,013 $2,500 $2,013 $2,500$2,500 $5,000 $5,000 $5,000$5,000 $5,000$5,000
$7,500
$10,000
$21,125
$25,000
$7,500
$0
$5,000
$10,000
$15,000
$20,000
$25,000
$30,000

Figure 19. Custody Status Since 2004 the number of released and released on their own recognizance has gone down corresponding to the number of out of bond and maximum security going up.
0.00%
10.00%
20.00%
30.00%
40.00%
50.00%
60.00%
1998 1999 2000 2001 2002 2003 2004 2005 2006
BOND RELEASED RELEASED ON OWN RECOGNIZANCE MAXIMUM SECURITY CENTER
TO CORRECTIONAL FACILTY OR PRISON FACILITY JAIL: CENTRAL DIVISION MEDIUM SECURITY CENTER FEMALE MIN. SEC. CENTER
FEMALE MAX. SEC. CENTER SPECIAL SECURITY:OUT OF THE COUNTY OR OUT TO HOSPITAL
MALE MIN. SEX.CENTER OLD BOOT CAMPE ANNEX BLDG
TEMP. HOLDING CELL FOR TRANSPORT ELECTRIC MONITORING - SUBJECT NOT IN JAIL OUT ON FURLOUGH OUT TO HOSPITAL

Table 12. Custody Status (continued)
There is some difference of length of stay associated with custody status (where the inmate is housed), but this more has to do with the gender and level of crime than directly to length of stay.
Jail: Central DivisionJACD
Male Min Sec CtrJAMN
Male Med Sec CtrJAMS
Male Max Sec CtrJAMX
1998 - - 2 days 71 days1999 - - - 14 days2000 7 days - 3 days 77 days2001 25 days 1 days 34 days 61 days2002 10 days 16 days 5 days 40 days2003 16 days 2 days 4 days 42 days2004 9 days 4 days 18 days 16 days2005 7 days 3 days 4 days 34 days2006 21 days 5 days 13 days 73 days
Female Max Sec CtrJAFC
Female Min Sec CtrJAFN
Old Boot Camp Annex Bldg - JAND
Temp Holding CellJASO
1998 - 2 days - -1999 - 5 days - -2000 - 18 days - -2001 20 days 99 days - 8 days2002 16 days 4 days - 9 days2003 7 days 6 days 2 days 3 days2004 11 days 4 days 3 days 35 days2005 6 days 3 days 3 days 37 days2006 21 days 13 days 15 days 44 days
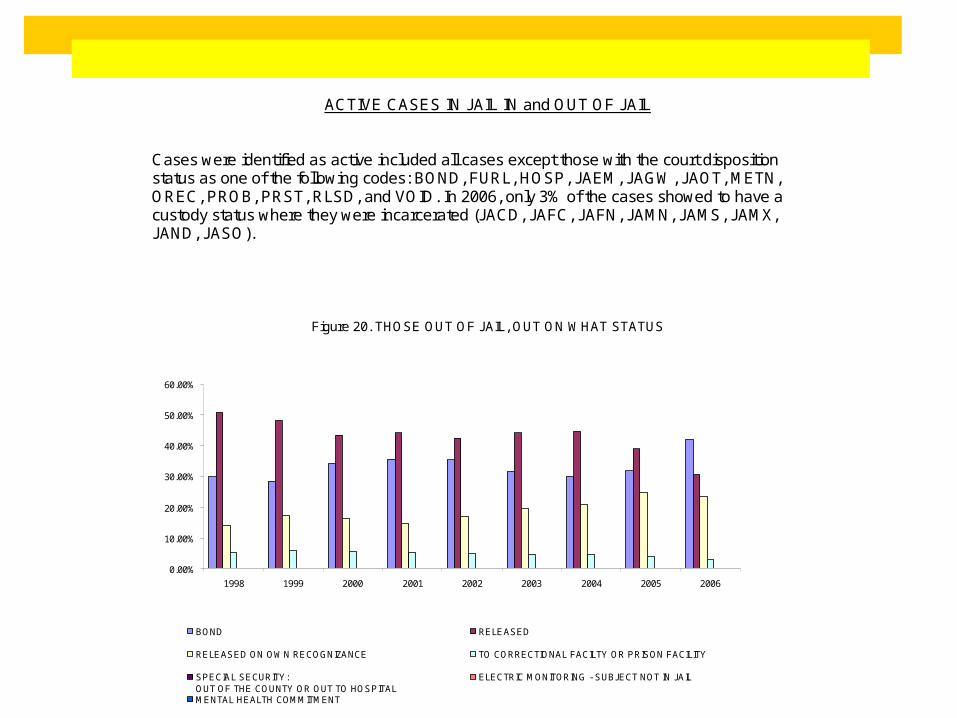
ACTIVE CASES IN JAIL IN and OUT OF JAIL Cases were identified as active included all cases except those with the court disposition status as one of the following codes: BOND, FURL, HOSP, JAEM, JAGW, JAOT, METN, OREC, PROB, PRST, RLSD, and VOID. In 2006, only 3% of the cases showed to have a custody status where they were incarcerated (JACD, JAFC, JAFN, JAMN, JAMS, JAMX, JAND, JASO).
Figure 20. THOSE OUT OF JAIL, OUT ON WHAT STATUS
0.00%
10.00%
20.00%
30.00%
40.00%
50.00%
60.00%
1998 1999 2000 2001 2002 2003 2004 2005 2006
BOND RELEASED
RELEASED ON OWN RECOGNIZANCE TO CORRECTIONAL FACILTY OR PRISON FACILITY
SPECIAL SECURITY: OUT OF THE COUNTY OR OUT TO HOSPITAL
ELECTRIC MONITORING - SUBJECT NOT IN JAIL
MENTAL HEALTH COMMITMENT
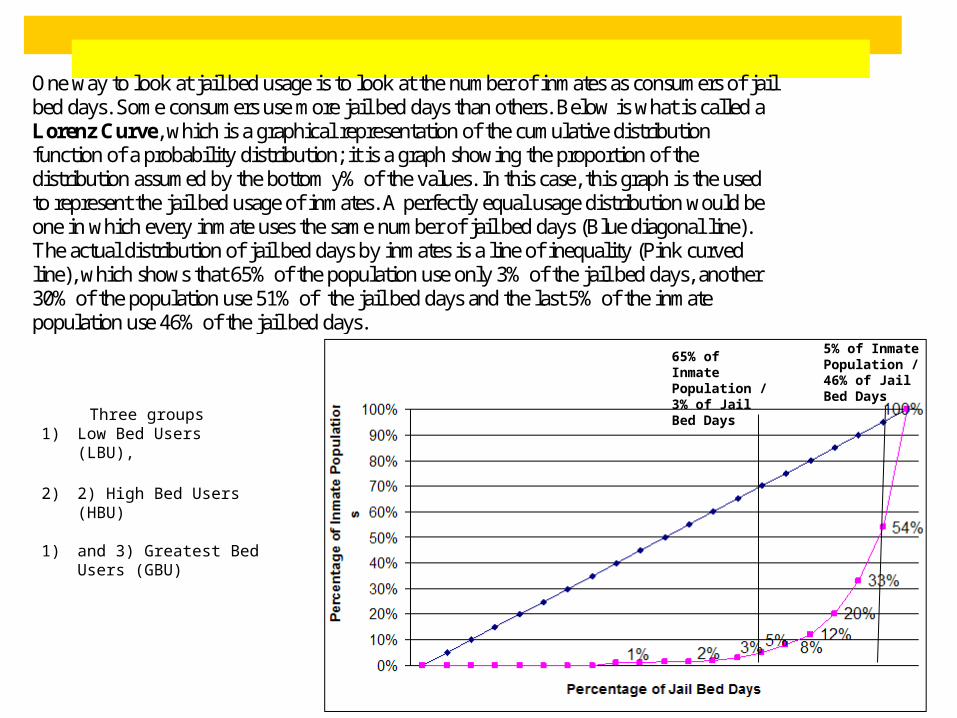
Three groups 1) Low Bed Users (LBU),
2) 2) High Bed Users (HBU) 1) and 3) Greatest Bed
Users (GBU)
65% of Inmate Population / 3% of Jail Bed Days
5% of Inmate Population / 46% of Jail Bed Days
One way to look at jail bed usage is to look at the number of inmates as consumers of jail bed days. Some consumers use more jail bed days than others. Below is what is called a Lorenz Curve, which is a graphical representation of the cumulative distribution function of a probability distribution; it is a graph showing the proportion of the distribution assumed by the bottom y% of the values. In this case, this graph is the used to represent the jail bed usage of inmates. A perfectly equal usage distribution would be one in which every inmate uses the same number of jail bed days (Blue diagonal line). The actual distribution of jail bed days by inmates is a line of inequality (Pink curved line), which shows that 65% of the population use only 3% of the jail bed days, another 30% of the population use 51% of the jail bed days and the last 5% of the inmate population use 46% of the jail bed days.
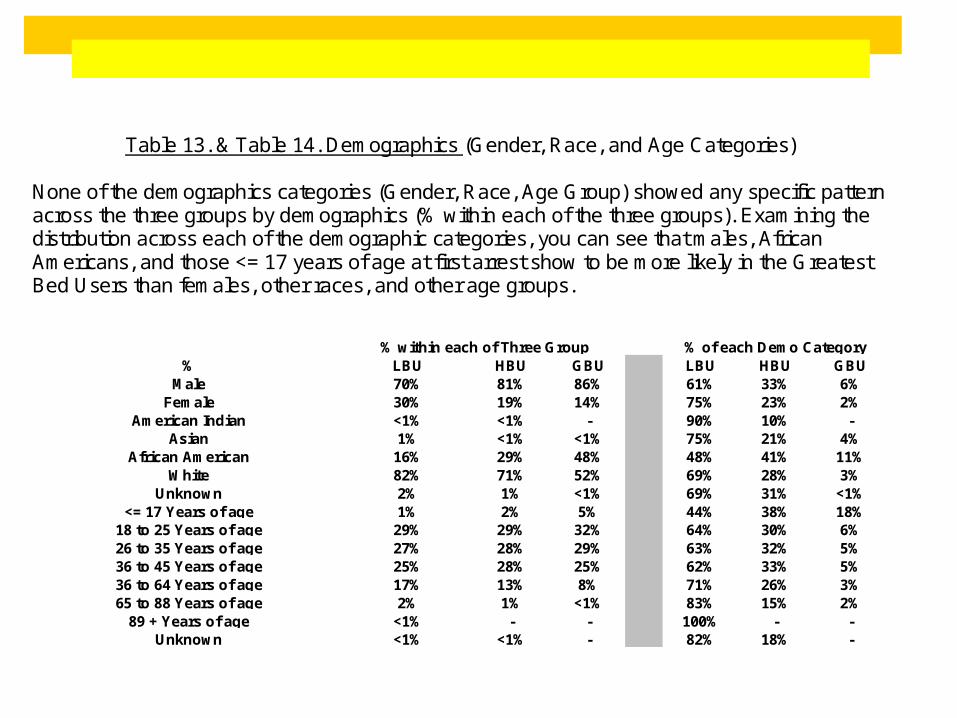
Table 13. & Table 14. Demographics (Gender, Race, and Age Categories) None of the demographics categories (Gender, Race, Age Group) showed any specific pattern across the three groups by demographics (% within each of the three groups). Examining the distribution across each of the demographic categories, you can see that males, African Americans, and those <= 17 years of age at first arrest show to be more likely in the Greatest Bed Users than females, other races, and other age groups.
% LBU HBU GBU LBU HBU GBUMale 70% 81% 86% 61% 33% 6%
Female 30% 19% 14% 75% 23% 2%American Indian <1% <1% - 90% 10% -
Asian 1% <1% <1% 75% 21% 4%African American 16% 29% 48% 48% 41% 11%
White 82% 71% 52% 69% 28% 3%Unknown 2% 1% <1% 69% 31% <1%
<= 17 Years of age 1% 2% 5% 44% 38% 18%18 to 25 Years of age 29% 29% 32% 64% 30% 6%26 to 35 Years of age 27% 28% 29% 63% 32% 5%36 to 45 Years of age 25% 28% 25% 62% 33% 5%36 to 64 Years of age 17% 13% 8% 71% 26% 3%65 to 88 Years of age 2% 1% <1% 83% 15% 2%
89 + Years of age <1% - - 100% - -Unknown <1% <1% - 82% 18% -
% within each of Three Group % of each Demo Category

Looking at the median length of stay for each of the three groups by demographics shows the extreme difference between the LBU from either the HBU and the GBU.
LBU HBU GBUALL 2 days 72 days 482 days
Gender LBU HBU GBUFemales 2 days 62 days 222 daysMales 2 days 74 days 254 days
RACE LBU HBU GBUAmerican Indian 1 days 128 days -Asian 2 days 78 days 496 daysAfrican American 2 days 91 days 501 daysWhite 2 days 65 days 465 daysUnknown 2 days 44 days 457 days
AGE GROUP LBU HBU GBU<=17 1 126 501
18to25 2 77 47726to35 2 71 48436to45 2 71 48246to64 2 59 48365to88 2 44.5 458
89+ 2 - -UNKNOWN 2 43.5 -

LBU HBU GBU
Number of Arrests 1 4 8Age at First Arrest 34 33 31
Number of Years in CJIS System 1 2 4Parole or Conditional Release Violation 7% 28% 29%
Failure to Appear 11% 13% 12%Felony Only 13% 25% 18%
Misdemeanor Only 81% 38% 7%Both Felony and Misdemeanor 5% 36% 74%
None <1% 1% <1%Substance Abuse Diag only 2% 4% 5%
Severe Mental Health Diag Only 2% 3% 6%Dual Diagnosis <1% 1% 2%
No Diagnosis found 96% 92% 87%EMS Interaction 10% 16% 21%IDS Interaction 4% 8% 13%
Medicaid Interaction 5% 7% 8%DSS Interaction 6% 14% 24%
Elder/Disabled Person Involved <1% <1% <1%Minor Involved 2% 2% 2%
Violent_weapon at arrest 1% 2% 4%Drug Crime 36% 50% 65%
Property Crime 22% 39% 58%Sex Crime 3% 5% 13%
Violent Crime 22% 31% 54%Moving Crime 18% 28% 35%
Other Crime 17% 27% 46%Drug Involved 9% 18% 22%
Alcohol Involved 22% 13% 7%Repeat Offender 24% 80% 94%
Table 15. Other Non-demographic Indicators
The non-demographic indicators that seem to identify difference between the three groups are Repeat offender, level of crime (Felony/Misdemeanor), Number of arrests, a violation of parole or conditional release.
Other factors were DSS interaction, which needs further investigation to understand; number of years in the CJIS system, which really can be explained that the more years in the CJIS system, the more arrests and days incarcerated; and the type of crime also showed a consistent increase across groups.

Interactions with more than two systems The majority of the CJIS population does not interact with other systems (76%). Of those who do interact with other systems, 22% interact with 1 or 2 other systems. There is approximately 2 % of the population, who interact with 3 to all 4 systems. (Table 16.)
CJIS Only 133124 76% CJIS & EMS Only 12932 7% CJIS & DSS Only 9103 5% CJIS & AHCA Only 3949 3% CJIS & IDS Only 3934 3% CJIS & EMS & DSS 2560 2% CJIS & EMS & IDS 1888 1% CJIS & EMS & AHCA 1644 1% CJIS & DSS & AHCA 1215 <1% CJIS & DSS & IDS 909 <1% CJIS & EMS & DSS & IDS 874 <1% CJIS & EMS & DSS & AHCA 795 <1% CJIS & IDS & Medicaid 698 <1% CJIS & EMS & IDS & ACHA 571 <1% CJIS & EMS & DSS & IDS & ACHA 385 <1% CJIS & DSS & IDS & ACHA 329 <1%
Length of stay over 365 days 1% of the inmate population length of stay is over one year, and median of 479 days. These individuals use up on average 10% of the jail day beds each year.
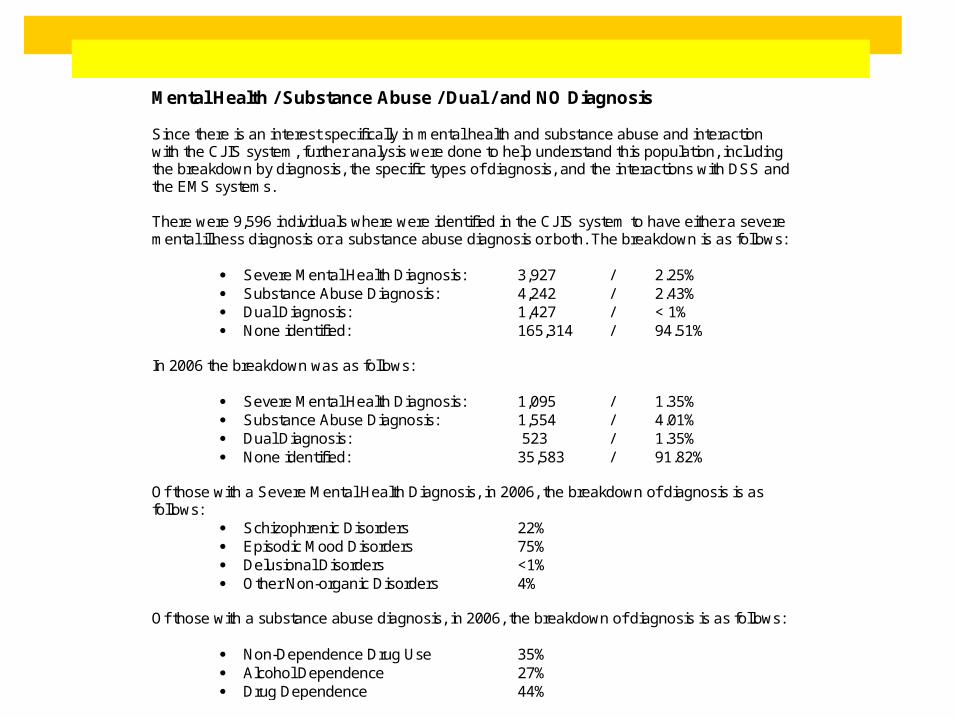
Mental Health / Substance Abuse / Dual / and NO Diagnosis Since there is an interest specifically in mental health and substance abuse and interaction with the CJIS system, further analysis were done to help understand this population, including the breakdown by diagnosis, the specific types of diagnosis, and the interactions with DSS and the EMS systems. There were 9,596 individuals where were identified in the CJIS system to have either a severe mental illness diagnosis or a substance abuse diagnosis or both. The breakdown is as follows:
Severe Mental Health Diagnosis: 3,927 / 2.25% Substance Abuse Diagnosis: 4,242 / 2.43% Dual Diagnosis: 1,427 / < 1% None identified: 165,314 / 94.51%
In 2006 the breakdown was as follows:
Severe Mental Health Diagnosis: 1,095 / 1.35% Substance Abuse Diagnosis: 1,554 / 4.01% Dual Diagnosis: 523 / 1.35% None identified: 35,583 / 91.82%
Of those with a Severe Mental Health Diagnosis, in 2006, the breakdown of diagnosis is as follows:
Schizophrenic Disorders 22% Episodic Mood Disorders 75% Delusional Disorders <1% Other Non-organic Disorders 4%
Of those with a substance abuse diagnosis, in 2006, the breakdown of diagnosis is as follows:
Non-Dependence Drug Use 35% Alcohol Dependence 27% Drug Dependence 44%

Geographic Information Systems (GIS) Mapping of Inmate Population using residential zip codes
The GIS piece of this paper was done by Luis Perez, a PhD student in Education at USF, as part of his course work requirements.
Overall: As stated in the section examining residency status of inmate the majority of the inmate population reside in Pinellas County, and where there is increased residential population density in Pinellas County there is also an increase in the density of residency of the inmate population.
In the three surrounding counties there are pockets where 1 to 10 of the Pinellas inmate population resides.
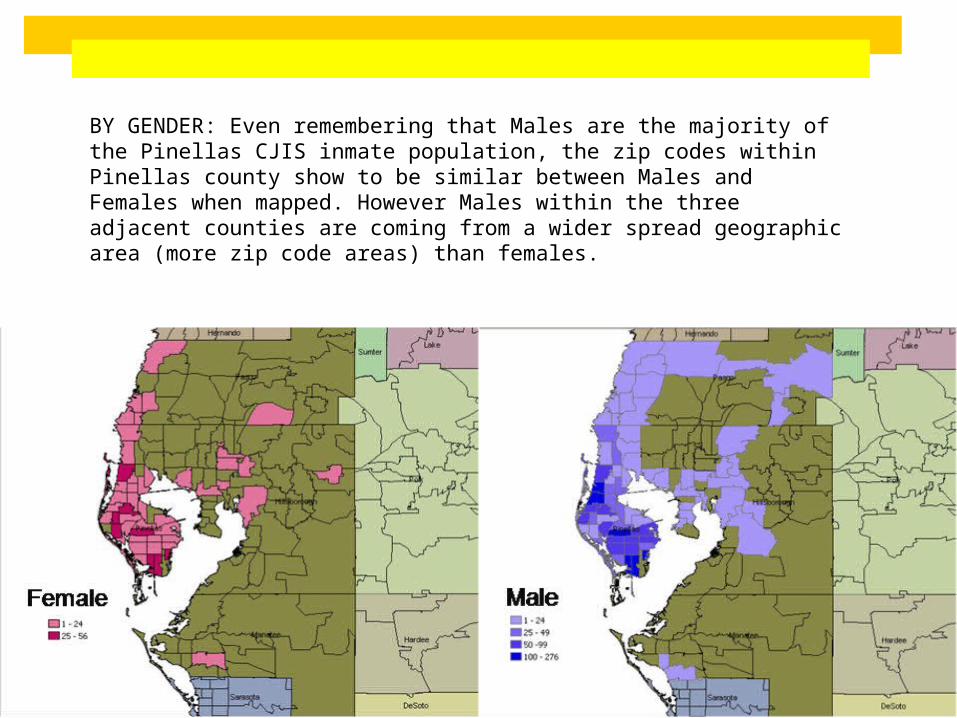
BY GENDER: Even remembering that Males are the majority of the Pinellas CJIS inmate population, the zip codes within Pinellas county show to be similar between Males and Females when mapped. However Males within the three adjacent counties are coming from a wider spread geographic area (more zip code areas) than females.
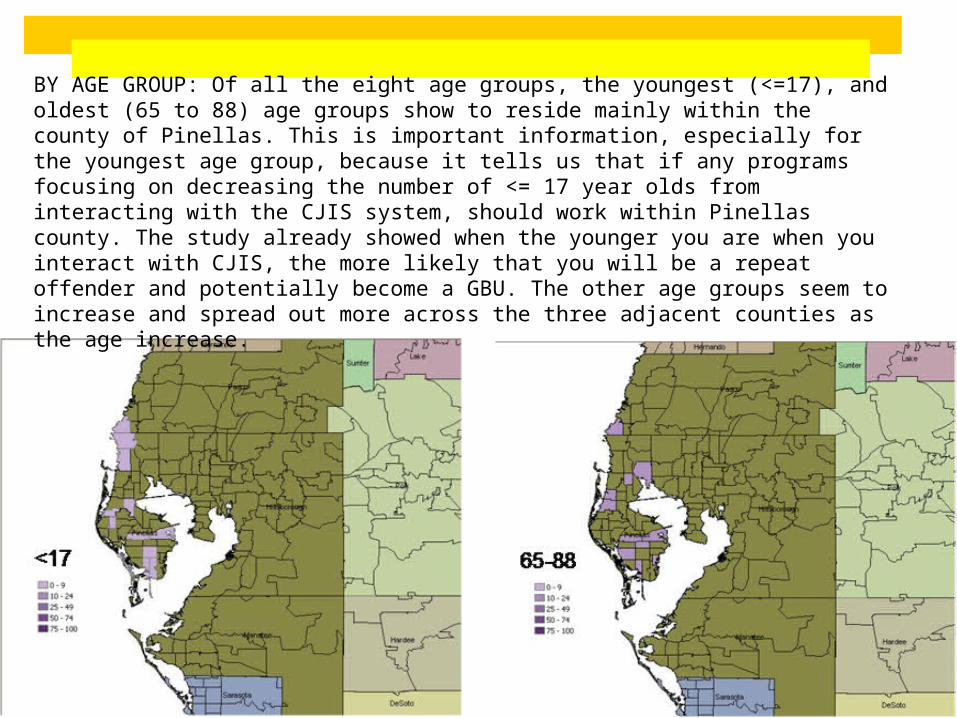
BY AGE GROUP: Of all the eight age groups, the youngest (<=17), and oldest (65 to 88) age groups show to reside mainly within the county of Pinellas. This is important information, especially for the youngest age group, because it tells us that if any programs focusing on decreasing the number of <= 17 year olds from interacting with the CJIS system, should work within Pinellas county. The study already showed when the younger you are when you interact with CJIS, the more likely that you will be a repeat offender and potentially become a GBU. The other age groups seem to increase and spread out more across the three adjacent counties as the age increase.


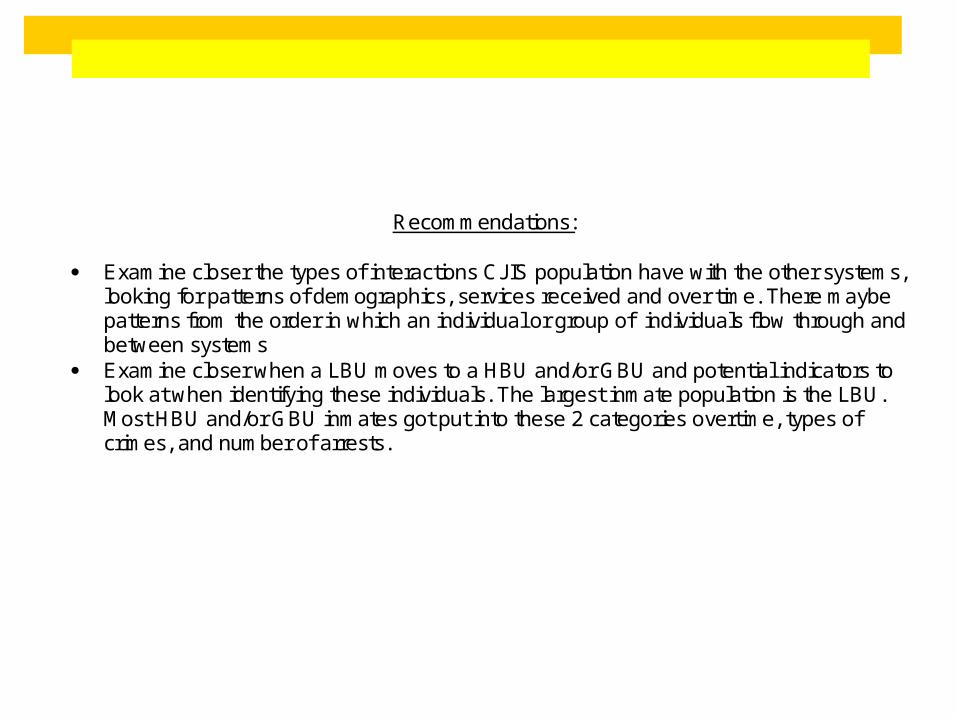
Recommendations:
Examine closer the types of interactions CJIS population have with the other systems, looking for patterns of demographics, services received and over time. There maybe patterns from the order in which an individual or group of individuals flow through and between systems
Examine closer when a LBU moves to a HBU and/or GBU and potential indicators to look at when identifying these individuals. The largest inmate population is the LBU. Most HBU and/or GBU inmates got put into these 2 categories overtime, types of crimes, and number of arrests.
Incorporating case studies and in-house studies to answer the questions that the data housed through the Pinellas Data Collaborative could not answer.
o Review of notices to appear over time - Unknown how to identify these individuals
o Review of housing and services for inmate upon release - Data not collected by the Data Collaborative
o Review of programs/education for inmate during incarceration - Data not collected by the Data Collaborative
o Correlation between CJIS/jail and homeless - Data not yet collected by the Data Collaborative
A Sub-study to examine patterns of those who have volunteered for drug court A sub-study to look at those inmates who can also be found in the Dept of Juvenile
Justice to see if any indicators can be found to identify youth who are more likely to enter into the CJIS jail system over time and programs to prevent this from happening.
A evaluation of those who are HBU, GBU to see if the numbers can be decreased, decrease their length of stay, or divert them to prison system. Also evaluate those who are LBU and see if the numbers can be decreased, through non-arrest, early release, diversion to other programs, etc.
Recommendations:
Examine closer the types of interactions CJIS population have with the other systems, looking for patterns of demographics, services received and over time. There maybe patterns from the order in which an individual or group of individuals flow through and between systems
Examine closer when a LBU moves to a HBU and/or GBU and potential indicators to look at when identifying these individuals. The largest inmate population is the LBU. Most HBU and/or GBU inmates got put into these 2 categories overtime, types of crimes, and number of arrests.

Incorporating case studies and in-house studies to answer the questions that the data housed through the Pinellas Data Collaborative could not answer.
o Review of notices to appear over time - Unknown how to identify these individuals
o Review of housing and services for inmate upon release - Data not collected by the Data Collaborative
o Review of programs/education for inmate during incarceration - Data not collected by the Data Collaborative
o Correlation between CJIS/jail and homeless - Data not yet collected by the Data Collaborative
A Sub-study to examine patterns of those who have volunteered for drug court A sub-study to look at those inmates who can also be found in the Dept of Juvenile
Justice to see if any indicators can be found to identify youth who are more likely to enter into the CJIS jail system over time and programs to prevent this from happening.
A evaluation of those who are HBU, GBU to see if the numbers can be decreased, decrease their length of stay, or divert them to prison system. Also evaluate those who are LBU and see if the numbers can be decreased, through non-arrest, early release, diversion to other programs, etc.
Recommendations Continued….
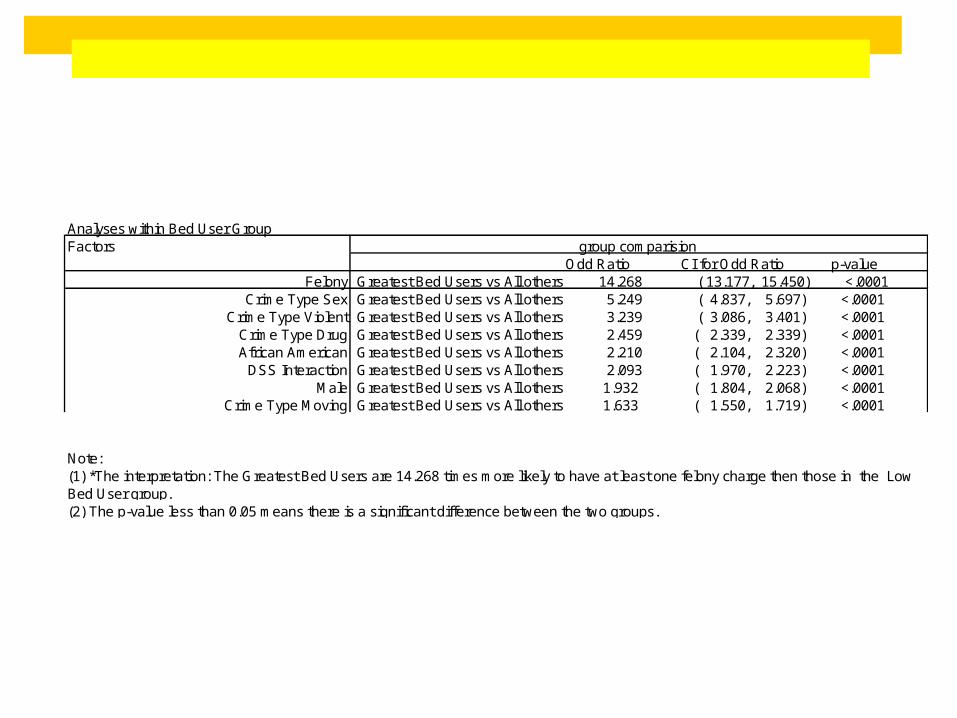
Analyses within Bed User Group Factors group comparision
Odd Ratio CI for Odd Ratio p-valueFelony Greatest Bed Users vs All others 14.268 ( 13.177, 15.450) <.0001
Crime Type Sex Greatest Bed Users vs All others 5.249 ( 4.837, 5.697) <.0001Crime Type Violent Greatest Bed Users vs All others 3.239 ( 3.086, 3.401) <.0001
Crime Type Drug Greatest Bed Users vs All others 2.459 ( 2.339, 2.339) <.0001African American Greatest Bed Users vs All others 2.210 ( 2.104, 2.320) <.0001
DSS Interaction Greatest Bed Users vs All others 2.093 ( 1.970, 2.223) <.0001Male Greatest Bed Users vs All others 1.932 ( 1.804, 2.068) <.0001
Crime Type Moving Greatest Bed Users vs All others 1.633 ( 1.550, 1.719) <.0001
Note:
(2) The p-value less than 0.05 means there is a significant difference between the two groups.
(1) *The interpretation: The Greatest Bed Users are 14.268 times more likely to have at least one felony charge then those in the Low Bed User group.

Analyses within Bed User Group Factors group comparision
Odd Ratio CI for Odd Ratio p-valueFelony High Bed Users vs Low Bed Users 6.537 ( 6.381, 6.697) <.0001
note: omited the Greatest Bed User group DSS Interaction High Bed Users vs Low Bed Users 2.230 ( 2.141, 2.323) <.0001
note: omited the Greatest Bed User group IDS Interaction High Bed Users vs Low Bed Users 2.048 ( 1.946, 2.157) <.0001
note: omited the Greatest Bed User group Male High Bed Users vs Low Bed Users 2.024 ( 1.966, 2.082) <.0001
African American High Bed Users vs Low Bed Users 1.629 ( 1.583, 1.675) <.0001 note: omited the Greatest Bed User group
Failure to Appear High Bed Users vs Low Bed Users 1.512 ( 1.459, 1.566) <.0001 note: omited the Greatest Bed User group
EMS Interaction High Bed Users vs Low Bed Users 1.434 ( 1.384, 1.487) <.0001 note: omited the Greatest Bed User group
Drug Involvement High Bed Users vs Low Bed Users 1.391 ( 1.344, 1.440) <.0001 note: omited the Greatest Bed User group
Medicaid Interaction High Bed Users vs Low Bed Users 1.112 ( 1.056, 1.170) <.0001 note: omited the Greatest Bed User group
Note:(1) *The interpretation: The High Bed Users are 6.537 times more likely to have at least one felony charge then those in either the High Bed User group or the Low Bed User group.(2) The p-value less than 0.05 means there is a significant difference between the two groups.
Purposes and Uses of this presentation:This presentation was generated in response to specific questions posed by
member of the Pinellas Data Collaborative. It was created to inform administrative policy and program decisions that benefit the citizens of Pinellas County. Before
reusing or citing findings in this report, please contact the Data Collaborative to ensure accurate understanding of the analyses and interpretation of results. Questions should
be directed to Diane Haynes at [email protected] or 813-974-2056.
Recommended