Beth Scott Research FellowUniversity of Aberdeen
What happens when you
institutionalise science?
Using North Sea cod as an example

Outline• A brief look back at history of
fisheries science/management• The essential guide to the
understanding of fisheries management
Why it has all gone wrong• fish as animals • sexual maturity and genetics• migration and mating behaviour•climate change
What can be done?

Fisheries science A European institution since 1902
(ICES - International council for the exploration of the seas) Fishing records for 1000 years
and scientific investigation from the mid 1800’s
Johan Hjort - 1914 Identified fundamentals of biology of cod.

The good and the bad• Hjort’s (1914) conclusions have had a most powerful influence on fisheries
research • He argued that the number of juvenile fish surviving each year were not due
to variations in the quantities of eggs spawned but that they were most likely due to annual fluctuations in the amount of plankton available as food for the larvae, and to dispersal patterns (where the larvae were ‘blown’ to).
• Good - it laid the foundations for explorations which try to identify what influence climatic effects has on the production of food and hence on survival of young fish.
• Bad - it assumes there is no relationship between the number of fish reproducing and the success of juvenile survival.

Fisheries science and the fisherman In the beginning the interaction was positive - the goal was to understand why fishing was better in some years and some areas - to help the fishing community.
• Fisheries science was at the forefront of ecological research, questioning animal behaviour, population dynamics and climatological interactions.

Technological advanceshorsepower, Sonar (fish finders
Law of the Sea 1978 (200 mile limit for management)
• Recognition that the sea’s resources were not inexhaustible.
• The need to have tools for agreeing international standards for management limits.
• Introduction of Mathematical modelling - the beginning of setting in stone the direction of research.
The essential guide to fisheries management
To understand why fisheries is managed the way it is - with one
number called the
TAC (total allowable catch).

Recruitment
Number of juveniles surviving to 1 year
Number of animals big enough to be caught in the fishery

Spawning stock Biomass
The total sum in weight of the mass of fish that are mature and capable of spawning that year.

Maximal sustainable yieldR
EC
RU
ITS
STOCK - BIOMASS OF SPAWNERS
Stocks thought to be more productive at lower rather than higher levels due to 1) a low number of adults can successfully produce a high number of recruits and 2) there is ‘interference’ (density dependence) of a larger stock size with survival and growth of recruits.
Level at which stock is recommend to be fished in order to keep surplus production at maximum level

Fisheries Management across the world is based on the assumption that there is a real relationship between the
weight of the stock and subsequent recruitment.

Why the collapses ?

100 years of catch information
The fishing was reduced during the first and second world wars
Technologically enhanced catches


Continuously high and increasing fishing pressure leads to loss of big fish
Number of larger fish and the percentage of fish killed each year
0.00E+00
2.00E+06
4.00E+06
6.00E+06
8.00E+06
1.00E+07
1.20E+07
1.40E+07
1.60E+07
1.80E+07
1963 1966 1969 1972 1975 1978 1981 1984 1987 1990 1993 1996 1999
Year
Nu
mb
er
of
larg
er
fis
h (
>9
0c
m)
0.45
0.5
0.55
0.6
0.65
0.7
0.75
Pe
rce
nta
ge
of
fis
h k
ille
d
Number of large fish Percentage of fish killed by fishing

Fisheries Resource Conservation Council (FRCC) in 1997
“One factor in the collapse of Atlantic Canada’s groundfish fisheries was a lack of attention to the logical connection between the spawning and future recruitment of young fish.”
“The reproductive capacity of the stock appears not to be properly measured by the absolute volume of spawning biomass, as generally assumed.”

Do 10 small cod really have the same reproductive output as one of these mother cod?
Stock (SSB) / Recruitment Relationship
Assumes constant number of eggs / per gram of biomass.

Critical Factors ignored once the methodology for assessing and predicting
population size is institutionalised • Fish are individual animals not biomass!
• At lower levels of stock sizes there is also a lack of older/larger individuals.
• What does heavy fishing pressure do to other aspects of a fish’s behaviour and what are the effects in the longer term?

Decrease in Field Work:
It’s expensive.
Biology is time consuming.
Computer
modelling is cheap and fast. Photo by John Dunn

IBM: From individuals to the Population
Reproductive output of COD over the spawning season
• Comparison of 6 populations with same spawning stock biomass.
• Decrease in reproductive output in more heavily fished populations
• Differences in output due to assumptions about the relationship between mother and egg quality.
• Shift in peak date of 3 weeks - such that the majority of production is later
Day of the year
Rep
rod
ucti
ve o
utpu
t
What happens when you only have young fish left in the spawning population?

First time vs second time spawners
• First time spawn fewer and smaller eggs than second and subsequent spawners
• A very low percentage of first time spawners eggs that are fertilised or hatch successfully.
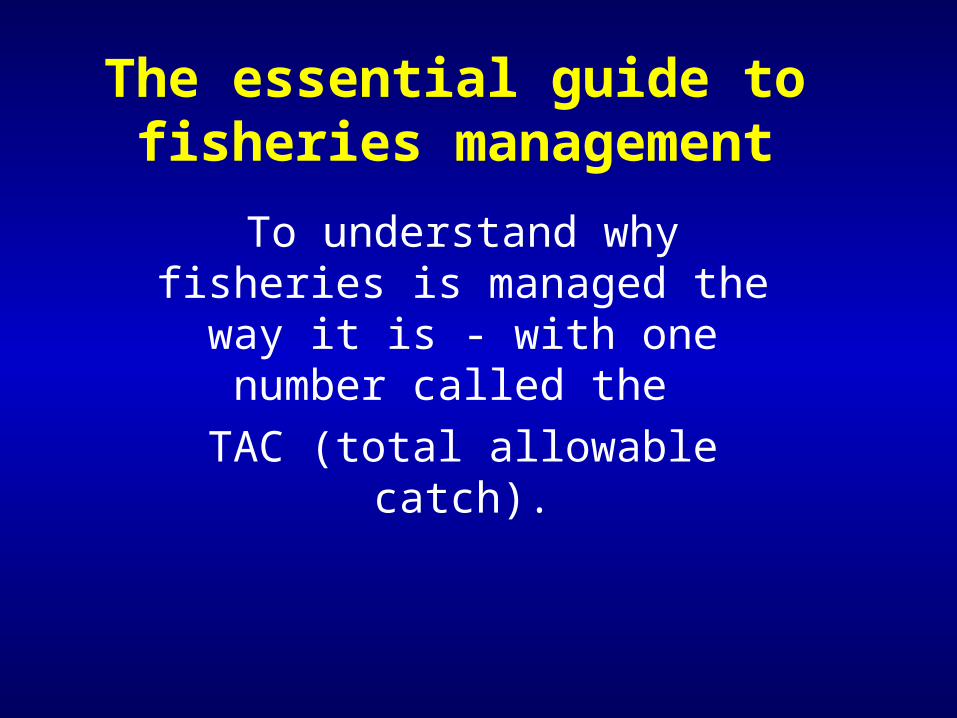
Condition / Population structure - effect on SRP

Sexual Maturation
• The age or size of a fish when it becomes sexually mature is very flexible and may be density dependent via food limitations and /or genetic.
• Function of growth history (food and temperature)
• Fish that are heavier (i.e. more surplus energy) at a given length have a higher probability to be sexually mature.
length
Better condition
Length
50%
Maturity

Sexual Maturity: Effects of fishing?
• Fishing pressure may have caused shifts in sexual maturity and fecundity.
• Cod on Canadian East coast - maturity at smaller size and age (shift from 4 to 2 years of age)
• If density driven - i.e. more food per fish - why are they no larger at age and yet higher fecundity?
Age
Life time reproductive output/ size at age
Mature early
Mature later
now

Genetic Selection?• Most fish are caught before they can spawn - therefore the only ones getting to spawn are those fish that mature early.•If that is a trait with a degree of heritability than fishing pressure is acting as a very large selective force to kill all fish that don’t mature early.•Early maturity comes with a cost in length of life and smaller size at maturity and slower growth rates.
•If timing of and size at maturation are heritable - genetic models predict it will take natural section at least 250 years before we can hope to see the re-appearance of genotypes for longer lived, bigger bodied, later maturing cod.

Resilience because so fecund?
• Jeff Hutchings - points out that high fecundity does not mean high resilience (think of tree seeds?)
• Most fished populations do not spring back
34
7
49
Doing worse
Not recovered Recovered

Fish Migrate
• Fish - just like many other animals - migrate.
• They migrate for the same reasons - making use of seasonal and spatial changes in resources
• They have constraints for - best routes and where to have babies (for fish the need is to be ‘upsteam’ - even if attaching your eggs)

Do fish learn?
• What physical clues / constraints can there be?
• - currents• - bottom features• - watermass type
• How much is from watching what others do?
A. Corton - Herring not coming back
Before 1960’s
Now

Cod Highways
• George Ross • constraints for cod
migration - water can’t be too cool (> 20C)
• Found 80% of the stock in one gully - following large scouts

Migrating cod scouts out in advance

Cod spawning behaviour along the migration route
Pairs rise above concentrated group

• The interaction of spawning location , timing and size/age of fish has also been largely ignored.
Spawning locations , timing and size groups
Big Fish
Medium
Small Fish•Does it matter where and when you kill fish during spawning?

Eggs to Larvae• Location of where the
larvae end up are heavily dependant on the effects of weather and on where eggs were released.
• Will they be transported farther or kept near area of spawning?

Mortality during spawning
• Fish are more concentrated
• Male and females are more likely to be in different locations at different times
• Do some locations contain - ‘better’ spawners than others?

Percent increases from changing from High fishing pressure of both Large and medium sized fish
(assumptiong that large fish in good quaiity site, medium in mean, small in low quality)
0.00%
10.00%
20.00%
30.00%
40.00%
50.00%
60.00%
1 2 3 4 5 6populations
Pe
rce
nta
ge
inc
rea
se
med fish - low F
large fish - low F
med & large - low F
Lots of big fish fewer big fish very few big fish
Different quality of spawning areas

Climate = Foodbut it is the factor we can’t really
control or manage • Condition of adults -which leads to the
number and quality of eggs
• Feeding opportunities for larvae - which leads to the survival changes for juveniles
North Atlantic Oscillation
Spawning liver condition
Recruitment

Look at stratified vs mixed regions in the North Sea
• Spatial and seasonal pattern of water mass characteristics in the North Sea

A day in the life of a fish• We must understand fish as animals.
• Ask questions about population structure, genetic selection, condition, spawning behaviour and climate effects before we can begin to imagine that we understand a species well enough to manage it.
• To describe their habitat one must use physical characteristics in 3 dimensions and time.

New relationships?
• Including age/size specific fecundity and viability should decrease uncertainty in stock-recruitment relationships .
• A new index for stock characteristics should produce a clearer relationship between survival and the spawning stock
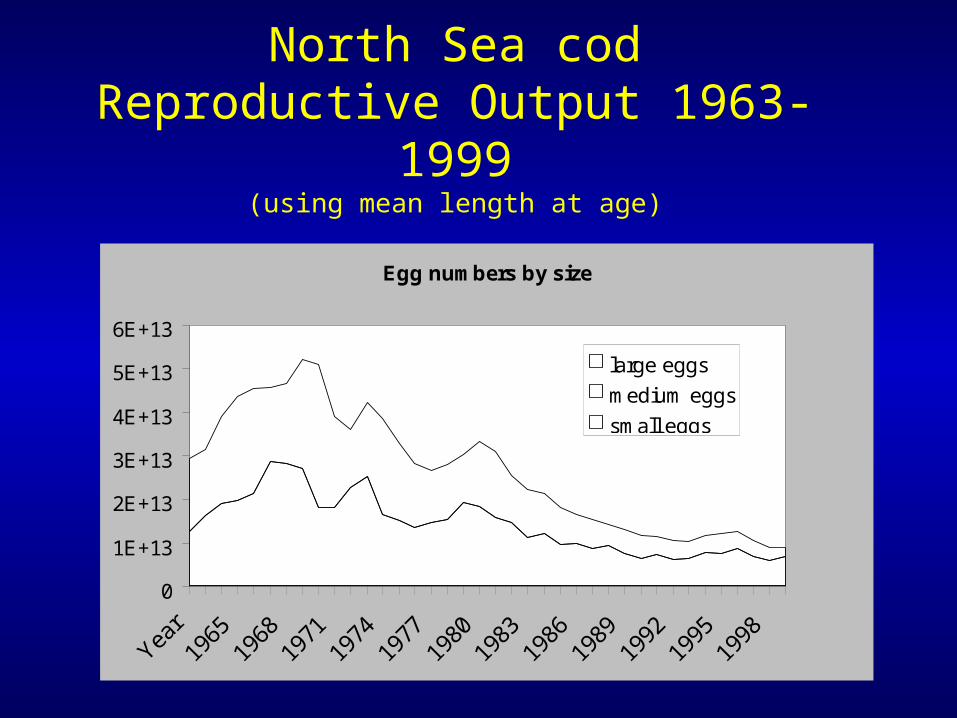
North Sea codReproductive Output 1963-1999
(using mean length at age)
Picture of years vs # eggs
vs mean egg size
Egg numbers by size
0
1E+13
2E+13
3E+13
4E+13
5E+13
6E+13
large eggs
medium eggs
small eggs

recruitment vs egg size
R2 = 0.66
0.00E+00
1.00E+08
2.00E+08
3.00E+08
4.00E+08
5.00E+08
6.00E+08
7.00E+08
8.00E+08
1.37 1.375 1.38 1.385 1.39 1.395 1.4 1.405 1.41
mean egg size
recr
uitm
ent

What to do? Decrease Fishing pressure
•If you want reliable, sustainable fisheries you must accept that they can only be fished at low levels of fishing effort to keep around a needed number of older, wiser, bigger, better breeding fish.
•North Sea cod - that is 4-5 times lower than the current level.
• The longer lived the species - the lower the level of fishing allowed.

Wait for the news of the next one Monk fish!
Recommended


![The Aberdeen Democrat. (Aberdeen, S.D.), 1905-03-17, [p ]](https://img.pdfslide.us/doc/110x75/616d0ff553a9be267648fc3d/the-aberdeen-democrat-aberdeen-sd-1905-03-17-p-.jpg)