July 19th, 2018
Anders Martinsson, President and CEO
Daniel Fäldt, CFO
BE Q2
BE GROUP
INTERIM REPORT
APRIL – JUNE 2018
Agenda
Q2 Overview
Financials in Detail
Business Areas - Status
Outlook
Q&A
Net sales increased by 14% to SEK 1,312 M (1,147)
The underlying operating result increased to SEK 26 M (21)
The underlying operating result and the operating result were affected by a
provision for bad debt and inventory adjustment in the Baltics of SEK -12 M
The operating result included items affecting comparability of SEK -16M, no cash
flow impact, related to the exit of the operation in Prerov, Czech Republic
Operating result increased to SEK 22 M (-13)
Result after tax increased to SEK 7 M (-14)
Cash flow from operating activities increased to SEK 17 M (-49)
Earnings per share increased to SEK 0.54 (-1.03)
Financial highlights – Q2 2018
Market situation
Demand in our main markets remains strong with minor price increases
Customers in both main segments, Construction and Manufacturing,
have high production output
During the quarter, tonnage in business area Sweden & Poland grew by
14 percent and sales increased by 28 percent
During the quarter, tonnage in business area Finland & Baltics grew by
2 percent and sales increased by 9 percent
The tough competition in the thin sheets business has continued both in
Sweden and Finland
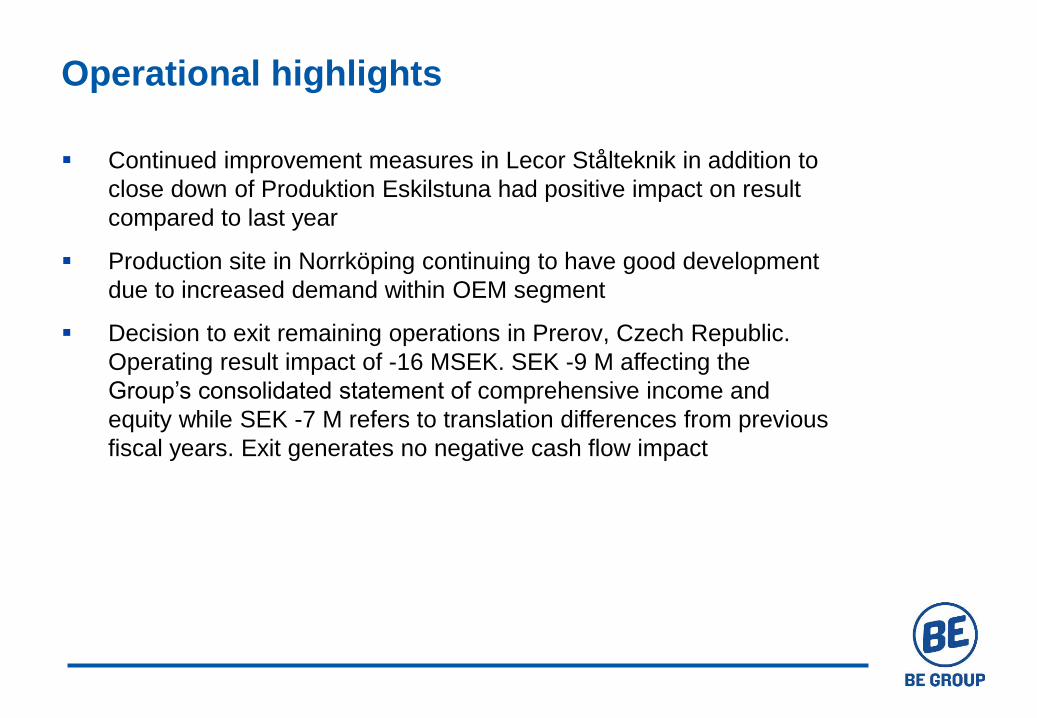
Operational highlights
Continued improvement measures in Lecor Stålteknik in addition to
close down of Produktion Eskilstuna had positive impact on result
compared to last year
Production site in Norrköping continuing to have good development
due to increased demand within OEM segment
Decision to exit remaining operations in Prerov, Czech Republic.
Operating result impact of -16 MSEK. SEK -9 M affecting the
Group’s consolidated statement of comprehensive income and
equity while SEK -7 M refers to translation differences from previous
fiscal years. Exit generates no negative cash flow impact
FINANCIALS
IN DETAIL
Growth in tonnage and sales (%)
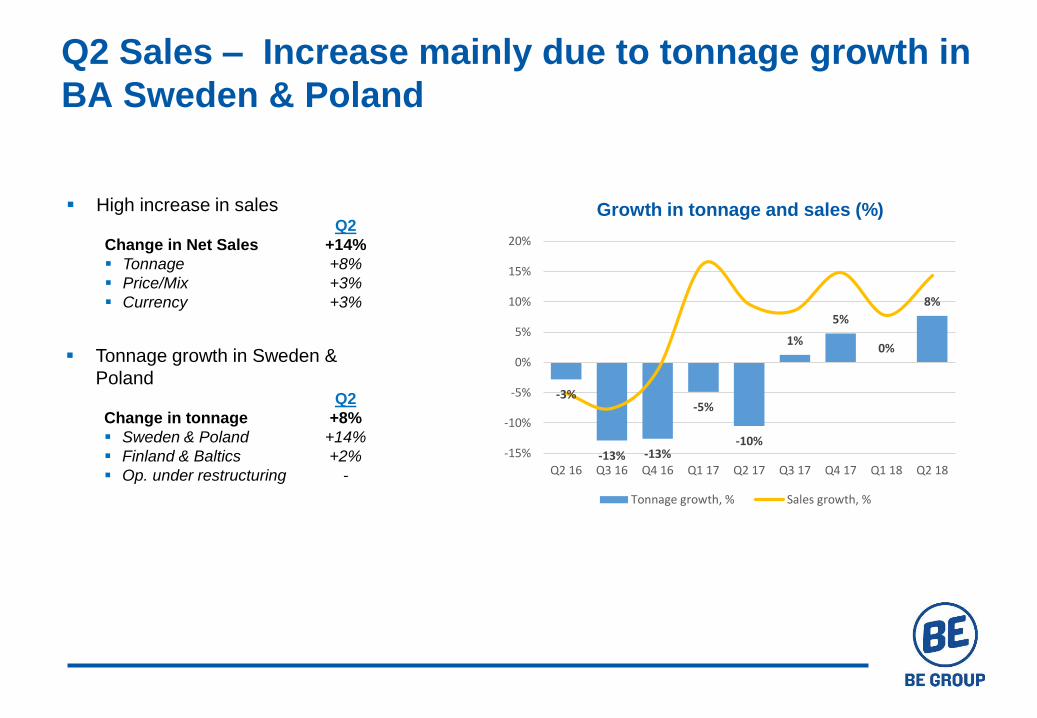
Q2 Sales – Increase mainly due to tonnage growth in
BA Sweden & Poland
High increase in salesQ2
Change in Net Sales +14%
Tonnage +8%
Price/Mix +3%
Currency +3%
Tonnage growth in Sweden &
PolandQ2
Change in tonnage +8%
Sweden & Poland +14%
Finland & Baltics +2%
Op. under restructuring -
-3%
-13% -13%
-5%
-10%
1%
5%
0%
8%
-15%
-10%
-5%
0%
5%
10%
15%
20%
Q2 16 Q3 16 Q4 16 Q1 17 Q2 17 Q3 17 Q4 17 Q1 18 Q2 18
Tonnage growth, % Sales growth, %
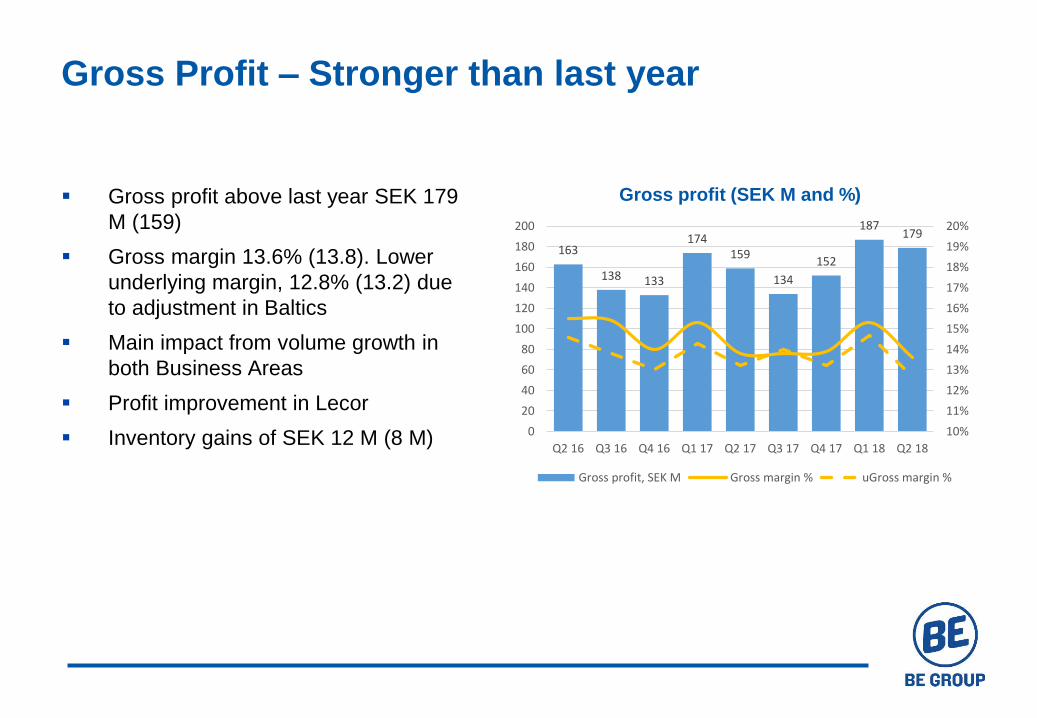
Gross profit above last year SEK 179
M (159)
Gross margin 13.6% (13.8). Lower
underlying margin, 12.8% (13.2) due
to adjustment in Baltics
Main impact from volume growth in
both Business Areas
Profit improvement in Lecor
Inventory gains of SEK 12 M (8 M)
Gross profit (SEK M and %)
Gross Profit – Stronger than last year
163
138 133
174159
134
152
187179
10%
11%
12%
13%
14%
15%
16%
17%
18%
19%
20%
0
20
40
60
80
100
120
140
160
180
200
Q2 16 Q3 16 Q4 16 Q1 17 Q2 17 Q3 17 Q4 17 Q1 18 Q2 18
Gross profit, SEK M Gross margin % uGross margin %
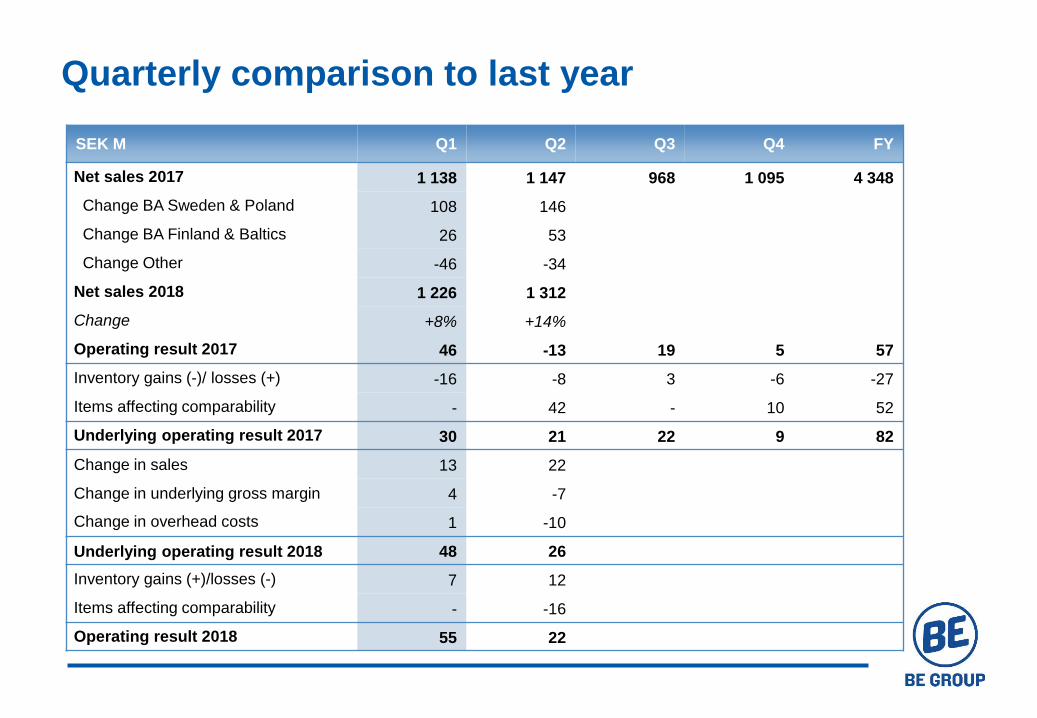
Quarterly comparison to last year
SEK M Q1 Q2 Q3 Q4 FY
Net sales 2017 1 138 1 147 968 1 095 4 348
Change BA Sweden & Poland 108 146
Change BA Finland & Baltics 26 53
Change Other -46 -34
Net sales 2018 1 226 1 312
Change +8% +14%
Operating result 2017 46 -13 19 5 57
Inventory gains (-)/ losses (+) -16 -8 3 -6 -27
Items affecting comparability - 42 - 10 52
Underlying operating result 2017 30 21 22 9 82
Change in sales 13 22
Change in underlying gross margin 4 -7
Change in overhead costs 1 -10
Underlying operating result 2018 48 26
Inventory gains (+)/losses (-) 7 12
Items affecting comparability - -16
Operating result 2018 55 22
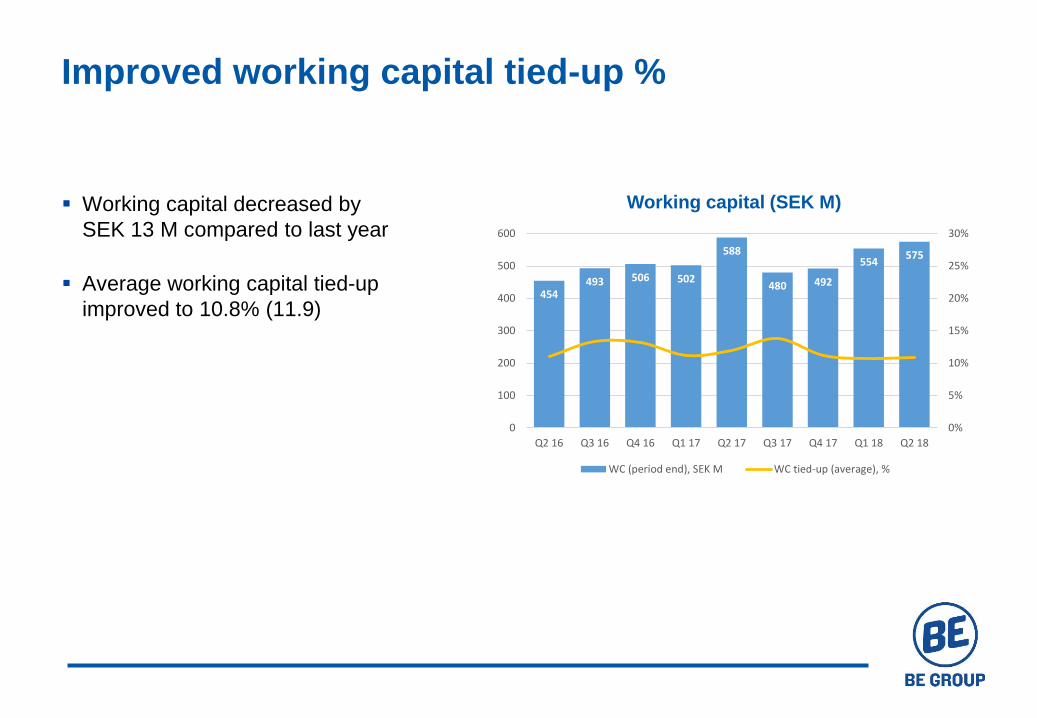
Working capital (SEK M) Working capital decreased by
SEK 13 M compared to last year
Average working capital tied-up
improved to 10.8% (11.9)
Improved working capital tied-up %
454493 506 502
588
480 492
554575
0%
5%
10%
15%
20%
25%
30%
0
100
200
300
400
500
600
Q2 16 Q3 16 Q4 16 Q1 17 Q2 17 Q3 17 Q4 17 Q1 18 Q2 18
WC (period end), SEK M WC tied-up (average), %
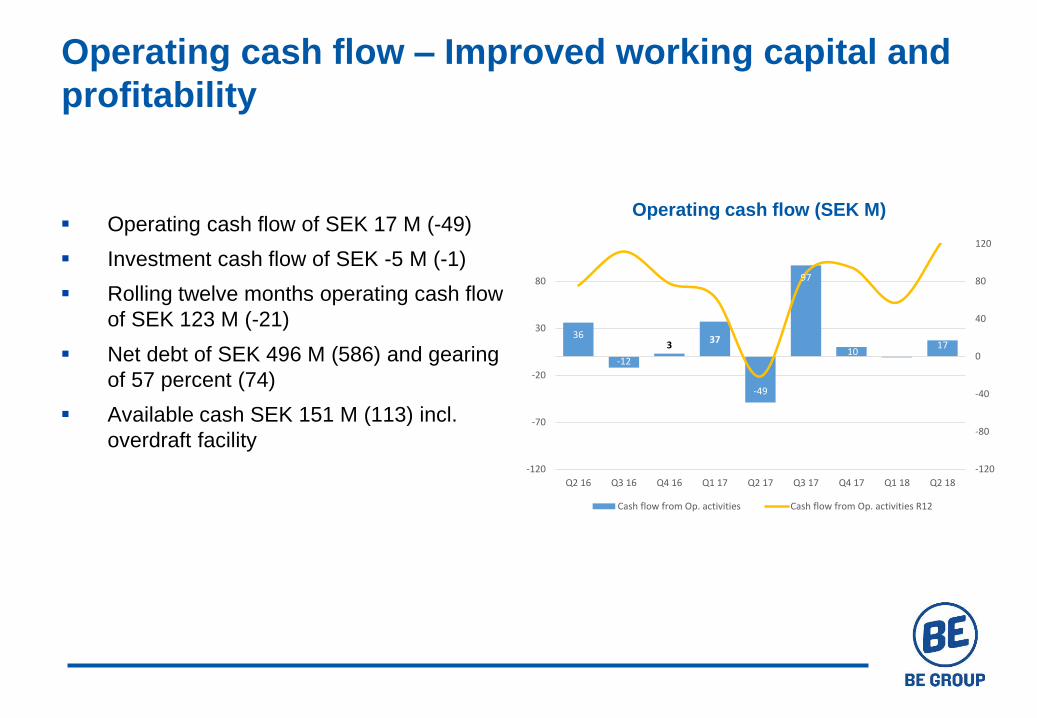
Operating cash flow of SEK 17 M (-49)
Investment cash flow of SEK -5 M (-1)
Rolling twelve months operating cash flow
of SEK 123 M (-21)
Net debt of SEK 496 M (586) and gearing
of 57 percent (74)
Available cash SEK 151 M (113) incl.
overdraft facility
Operating cash flow (SEK M)
Operating cash flow – Improved working capital and
profitability
-1
36
-12
337
-49
97
10
-1
17
-120
-80
-40
0
40
80
120
-120
-70
-20
30
80
Q2 16 Q3 16 Q4 16 Q1 17 Q2 17 Q3 17 Q4 17 Q1 18 Q2 18
Cash flow from Op. activities Cash flow from Op. activities R12
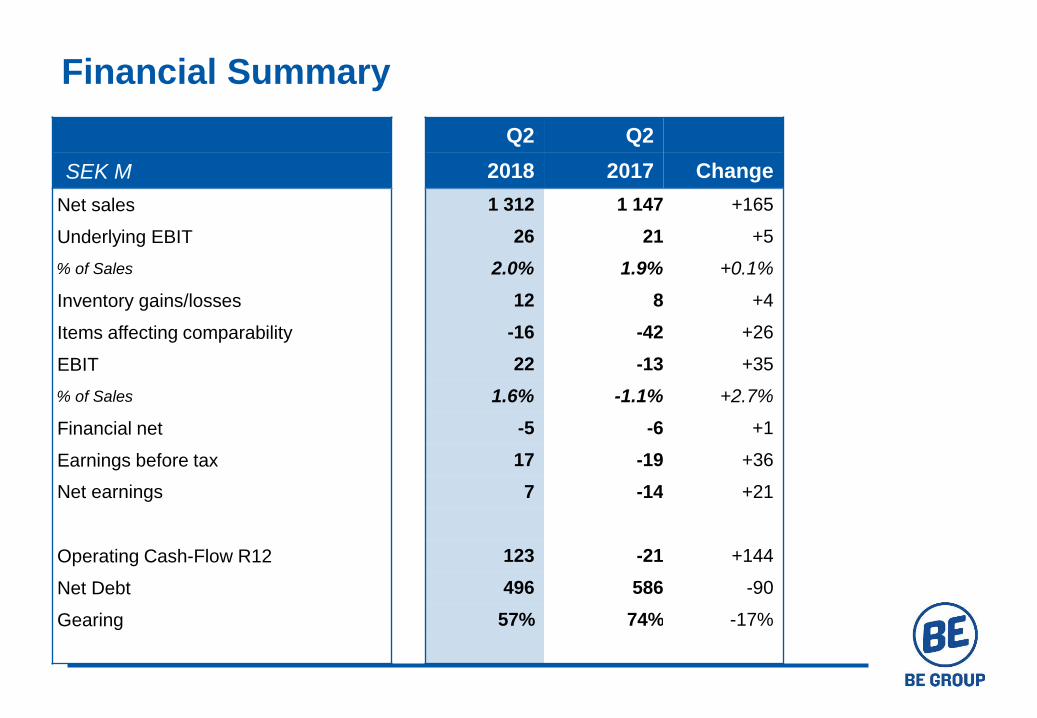
Financial Summary
Q2 Q2
SEK M 2018 2017 Change
Net sales 1 312 1 147 +165
Underlying EBIT 26 21 +5
% of Sales 2.0% 1.9% +0.1%
Inventory gains/losses 12 8 +4
Items affecting comparability -16 -42 +26
EBIT 22 -13 +35
% of Sales 1.6% -1.1% +2.7%
Financial net -5 -6 +1
Earnings before tax 17 -19 +36
Net earnings 7 -14 +21
Operating Cash-Flow R12 123 -21 +144
Net Debt 496 586 -90
Gearing 57% 74% -17%
BUSINESS AREAS
- STATUS Q2 2018
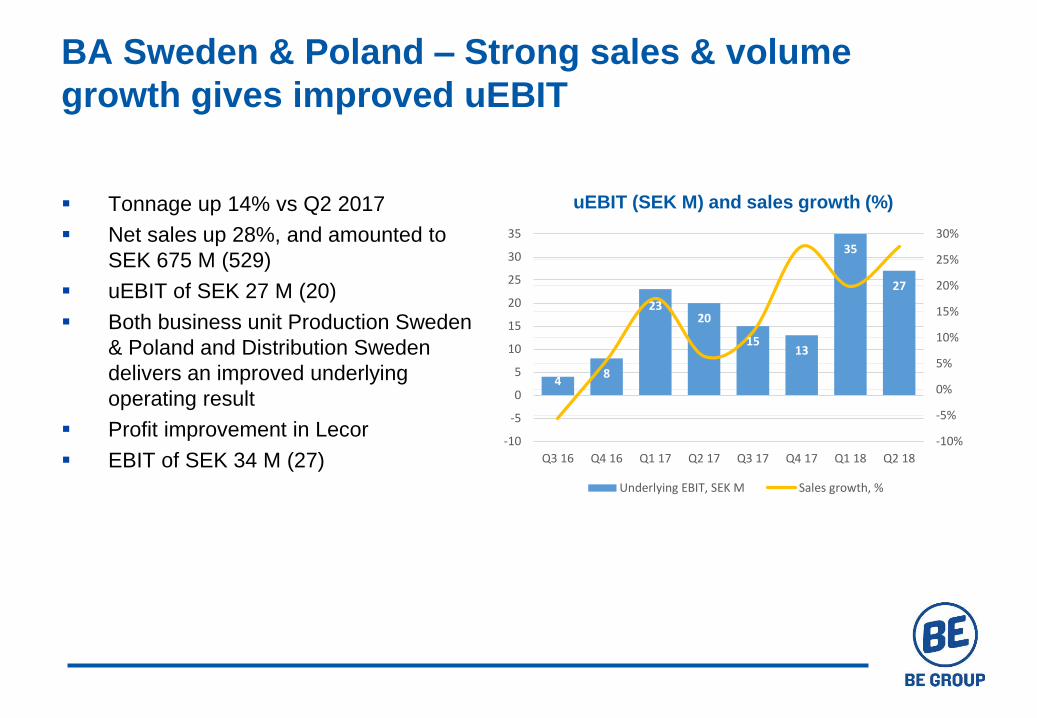
Tonnage up 14% vs Q2 2017
Net sales up 28%, and amounted to
SEK 675 M (529)
uEBIT of SEK 27 M (20)
Both business unit Production Sweden
& Poland and Distribution Sweden
delivers an improved underlying
operating result
Profit improvement in Lecor
EBIT of SEK 34 M (27)
uEBIT (SEK M) and sales growth (%)
BA Sweden & Poland – Strong sales & volume
growth gives improved uEBIT
48
2320
1513
35
27
-10%
-5%
0%
5%
10%
15%
20%
25%
30%
-10
-5
0
5
10
15
20
25
30
35
Q3 16 Q4 16 Q1 17 Q2 17 Q3 17 Q4 17 Q1 18 Q2 18
Underlying EBIT, SEK M Sales growth, %
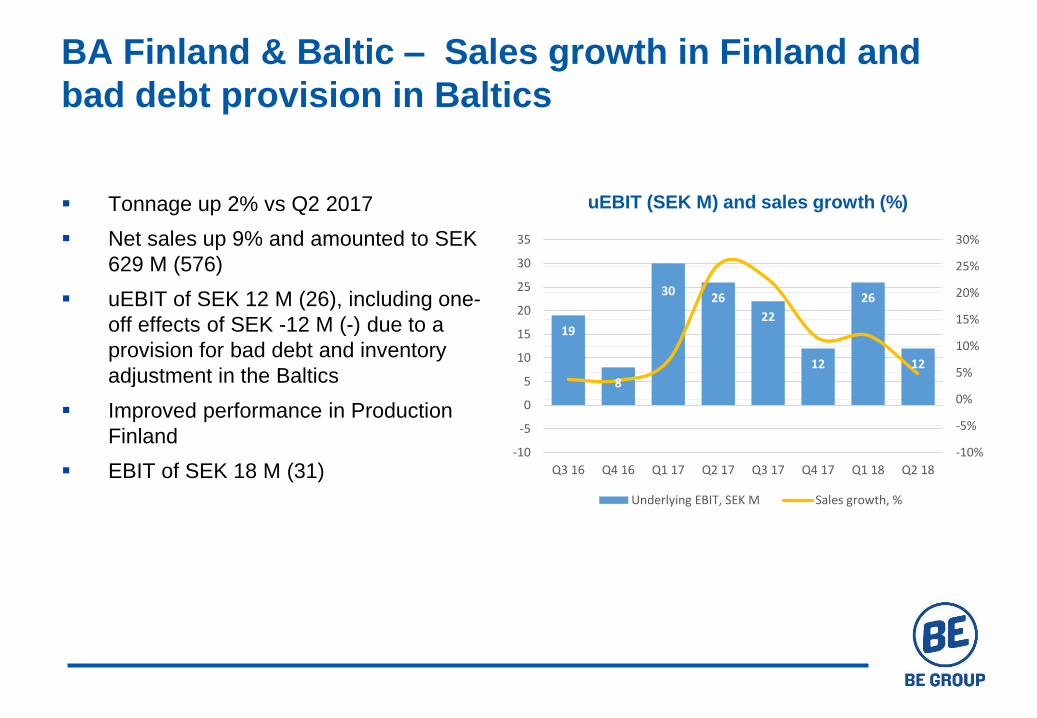
Tonnage up 2% vs Q2 2017
Net sales up 9% and amounted to SEK
629 M (576)
uEBIT of SEK 12 M (26), including one-
off effects of SEK -12 M (-) due to a
provision for bad debt and inventory
adjustment in the Baltics
Improved performance in Production
Finland
EBIT of SEK 18 M (31)
uEBIT (SEK M) and sales growth (%)
BA Finland & Baltic – Sales growth in Finland and
bad debt provision in Baltics
19
8
3026
22
12
26
12
-10%
-5%
0%
5%
10%
15%
20%
25%
30%
-10
-5
0
5
10
15
20
25
30
35
Q3 16 Q4 16 Q1 17 Q2 17 Q3 17 Q4 17 Q1 18 Q2 18
Underlying EBIT, SEK M Sales growth, %
OUTLOOK
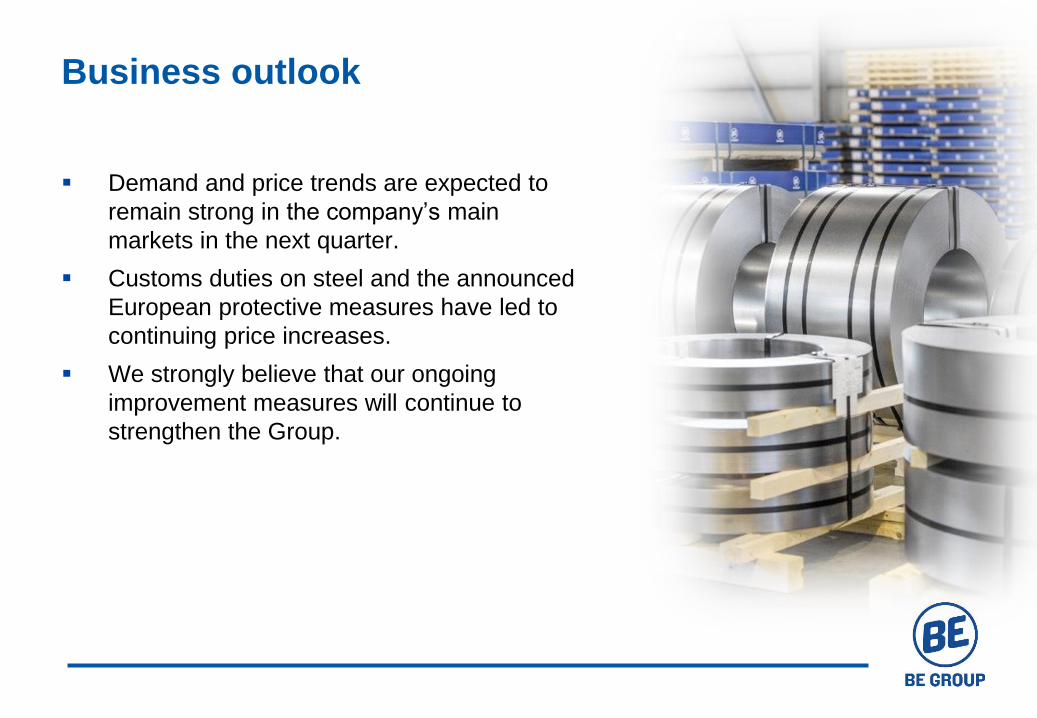
Demand and price trends are expected to
remain strong in the company’s main
markets in the next quarter.
Customs duties on steel and the announced
European protective measures have led to
continuing price increases.
We strongly believe that our ongoing
improvement measures will continue to
strengthen the Group.
Business outlook
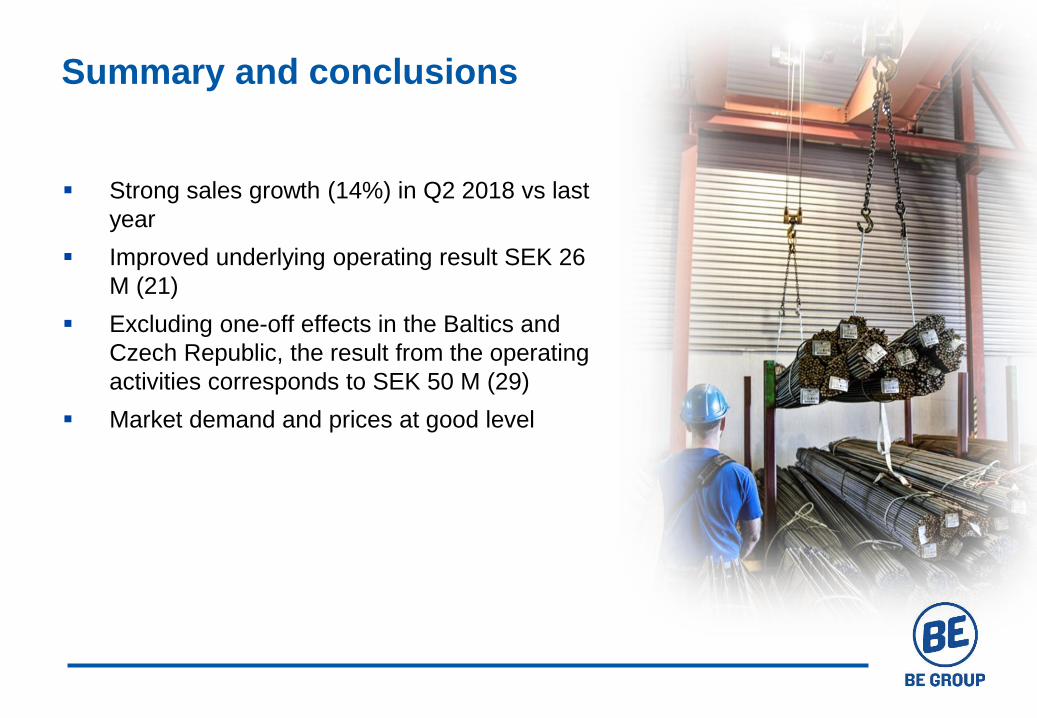
Strong sales growth (14%) in Q2 2018 vs last
year
Improved underlying operating result SEK 26
M (21)
Excluding one-off effects in the Baltics and
Czech Republic, the result from the operating
activities corresponds to SEK 50 M (29)
Market demand and prices at good level
Summary and conclusions
Q&A
APPENDIX
FINANCIAL INFORMATION
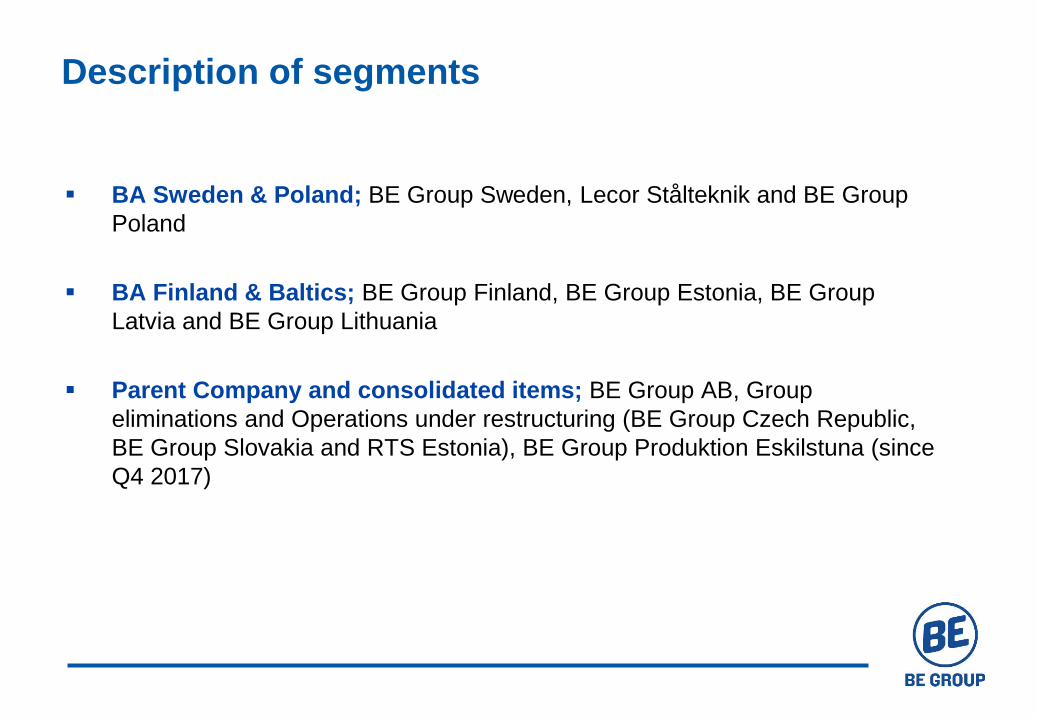
BA Sweden & Poland; BE Group Sweden, Lecor Stålteknik and BE Group
Poland
BA Finland & Baltics; BE Group Finland, BE Group Estonia, BE Group
Latvia and BE Group Lithuania
Parent Company and consolidated items; BE Group AB, Group
eliminations and Operations under restructuring (BE Group Czech Republic,
BE Group Slovakia and RTS Estonia), BE Group Produktion Eskilstuna (since
Q4 2017)
Description of segments
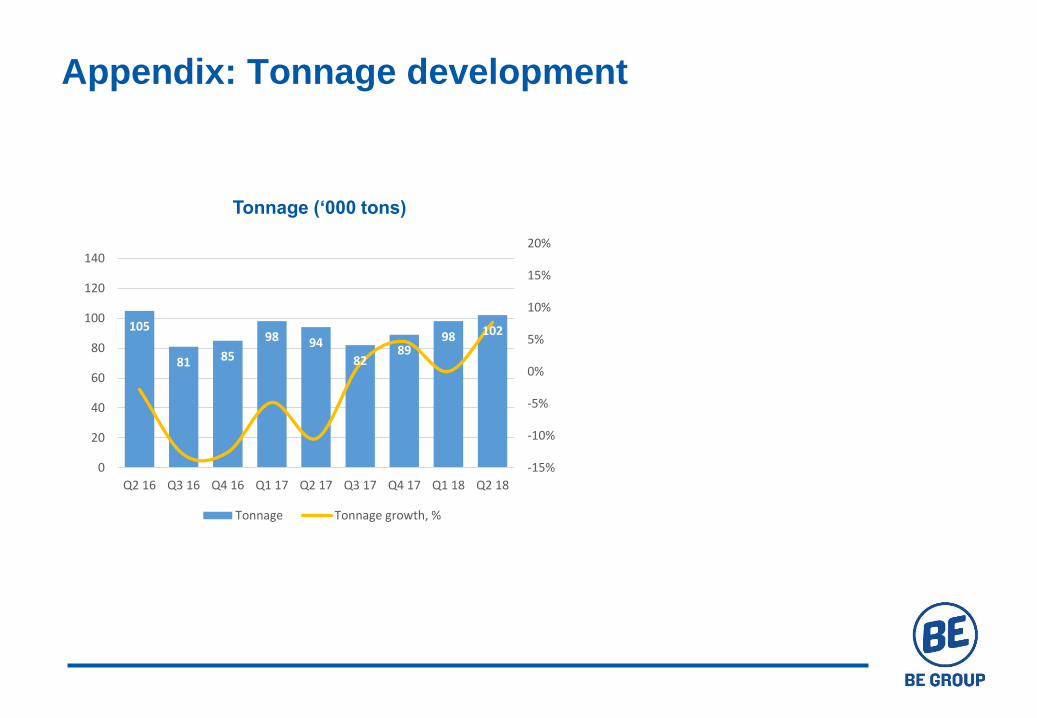
Tonnage (‘000 tons)
Appendix: Tonnage development
105
81 85
98 94
8289
98 102
-15%
-10%
-5%
0%
5%
10%
15%
20%
0
20
40
60
80
100
120
140
Q2 16 Q3 16 Q4 16 Q1 17 Q2 17 Q3 17 Q4 17 Q1 18 Q2 18
Tonnage Tonnage growth, %
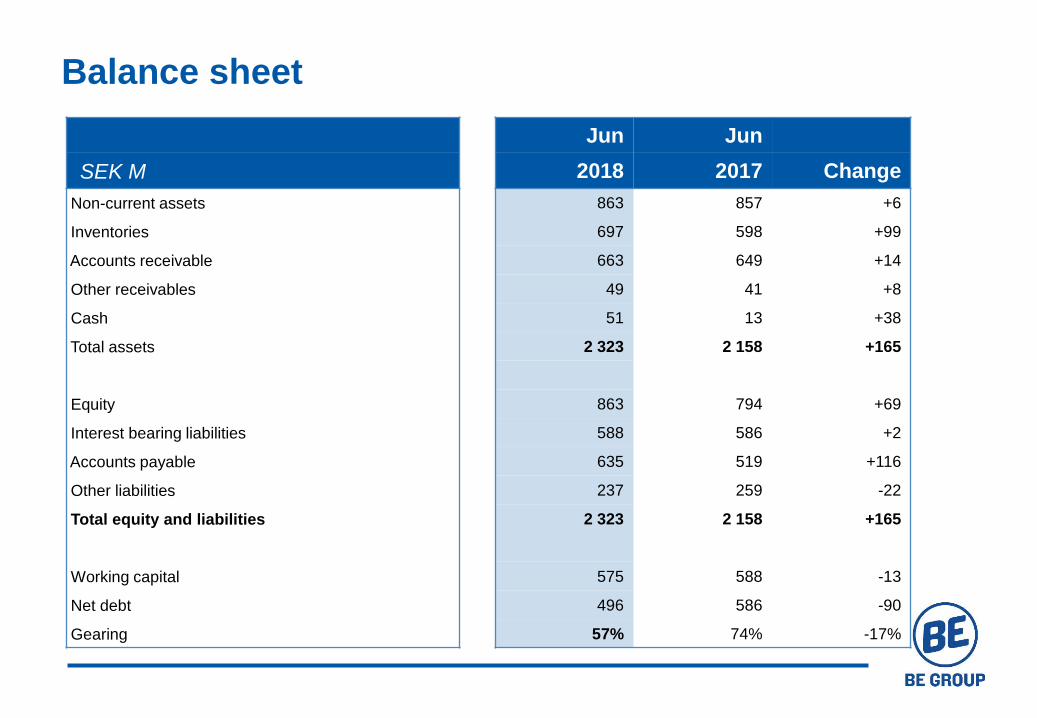
Balance sheet
Jun Jun
SEK M 2018 2017 Change
Non-current assets 863 857 +6
Inventories 697 598 +99
Accounts receivable 663 649 +14
Other receivables 49 41 +8
Cash 51 13 +38
Total assets 2 323 2 158 +165
Equity 863 794 +69
Interest bearing liabilities 588 586 +2
Accounts payable 635 519 +116
Other liabilities 237 259 -22
Total equity and liabilities 2 323 2 158 +165
Working capital 575 588 -13
Net debt 496 586 -90
Gearing 57% 74% -17%
Recommended