Embed Size (px)
Citation preview

Press conferenceCecilia Edström, Corporate Relations

Interim Report January–March 2007Jan Ytterberg, CFO

Key figuresThree months 2007
+44%
+11%
+14%
25.7% (21.3%)Return on equitySEK 10.43 (7.24)Earnings per share
SEK 2,085 m.Net income15.9% (12.3%)Operating margin
+44%SEK 3,039 m.Operating income
SEK 19,129 m.Net sales
17,583 vehiclesDeliveries

2003 2004 2005 2006 2007Q1 Q2 Q3 Q4 Q1Q1 Q2 Q3 Q4 Q1 Q2 Q3 Q4 Q1 Q2 Q3 Q4
Total deliveriesTrucks and buses
0
4,000
8,000
12,000
16,000
20,000Units

Service revenue
0
1,000
2,000
3,000
4,000
2003 2004 2005 2006 2007Q1 Q2 Q3 Q4 Q1Q1 Q2 Q3 Q4 Q1 Q2 Q3 Q4 Q1 Q2 Q3 Q4
SEK m.

2003 2004 2005 2006 2007Q1 Q2 Q3 Q4 Q1Q1 Q2 Q3 Q4 Q1 Q2 Q3 Q4 Q1 Q2 Q3 Q4
Operating incomeScania Group
EBIT margin
0
400
800
1,200
1,600
2,000
2,400
2,800
3,200
0
2
4
6
8
10
12
14
16
18
SEK m.
02
4
6
8
10
12
14
16
0
400
800
1,200
1,600
2,000
2,400
2,800
3,200 18%
Three months2007
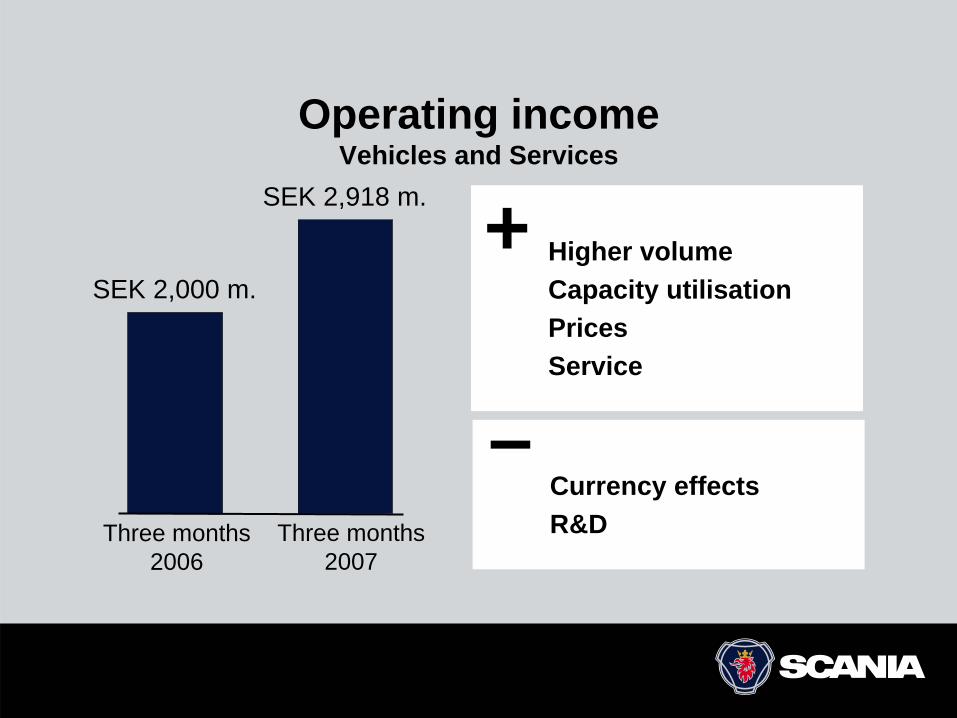
Operating incomeVehicles and Services
Three months2006
SEK 2,918 m.
SEK 2,000 m.Higher volumeCapacity utilisationPricesService
+
Currency effectsR&D
–

Size of portfolioFinancial Services
0
5,000
10,000
15,000
20,000
25,000
30,000
35,000
1995 1996 1997 1998 1999 2000 2001 2002 2003 2004 2005 2006 2007
SEK m.

Operating incomeFinancial Services
Increased volumeBalanced risk
+
Interest marginOperating expenses
–SEK 121 m.SEK 114 m.
Three months2007
Three months2006

2003 2004 2005 2006 2007Q1 Q2 Q3 Q4 Q1Q1 Q2 Q3 Q4 Q1 Q2 Q3 Q4 Q1 Q2 Q3 Q4
Cash flowVehicles and Services
0
500
1,000
1,500
2,000
2,500SEK m.
Note: Excluding acquisitions/divestments and Financial Services

Net debtVehicles and ServicesSEK m.
2003 2004 2005 2006 2007
- 6,000
- 4,000
- 2,000
0
2,000
4,000
6,000
Q1 Q2 Q3 Q4 Q1 Q2 Q3 Q4 Q1 Q2 Q3 Q4 Q1 Q2 Q3 Q4 Q1
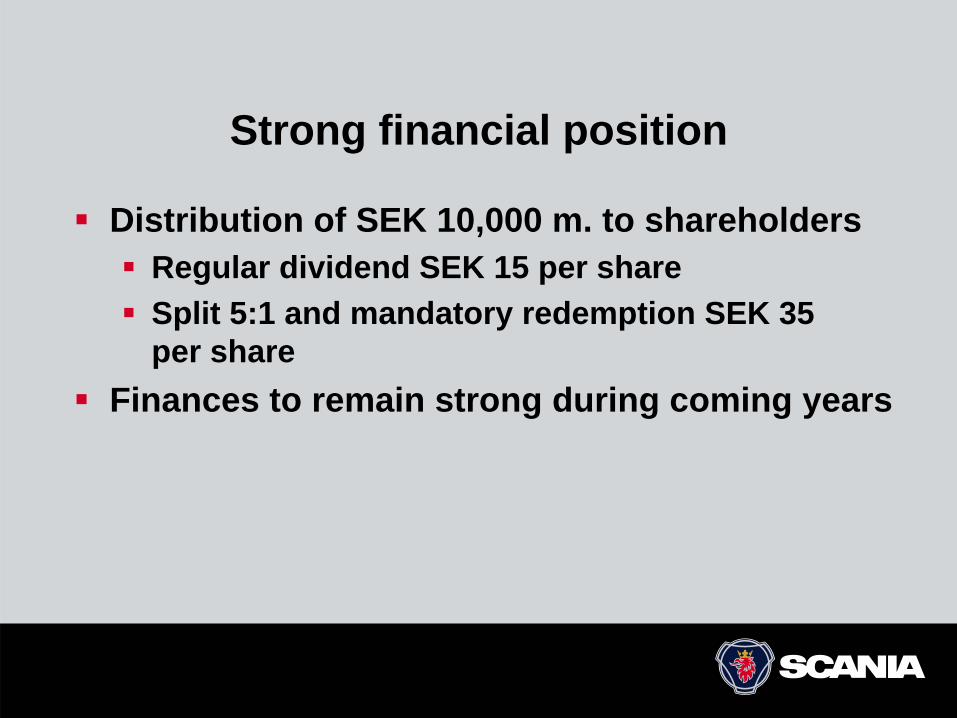
Strong financial position
Distribution of SEK 10,000 m. to shareholdersRegular dividend SEK 15 per shareSplit 5:1 and mandatory redemption SEK 35 per share
Finances to remain strong during coming years


Outlook 2007Leif Östling, CEO

2003 2004 2005 2006 2007Q1 Q2 Q3 Q4 Q1Q1 Q2 Q3 Q4 Q1 Q2 Q3 Q4 Q1 Q2 Q3 Q4
Total order bookingsTrucks and busesUnits
0
4,000
8,000
12,000
16,000
20,000
24,000
28,000

Market developmentsEurope – trucks
Order bookings strong in Q1Western Europe +34%, Germany, Spain & UK strongCentral & eastern Europe +123%, Poland, Russiaespecially strong
Eastern & Central Europe more importantMore than 1/5 of deliveries in Q1
Gaining market share14.6% market share in EU 27 Q1 2007, up from 13.6% in Q1 2006

Russia
Scania’s fifth largest market in Q1Expansion of service networkMarket leader (western brands)High demand in coming years

Market developmentsOther markets – trucks
Latin America Order bookings up 43 percent in Q1Upturn mainly dueto Brazil
Africa, Asia and OceaniaOrder bookings in Asia up 12 percent in Q1Increase in most markets

Building capacity
Present production rate: 80,000 vehiclesScania XPI productionin EuropeConcentration of production on track
80,00090,000
100,000
70,000
2006 2007 End 20092008
Scania vehicleproduction capacity

Scania 2007
Significant volume upsideStrong order bookings in Q1Europe, Latin America showing healthy demand, no US exposureProduction rate 80,000 annually (from April)
Positive development service revenuesGrowing rolling fleetNetwork expansion

Note: (1) Compounded annual growth rate over the period(2) Total R&D expenditures (capitalized and expensed)
Future outlook
> 17EPS, % growth per annum(1)
< 4R&D(2), % of revenues
8–9Capex (incl. R&D(2)), % of revenues
12–15EBIT margin, % of revenues
~10Revenue, % growth per annum(1)
Outlook2007–2009