Barriers to Entry
Data stewardship and data sharing
bit.ly/nercomp_analyticss17Tweet us with #NercompPDO1 tag

Who we are
Ian RifkinData Warehouse [email protected]://www.linkedin.com/in/irifkin
Fei WuBusiness Intelligence [email protected]://www.linkedin.com/in/feiwu7

Brandeis University
Founded in 1948 as a non-sectarian, coeducational institution sponsored by the Jewish community.
Staff: 1,150
Faculty: 649
Undergraduates: 3,600
Graduate Students: 2,000
“Truth, Even Unto Its Innermost Parts”

Show of hands…
1. Do you have a BI system in place?
2. Do you have anything you refer to as a Data Warehouse?
3. Who is responsible for BI at your institution?
4. What works well? What could be better? (AKA What are you here to learn?)
Business intelligence
Visualization Software: MicroStrategy
~100 MicroStrategy Users
~500 reports/dashboards
Can support multiple data sourcesincluding Excel
Primary data source is our data warehouse database

Data warehouse database @ Brandeis

A new report request comes in from an academic department. They are not (yet?) a BI user. They want to evaluate performance of their undergraduate students, to understand the relationship with other academic program(s) in which the student is enrolled.
E.g. Do students double majoring in science and art perform better or worse than a student only majoring in science?
Question: What do you think is an ideal workflow to respond to this report request? What should be delivered to the person requesting the report?
Share your thoughts…

Our ThoughtsData
Report Creation
ProperUser Access
Who should Validate the data?
Who should grant the access? Summary Data
Only
What if the data is off?
Who has the data?Where and how is the data stored?

A Data Trustee or Data Steward is the person(s) ultimately responsible for a particular system of record or subset of one.
Data trustees
Faculty Employee
Student (by school) Financial
Admissions (by school) Financial Aid
Alumni Etc.

User access

Report delivery process

Share your thoughts…
The academic department makes a new request! They love the previous report and now want to understand academic performance against other data points. In particular they want to know if the gender and ethnicity of the student matching that of their professor appears to impact academic performance of the student.
Question: What are some decisions that need to be made to meet this reporting need?

Understanding the data
Creating a visualization assumes data decisions have been made.
In the previous slide we talked about comparing student data with that of their instructors. Sample considerations…
● A student takes a class with two instructors and they have the same ethnicity as one of them. How should this be visualized?
● Fully understanding what is meant by performance. Grades seem like the obvious data point, but what about drops and incompletes? What about further details of performance (e.g. papers vs. tests)?
● Courses taken not-for-credit?

Do you have the table already?
Sticking with answering the same question, imagine that you have the following table:
Question: Would this table help answer the department’s question?
Student ID
DOB
Sex
EthnicityCode

Avoiding assumptions
The table column “sex” may differ from the question surrounding “gender” -- Did the department use the wrong word or if not, do you have the data?
You can’t report on data you don’t have, especially if it’s not collected!
Do you have snapshot data? E.g. Do you report using the student’s current gender identity or gender at the time of completing each class? (Especially if you’re reporting on historical data)
Student ID
DOB
Sex
EthnicityCode

Data governance decisionsHow can the data trustees help? The data trustees are not just there to approve access!
Data validation and data governance are crucial for success!
Inmon’s approach (top-down) stresses "one version of the truth"
Kimball’s approach (bottom-up) says to build small data marts for each department (the Data Warehouse is the combination of data marts).
Our Opinion: Strive for one version of the truth, but allow for flexibility. A few versions of the truth might be OK especially if the only other option is not using the enterprise BI system!

Multiple versions of the truth?
A realistic situation at Brandeis…we currently have a separate HR and SIS and Alumni CRM. Bio-Demo data collected completely separately.
What about when there is overlap (e.g. student/alumni/employee person)?
We have logic that uses Identity Management role/status data to set an order of preference to define one version of the Bio-Demo data but stakeholders sometimes expect their version of the data.
The solution is to be clear which version you are using. Instead of having one “address” attribute you may need “permanent address” and “mailing address” -- not ideal, but what is the alternative?

Establish consensus given multiple truths
The data trustees must work together to explain the definitions.
An easy-access single source to query metadata definitions.
A single authority to manage and update the metadata definitions.
The data trustees need to keep this authority informed of any definition change that impact the data.

Data validation
Coordinate between data trustees when validation needs to be done by multiple parties. Do not try to do everything at once. Achievable goals allow progress.
Expect there to be issues! E.g. People typing in “New York” vs. “NY” could affect summary data
Data warehouse reporting, by its nature, will uncover problems with data from the source system(s).
Validation should occur in reporting environment, even if you have to make a report just for this process. Complex calculations are trickier to diagnosis.

Data accuracy
Oh no! After creating and sharing the report someone sees it and says it’s incorrect. They state that the number of students receiving a particular degree in a particular year is off by one.
Question: How would you respond?
Consider: Does the report need to get immediately hidden? What is an appropriate level of accuracy? How to instill confidence in the BI data/reports?

Understanding visualizations
Question: Estimate the percent of non-white females at school X.
White
Not White
White
Not White
Female Male

Understanding visualizations
Question: Now estimate the percent of non-white females at this school.
FemaleMaleMale
Female
Not White White

Understanding visualizations
Question: And finally estimate the percent of non-white females at this school.
White Male
Non-WhiteFemale Non-
WhiteMale
White Female

The previous three pie chart slides used the same (fictional) data but presented it differently.
And that’s just using a simple pie chart with basic data!
Question: What are some other ways visualizations can be misleading?
Misleading visualizations

What’s misleading here?
Non-white Female
Non-white Male
White Female
White Male

Compared to…
Non-white Female
Non-white Male
White Female
White Male

Avoiding misleading visualizations
Visualizations can easily be misleading or even present the data in a false manner.
Do we need to go back to the data validation stage? (no)
May need another validation stage for visualizations
Balance giving users the power to work with visualization tools, but with governance in place to validate at the visualization level before it is shared.
Question: How to treat/denote an unvalidated visualization/report/dashboard differently from a validated one?

The source
Now that we have discussed validation of data and visualizations, let’s take a step back and think about the data source(s).
Question: What is the data source(s) for your BI system(s)?
Transactional source systems? Spreadsheets? Data warehouse? Other?
Question: Why is this important to consider given our topic today?

Transactional system(s) as BI source?
May meet needs perfectly well, but…
Requirements differ significantly from BI
● Writes vs. Reads● Snapshots● System performance impacts● User expectations● Security● Updates/changes to system

Excel as a BI source?
Excel can be used as a source for BI visualizations
Could be exported data from one or more systems
Easy to manually transform, sort, edit data
May not be repeatable; knowledge may reside only in one person’s memory
Obfuscates the “ETL” making data validation difficult
How are the dimensions and metrics defined?
Question: When do you think it’s appropriate to use a data source like Excel?
Why have a data warehouse?
Allows for data from multiple systems to live in one place
Does not rely on transactional system to view a report
Opportunity to do repeatable data transformations
Can keep historical records even if deleted from source system
Ability to create snapshot data
Able to restructure tables to better meet reporting purposes

Does the schema matter?
Normal forms, star schemas, snowflake schemas, etc.
Question: Why does this matter? Can you use structure from the transactional system(s)?

Consider…
ETL process can create a table to specifically answer the question
Quick and easy to report based on this table, no joins needed
Need to know the questionbefore you build the table
Not very flexible to answer anyother question

Flexible reporting schema
Do not need to separate course and class data (OK to have course_name with many rows).
More flexible approach than previous slide that can answer many questions.
Easy to build on new dimensions (e.g. degrees)

Share your thoughts
The academic department is back with a new request! They suggest we add data points surrounding financial aid received. In particular, do work study jobs impact academic performance?
Question: How does this question differ from the other questions?

Data silos
Report creators need to know what types of data they need to analyze before they can request access.
By default, data is in separatesilos -- not a technology problem
Fear of misunderstanding data, especially when combined with other data
Student Finance Staff Alumni
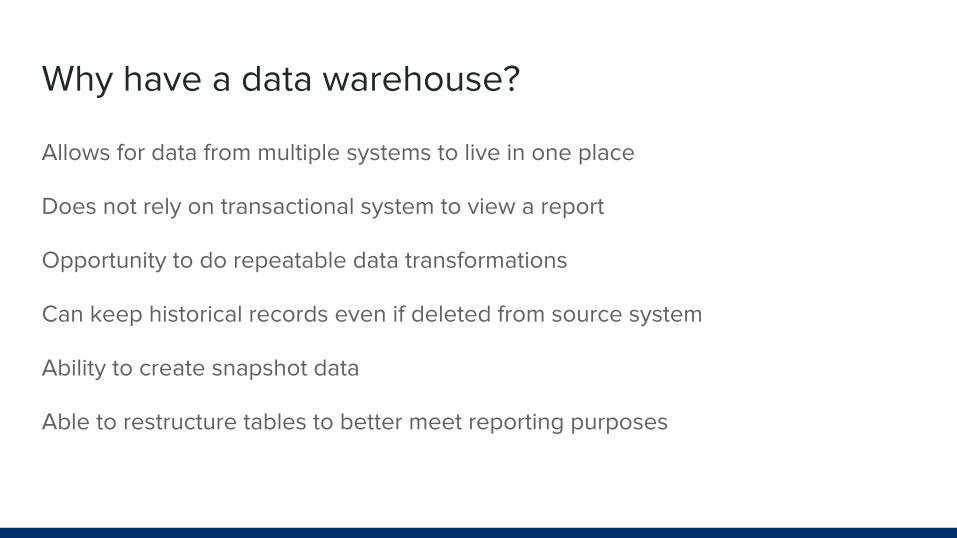
Current layout of projects

Mitigating data fears
Reporting back to Data Trustees on understanding how “their” data is being used
Cross-silo report requests
Exceptions to project focus (free-form SQL)
Manually communicating to and calming every data trustee on every cross-silo request
Who has access to my data? -- Every Data Trustee
“
”

Pros and cons of current approachBenefits:
● Simple to organize and implement● Users can find what they’re looking for● Ease of controlling and auditing access
Challenges:
● Potential users need to have a understanding of how they will use what data● By default, no cross-silo reports (we are the only ones that can make them)
○ Not even the Data Trustees can do this○ Fear of requesting reports leads to view that the Data Warehouse can’t do it

The unknown future
The ERP at Brandeis is currently PeopleSoft (for SIS, HR, Fin), but…
The University is actively considering a single cloud ERP to replace PeopleSoft.
ERP Project changes everything
How to accommodate: TBD

A better approach to BI workflow
How to make forward-thinking improvements…
Hopefully relevant today and with a new ERP
Analysts create and interact with visualizations based on data subsets
Gives power to creators to re-think data silos…maybe
Creators control access to data subsets

Report delivery process: a better approach

Why is this approach preferred
● Clearer approach to data access● Built-in process for data validation/verification● Gives more power to more staff for creating visualizations within the BI tool● Control process in place before visualizations get shared with a wider
audience
Question: What are your thoughts to this approach? Any challenges you envision?
Determining success criteriaHow to know if you’re doing a good job?
Usage of BI software
New users, new reports, usage of reports, etc.
Able to meet reporting needs
Ideally without drama
Time to completion for new report requests
Smooth process with clear workflow

Questions?Ian RifkinData Warehouse [email protected]://www.linkedin.com/in/irifkin
Fei WuBusiness Intelligence [email protected]://www.linkedin.com/in/feiwu7
[email protected]/nercomp_analyticss17
Recommended