Deriving Knowledge from Data at Scale
Deriving Knowledge from Data at Scale
Deriving Knowledge from Data at Scale
Deriving Knowledge from Data at Scale

Deriving Knowledge from Data at Scale
Deriving Knowledge from Data at Scale
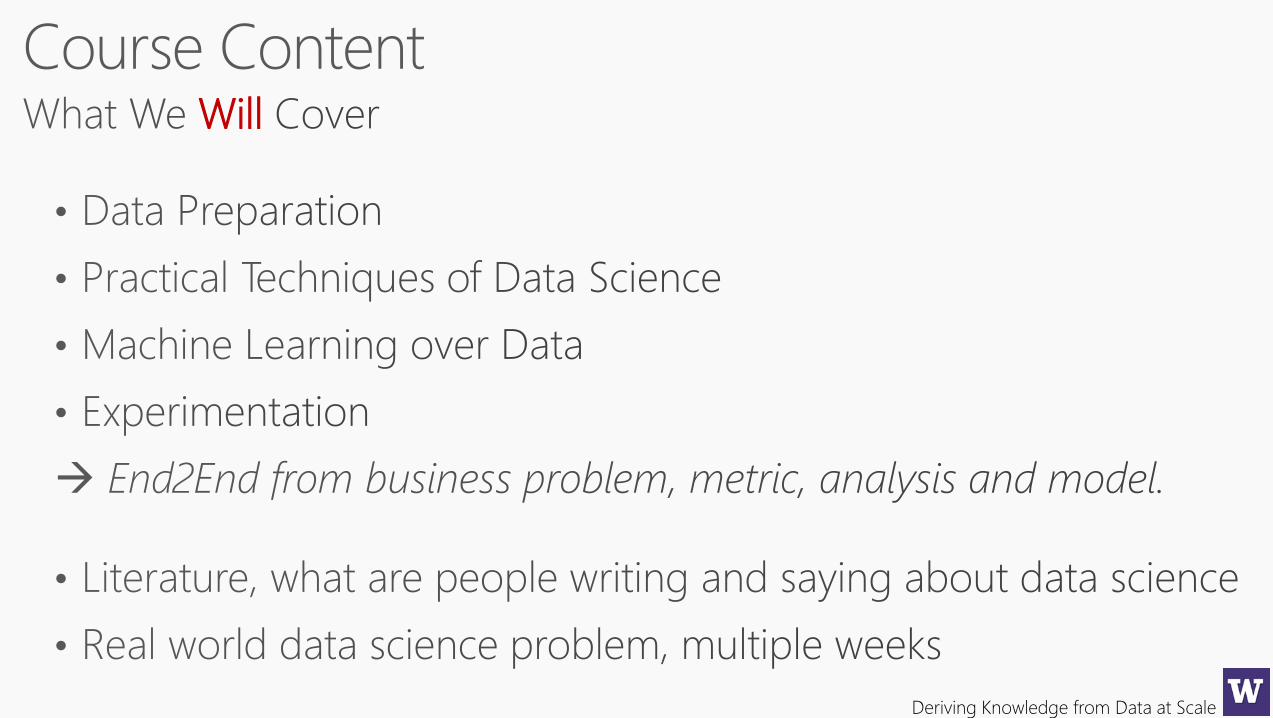
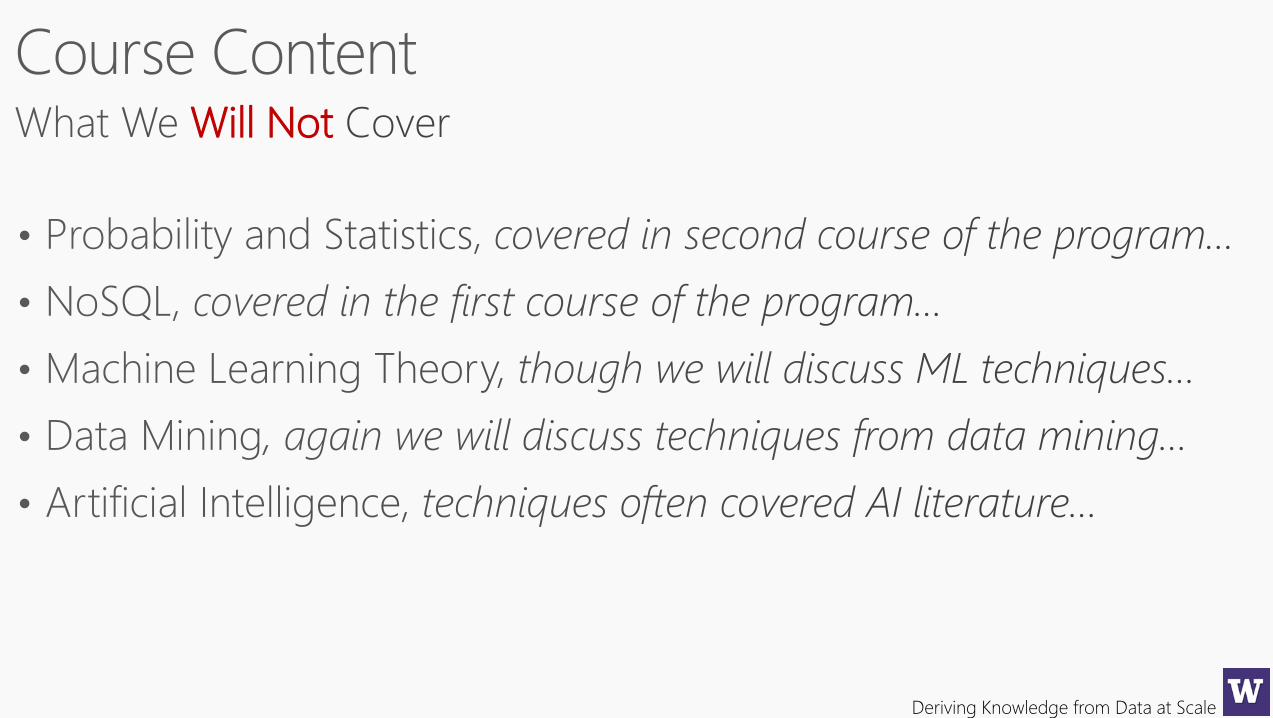
Will
Deriving Knowledge from Data at Scale
Deriving Knowledge from Data at Scale
Will Not
Deriving Knowledge from Data at Scale
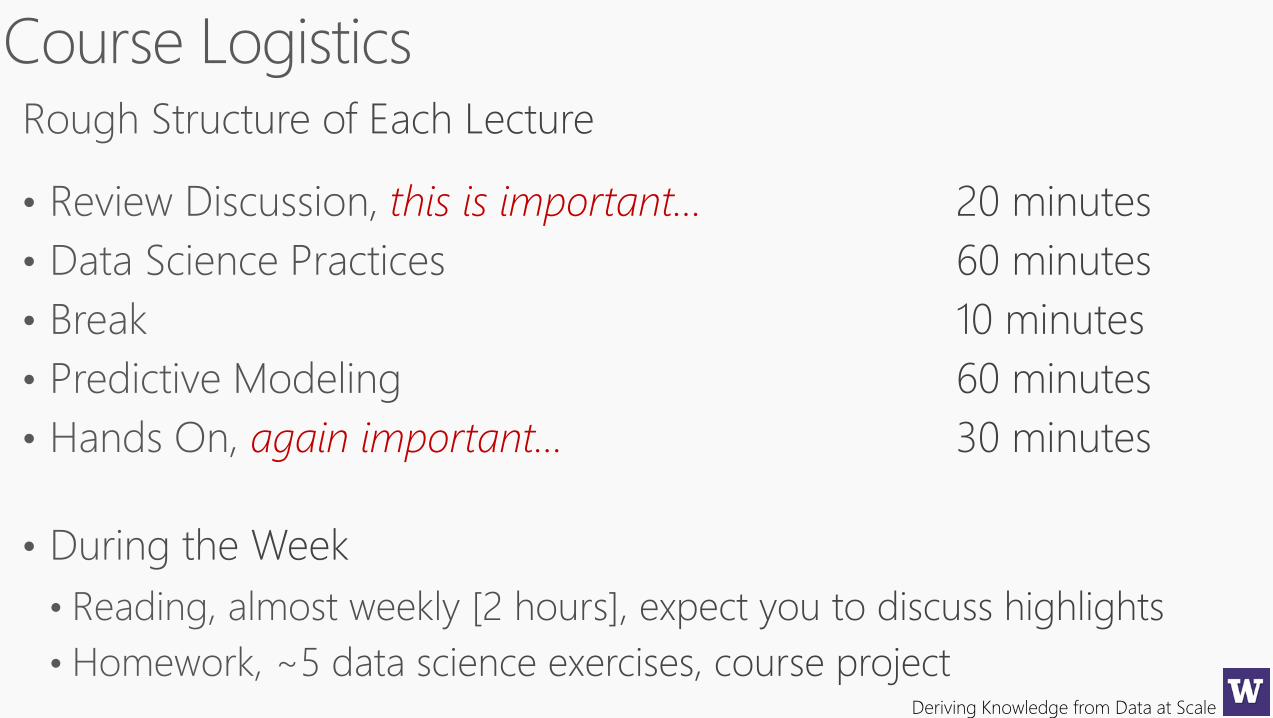
this is important…
again important…
Deriving Knowledge from Data at Scale
Deriving Knowledge from Data at Scale
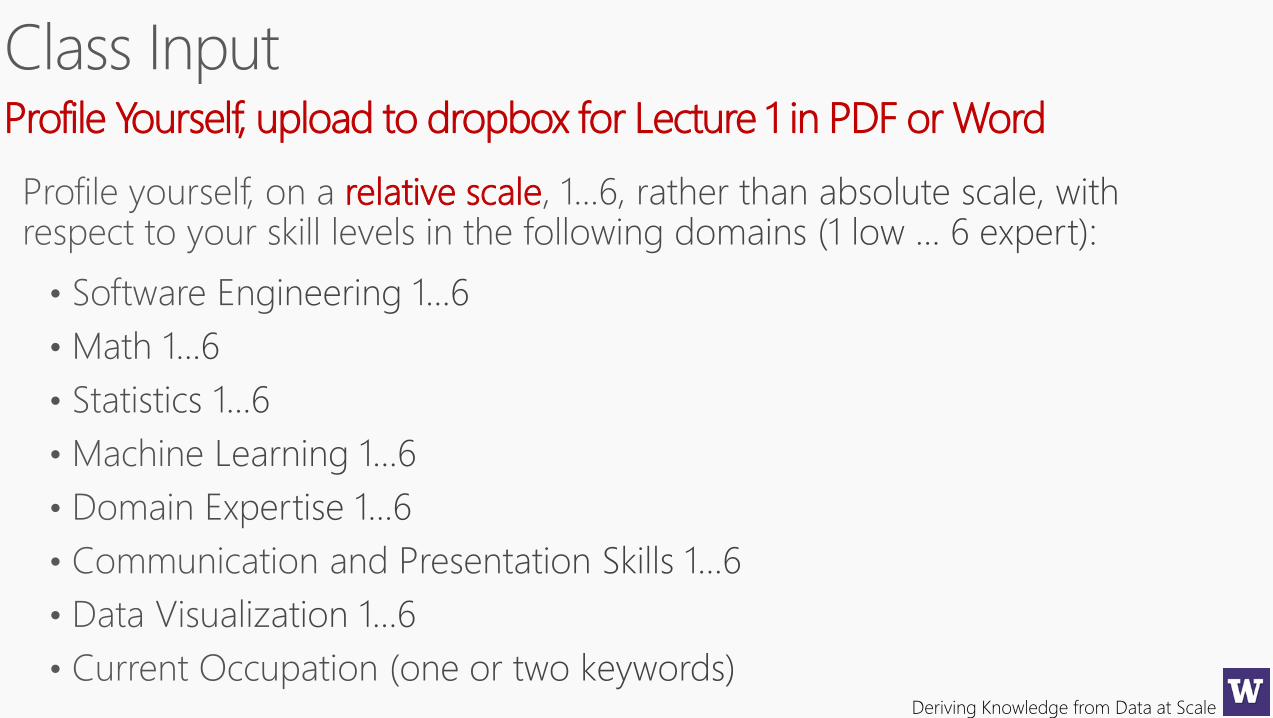
relative scale
Profile Yourself, upload to dropbox for Lecture 1 in PDF or Word
Deriving Knowledge from Data at Scale
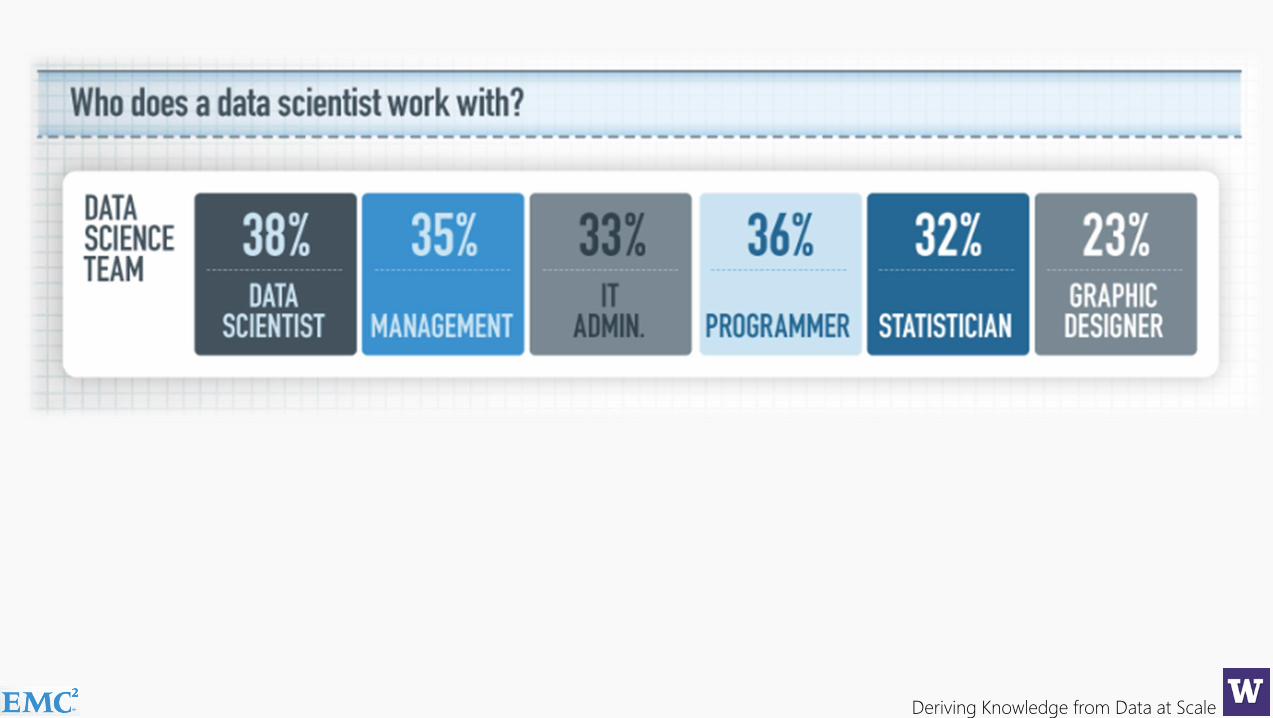
What kind of things does a data scientist do?...
Deriving Knowledge from Data at Scale
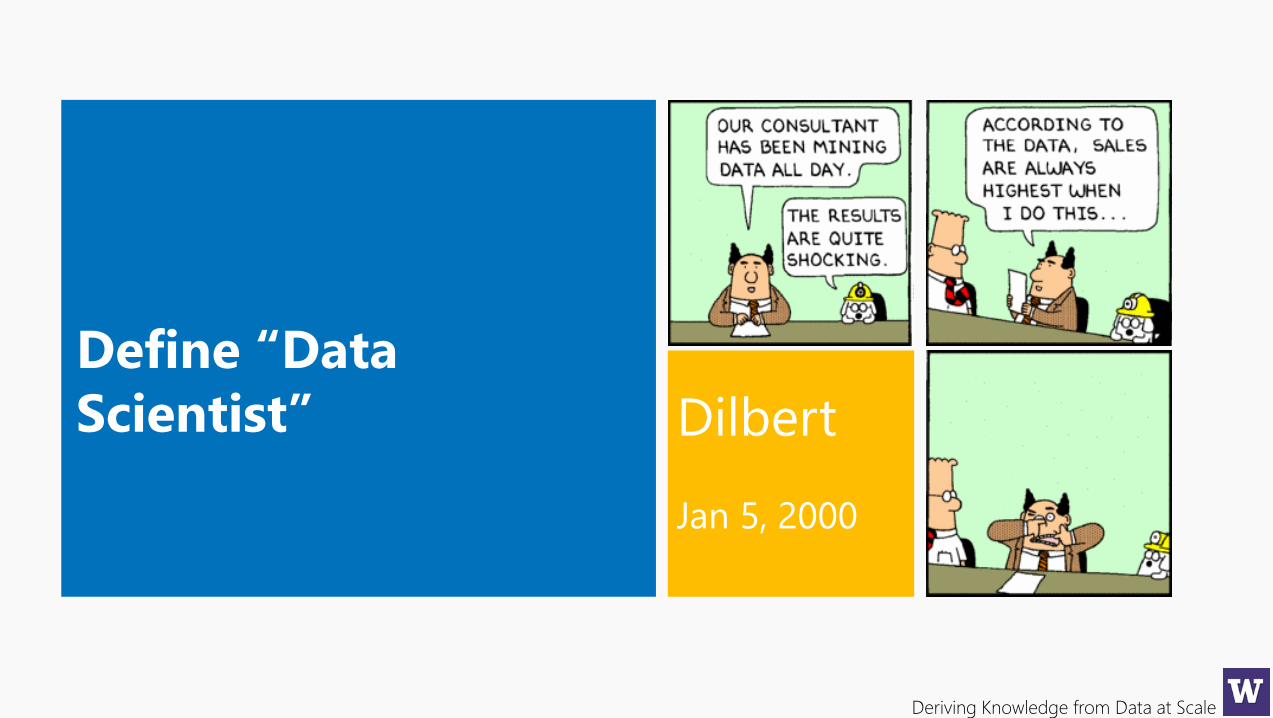
Dilbert
Jan 5, 2000
Define “Data
Scientist”
Deriving Knowledge from Data at Scale
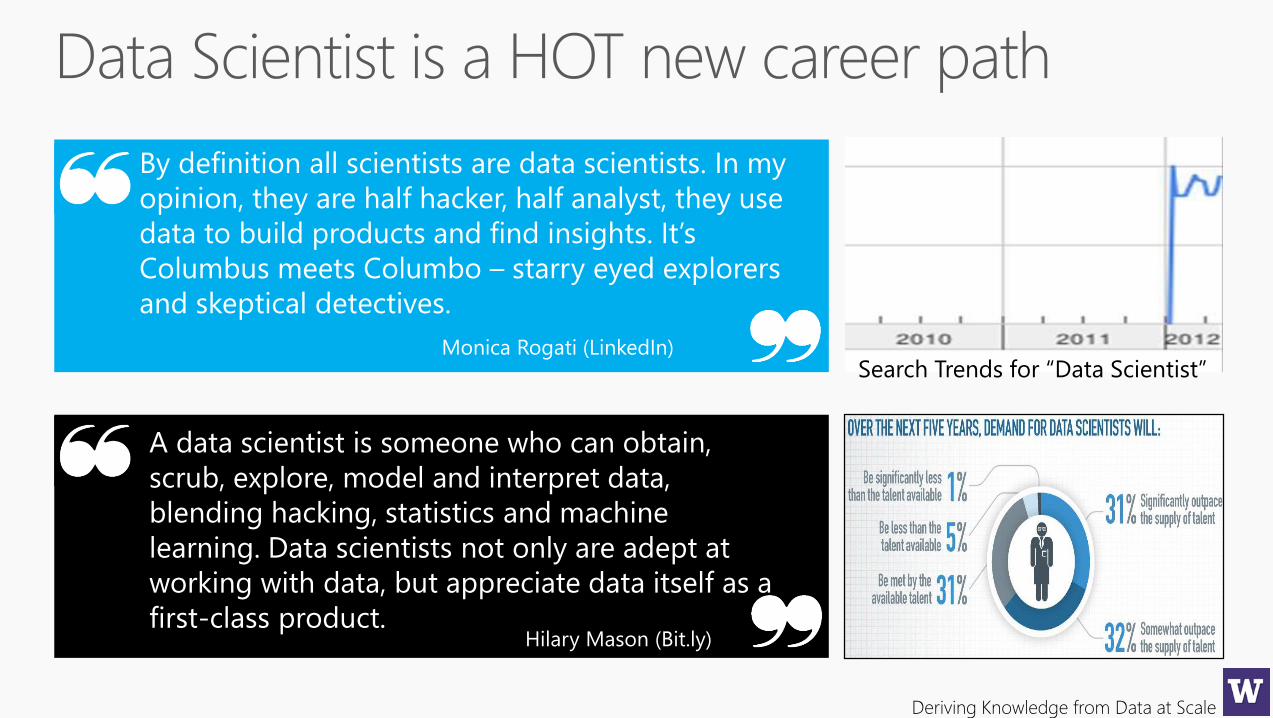
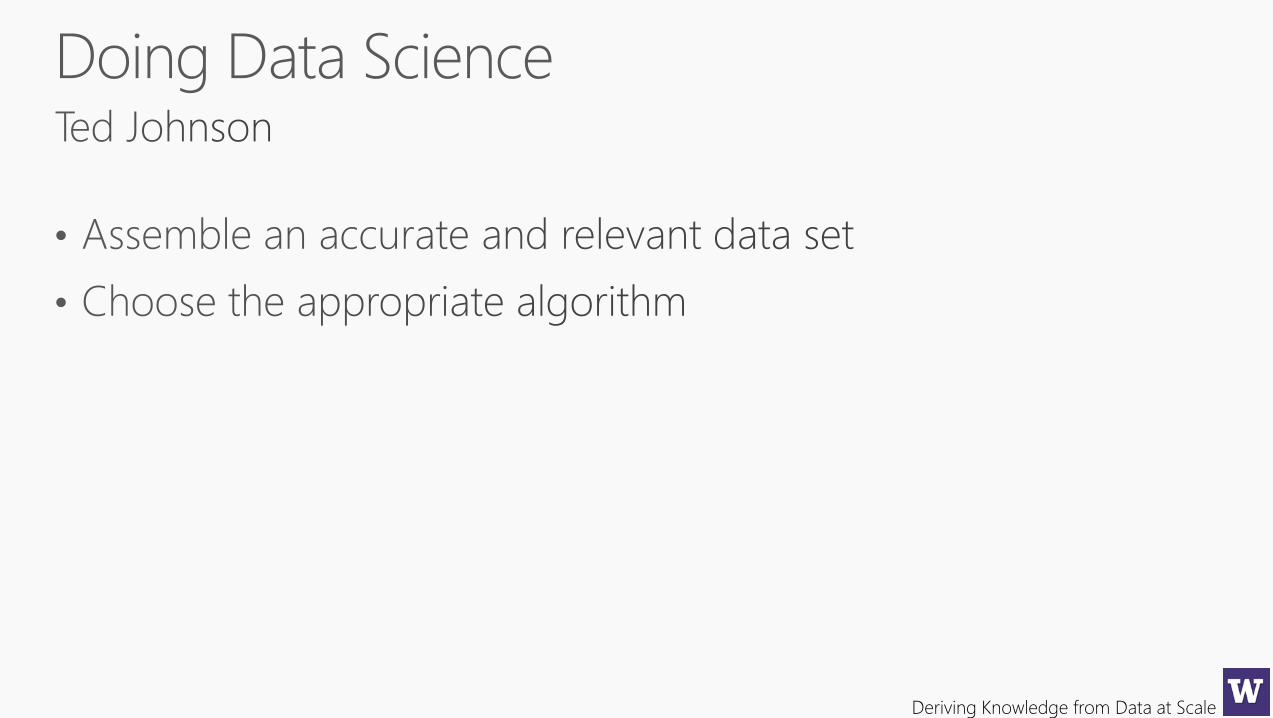
By definition all scientists are data scientists. In my
opinion, they are half hacker, half analyst, they use
data to build products and find insights. It’s
Columbus meets Columbo – starry eyed explorers
and skeptical detectives.
Monica Rogati (LinkedIn)Search Trends for “Data Scientist”
A data scientist is someone who can obtain,
scrub, explore, model and interpret data,
blending hacking, statistics and machine
learning. Data scientists not only are adept at
working with data, but appreciate data itself as a
first-class product. Hilary Mason (Bit.ly)
Deriving Knowledge from Data at Scale
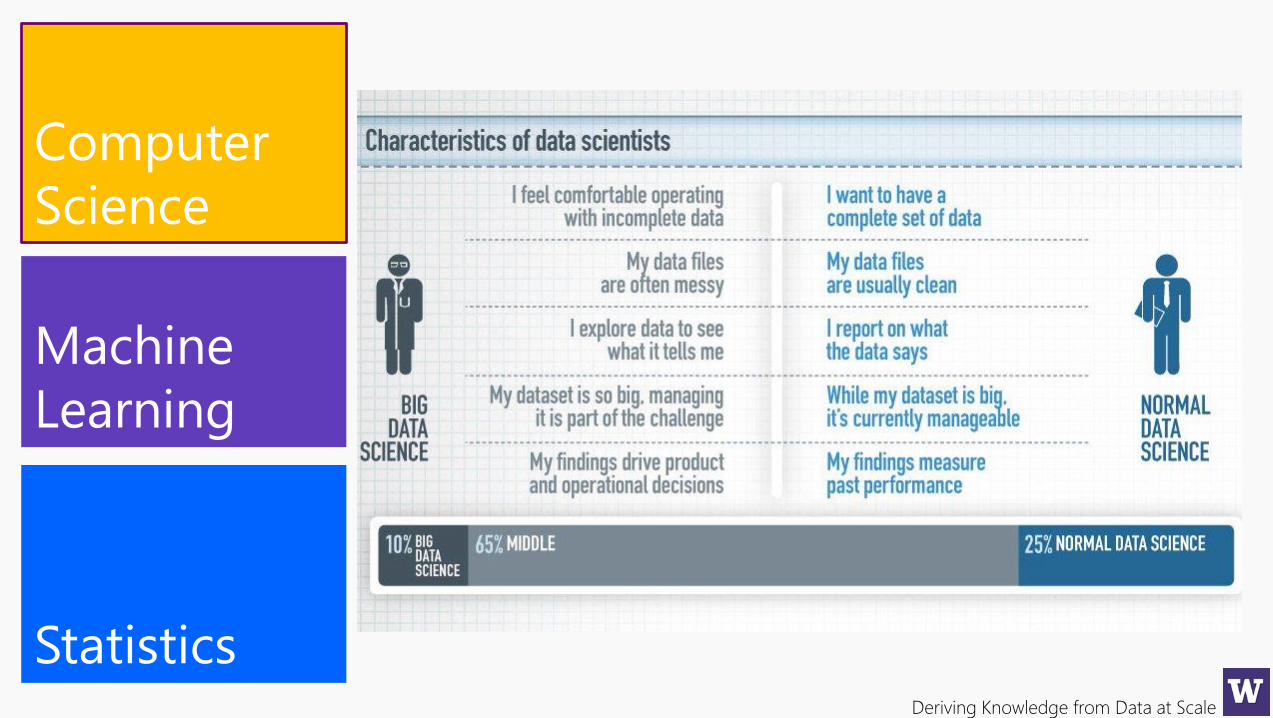
Computer
Science
Deriving Knowledge from Data at Scale
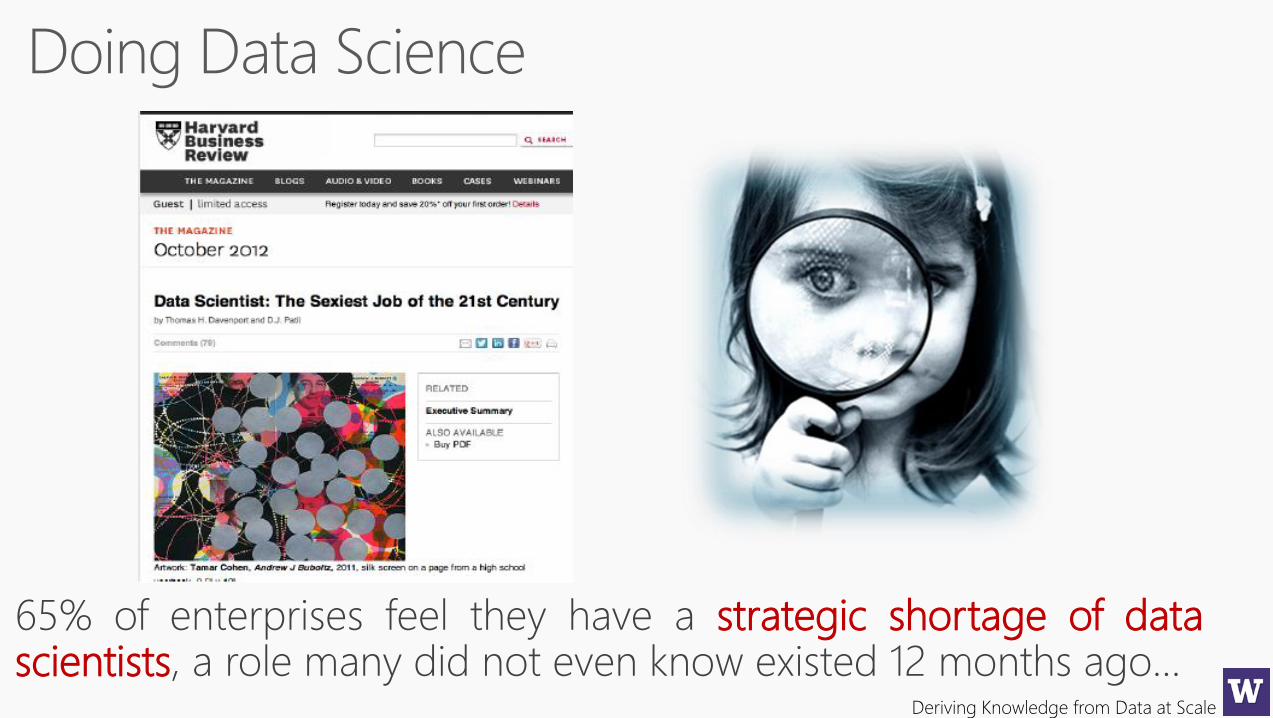
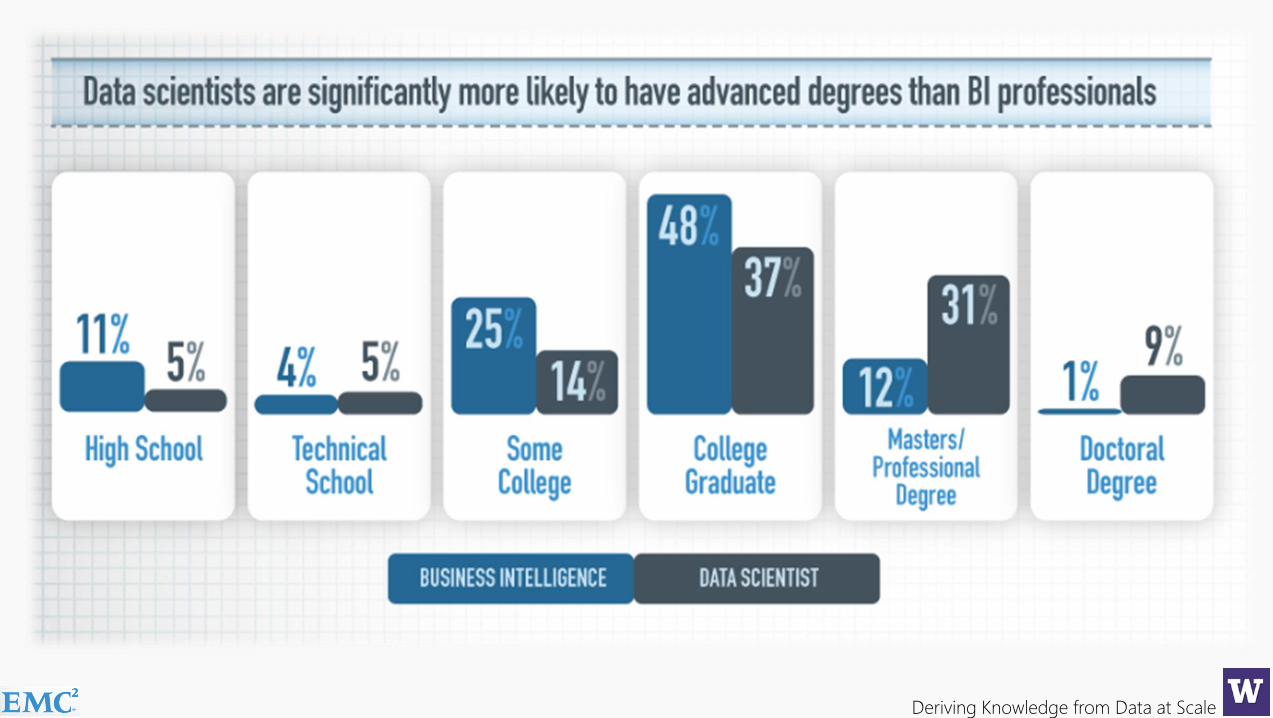
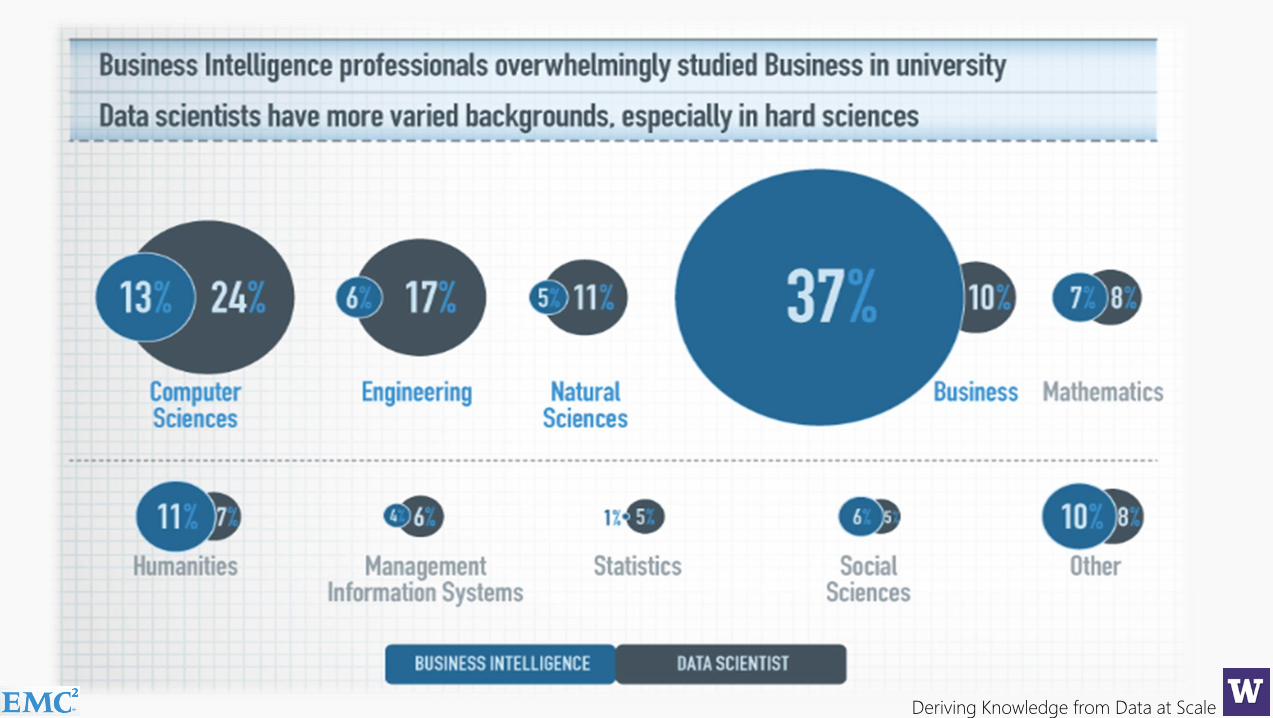
65% of enterprises feel they have a strategic shortage of datascientists, a role many did not even know existed 12 months ago…
Deriving Knowledge from Data at Scale
Deriving Knowledge from Data at Scale
Deriving Knowledge from Data at Scale
Deriving Knowledge from Data at Scale
Deriving Knowledge from Data at Scale
Deriving Knowledge from Data at Scale
Deriving Knowledge from Data at Scale
Deriving Knowledge from Data at Scale
Deriving Knowledge from Data at Scale
10 Important Ideas
10 Important Ideas
Each will be a topic of at least one lecture
Deriving Knowledge from Data at Scale
#1
Interdisciplinary Data Science
critical component of your success going forward
Deriving Knowledge from Data at Scale
#2
Democratization of Machine and Statistical Learning Algorithms
using the algorithms understand their meaning andpotential impact
Deriving Knowledge from Data at Scale
#3
Build a solid foundation of good coding practices
Deriving Knowledge from Data at Scale
#4
Data Strategy
thinking in terms of a data strategy is a useful paradigm
Deriving Knowledge from Data at Scale
#5
Little Data
Deriving Knowledge from Data at Scale
#6
The Space between the Data Set and the Algorithm
Deriving Knowledge from Data at Scale
#7
Being Human
Deriving Knowledge from Data at Scale
#8
Causation or Causality, Correlation and Experiments
Deriving Knowledge from Data at Scale
#9
Feedback Loop
Deriving Knowledge from Data at Scale
#10
Causing the Future
Prediction Causation
not only capable of Predicting theFuture, but also of Causing the Future
Deriving Knowledge from Data at Scale
Deriving Knowledge from Data at Scale
Deriving Knowledge from Data at Scale

Deriving Knowledge from Data at Scale
Deriving Knowledge from Data at Scale
Deriving Knowledge from Data at Scale
Deriving Knowledge from Data at Scale
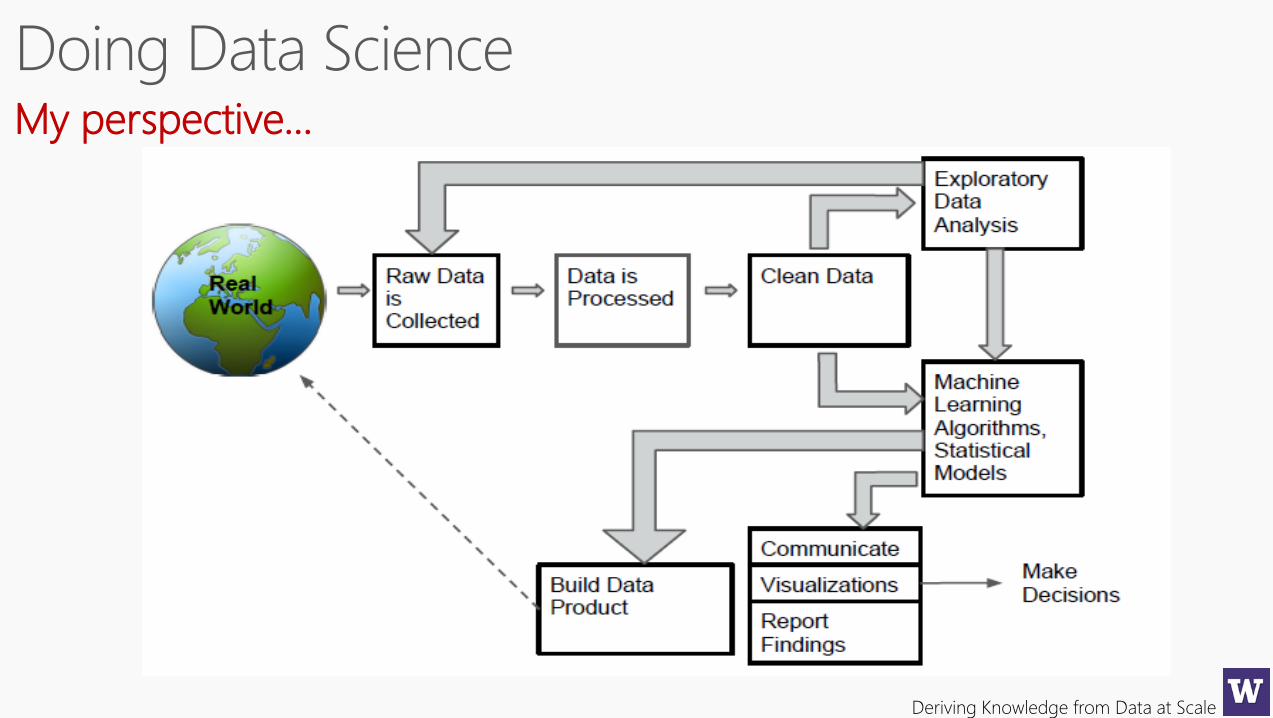
My perspective…
Deriving Knowledge from Data at Scale
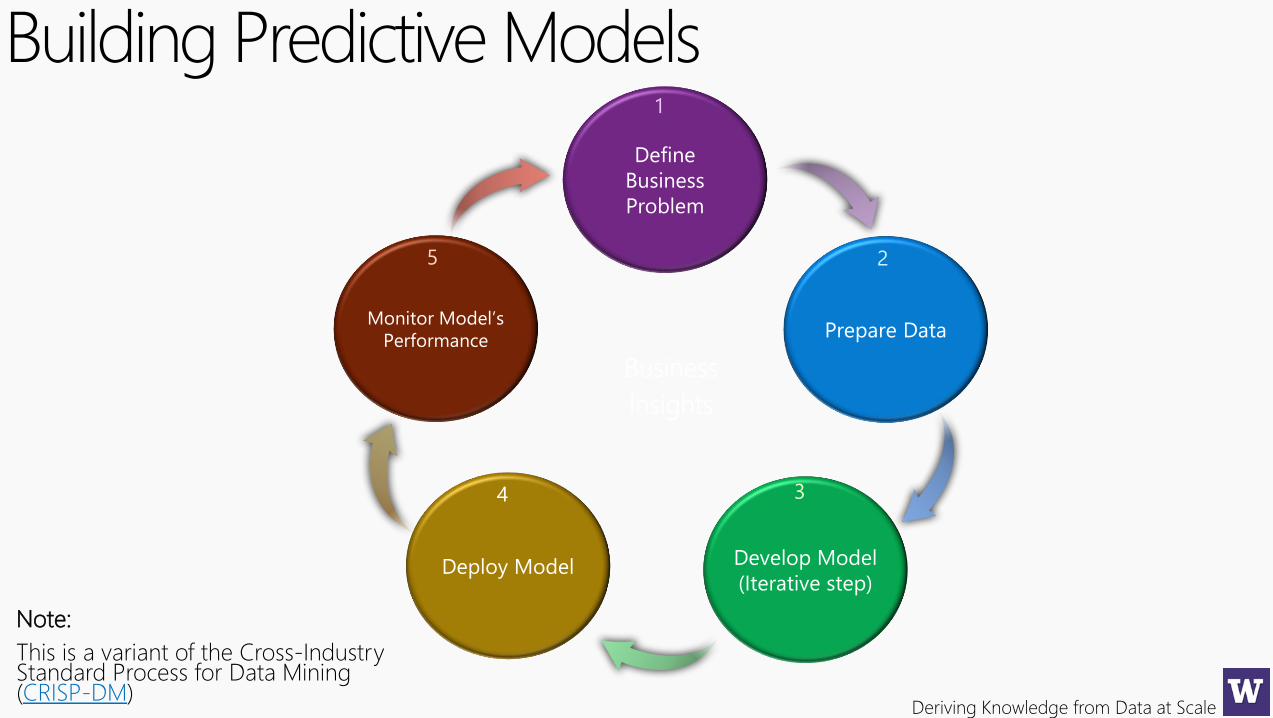
Building Predictive Models
Business
Insights
1
2
34
5
Note:
This is a variant of the Cross-Industry Standard Process for Data Mining (CRISP-DM)
Deriving Knowledge from Data at Scale
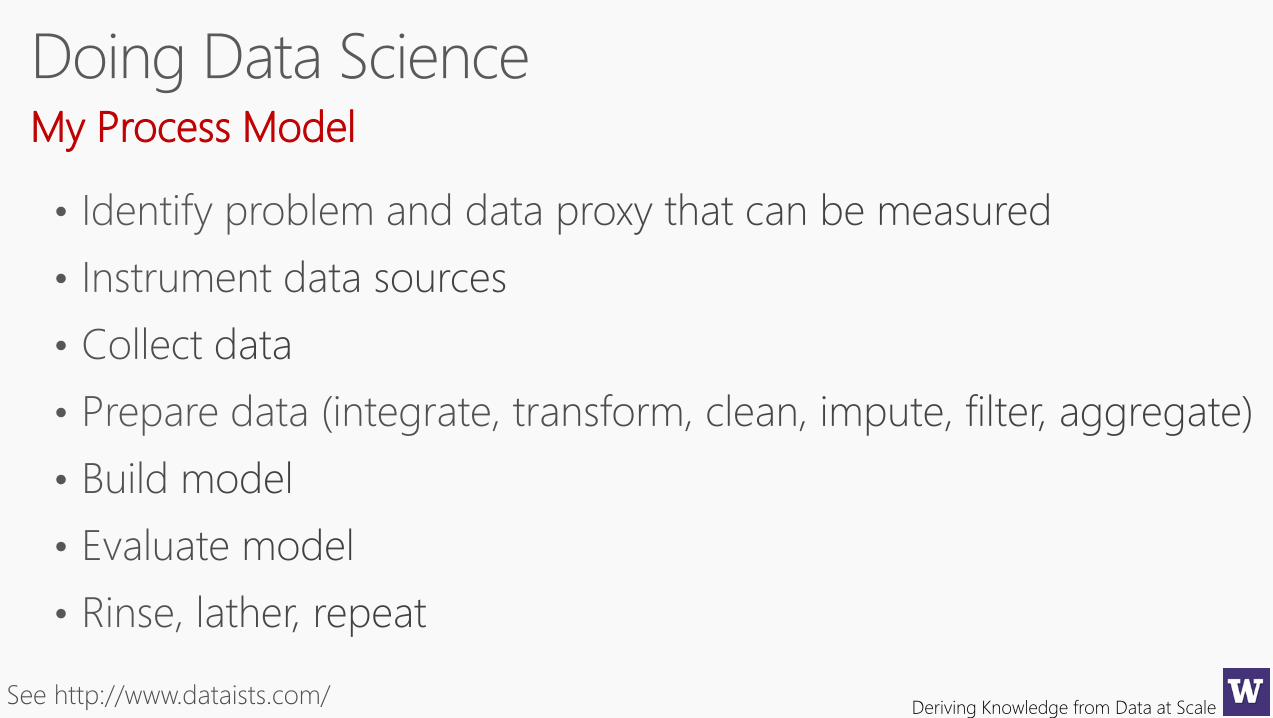
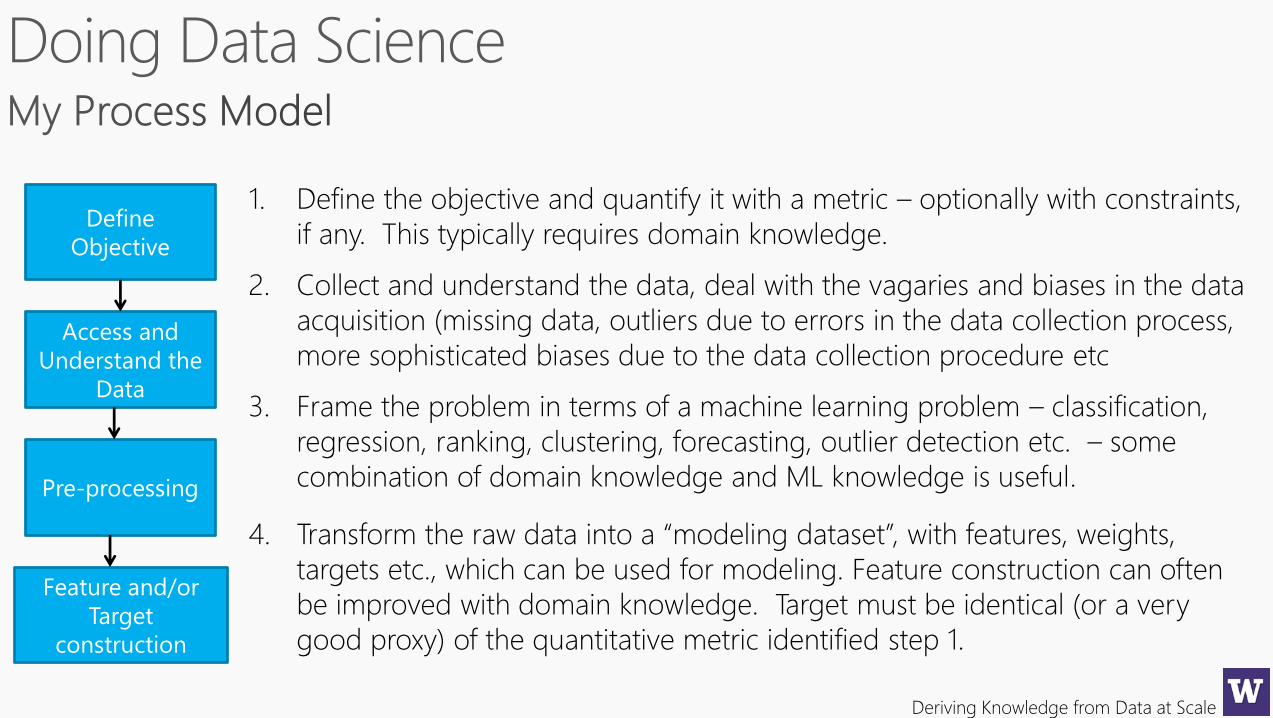
My Process Model
Deriving Knowledge from Data at Scale
Define
Objective
Access and
Understand the
Data
Pre-processing
Feature and/or
Target
construction
1. Define the objective and quantify it with a metric – optionally with constraints,
if any. This typically requires domain knowledge.
2. Collect and understand the data, deal with the vagaries and biases in the data
acquisition (missing data, outliers due to errors in the data collection process,
more sophisticated biases due to the data collection procedure etc
3. Frame the problem in terms of a machine learning problem – classification,
regression, ranking, clustering, forecasting, outlier detection etc. – some
combination of domain knowledge and ML knowledge is useful.
4. Transform the raw data into a “modeling dataset”, with features, weights,
targets etc., which can be used for modeling. Feature construction can often
be improved with domain knowledge. Target must be identical (or a very
good proxy) of the quantitative metric identified step 1.
Deriving Knowledge from Data at Scale
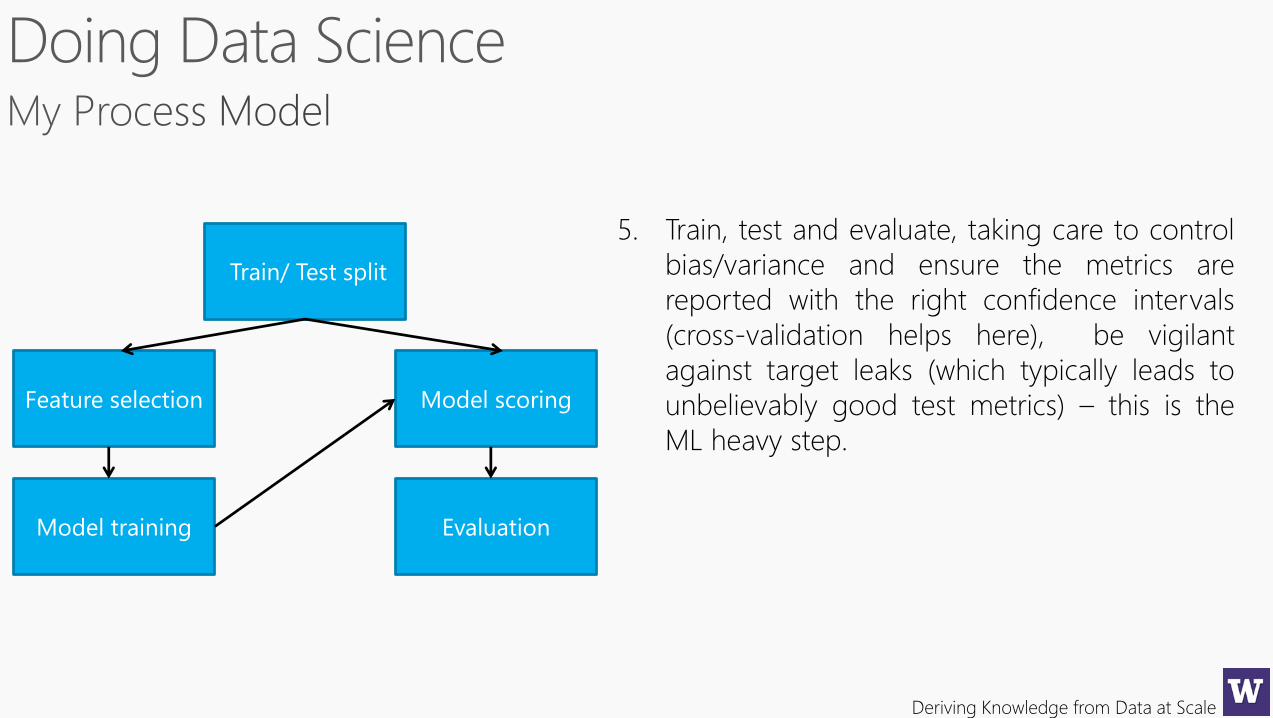
Feature selection
Model training
Model scoring
Evaluation
Train/ Test split
5. Train, test and evaluate, taking care to control
bias/variance and ensure the metrics are
reported with the right confidence intervals
(cross-validation helps here), be vigilant
against target leaks (which typically leads to
unbelievably good test metrics) – this is the
ML heavy step.
Deriving Knowledge from Data at Scale
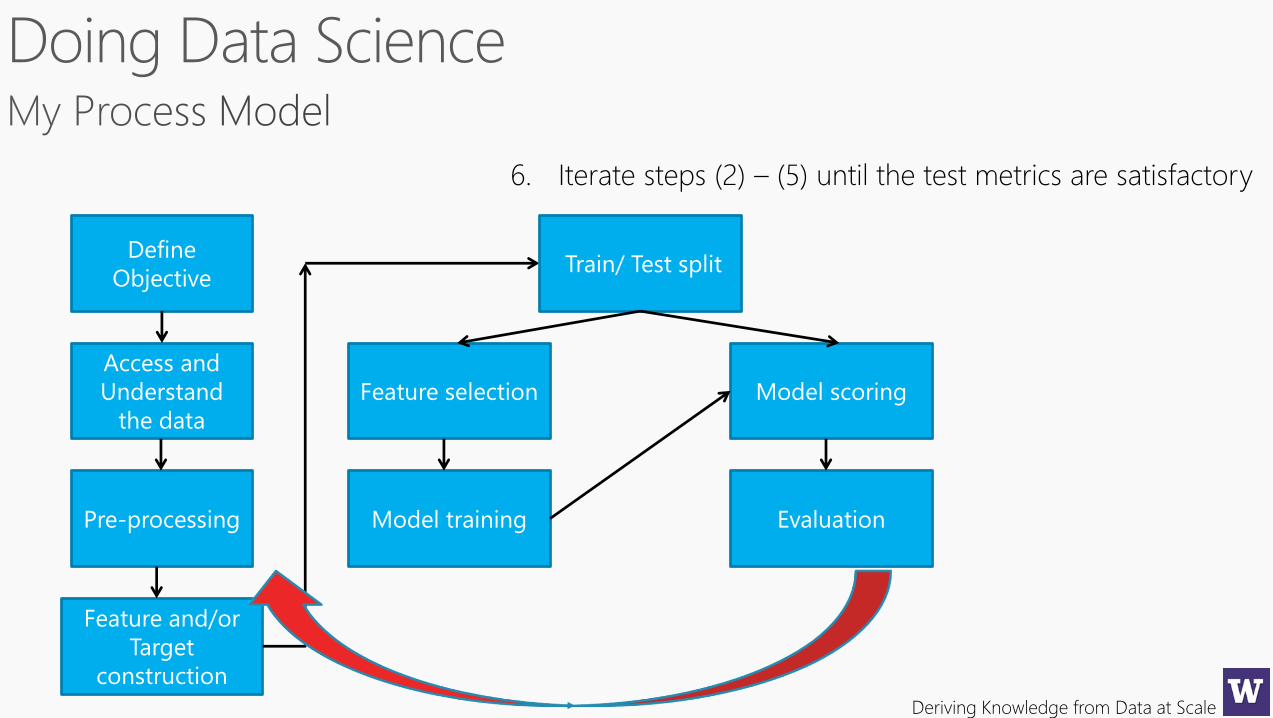
Define
Objective
Access and
Understand
the data
Pre-processing
Feature and/or
Target
construction
Feature selection
Model training
Model scoring
Evaluation
Train/ Test split
6. Iterate steps (2) – (5) until the test metrics are satisfactory
Deriving Knowledge from Data at Scale
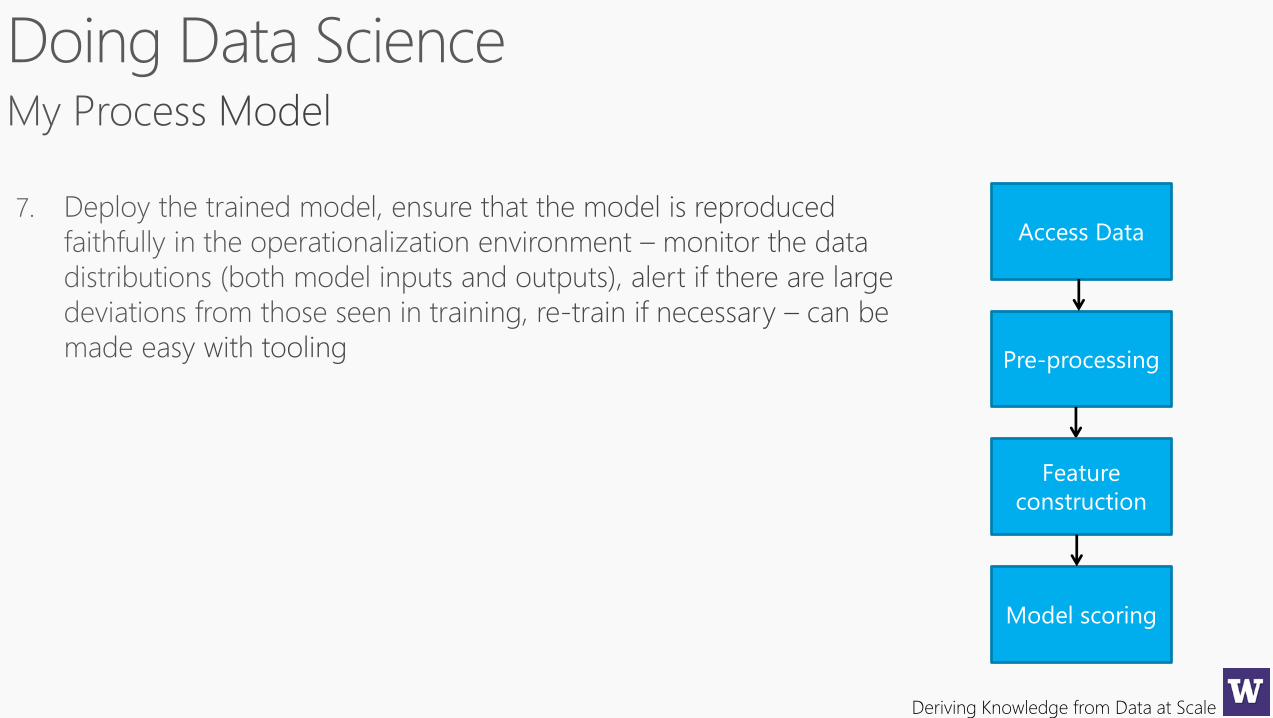
Access Data
Pre-processing
Feature
construction
Model scoring
Deriving Knowledge from Data at Scale
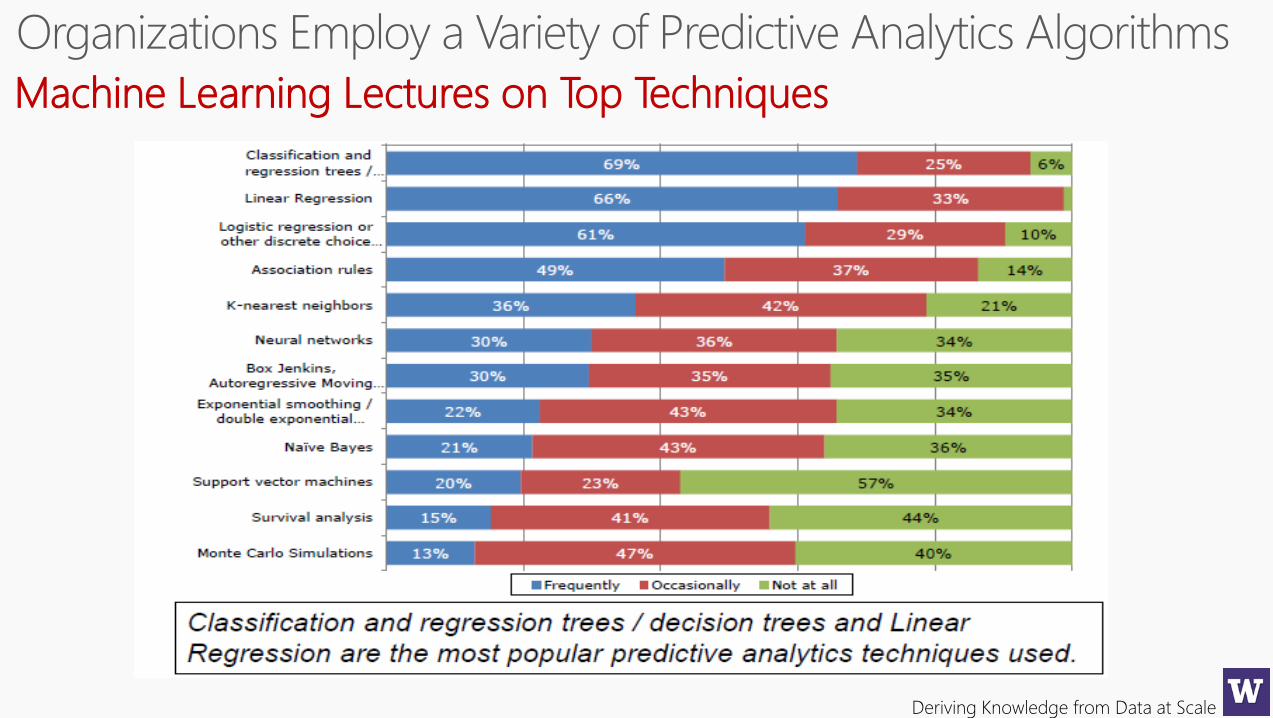
Machine Learning Lectures on Top Techniques

Deriving Knowledge from Data at Scale
Out of Class Reading
Week One

Deriving Knowledge from Data at Scale
Break,10 minutes…
Deriving Knowledge from Data at Scale
Deriving Knowledge from Data at Scale
Deriving Knowledge from Data at Scale
Deriving Knowledge from Data at Scale
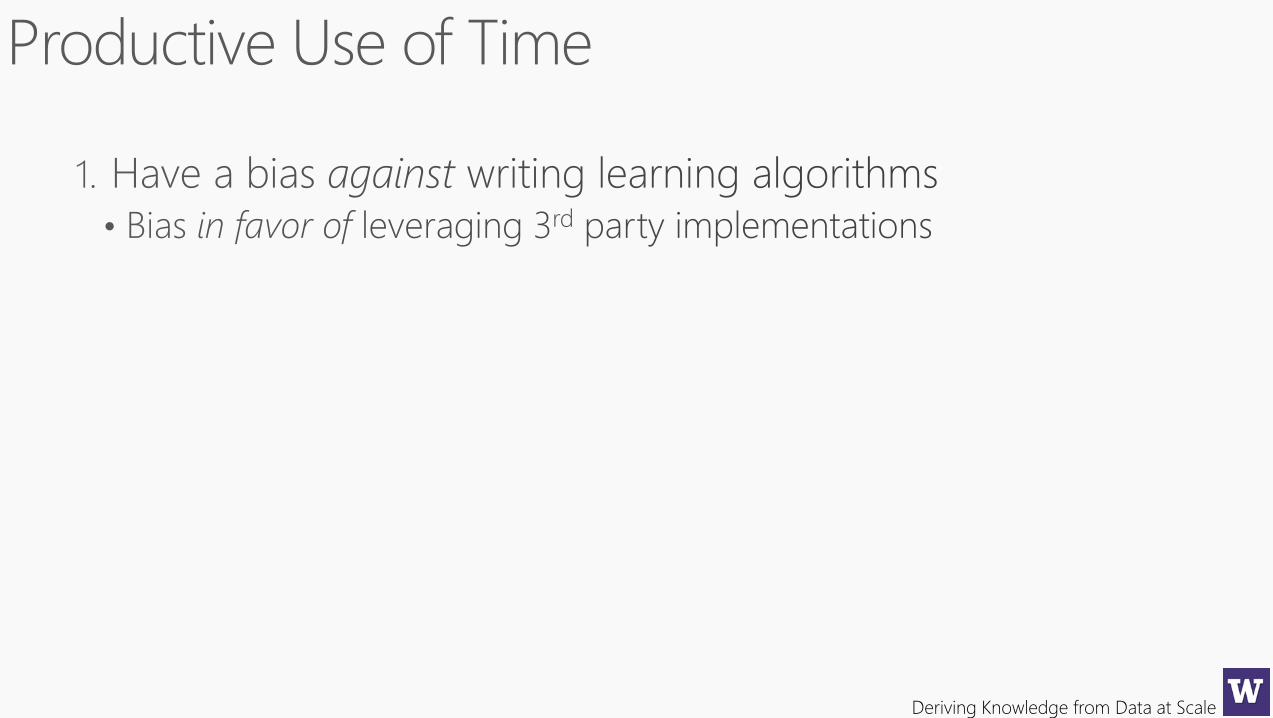
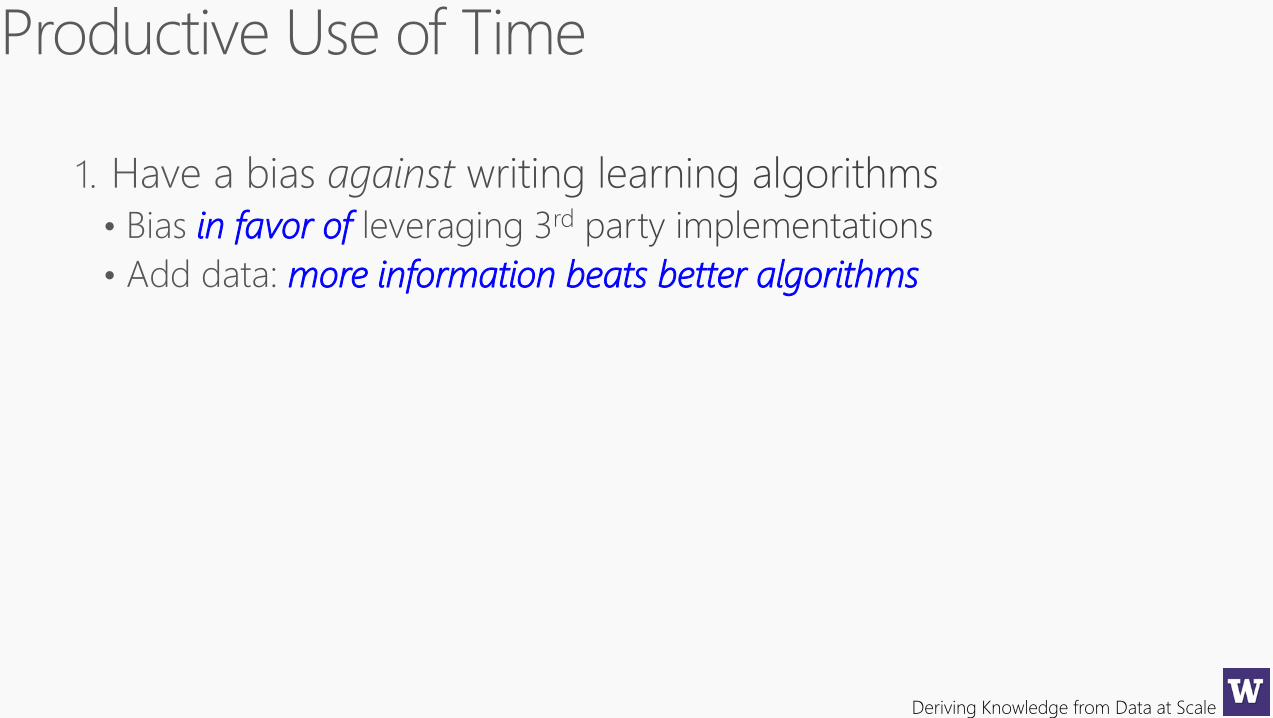
in favor of
more information beats better algorithms
Deriving Knowledge from Data at Scale
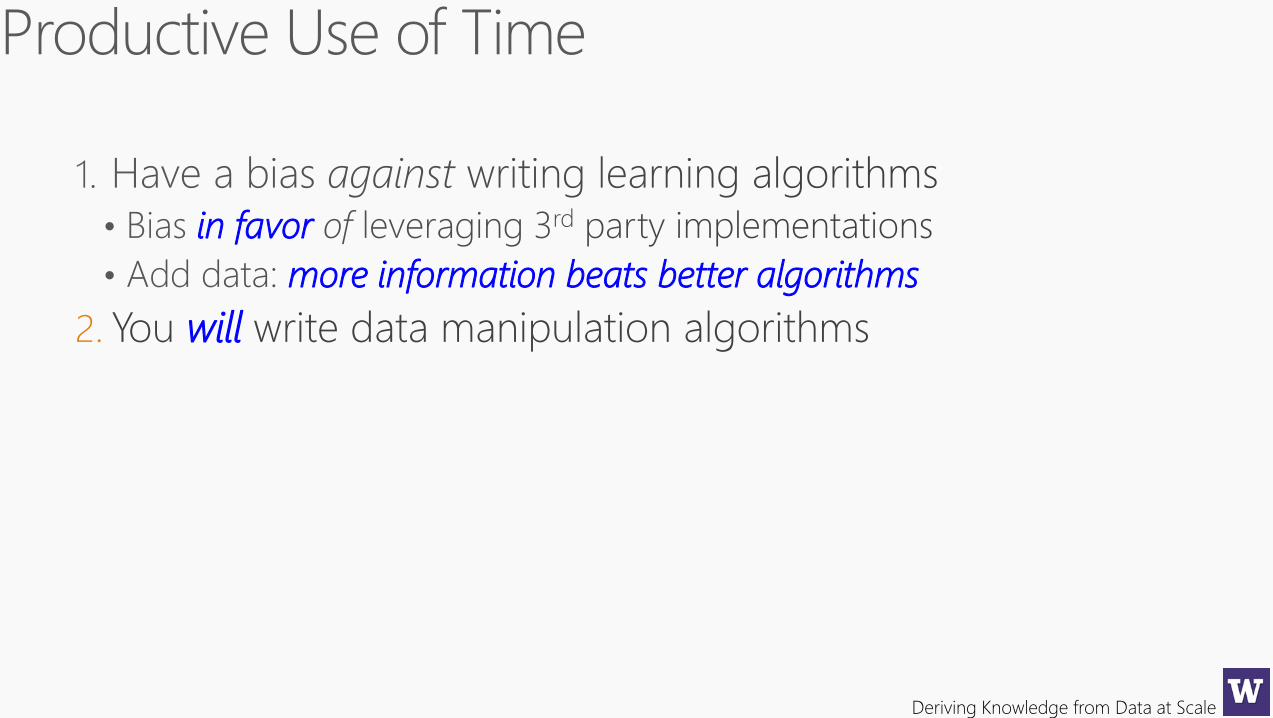
in favor
more information beats better algorithms
2. You will write data manipulation algorithms
Deriving Knowledge from Data at Scale
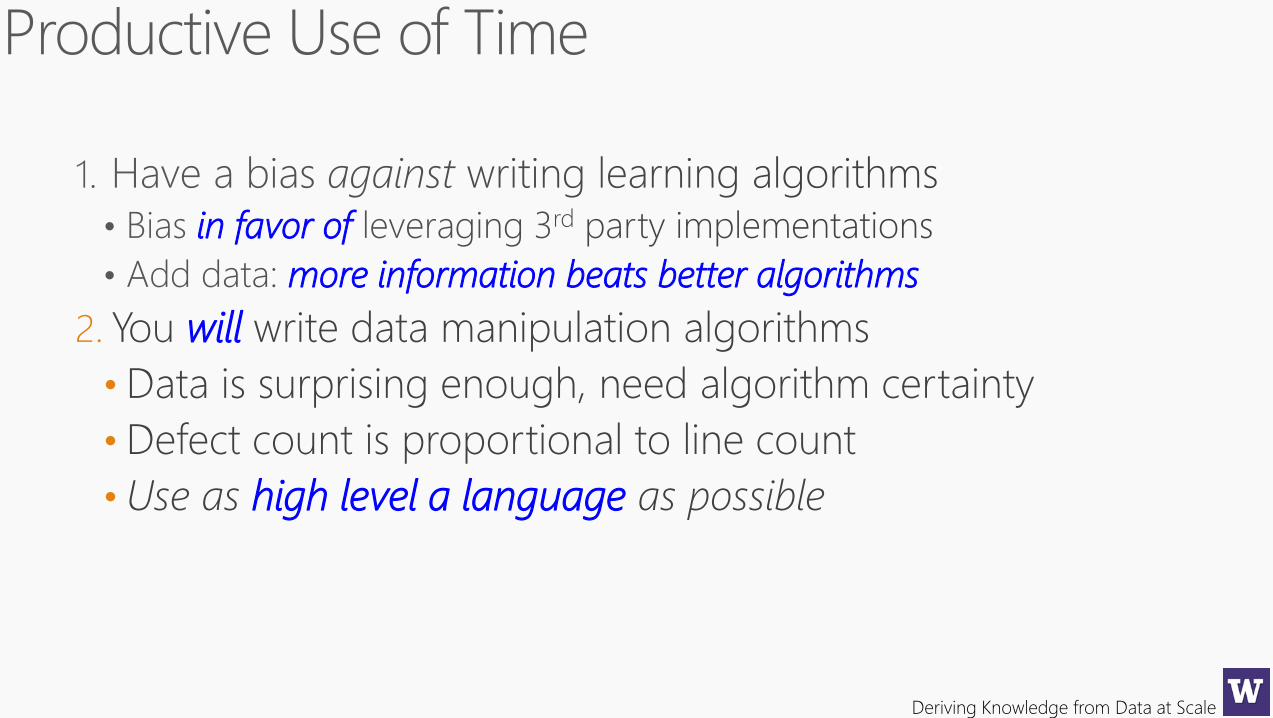
in favor of
more information beats better algorithms
2. You will write data manipulation algorithms
• Data is surprising enough, need algorithm certainty
• Defect count is proportional to line count
• Use as high level a language as possible
Deriving Knowledge from Data at Scale
Deriving Knowledge from Data at Scale
Deriving Knowledge from Data at Scale
Deriving Knowledge from Data at Scale
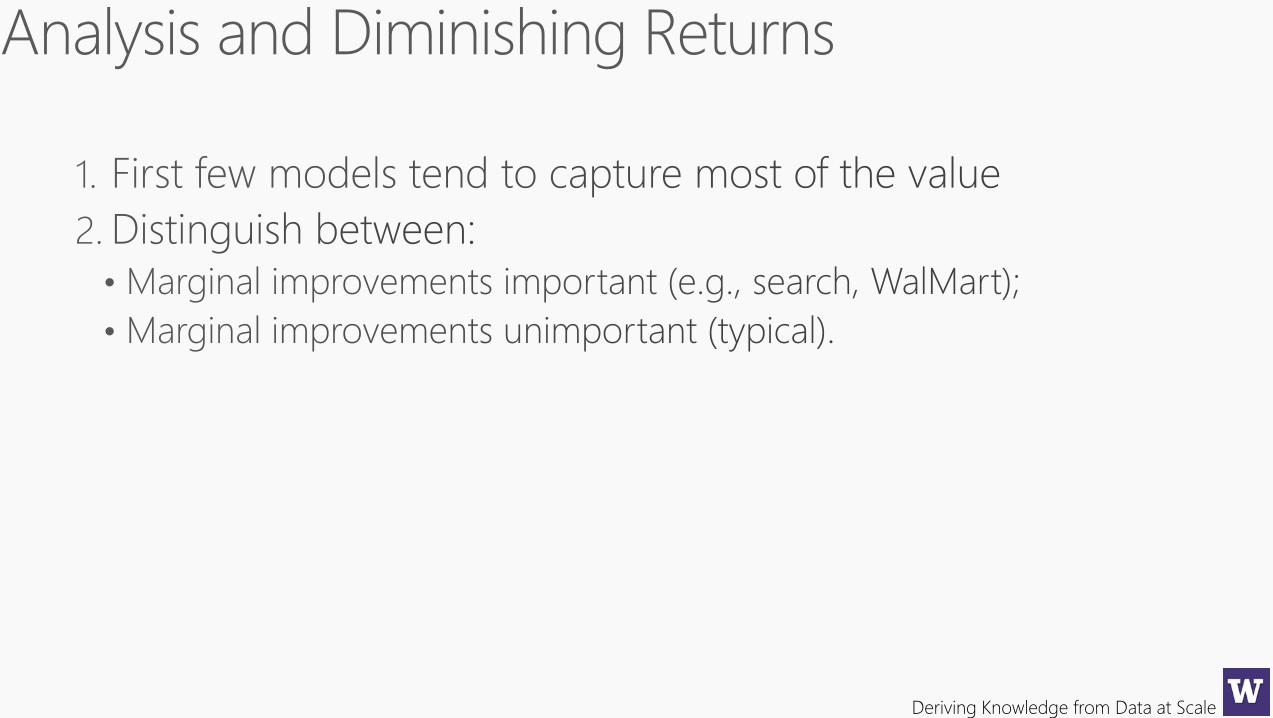
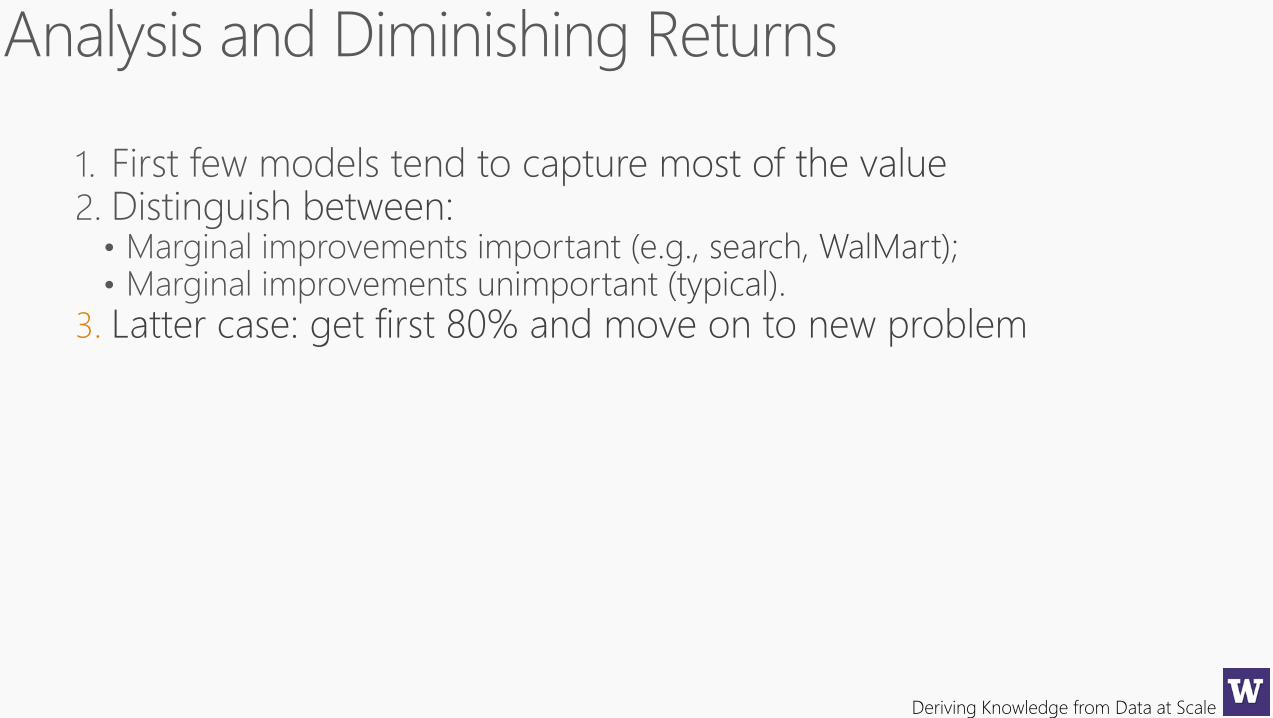
3. Latter case: get first 80% and move on to new problem
Deriving Knowledge from Data at Scale
Deriving Knowledge from Data at Scale
Deriving Knowledge from Data at Scale
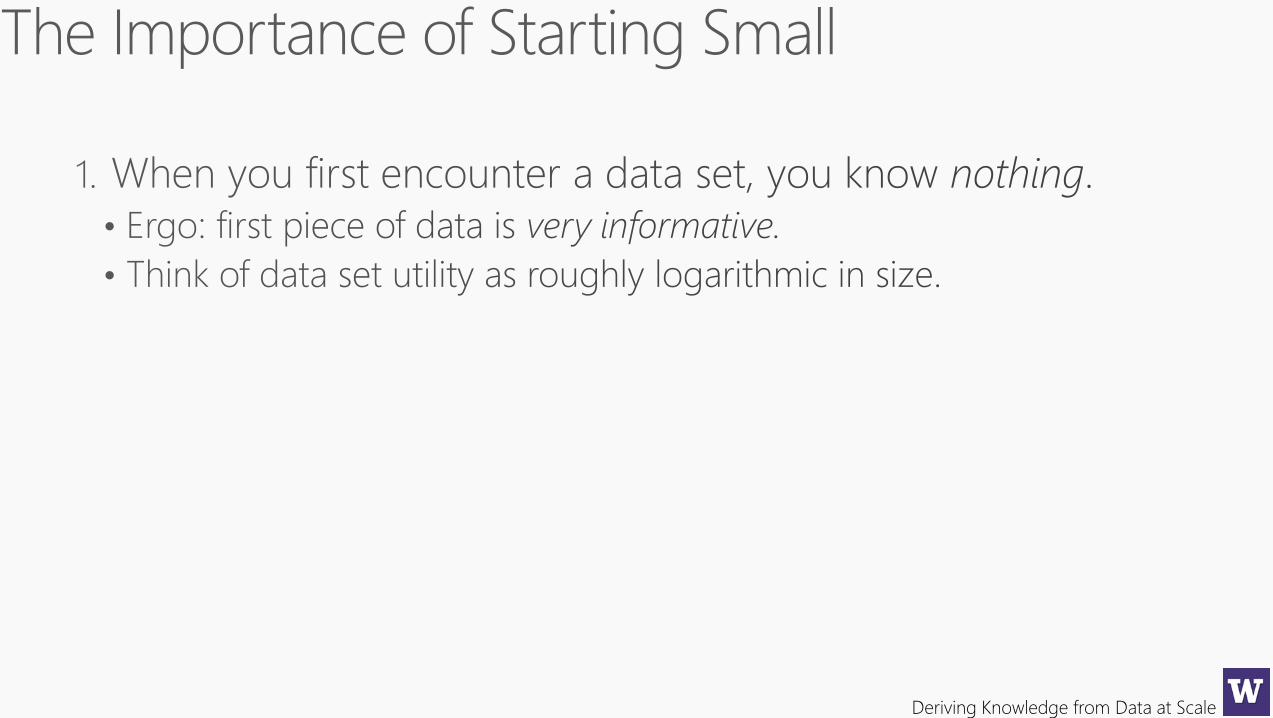
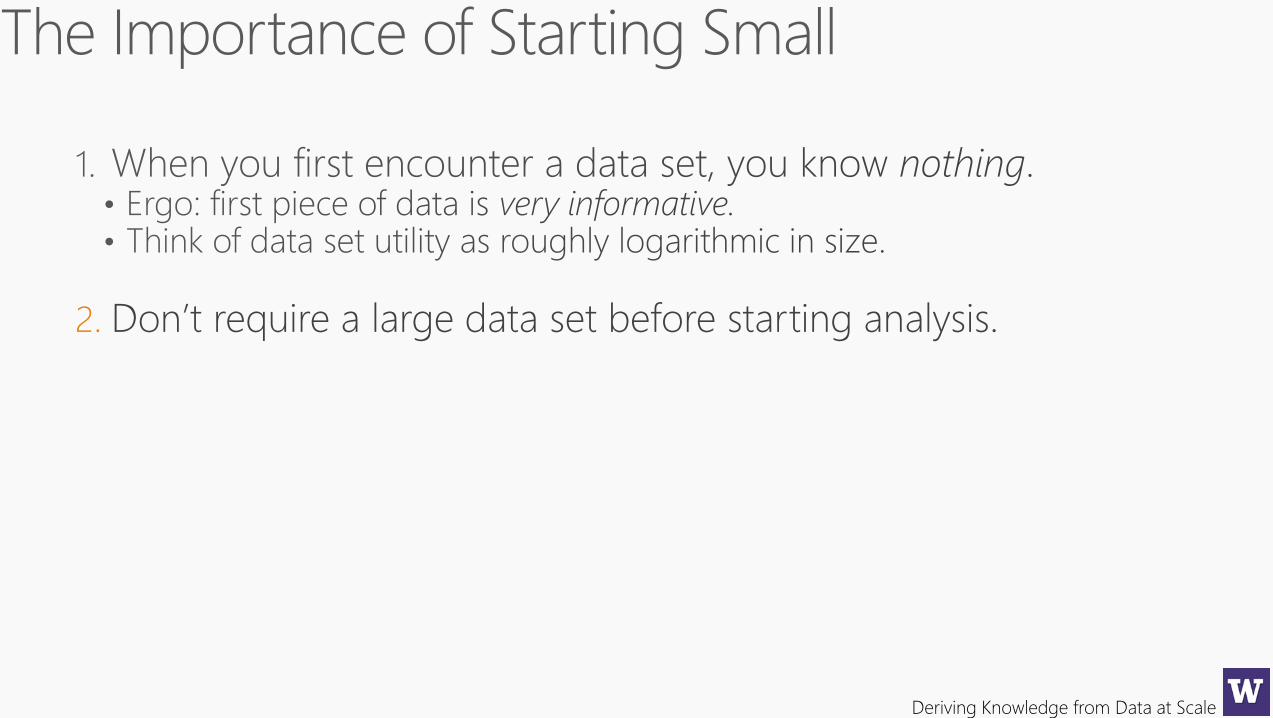
2. Don’t require a large data set before starting analysis.
Deriving Knowledge from Data at Scale
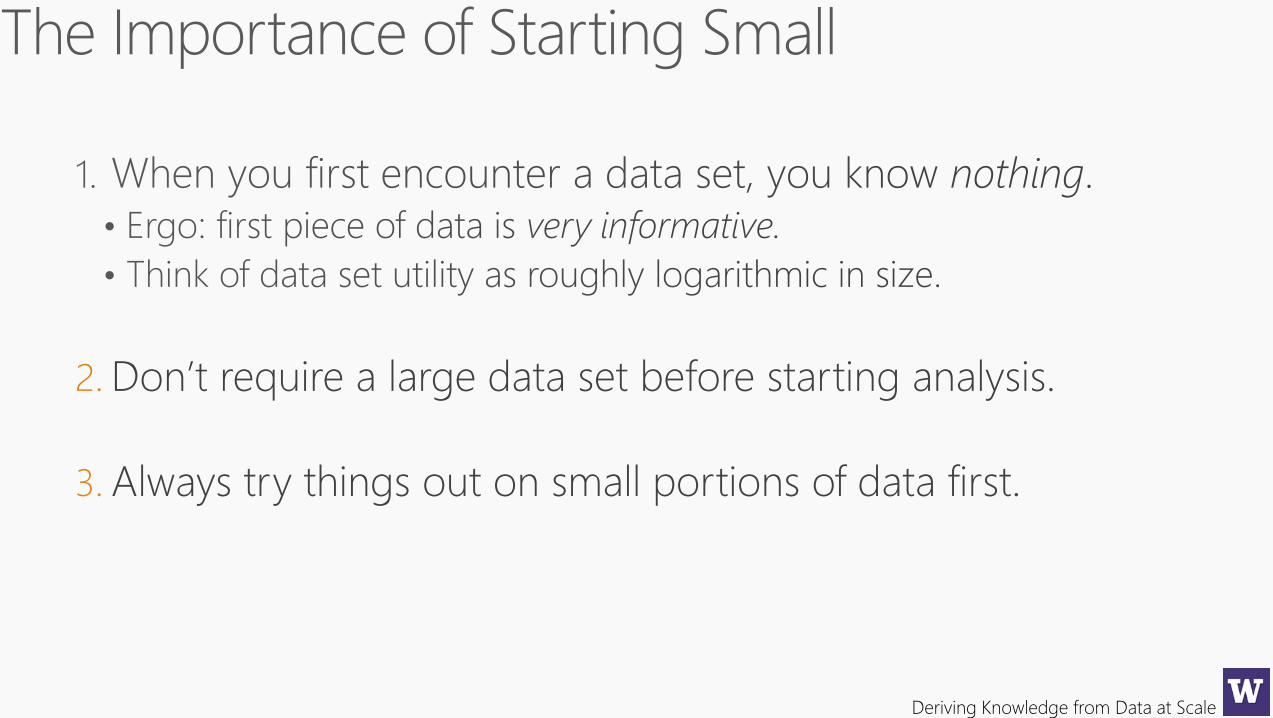
2. Don’t require a large data set before starting analysis.
3. Always try things out on small portions of data first.
Deriving Knowledge from Data at Scale
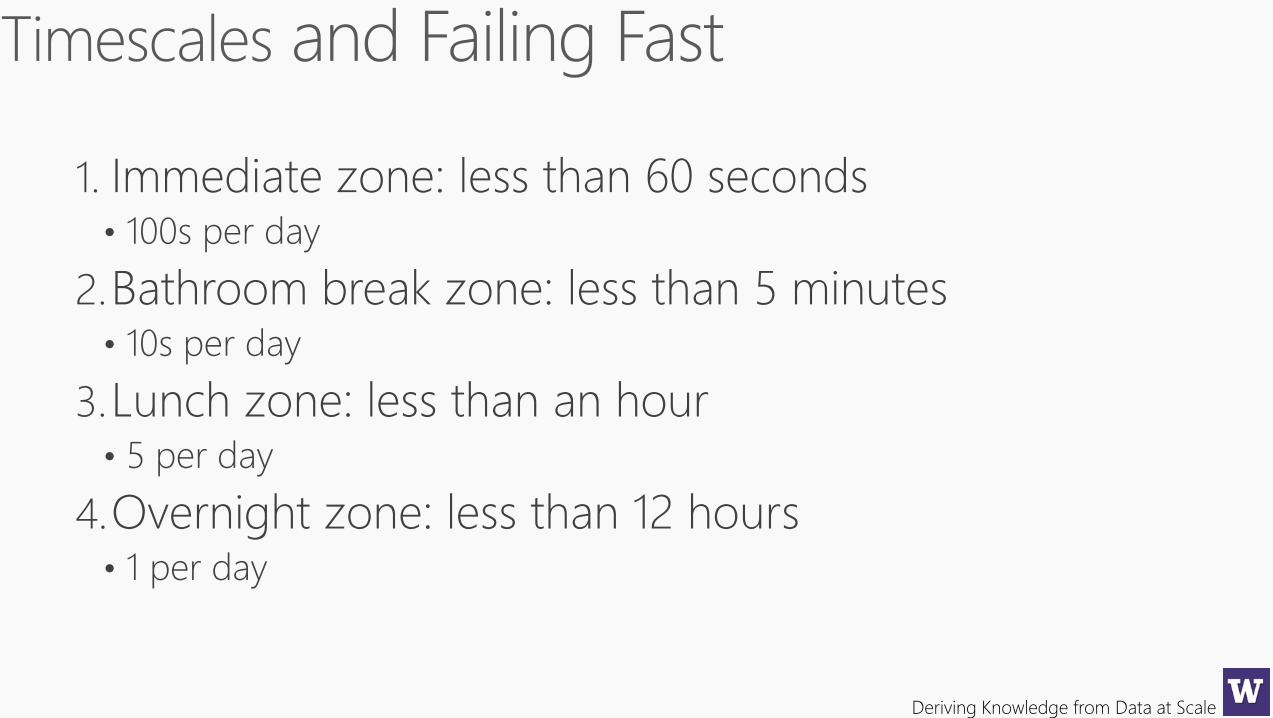
1. Immediate zone: less than 60 seconds• 100s per day
2.Bathroom break zone: less than 5 minutes• 10s per day
3.Lunch zone: less than an hour• 5 per day
4.Overnight zone: less than 12 hours• 1 per day
Deriving Knowledge from Data at Scale
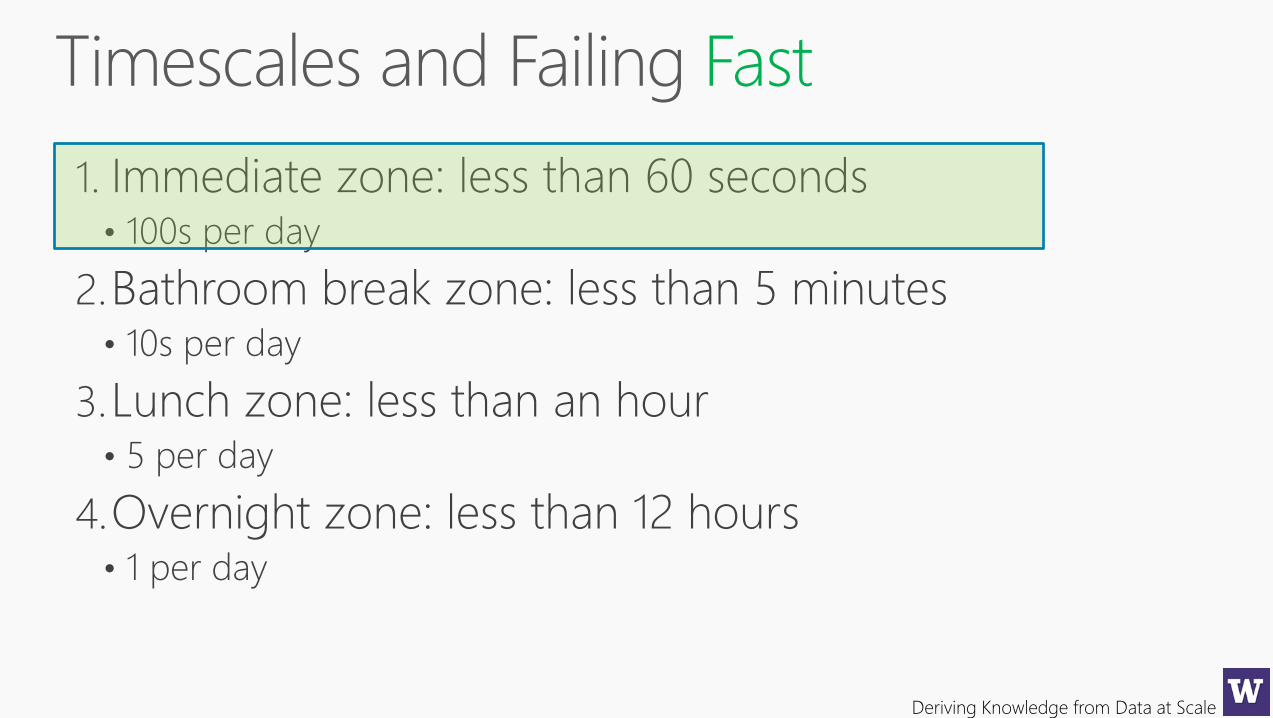
Fast
1. Immediate zone: less than 60 seconds• 100s per day
2.Bathroom break zone: less than 5 minutes• 10s per day
3.Lunch zone: less than an hour• 5 per day
4.Overnight zone: less than 12 hours• 1 per day
Deriving Knowledge from Data at Scale
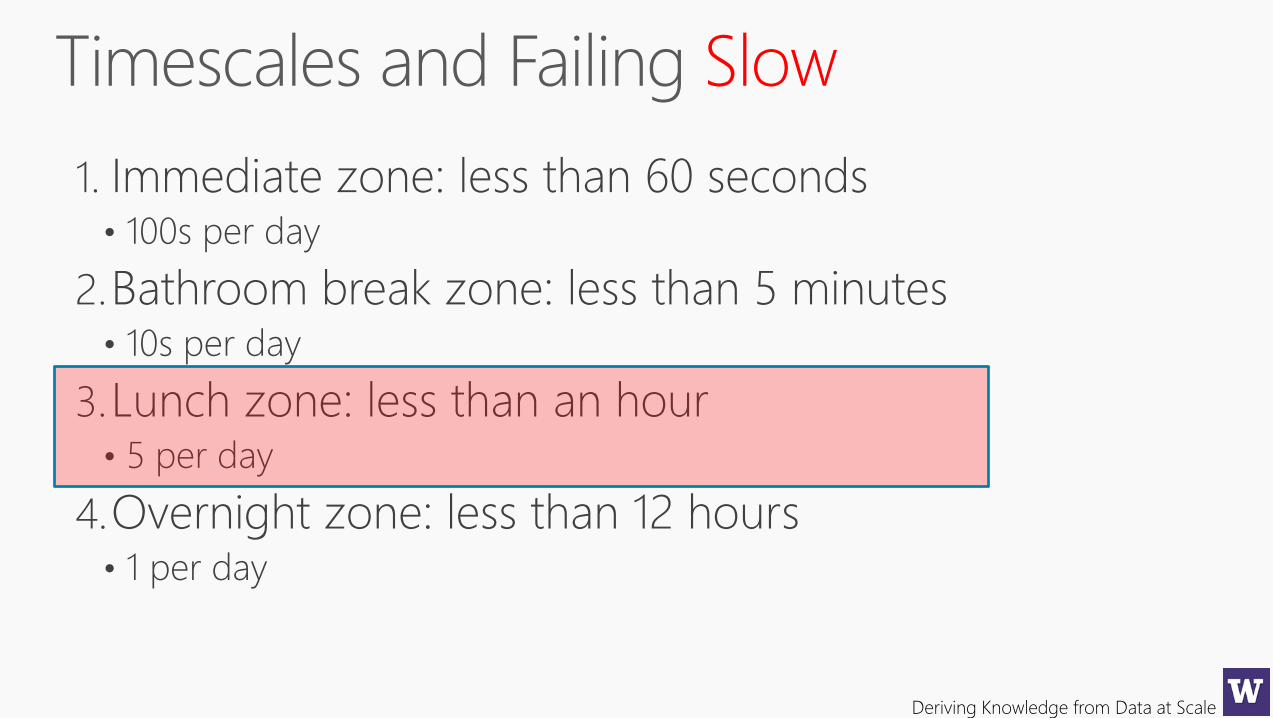
Slow
1. Immediate zone: less than 60 seconds• 100s per day
2.Bathroom break zone: less than 5 minutes• 10s per day
3.Lunch zone: less than an hour• 5 per day
4.Overnight zone: less than 12 hours• 1 per day
Deriving Knowledge from Data at Scale
Deriving Knowledge from Data at Scale
Deriving Knowledge from Data at Scale
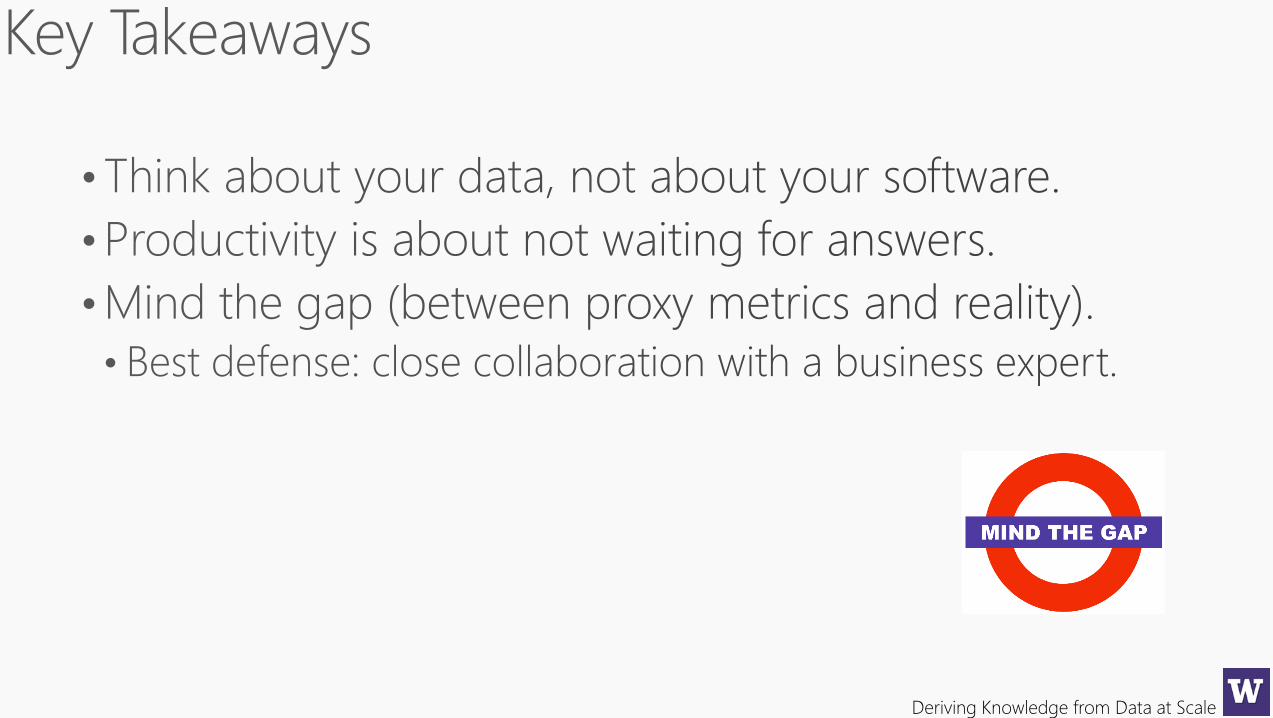
Stay in the immediate zone.
Deriving Knowledge from Data at Scale
Deriving Knowledge from Data at Scale
Deriving Knowledge from Data at Scale
Deriving Knowledge from Data at Scale

Deriving Knowledge from Data at Scale
Break,10 minutes…
Deriving Knowledge from Data at Scale
Causal Analysis in
Online Display
Advertising
Dilbert
Deriving Knowledge from Data at Scale
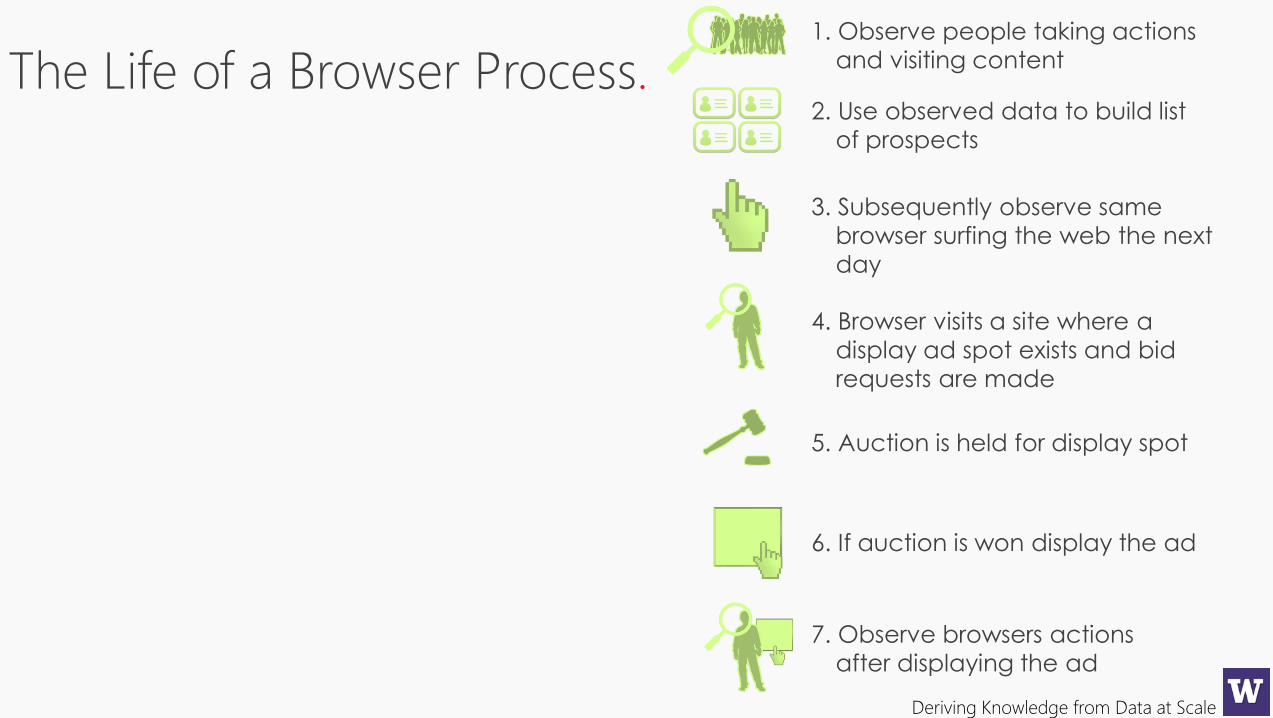
The Life of a Browser Process.2. Use observed data to build list
of prospects
3. Subsequently observe same
browser surfing the web the next
day
4. Browser visits a site where a
display ad spot exists and bid
requests are made
5. Auction is held for display spot
6. If auction is won display the ad
7. Observe browsers actions
after displaying the ad
1. Observe people taking actions
and visiting content
Deriving Knowledge from Data at Scale
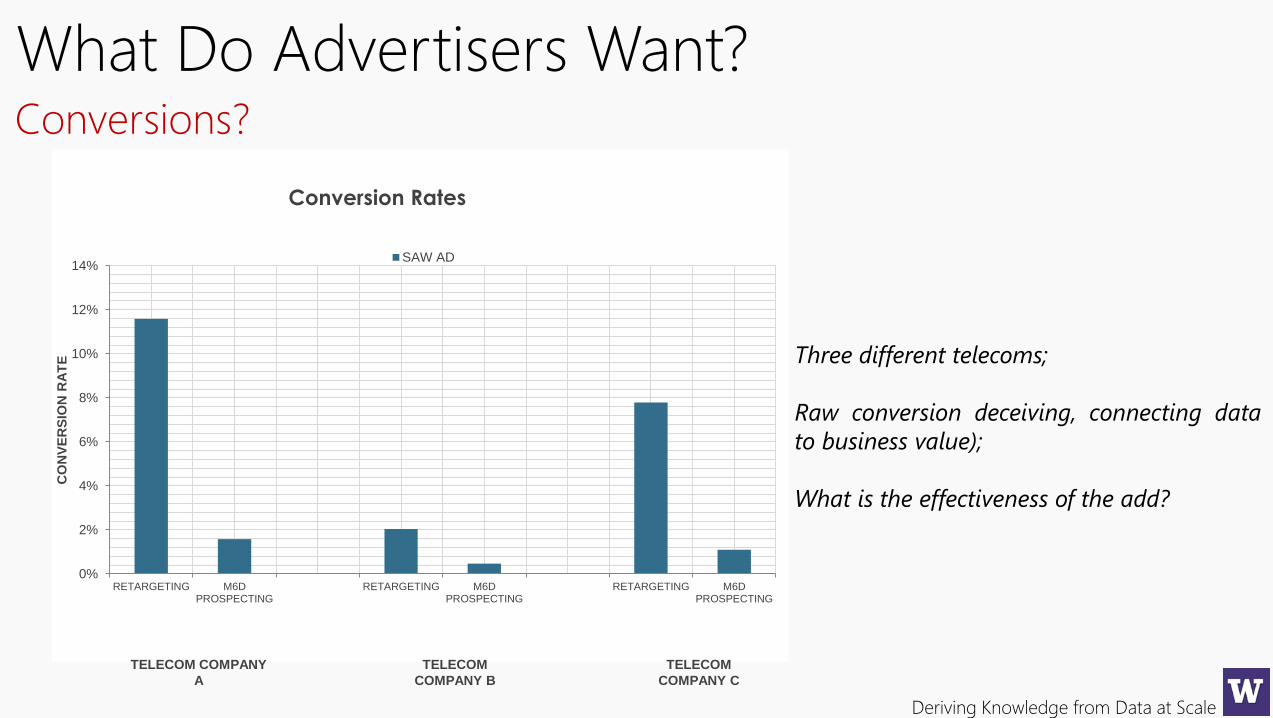
What Do Advertisers Want?Conversions?
0%
2%
4%
6%
8%
10%
12%
14%
RETARGETING M6DPROSPECTING
RETARGETING M6DPROSPECTING
RETARGETING M6DPROSPECTING
CO
NV
ER
SIO
N R
AT
E
Conversion Rates
SAW AD
TELECOM COMPANY
A
TELECOM
COMPANY B
TELECOM
COMPANY C
Three different telecoms;
Raw conversion deceiving, connecting data
to business value);
What is the effectiveness of the add?
Deriving Knowledge from Data at Scale
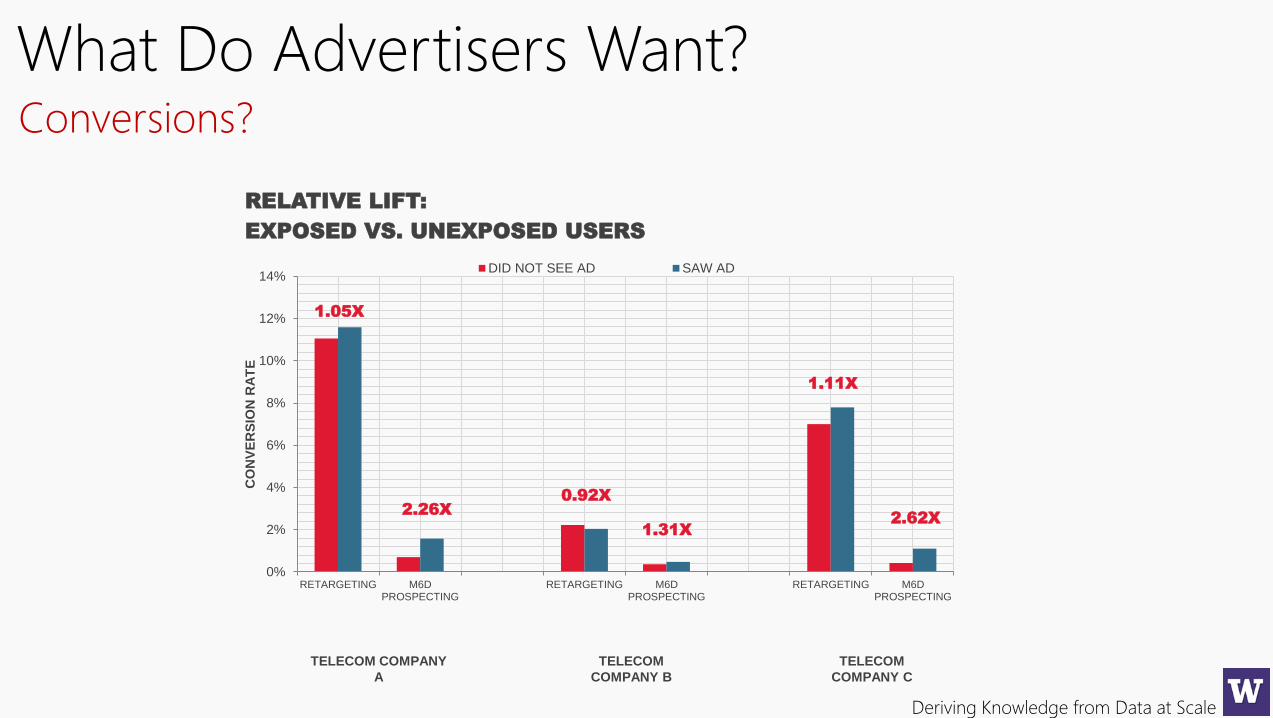
What Do Advertisers Want?
0%
2%
4%
6%
8%
10%
12%
14%
RETARGETING M6DPROSPECTING
RETARGETING M6DPROSPECTING
RETARGETING M6DPROSPECTING
CO
NV
ER
SIO
N R
AT
E
RELATIVE LIFT:
EXPOSED VS. UNEXPOSED USERS
DID NOT SEE AD SAW AD
1.05X
2.62X
1.11X
1.31X
0.92X
2.26X
TELECOM COMPANY
A
TELECOM
COMPANY B
TELECOM
COMPANY C
Conversions?
Deriving Knowledge from Data at Scale
.
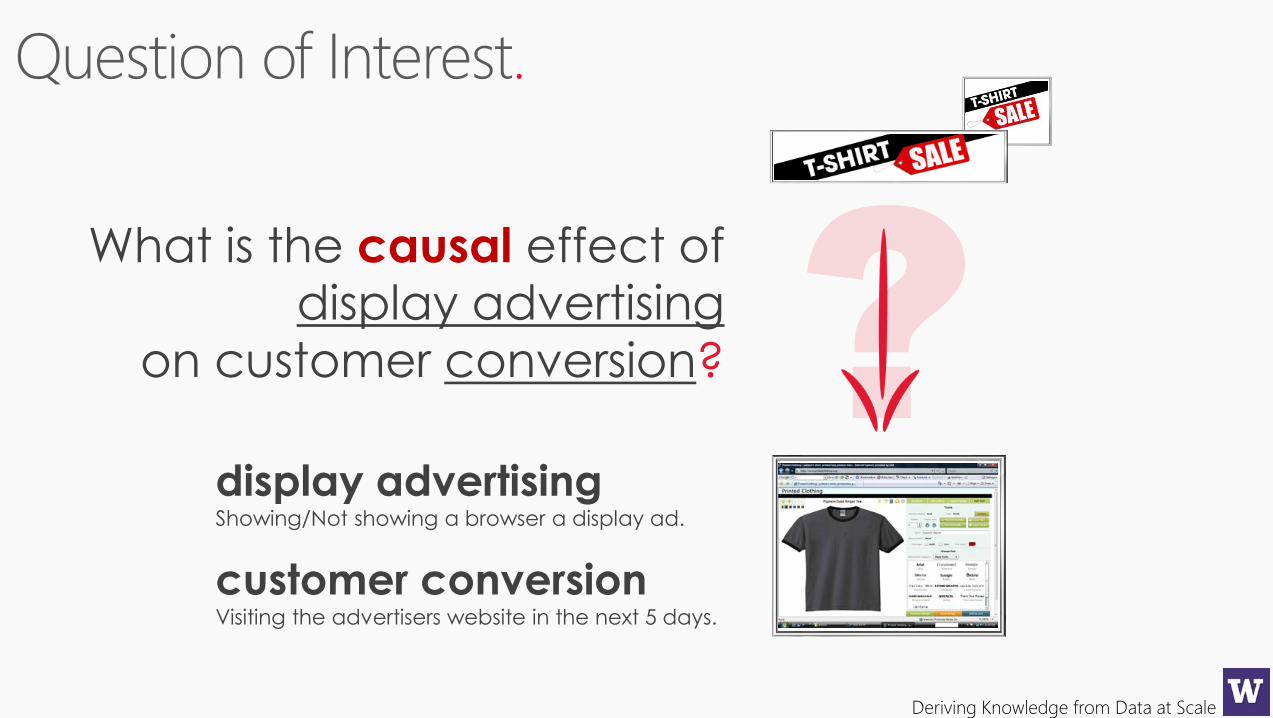
What is the causal effect of display advertising
on customer conversion?
display advertisingShowing/Not showing a browser a display ad.
customer conversionVisiting the advertisers website in the next 5 days.
Deriving Knowledge from Data at Scale
.
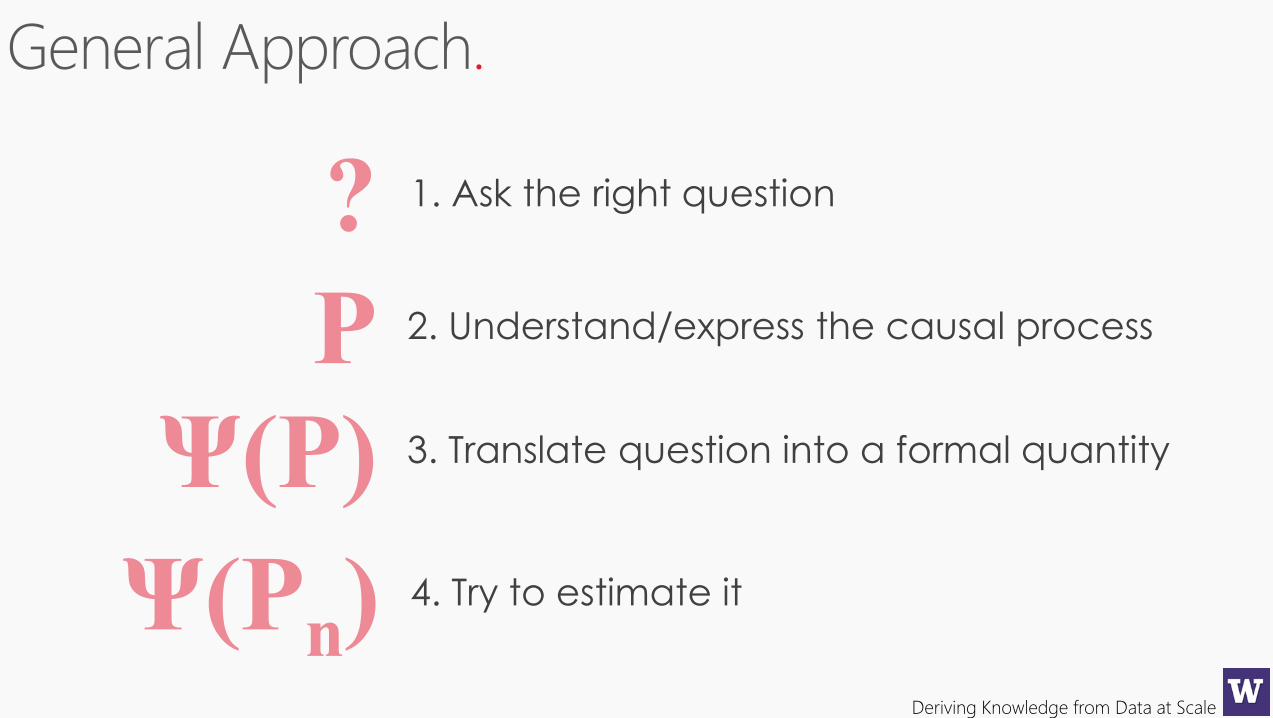
1. Ask the right question
3. Translate question into a formal quantity
4. Try to estimate it
2. Understand/express the causal process
Deriving Knowledge from Data at Scale
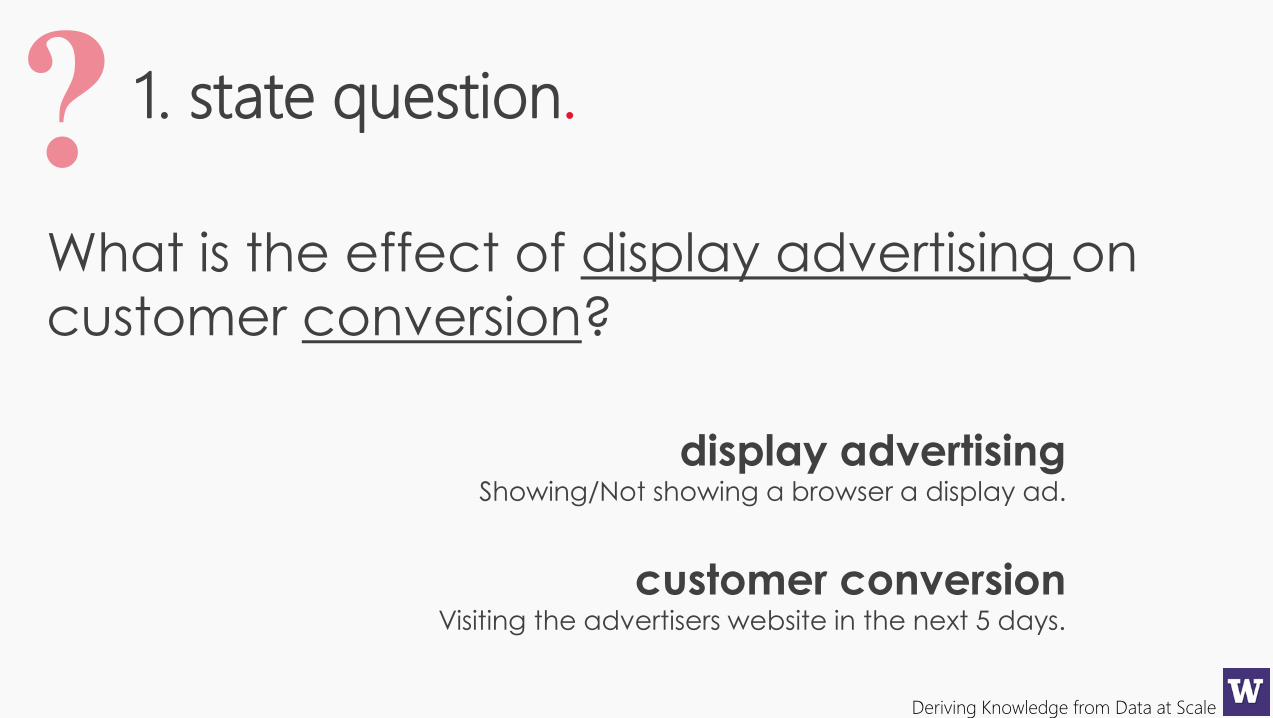
What is the effect of display advertising on
customer conversion?
1. state question.
display advertisingShowing/Not showing a browser a display ad.
customer conversionVisiting the advertisers website in the next 5 days.
Deriving Knowledge from Data at Scale
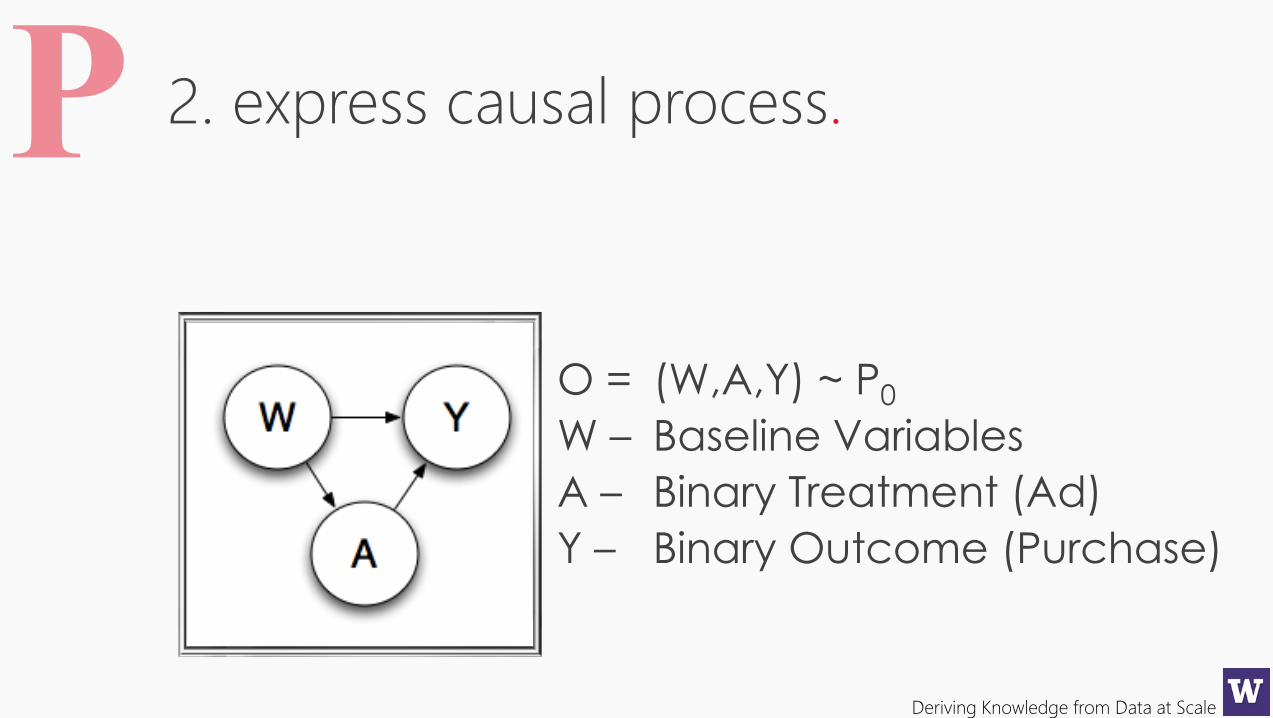
2. express causal process.
O = (W,A,Y) ~ P0
W – Baseline Variables
A – Binary Treatment (Ad)
Y – Binary Outcome (Purchase)
Deriving Knowledge from Data at Scale
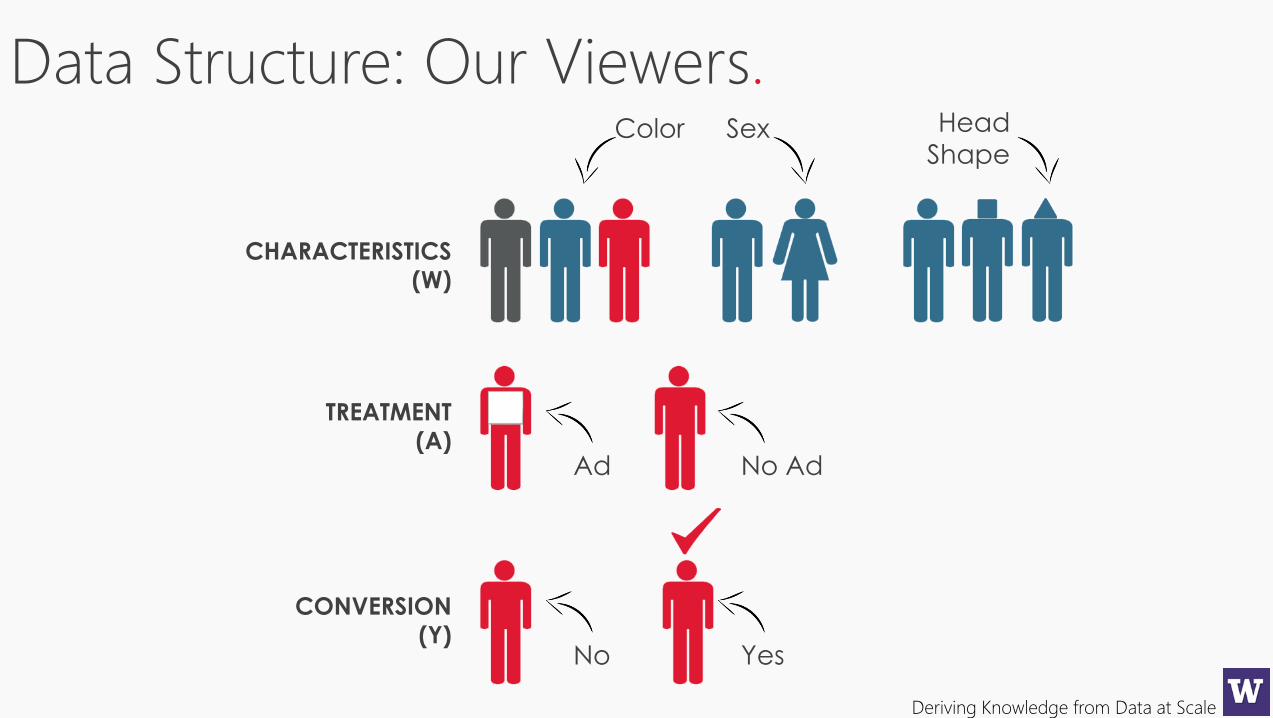
Data Structure: Our Viewers.
CHARACTERISTICS
(W)
TREATMENT
(A)
CONVERSION
(Y)
Color Sex Head
Shape
Ad No Ad
No Yes
Deriving Knowledge from Data at Scale
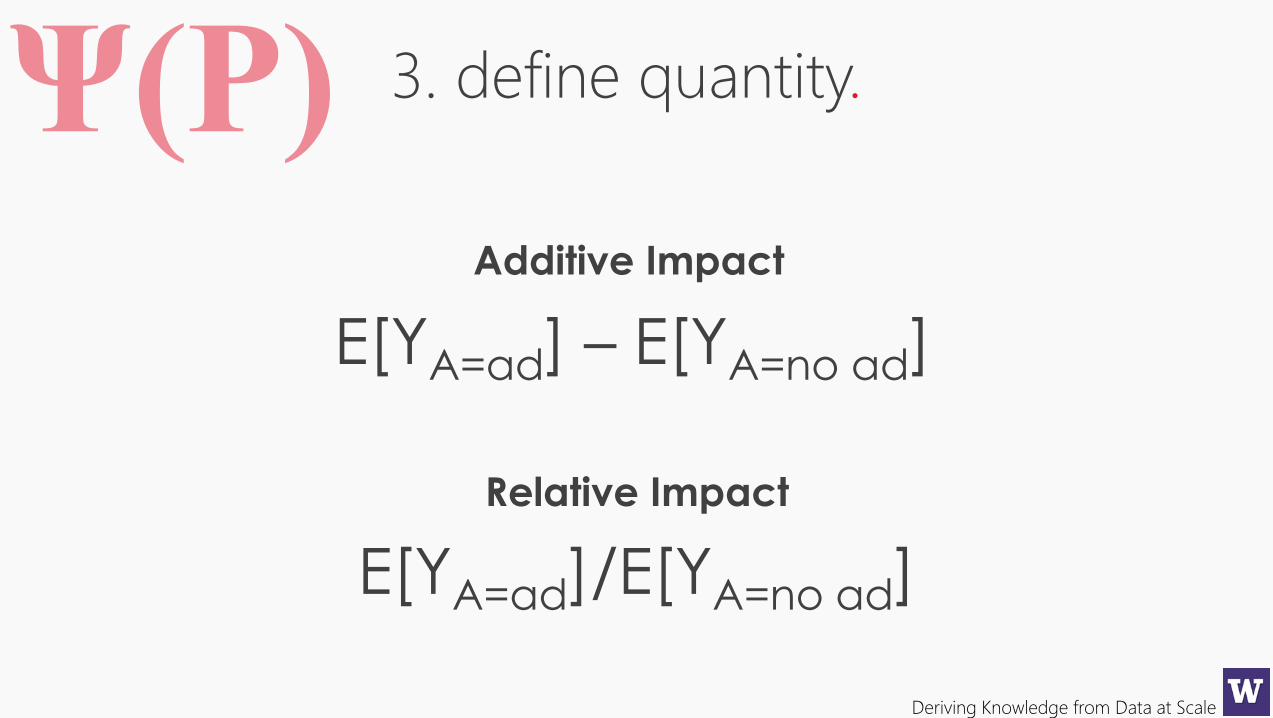
3. define quantity.
E[YA=ad] – E[YA=no ad]
E[YA=ad]/E[YA=no ad]
Additive Impact
Relative Impact
Deriving Knowledge from Data at Scale
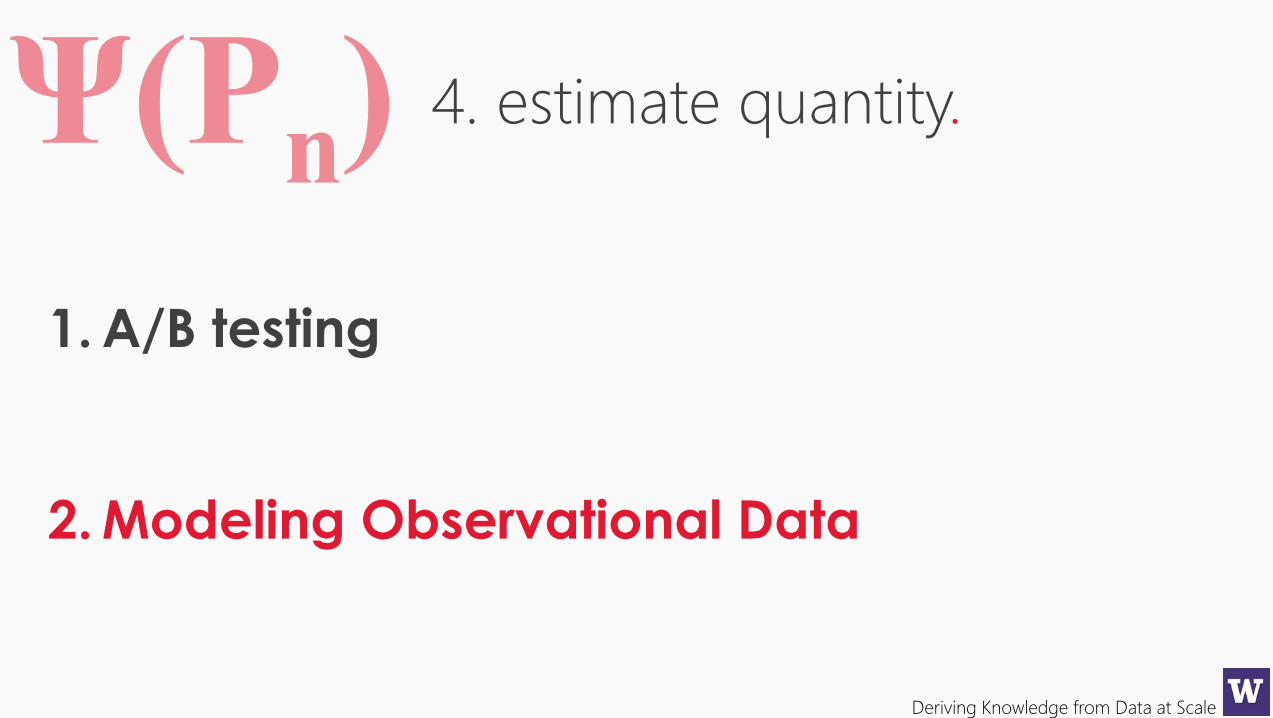
4. estimate quantity.
1. A/B testing
2. Modeling Observational Data
Deriving Knowledge from Data at Scale
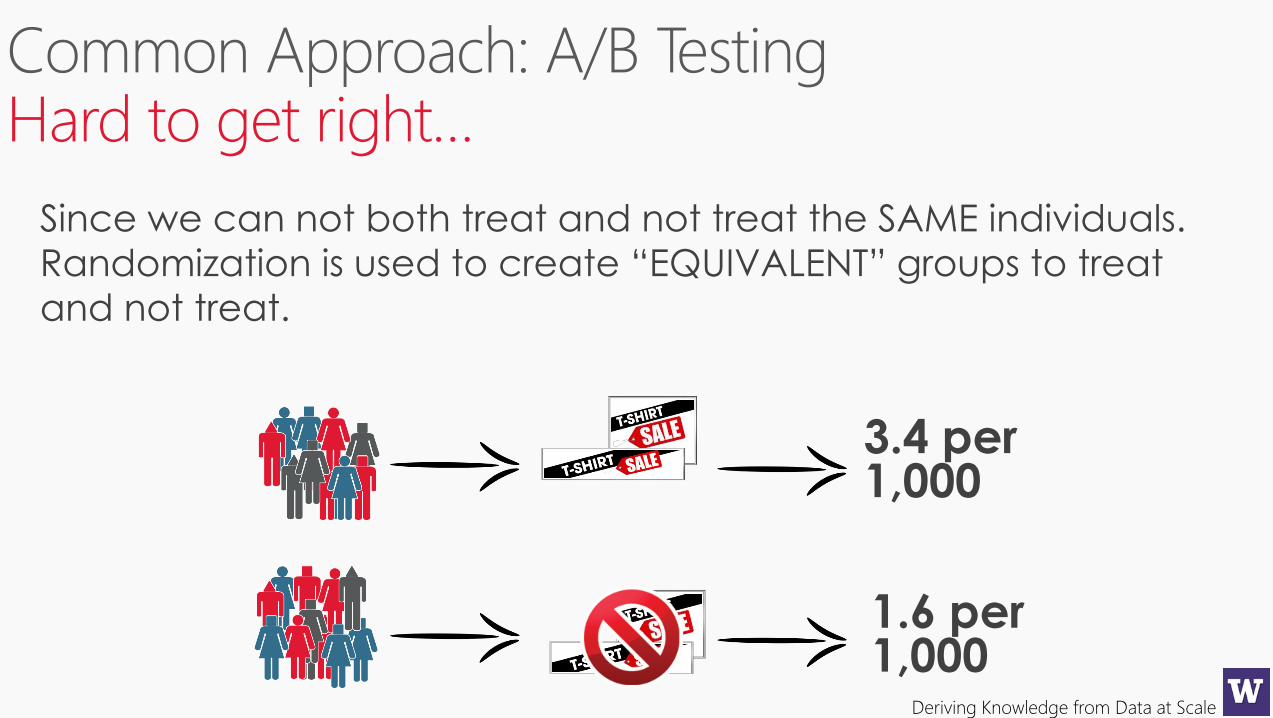
Hard to get right…
Since we can not both treat and not treat the SAME individuals.
Randomization is used to create “EQUIVALENT” groups to treat
and not treat.
3.4 per 1,000
1.6 per 1,000
Deriving Knowledge from Data at Scale
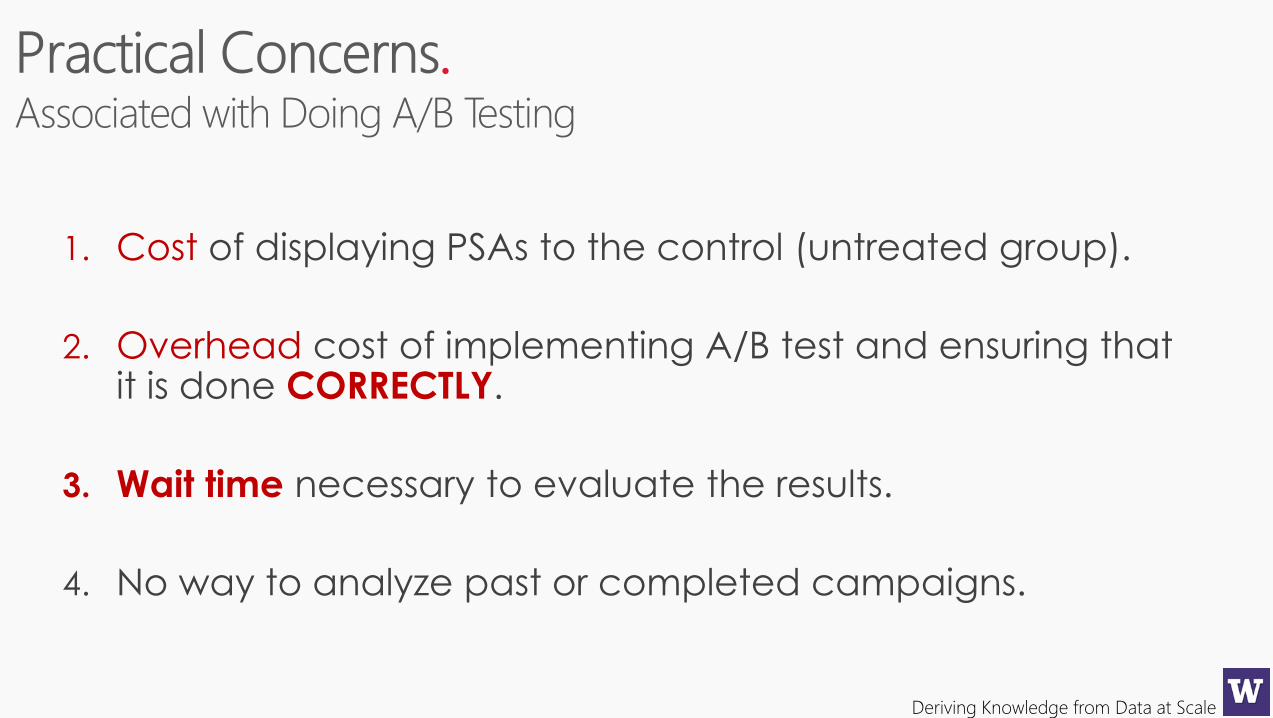
.
1. Cost of displaying PSAs to the control (untreated group).
2. Overhead cost of implementing A/B test and ensuring that it is done CORRECTLY.
3. Wait time necessary to evaluate the results.
4. No way to analyze past or completed campaigns.
Deriving Knowledge from Data at Scale
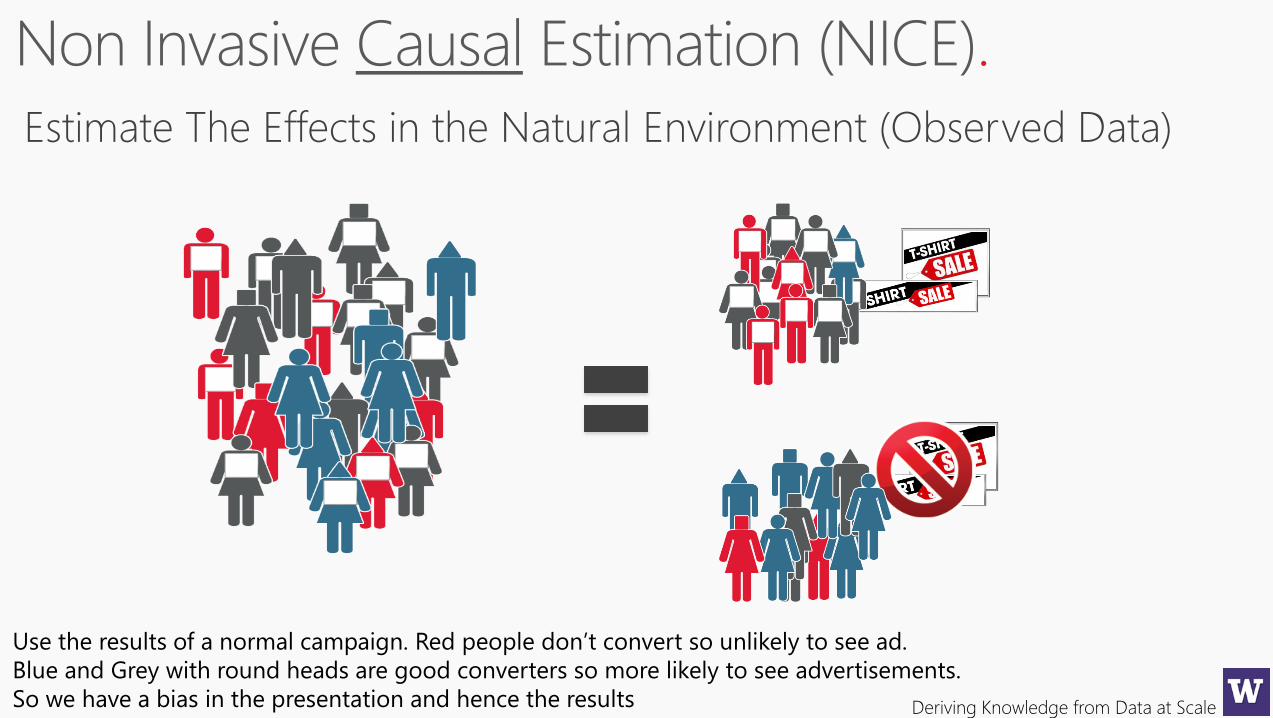
.
Estimate The Effects in the Natural Environment (Observed Data)
Use the results of a normal campaign. Red people don’t convert so unlikely to see ad.
Blue and Grey with round heads are good converters so more likely to see advertisements.
So we have a bias in the presentation and hence the results
Deriving Knowledge from Data at Scale
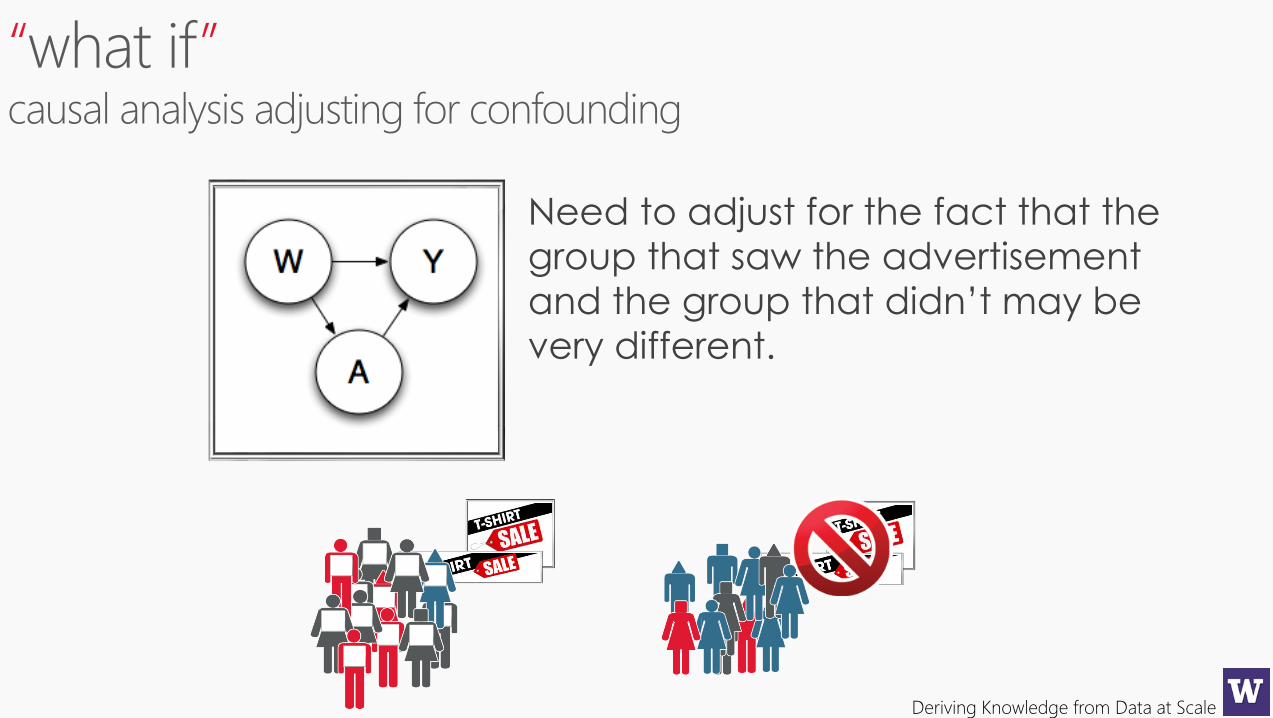
“ ”
Need to adjust for the fact that the
group that saw the advertisement
and the group that didn’t may be
very different.
Deriving Knowledge from Data at Scale
.
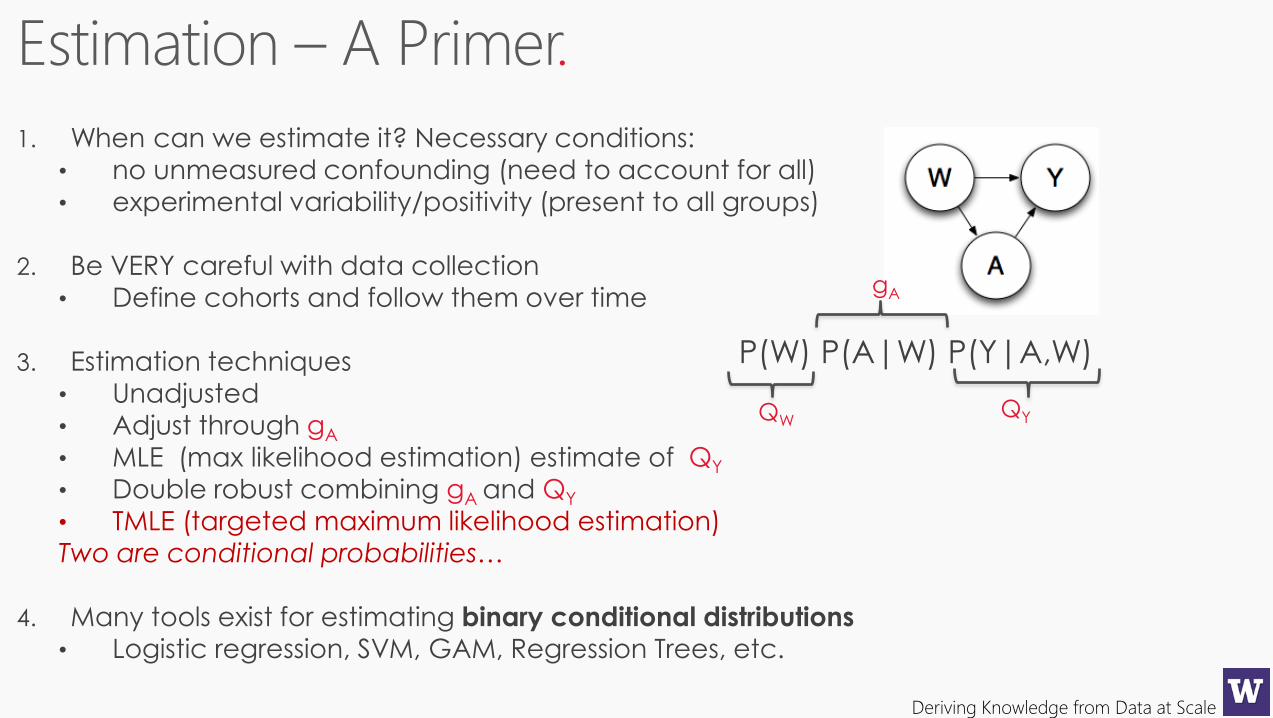
1. When can we estimate it? Necessary conditions:
• no unmeasured confounding (need to account for all)
• experimental variability/positivity (present to all groups)
2. Be VERY careful with data collection
• Define cohorts and follow them over time
3. Estimation techniques
• Unadjusted
• Adjust through gA
• MLE (max likelihood estimation) estimate of QY
• Double robust combining gA and QY
• TMLE (targeted maximum likelihood estimation)
Two are conditional probabilities…
4. Many tools exist for estimating binary conditional distributions
• Logistic regression, SVM, GAM, Regression Trees, etc.
P(W) P(A|W) P(Y|A,W)
QWQY
gA
Deriving Knowledge from Data at Scale
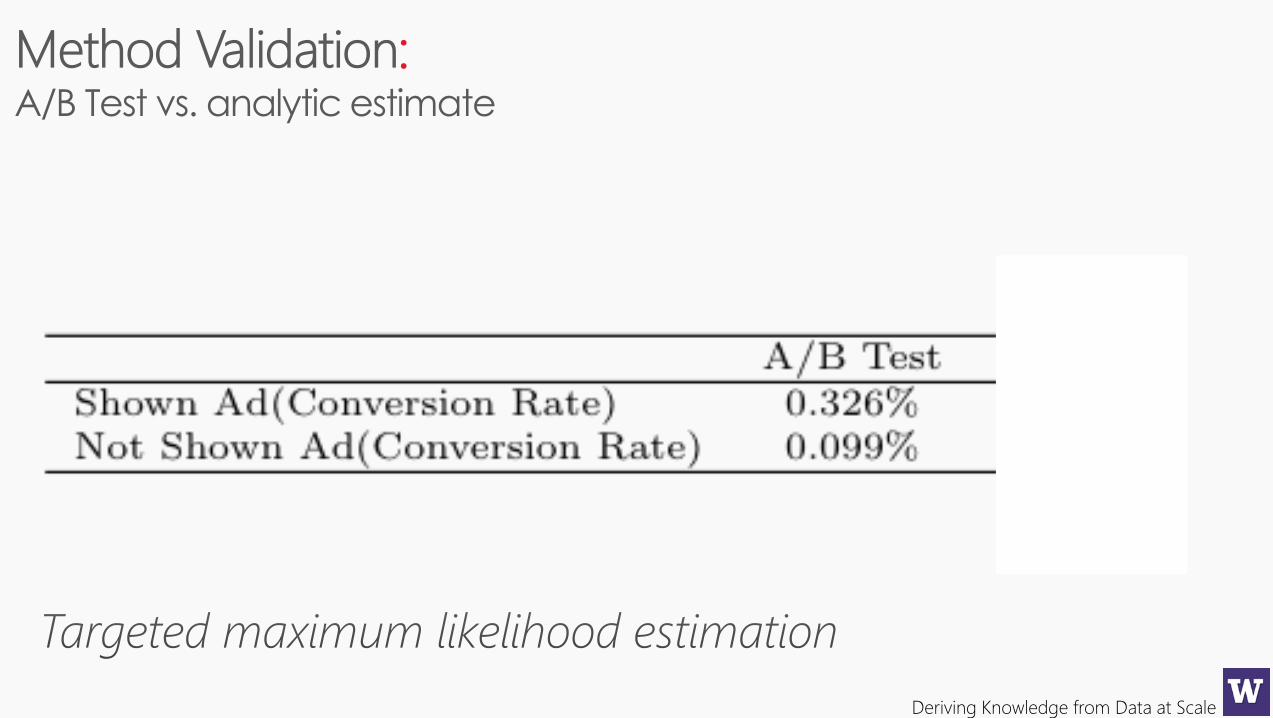
:
Deriving Knowledge from Data at Scale
That’s all for tonight….
Recommended