Embed Size (px)
Citation preview
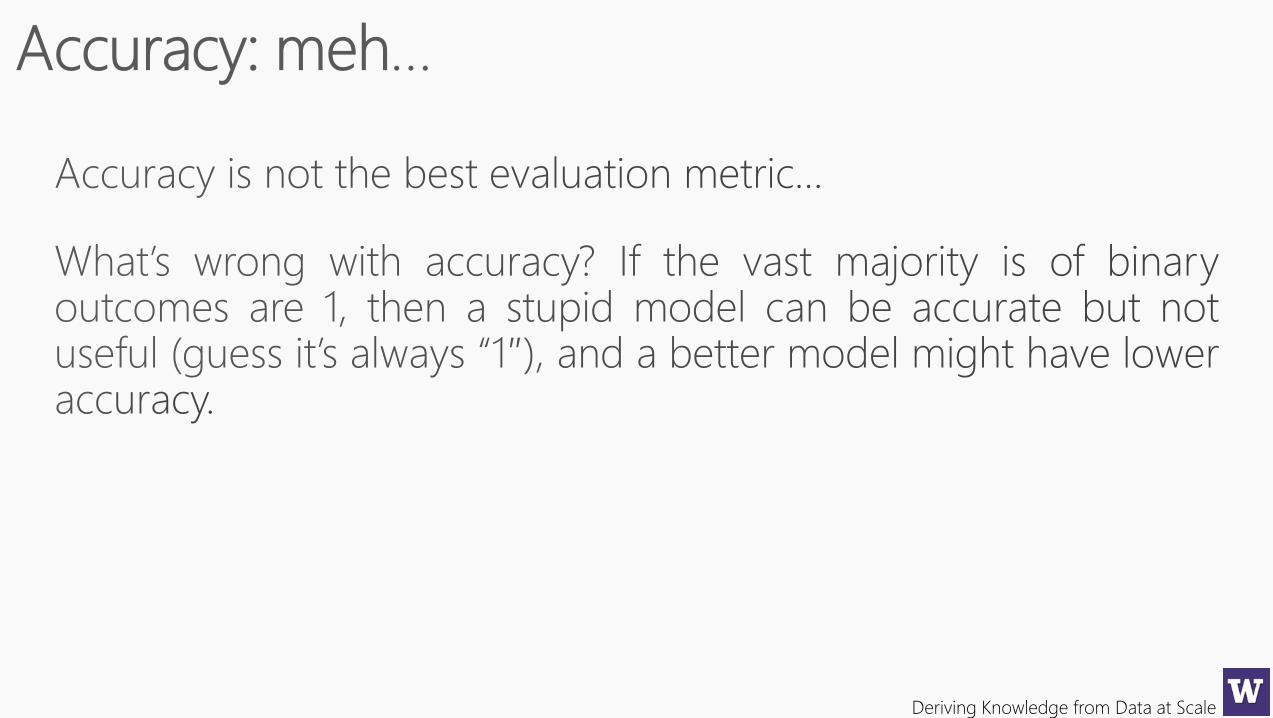
Deriving Knowledge from Data at Scale
Deriving Knowledge from Data at Scale
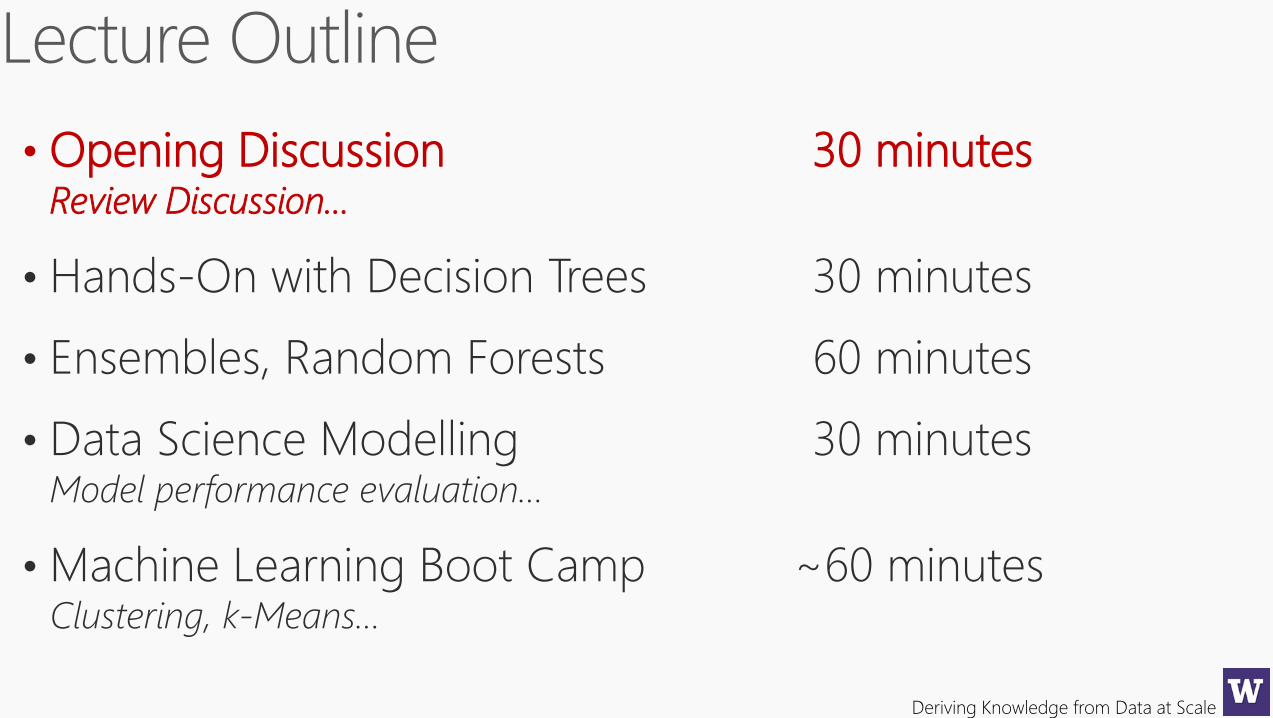
• Opening Discussion 30 minutesReview Discussion…
• Hands-On with Decision Trees 30 minutes
• Ensembles, Random Forests 60 minutes
• Data Science Modelling 30 minutesModel performance evaluation…
• Machine Learning Boot Camp ~60 minutesClustering, k-Means…
Deriving Knowledge from Data at Scale
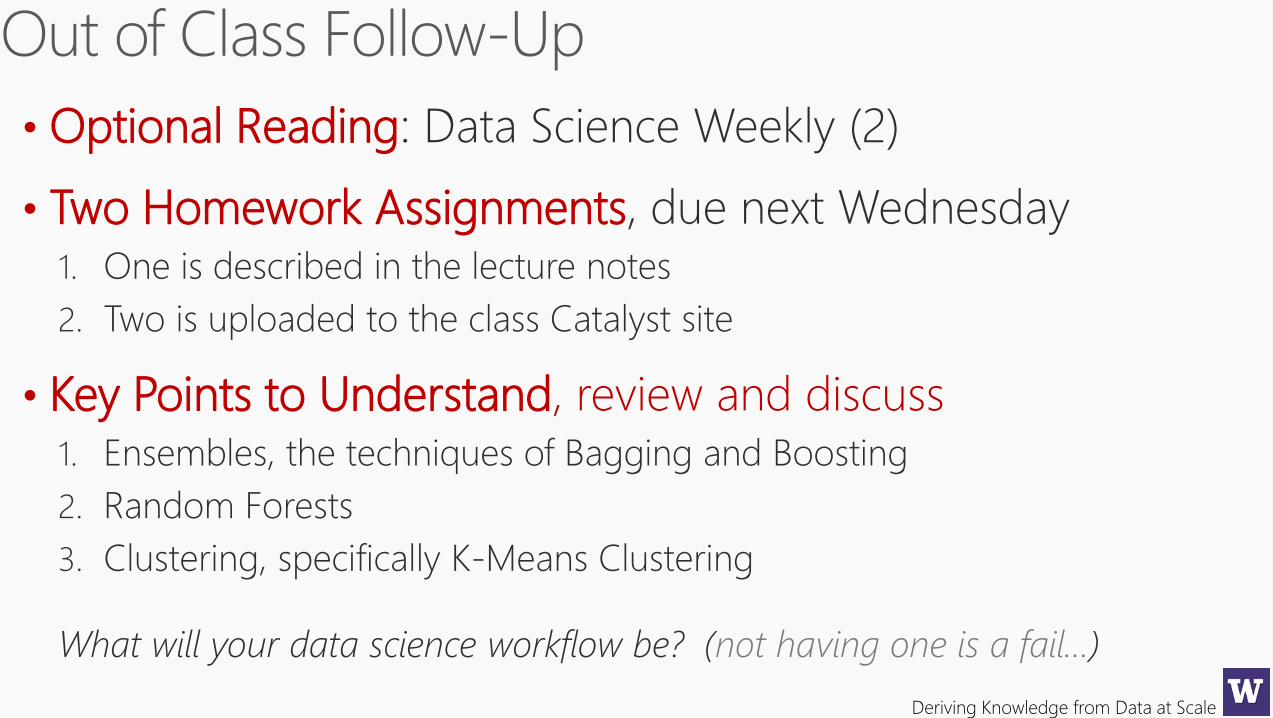
• Optional Reading: Data Science Weekly (2)
• Two Homework Assignments, due next Wednesday1. One is described in the lecture notes
2. Two is uploaded to the class Catalyst site
• Key Points to Understand, review and discuss1. Ensembles, the techniques of Bagging and Boosting
2. Random Forests
3. Clustering, specifically K-Means Clustering
What will your data science workflow be? (not having one is a fail…)
Deriving Knowledge from Data at Scale
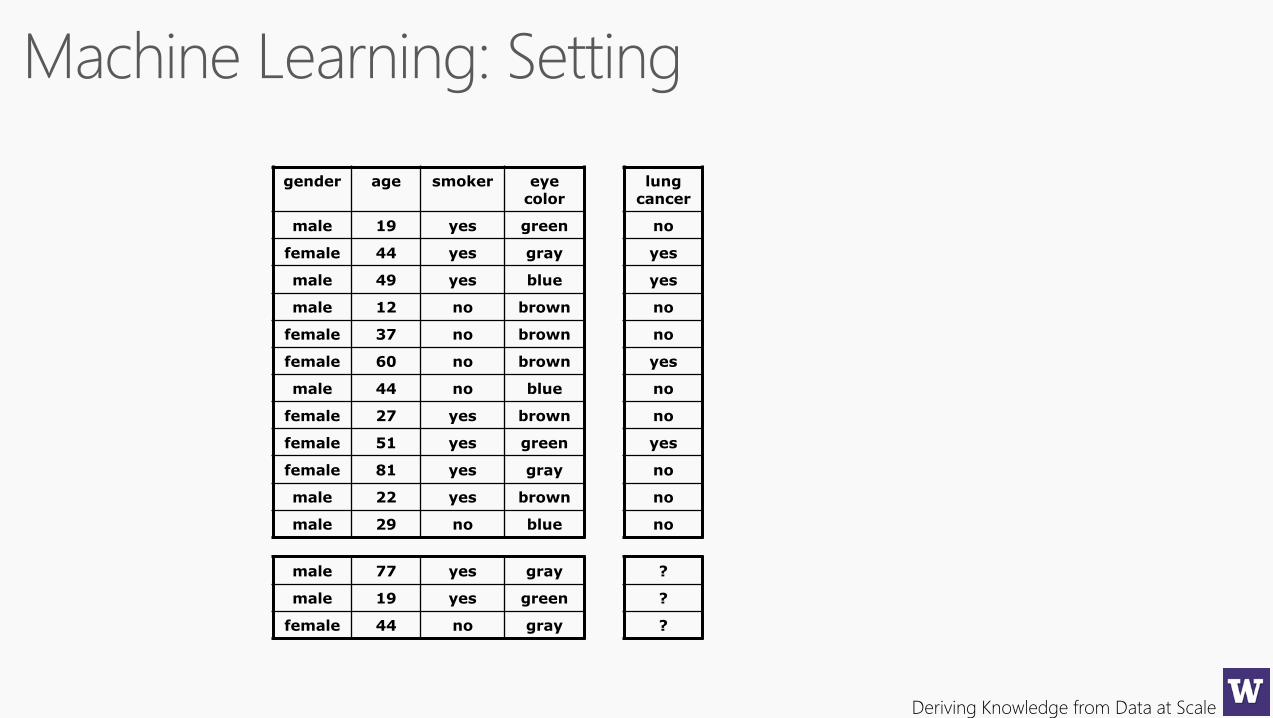
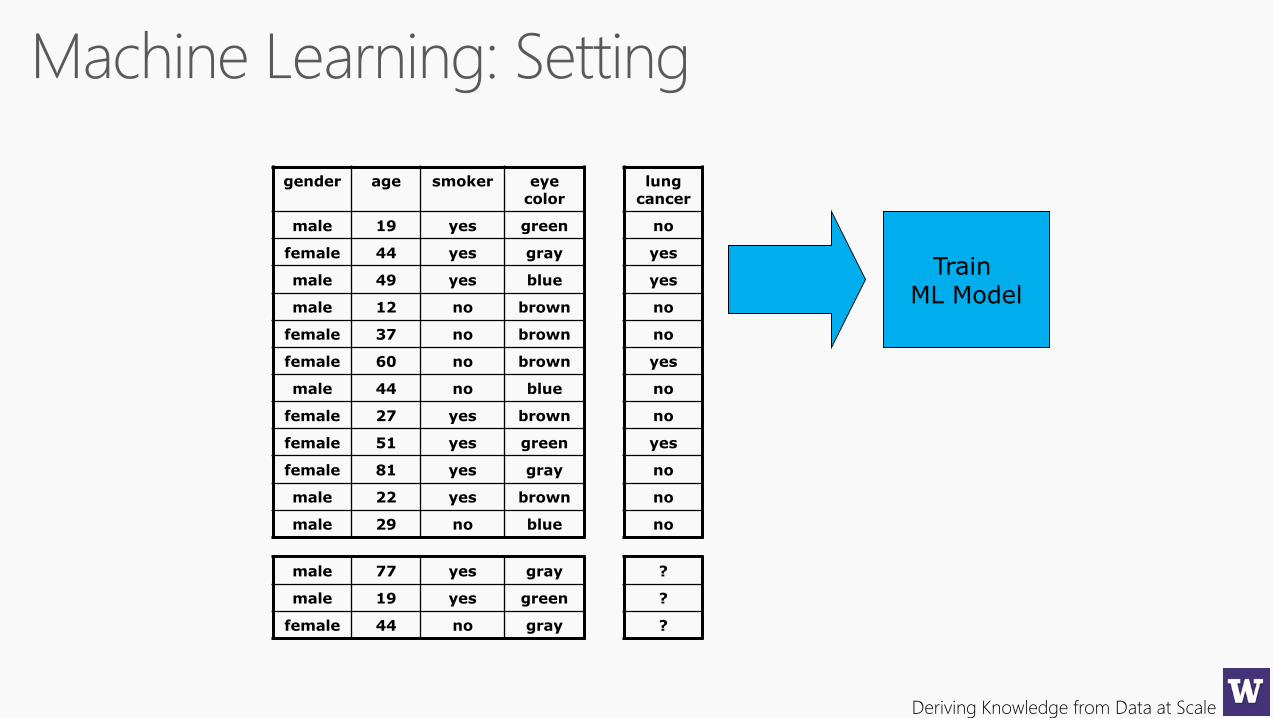
gender age smoker eye color
male 19 yes green
female 44 yes gray
male 49 yes blue
male 12 no brown
female 37 no brown
female 60 no brown
male 44 no blue
female 27 yes brown
female 51 yes green
female 81 yes gray
male 22 yes brown
male 29 no blue
lung cancer
no
yes
yes
no
no
yes
no
no
yes
no
no
no
male 77 yes gray
male 19 yes green
female 44 no gray
?
?
?
Deriving Knowledge from Data at Scale
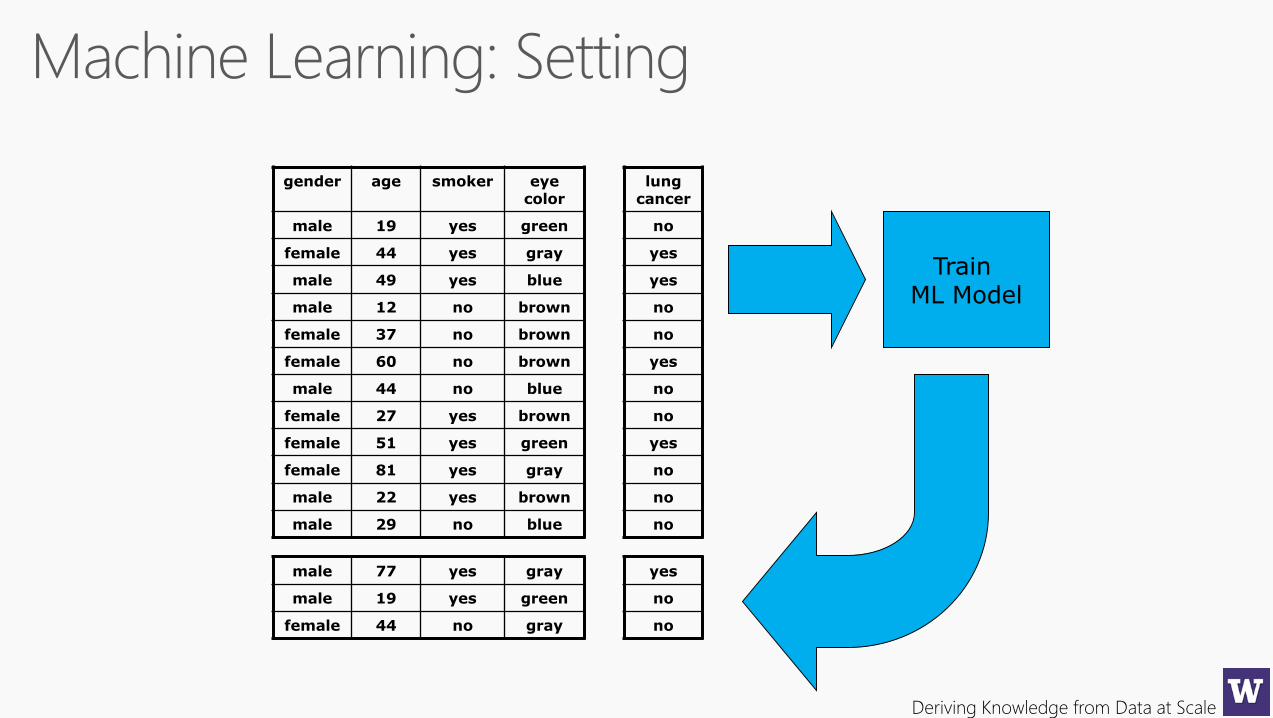
gender age smoker eye color
male 19 yes green
female 44 yes gray
male 49 yes blue
male 12 no brown
female 37 no brown
female 60 no brown
male 44 no blue
female 27 yes brown
female 51 yes green
female 81 yes gray
male 22 yes brown
male 29 no blue
lung cancer
no
yes
yes
no
no
yes
no
no
yes
no
no
no
male 77 yes gray
male 19 yes green
female 44 no gray
?
?
?
Train ML Model
Deriving Knowledge from Data at Scale
gender age smoker eye color
male 19 yes green
female 44 yes gray
male 49 yes blue
male 12 no brown
female 37 no brown
female 60 no brown
male 44 no blue
female 27 yes brown
female 51 yes green
female 81 yes gray
male 22 yes brown
male 29 no blue
lung cancer
no
yes
yes
no
no
yes
no
no
yes
no
no
no
male 77 yes gray
male 19 yes green
female 44 no gray
yes
no
no
Train ML Model
Deriving Knowledge from Data at Scale
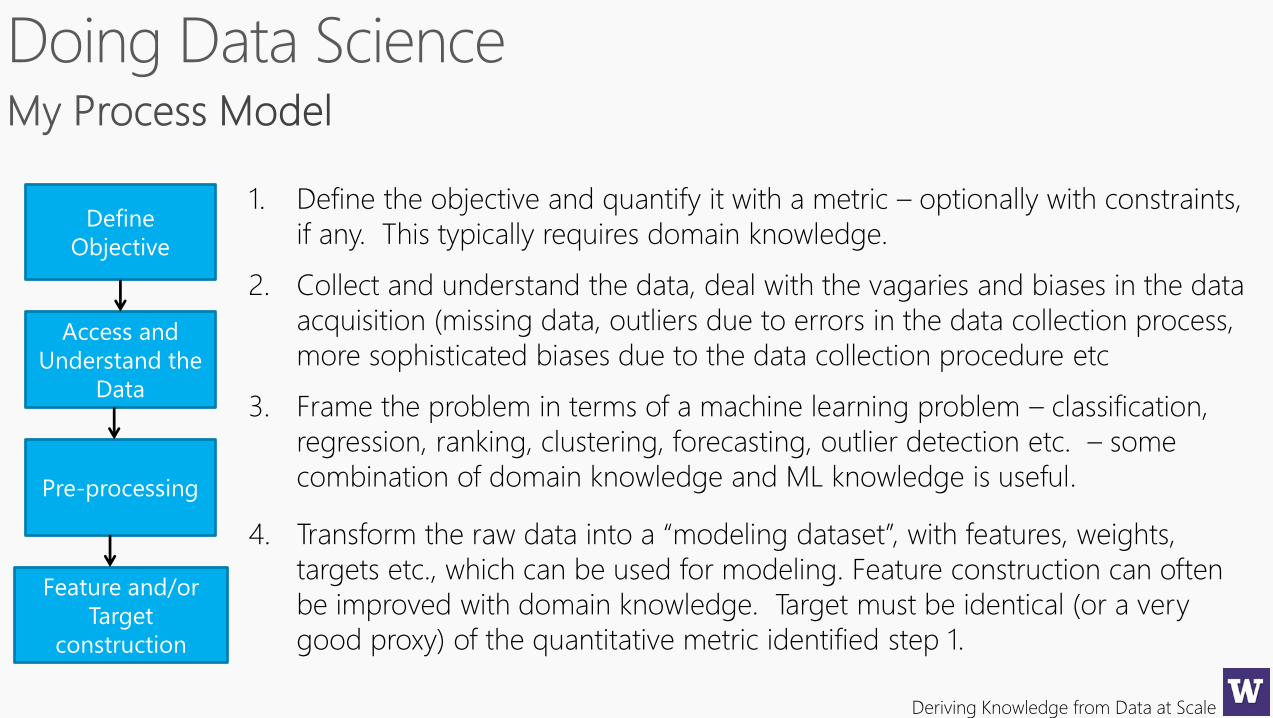
Define
Objective
Access and
Understand the
Data
Pre-processing
Feature and/or
Target
construction
1. Define the objective and quantify it with a metric – optionally with constraints,
if any. This typically requires domain knowledge.
2. Collect and understand the data, deal with the vagaries and biases in the data
acquisition (missing data, outliers due to errors in the data collection process,
more sophisticated biases due to the data collection procedure etc
3. Frame the problem in terms of a machine learning problem – classification,
regression, ranking, clustering, forecasting, outlier detection etc. – some
combination of domain knowledge and ML knowledge is useful.
4. Transform the raw data into a “modeling dataset”, with features, weights,
targets etc., which can be used for modeling. Feature construction can often
be improved with domain knowledge. Target must be identical (or a very
good proxy) of the quantitative metric identified step 1.
Deriving Knowledge from Data at Scale
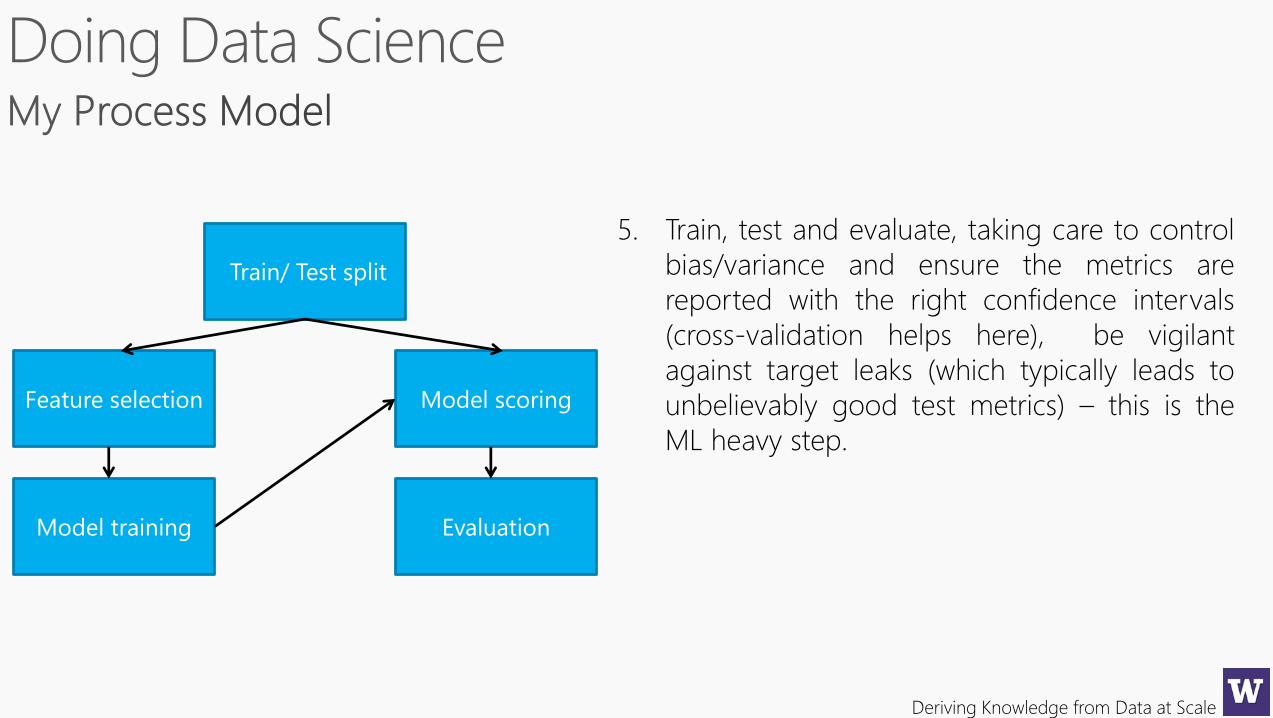
Feature selection
Model training
Model scoring
Evaluation
Train/ Test split
5. Train, test and evaluate, taking care to control
bias/variance and ensure the metrics are
reported with the right confidence intervals
(cross-validation helps here), be vigilant
against target leaks (which typically leads to
unbelievably good test metrics) – this is the
ML heavy step.
Deriving Knowledge from Data at Scale
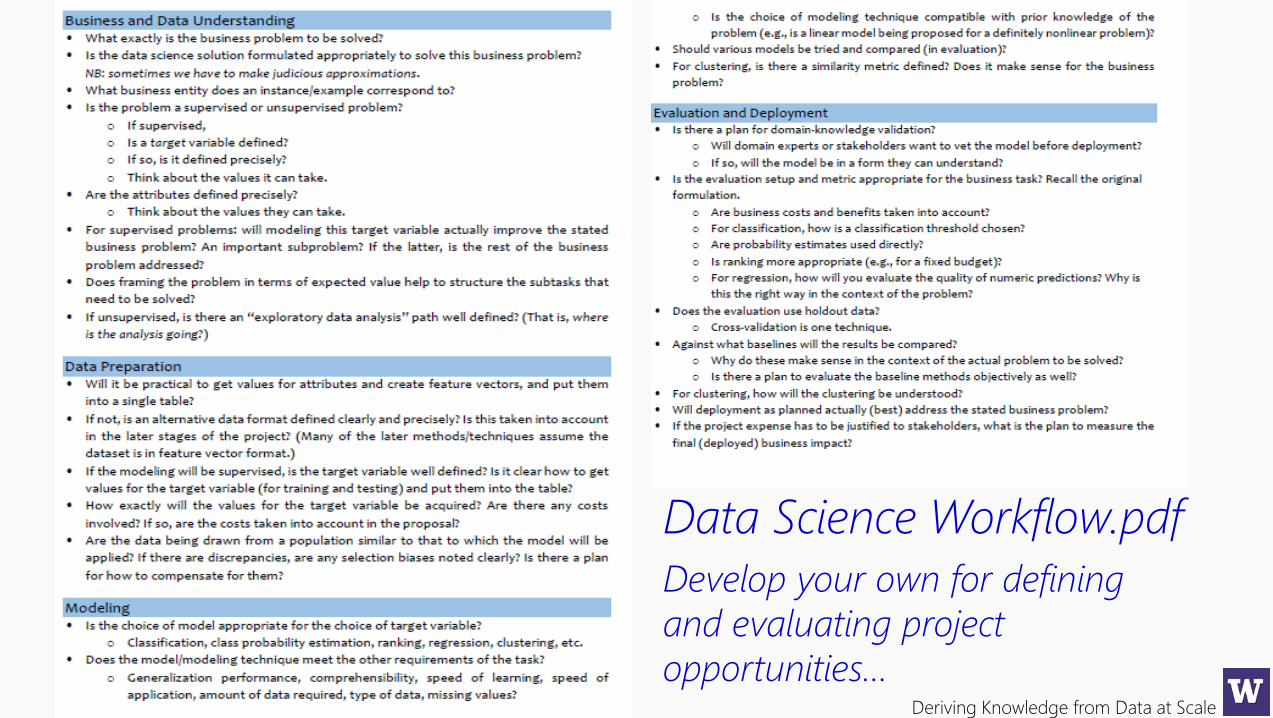
Data Science Workflow.pdf
Develop your own for defining
and evaluating project
opportunities…
Deriving Knowledge from Data at Scale
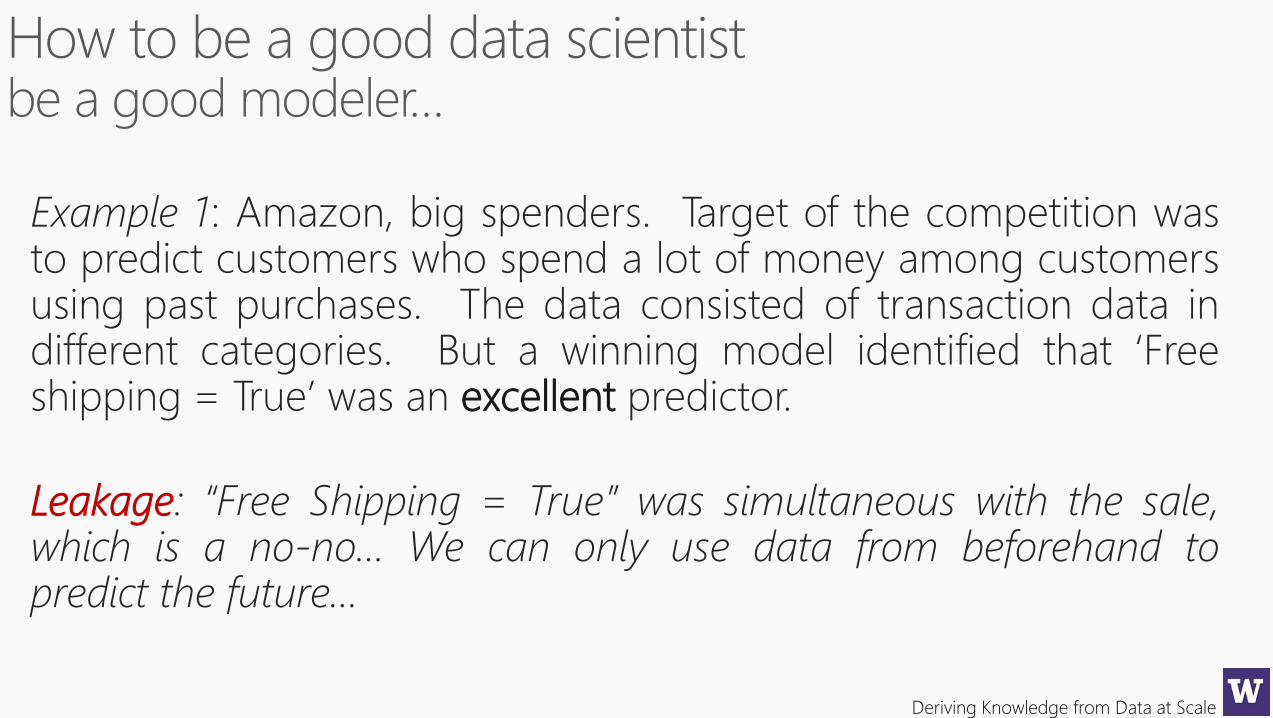
Example 1: Amazon, big spenders. Target of the competition wasto predict customers who spend a lot of money among customersusing past purchases. The data consisted of transaction data indifferent categories. But a winning model identified that ‘Freeshipping = True’ was an excellent predictor.
Leakage: “Free Shipping = True” was simultaneous with the sale,which is a no-no… We can only use data from beforehand topredict the future…
Deriving Knowledge from Data at Scale
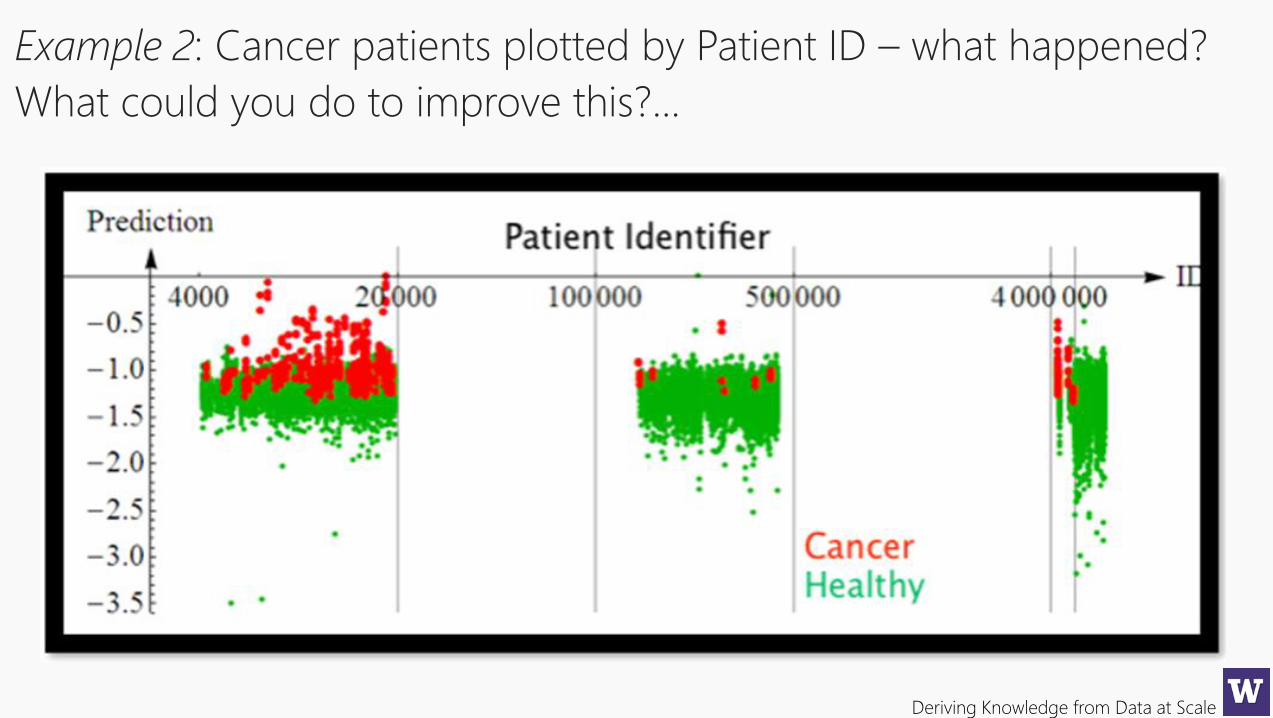
Example 2: Cancer patients plotted by Patient ID – what happened?
What could you do to improve this?...
Deriving Knowledge from Data at Scale
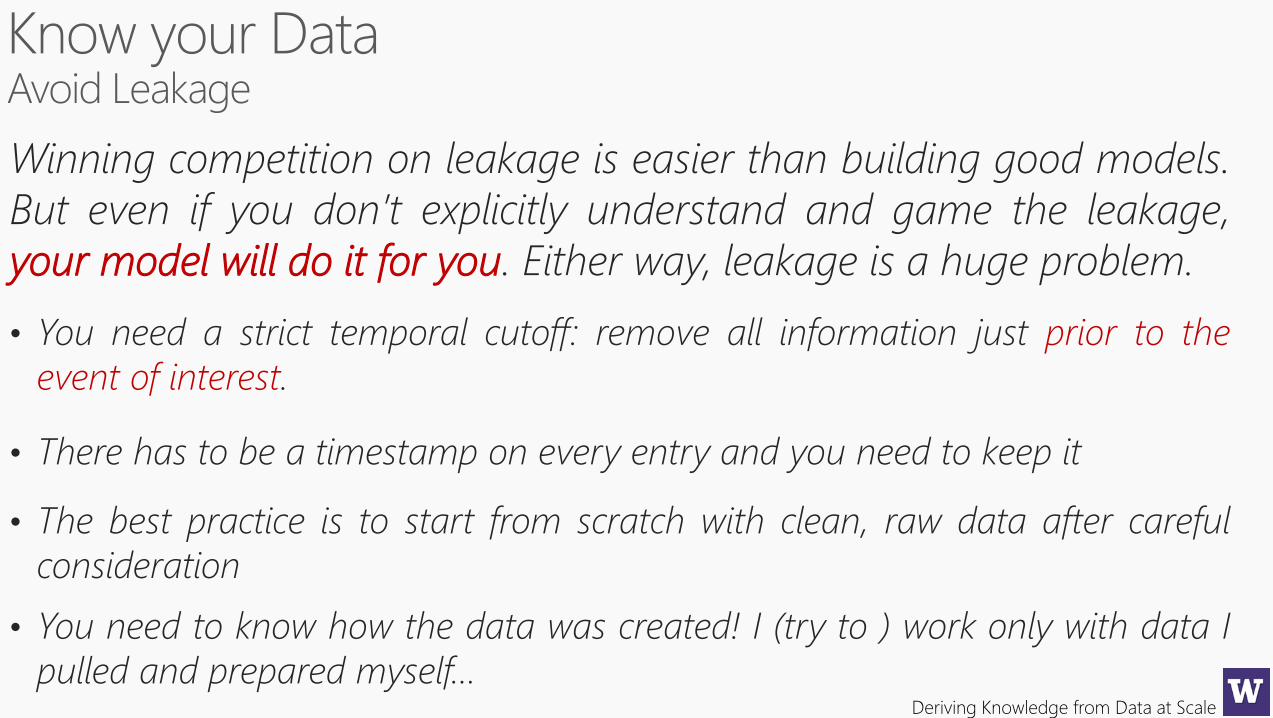
Winning competition on leakage is easier than building good models.
But even if you don’t explicitly understand and game the leakage,
your model will do it for you. Either way, leakage is a huge problem.
• You need a strict temporal cutoff: remove all information just prior to the
event of interest.
• There has to be a timestamp on every entry and you need to keep it
• The best practice is to start from scratch with clean, raw data after careful
consideration
• You need to know how the data was created! I (try to ) work only with data I
pulled and prepared myself…
Deriving Knowledge from Data at Scale
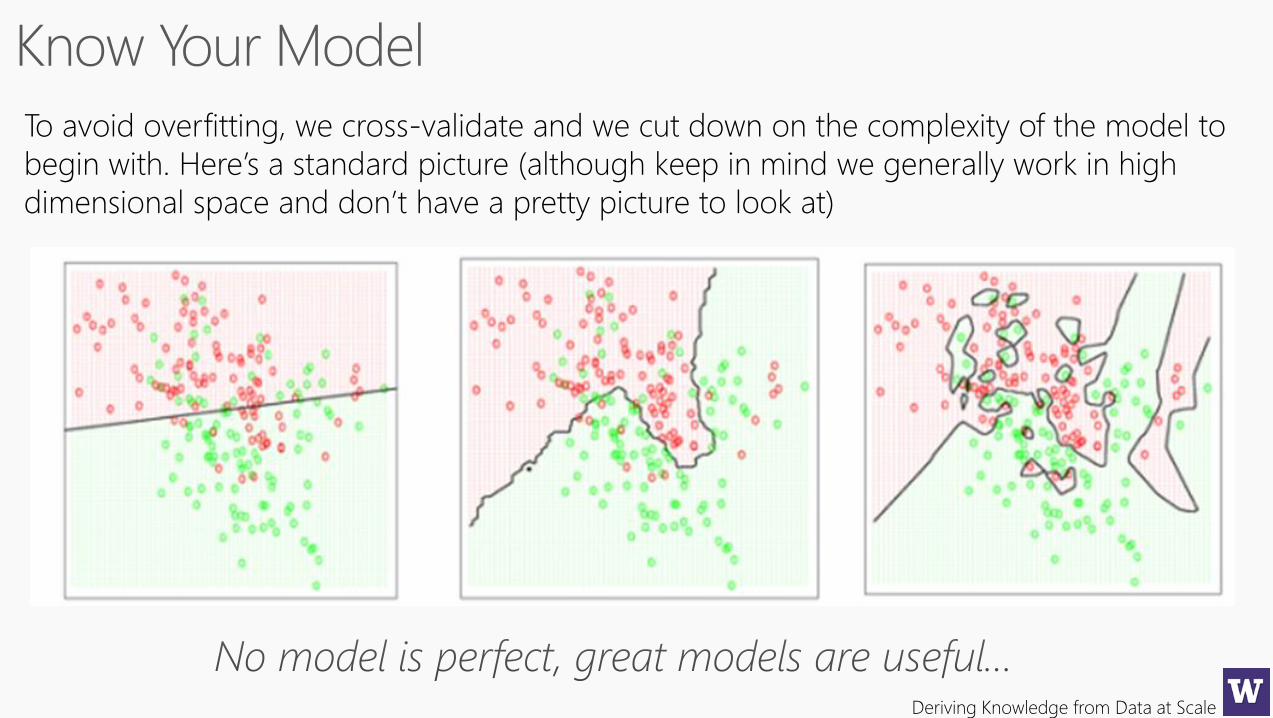
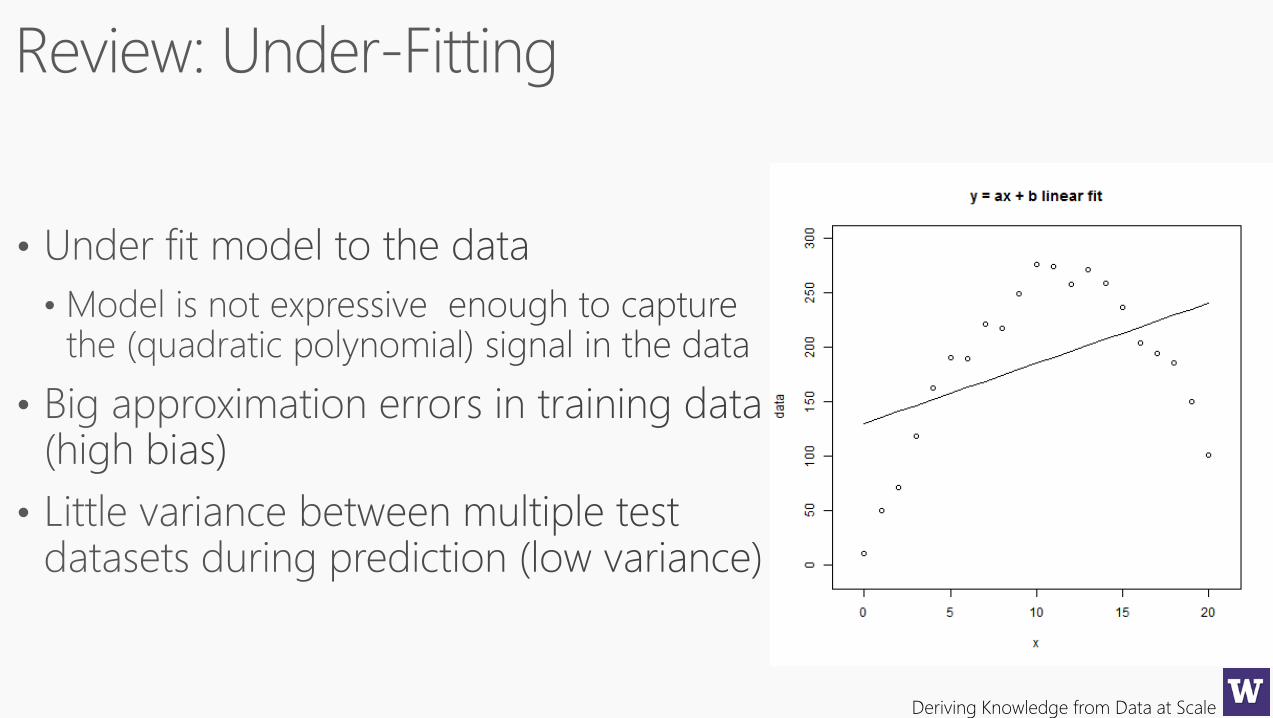
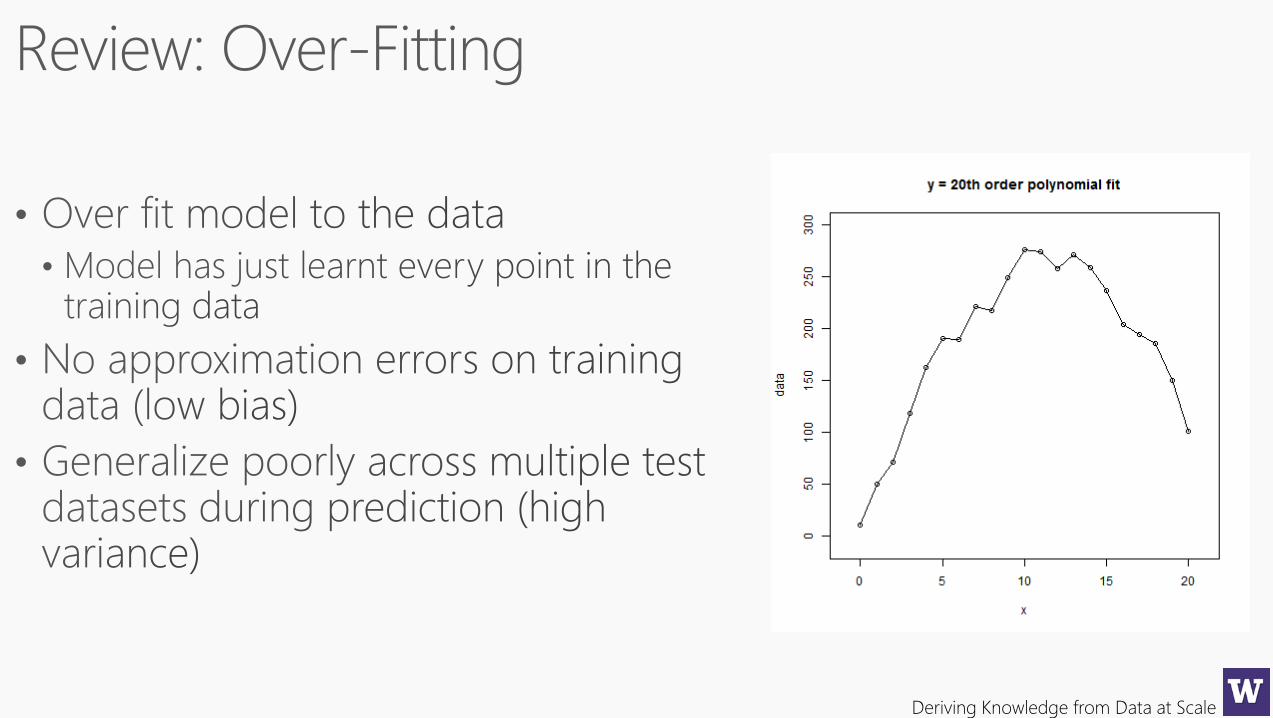
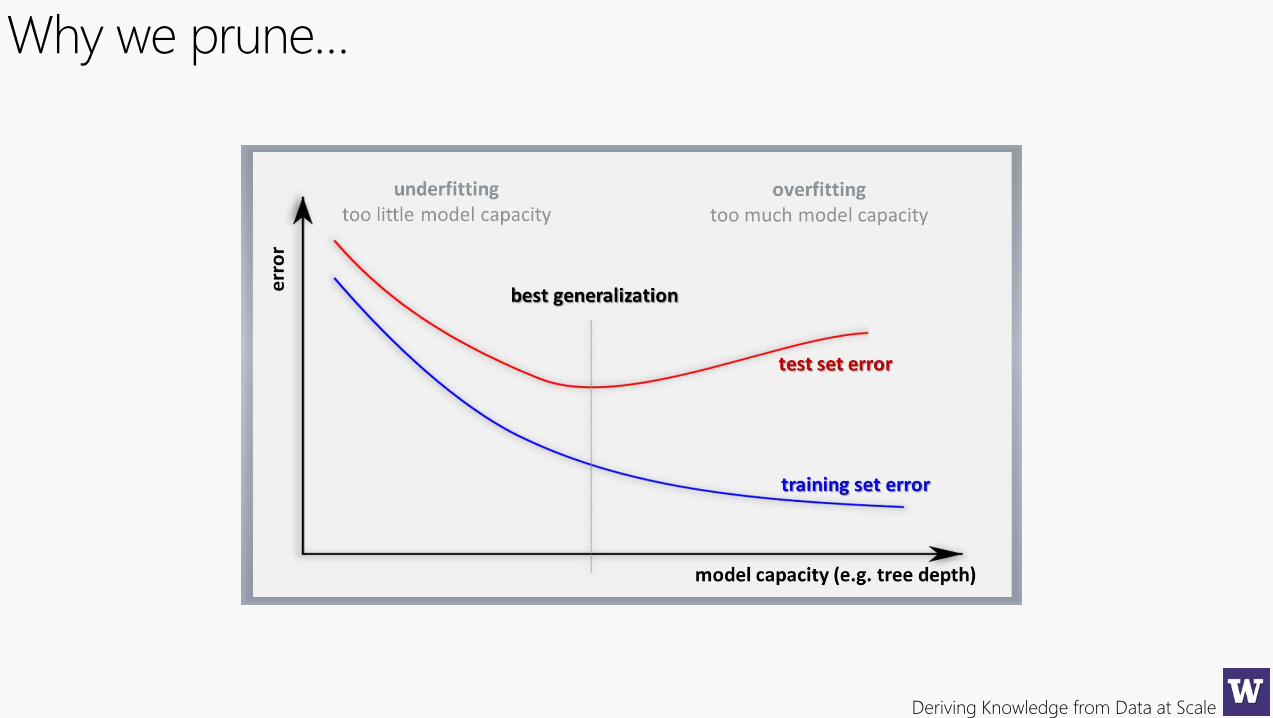
To avoid overfitting, we cross-validate and we cut down on the complexity of the model to
begin with. Here’s a standard picture (although keep in mind we generally work in high
dimensional space and don’t have a pretty picture to look at)
Deriving Knowledge from Data at Scale
Deriving Knowledge from Data at Scale
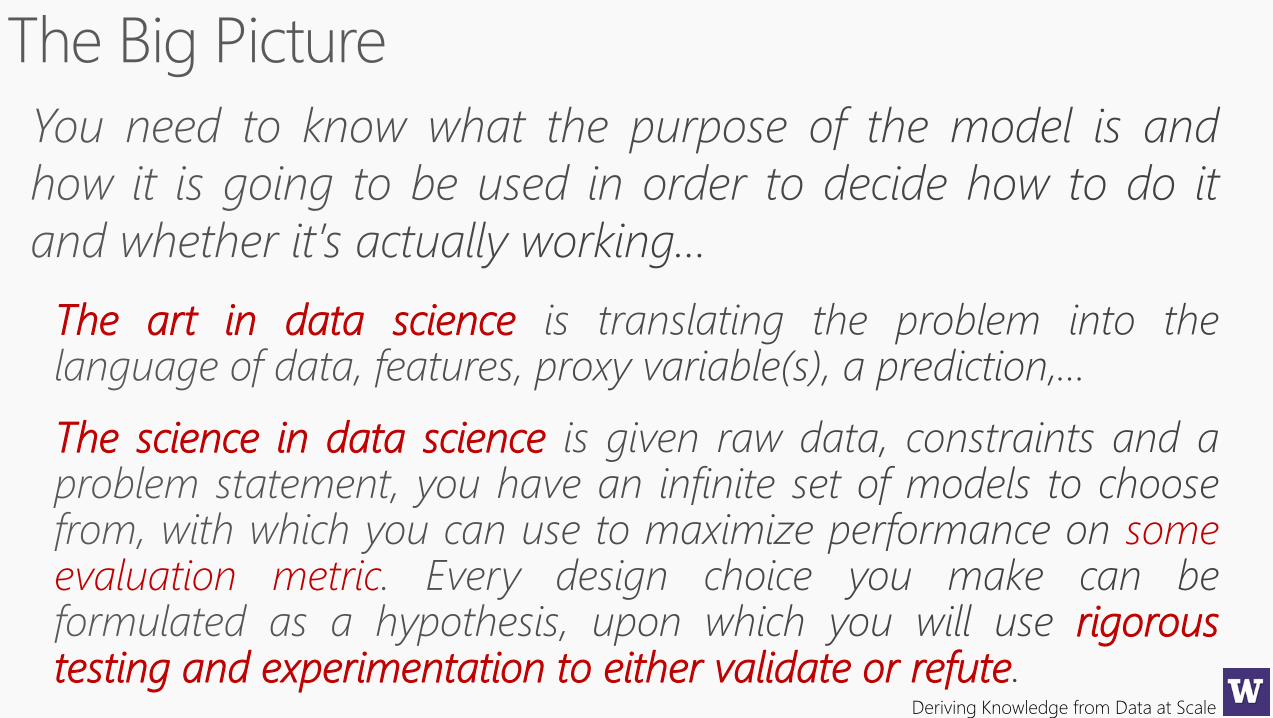
The art in data science
The science in data science
someevaluation metric
rigoroustesting and experimentation to either validate or refute
Deriving Knowledge from Data at Scale
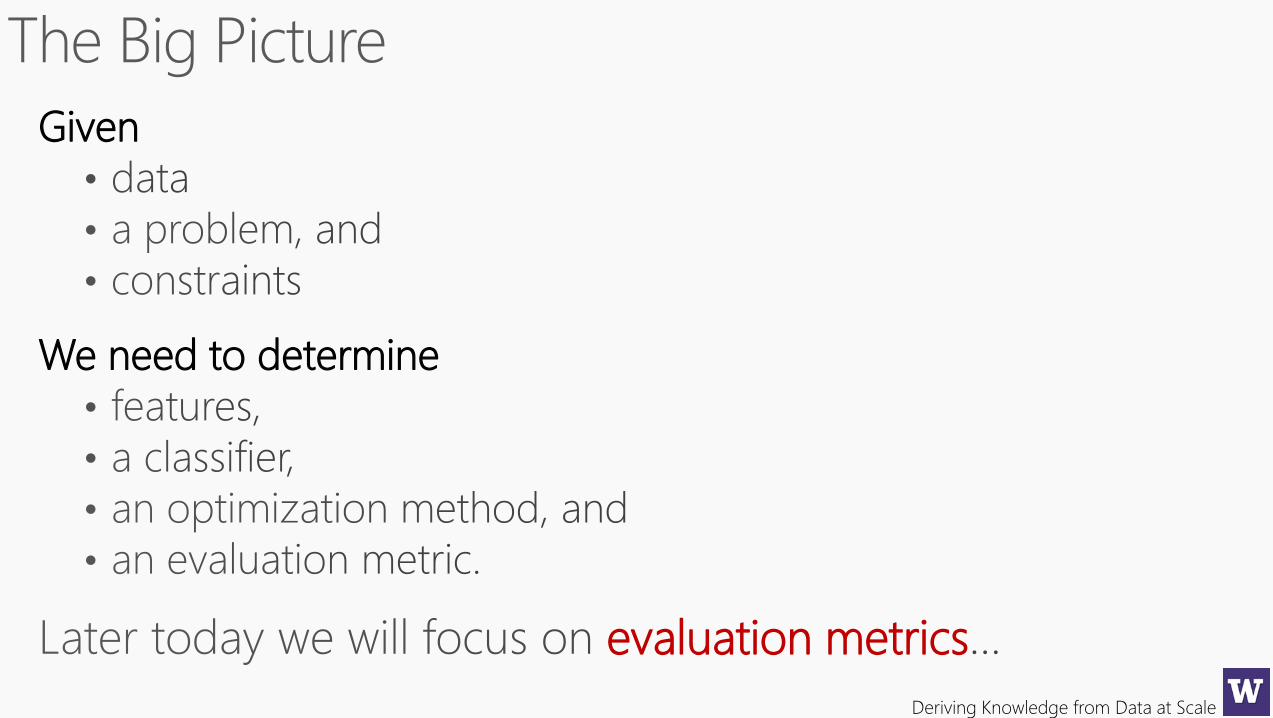
Given
We need to determine
evaluation metrics
Deriving Knowledge from Data at Scale
Deriving Knowledge from Data at Scale
Deriving Knowledge from Data at Scale
Deriving Knowledge from Data at Scale
Deriving Knowledge from Data at Scale
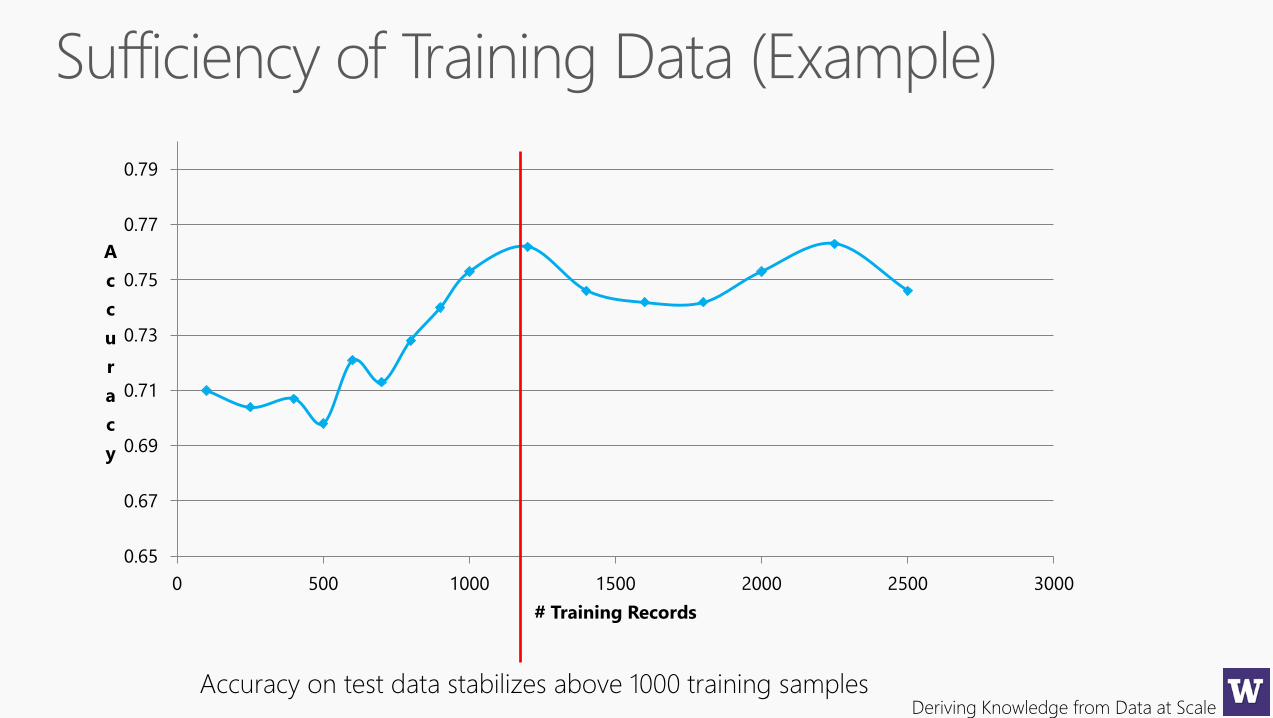
0.65
0.67
0.69
0.71
0.73
0.75
0.77
0.79
0 500 1000 1500 2000 2500 3000
A
c
c
u
r
a
c
y
# Training Records
Accuracy on test data stabilizes above 1000 training samples
Deriving Knowledge from Data at Scale
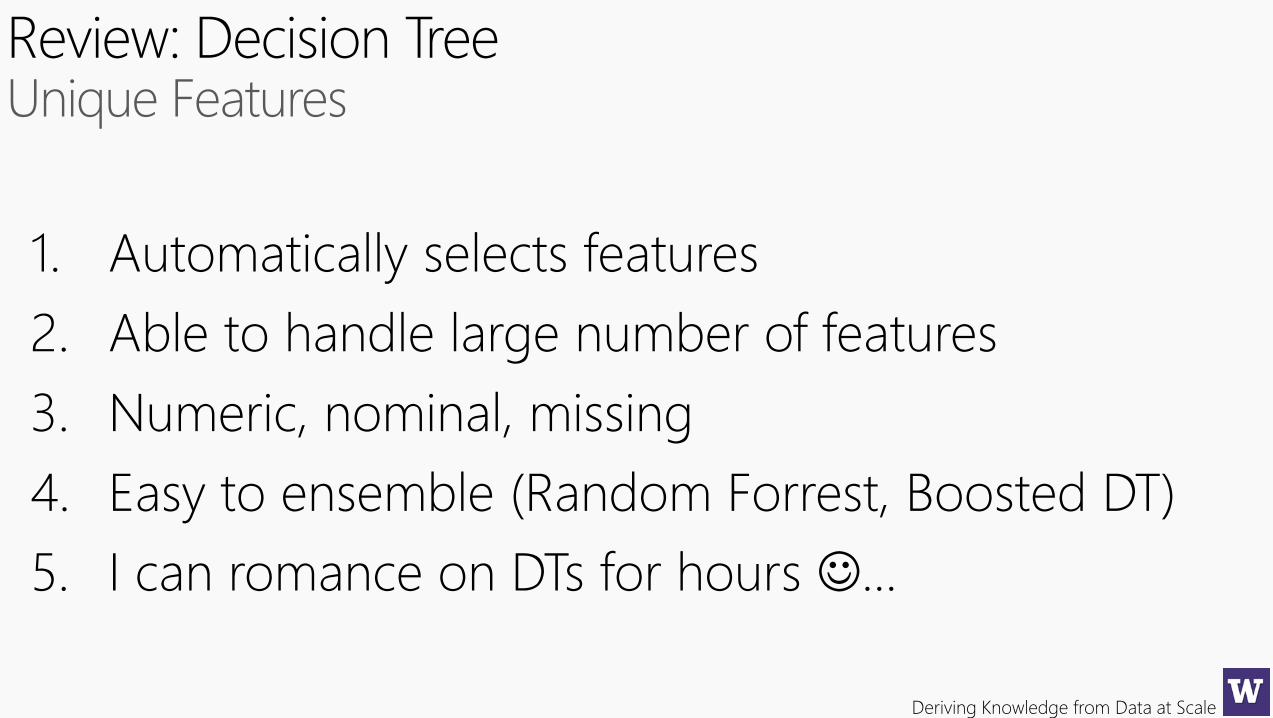
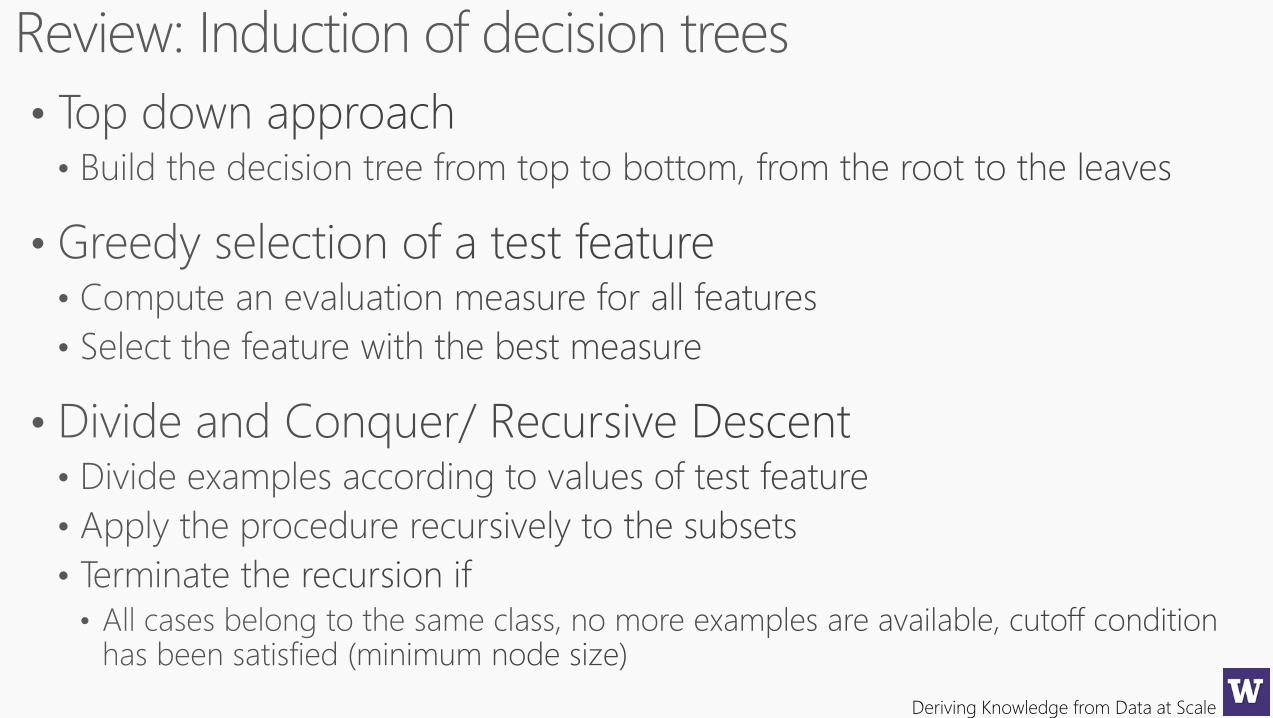
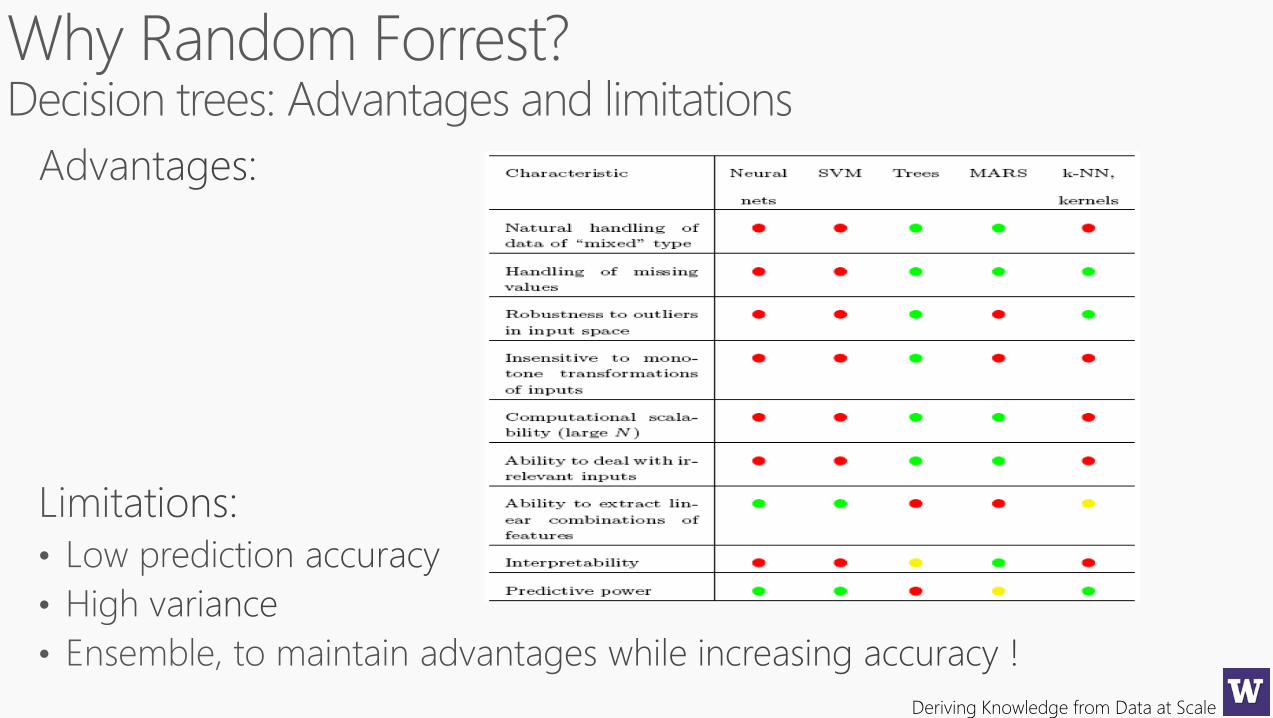
Review: Decision Tree
1. Automatically selects features
2. Able to handle large number of features
3. Numeric, nominal, missing
4. Easy to ensemble (Random Forrest, Boosted DT)
5. I can romance on DTs for hours …
Deriving Knowledge from Data at Scale
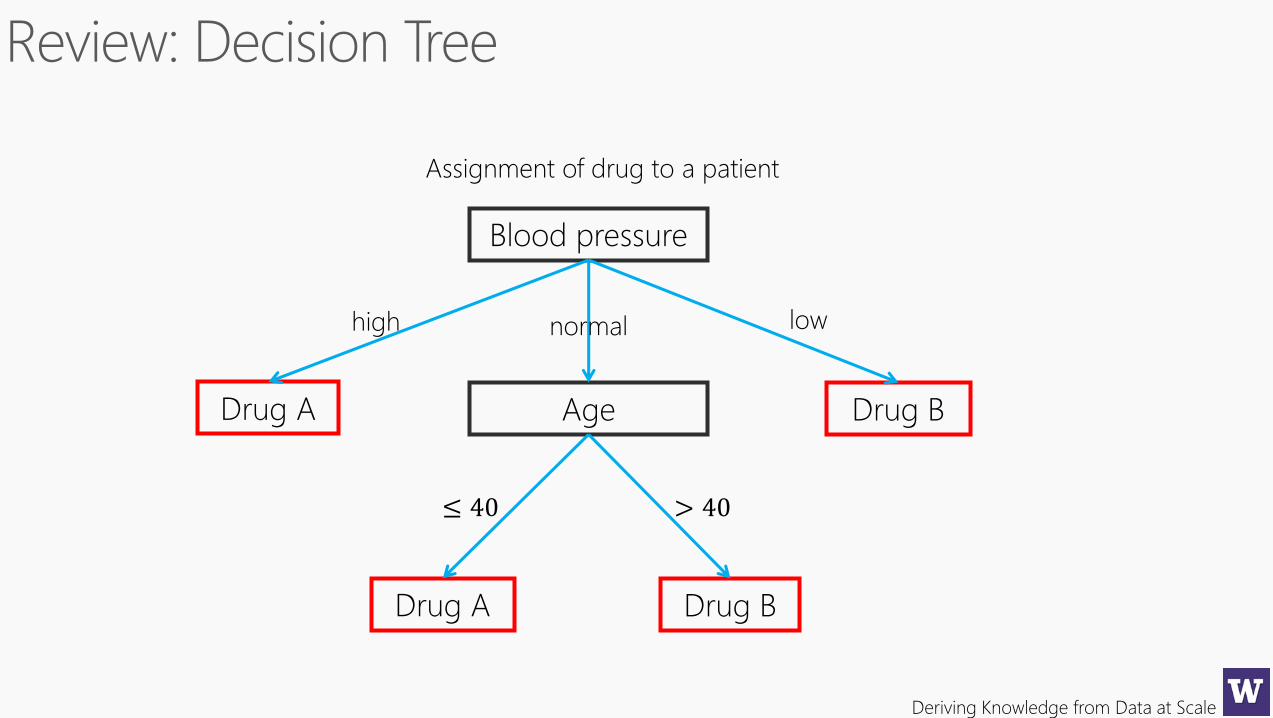
Blood pressure
Drug A Age
Drug A
Drug B
Drug B
high normal low
≤ 40 > 40
Assignment of drug to a patient
Deriving Knowledge from Data at Scale
Deriving Knowledge from Data at Scale
Deriving Knowledge from Data at Scale
Deriving Knowledge from Data at Scale
Deriving Knowledge from Data at Scale
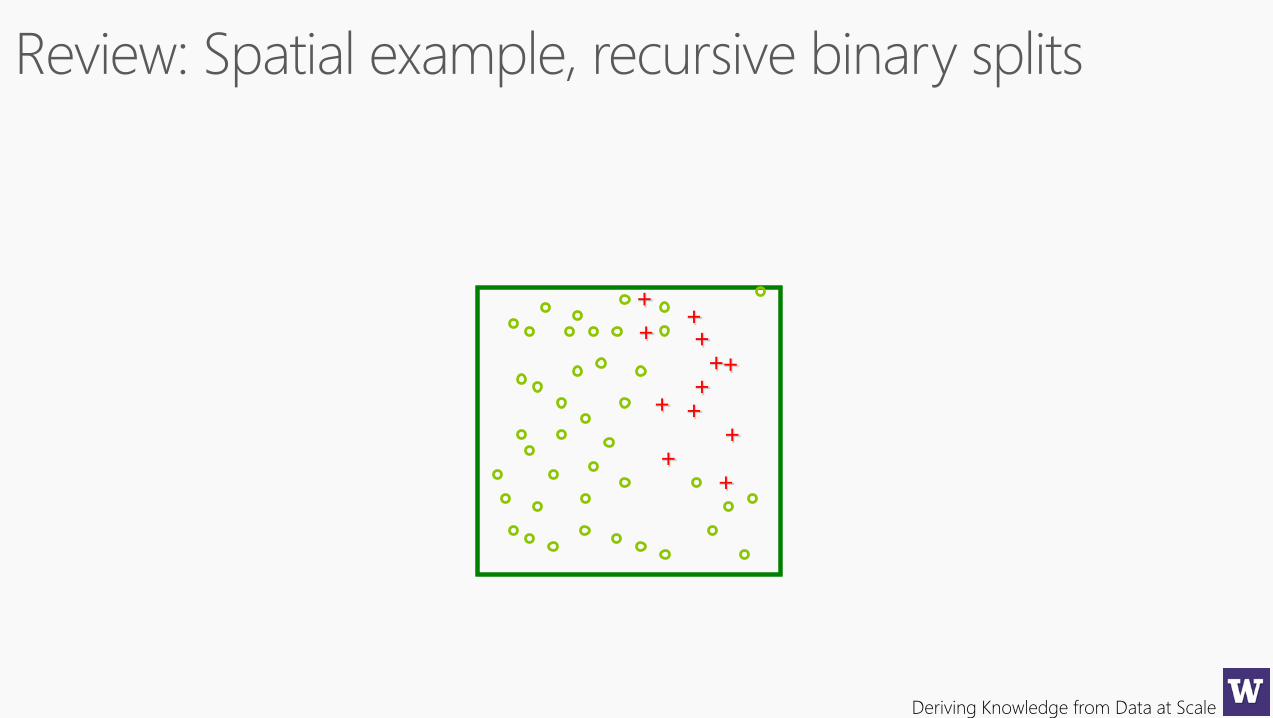
++++
++
+
+
+
+
+
+
Deriving Knowledge from Data at Scale
++++
++
+
+
+
+
+
+
Deriving Knowledge from Data at Scale
++++
++
+
+
+
+
+
+
Deriving Knowledge from Data at Scale
++++
++
+
+
+
+
+
+
Deriving Knowledge from Data at Scale
++++
++
+
+
+
+
+
+
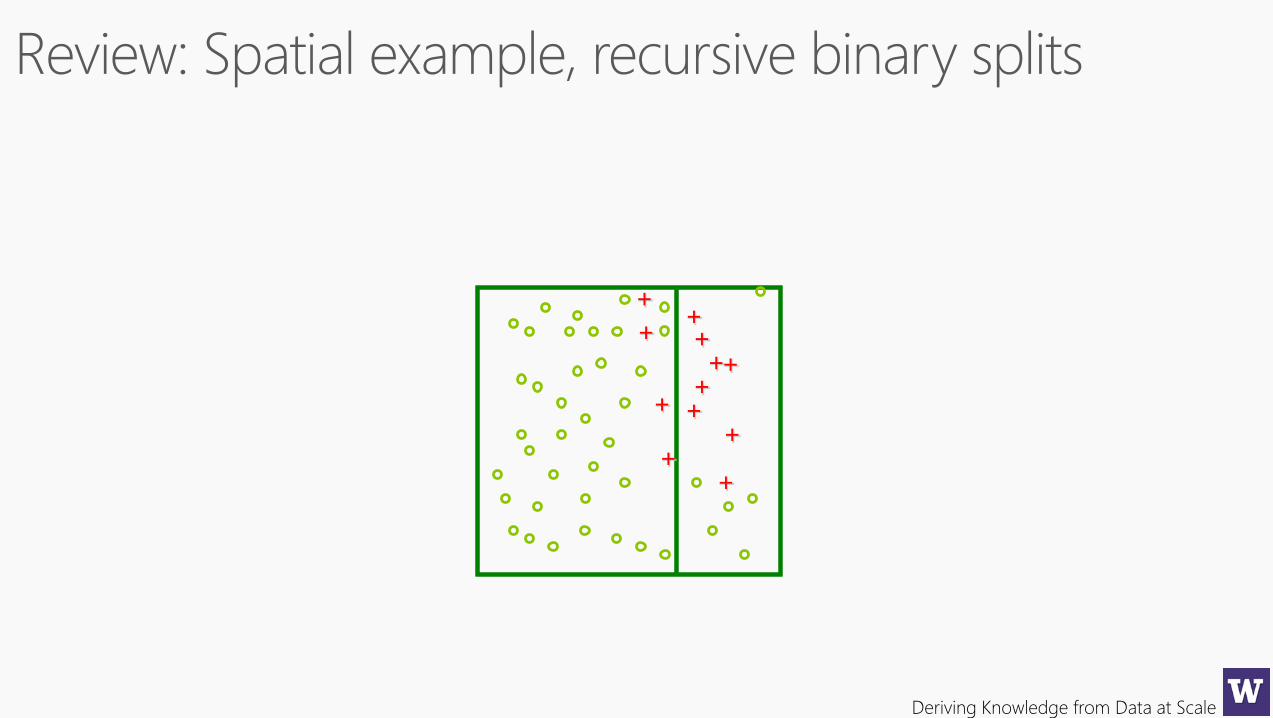
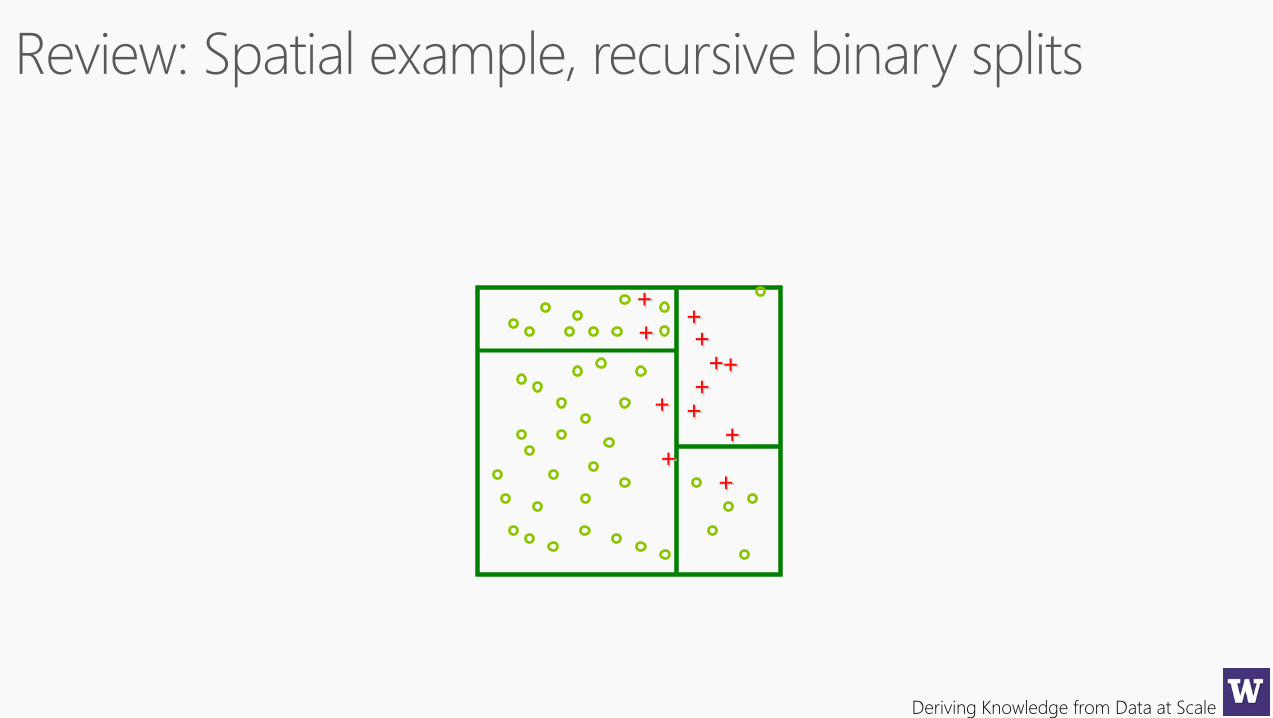
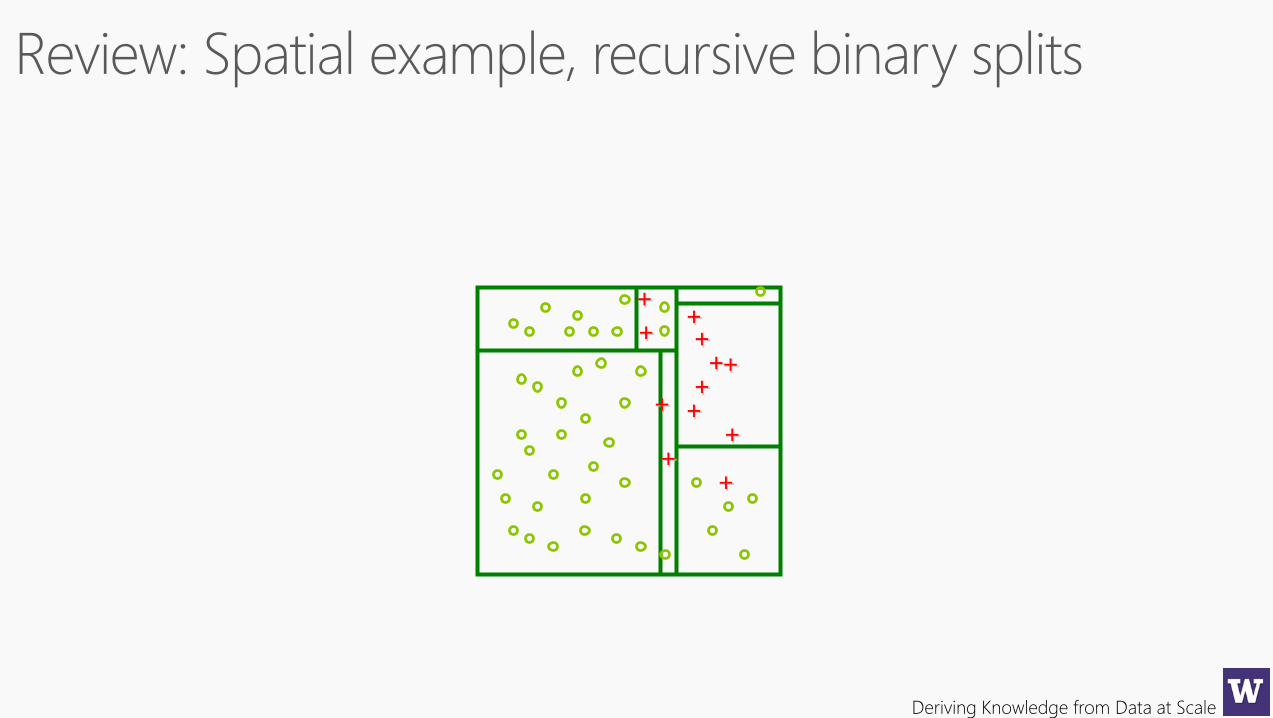
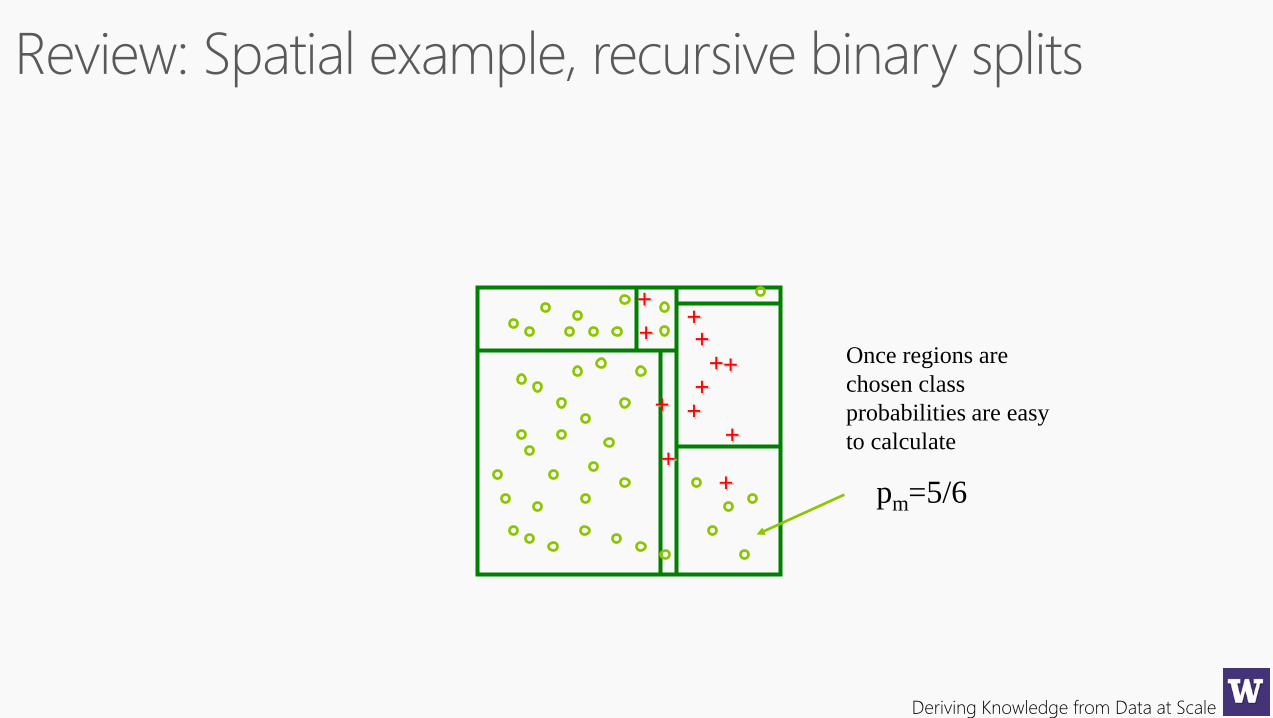
pm=5/6
Once regions are
chosen class
probabilities are easy
to calculate
Deriving Knowledge from Data at Scale
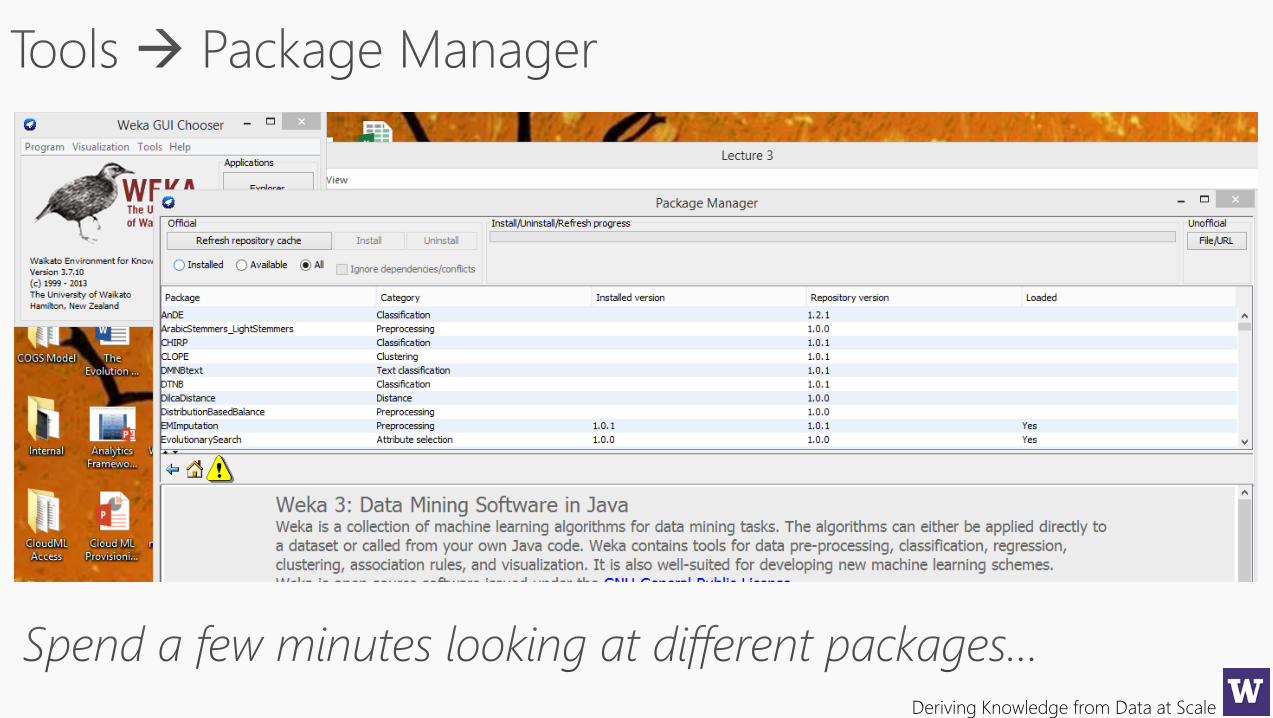
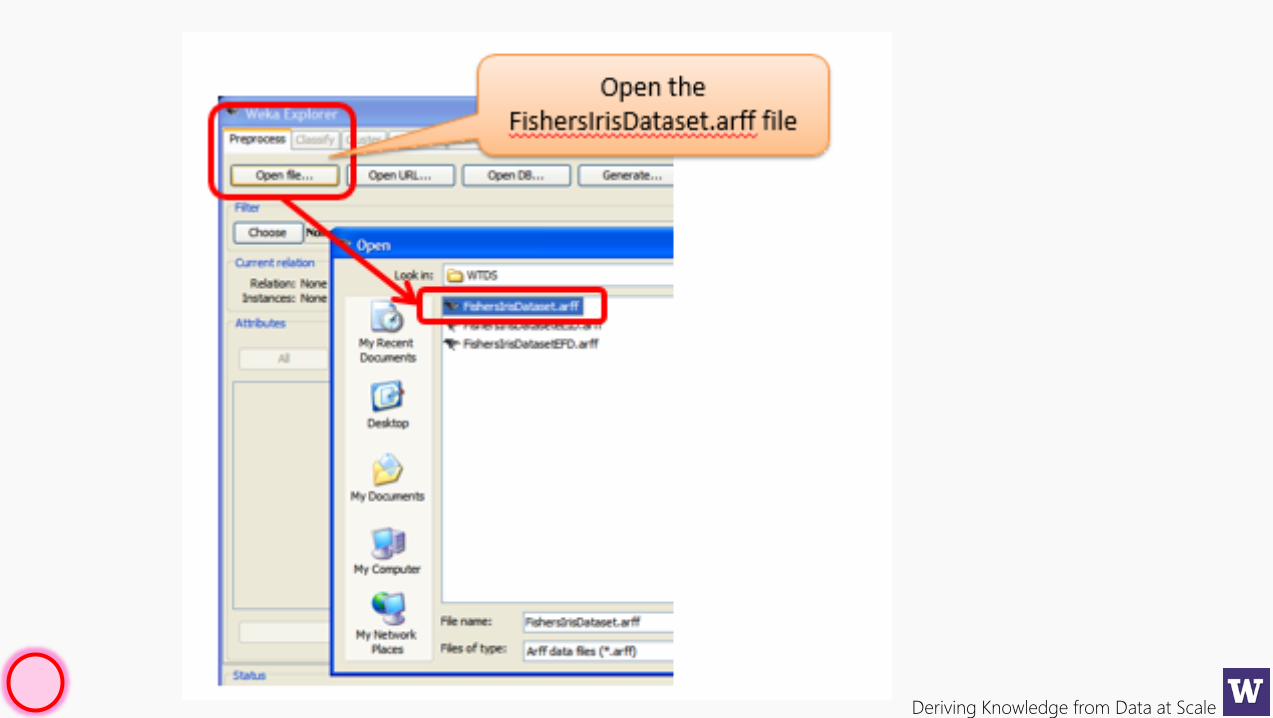
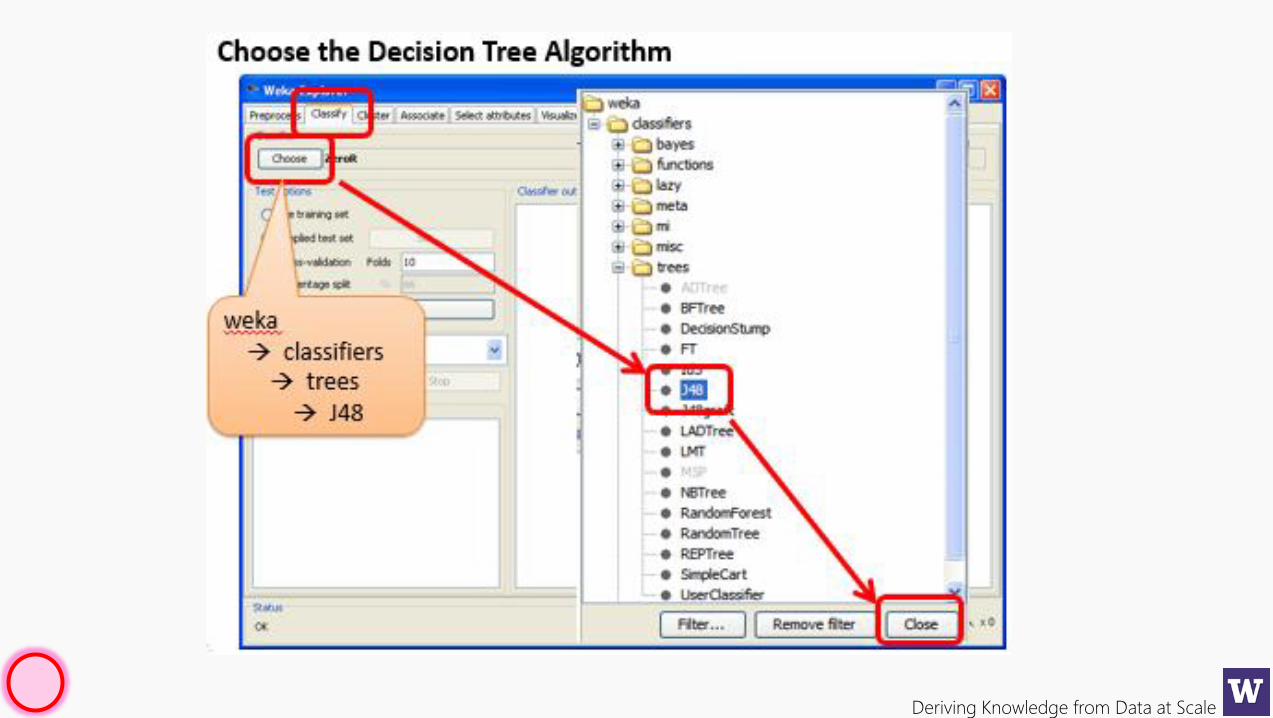
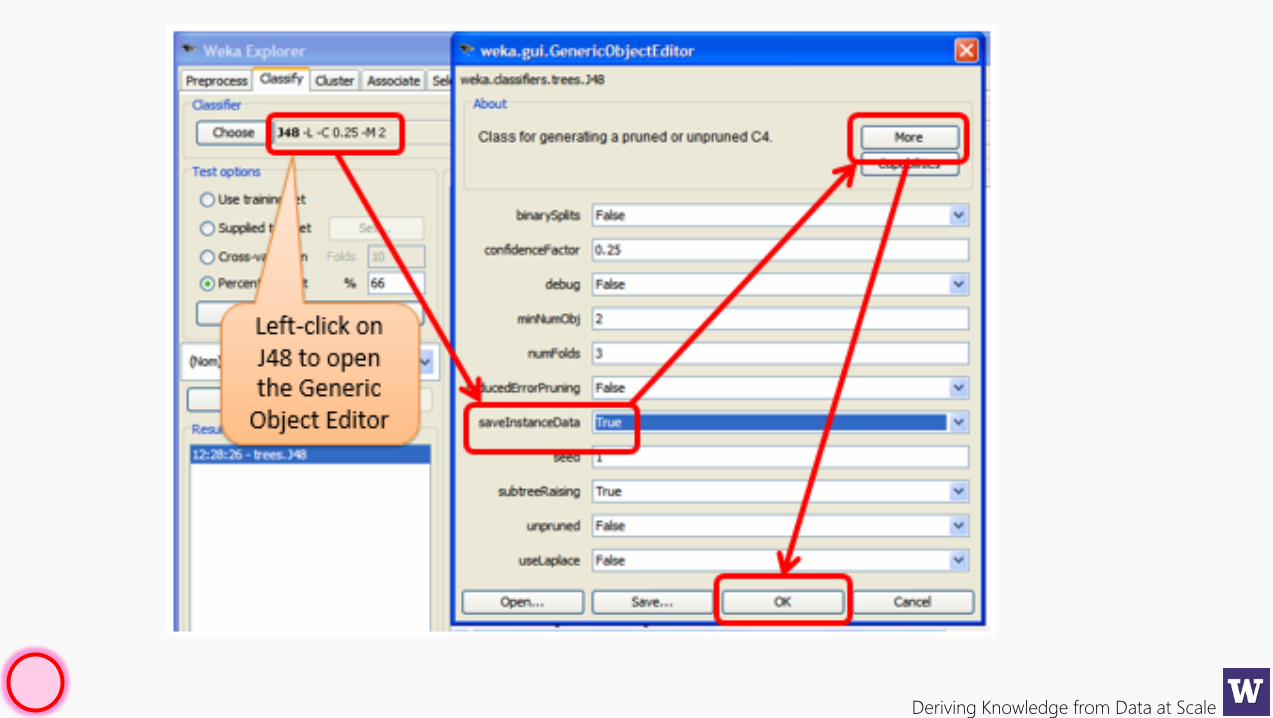
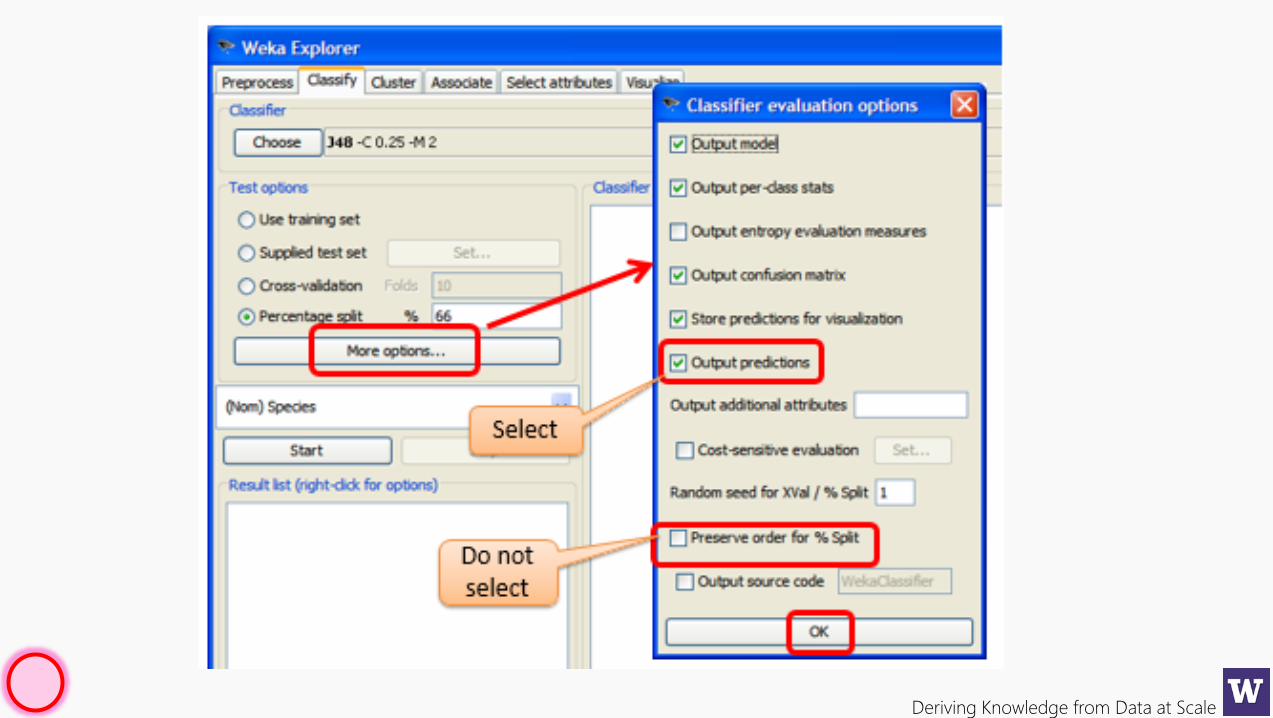
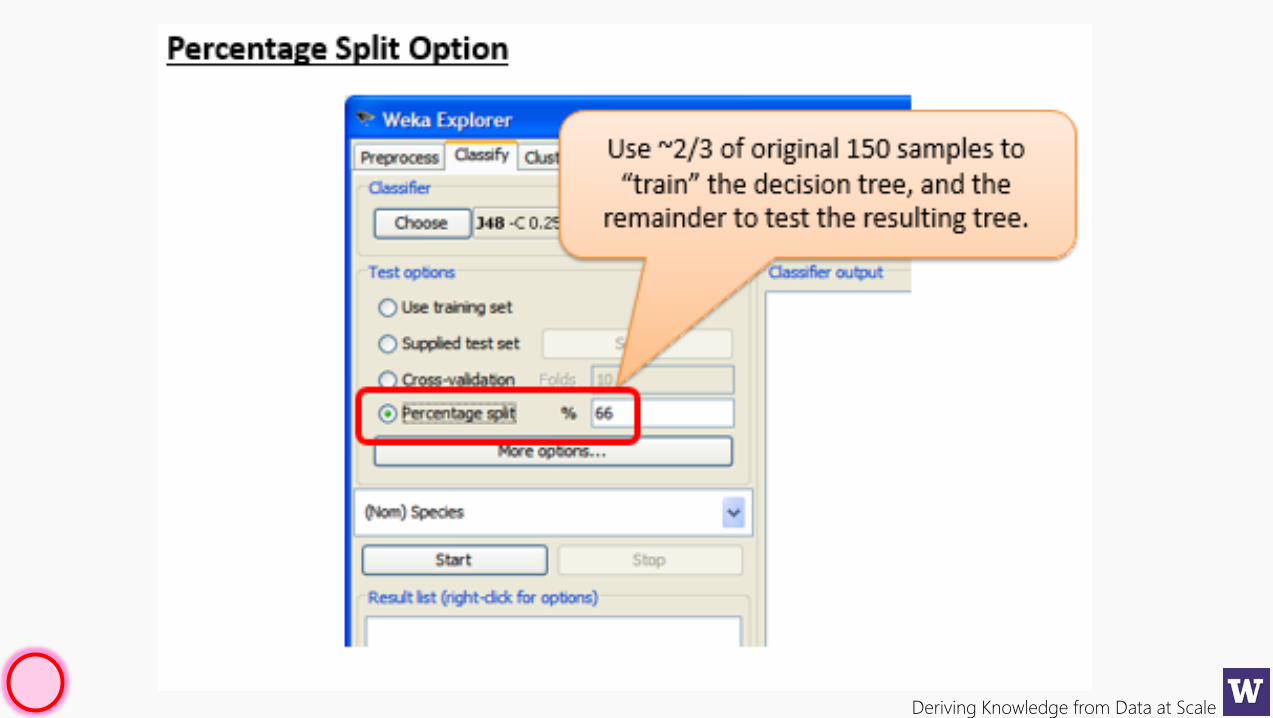
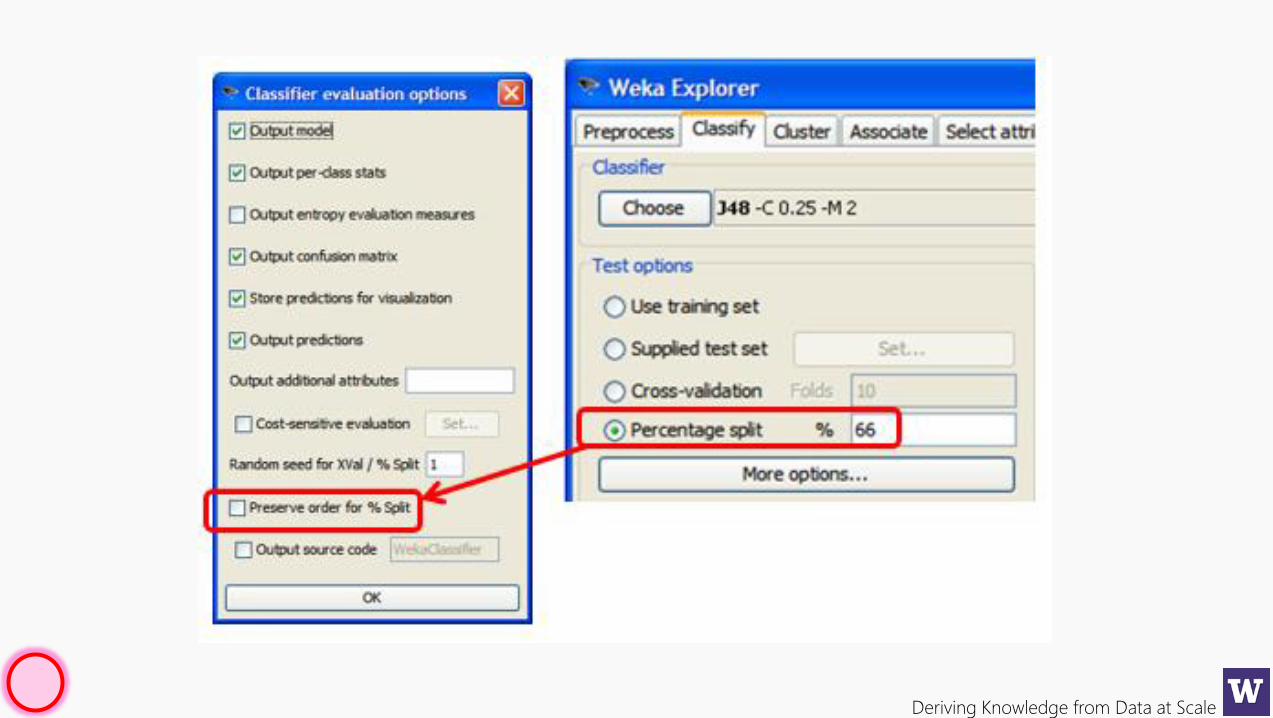
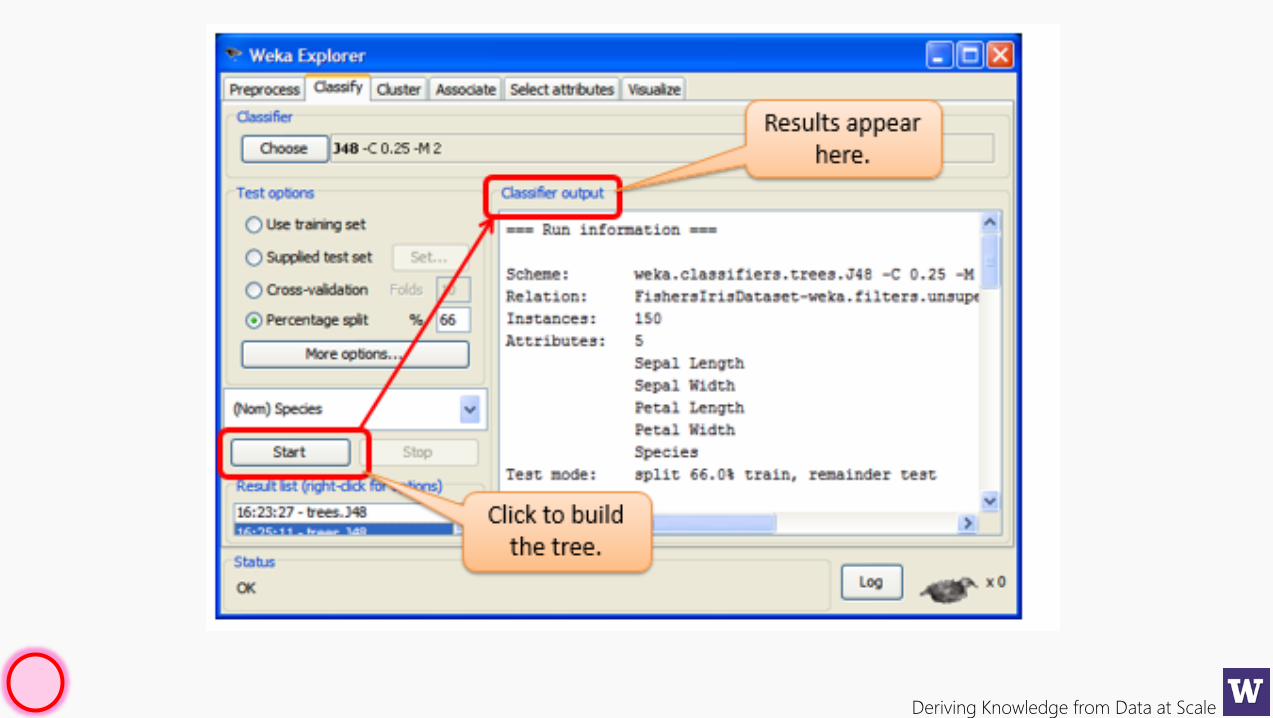
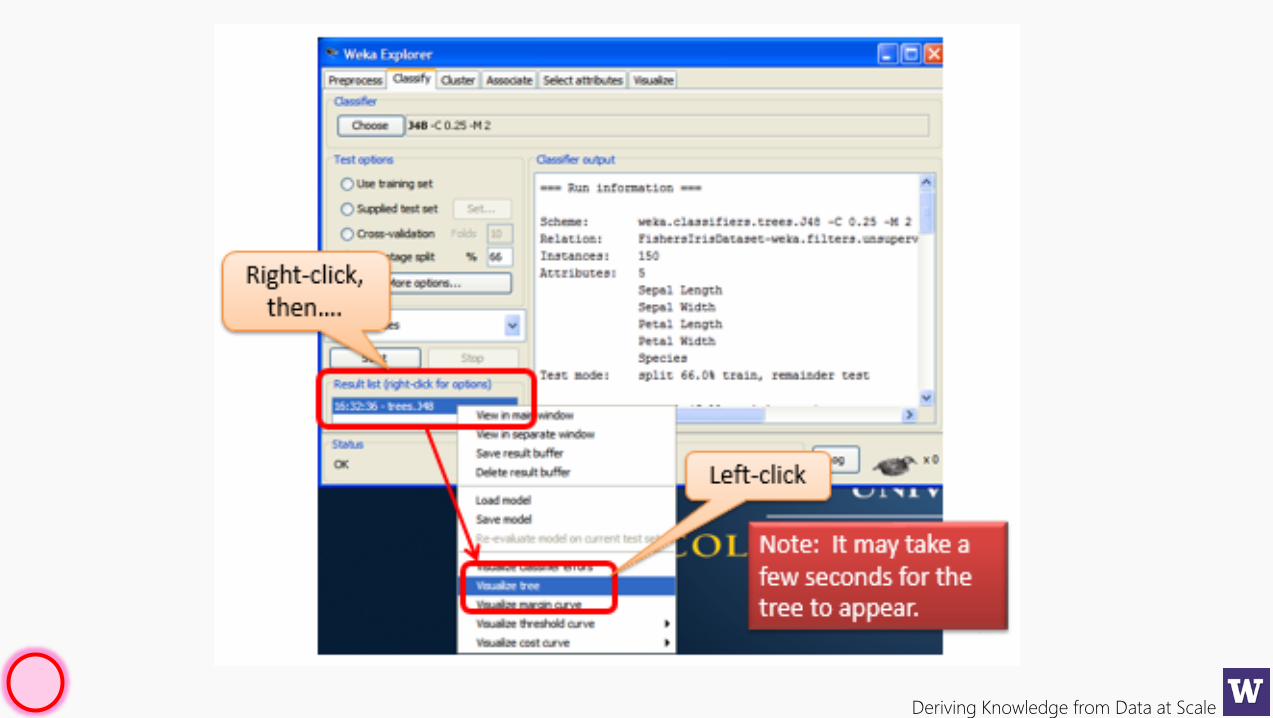
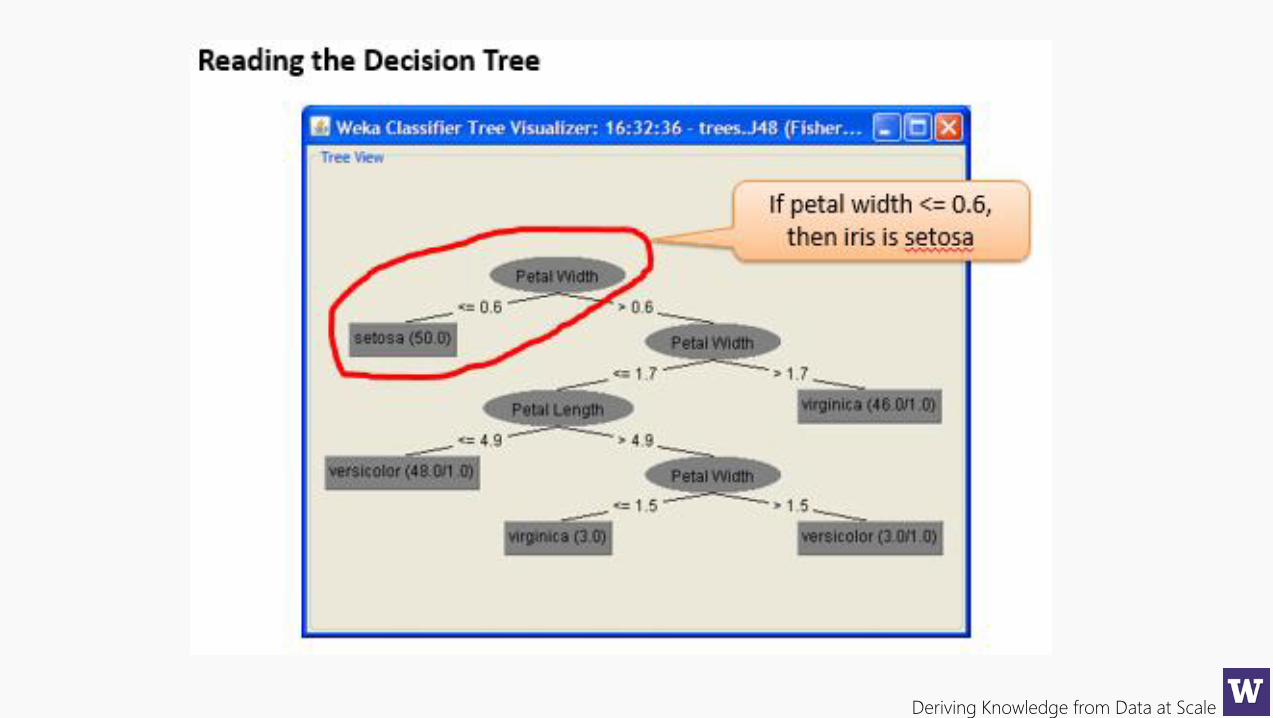
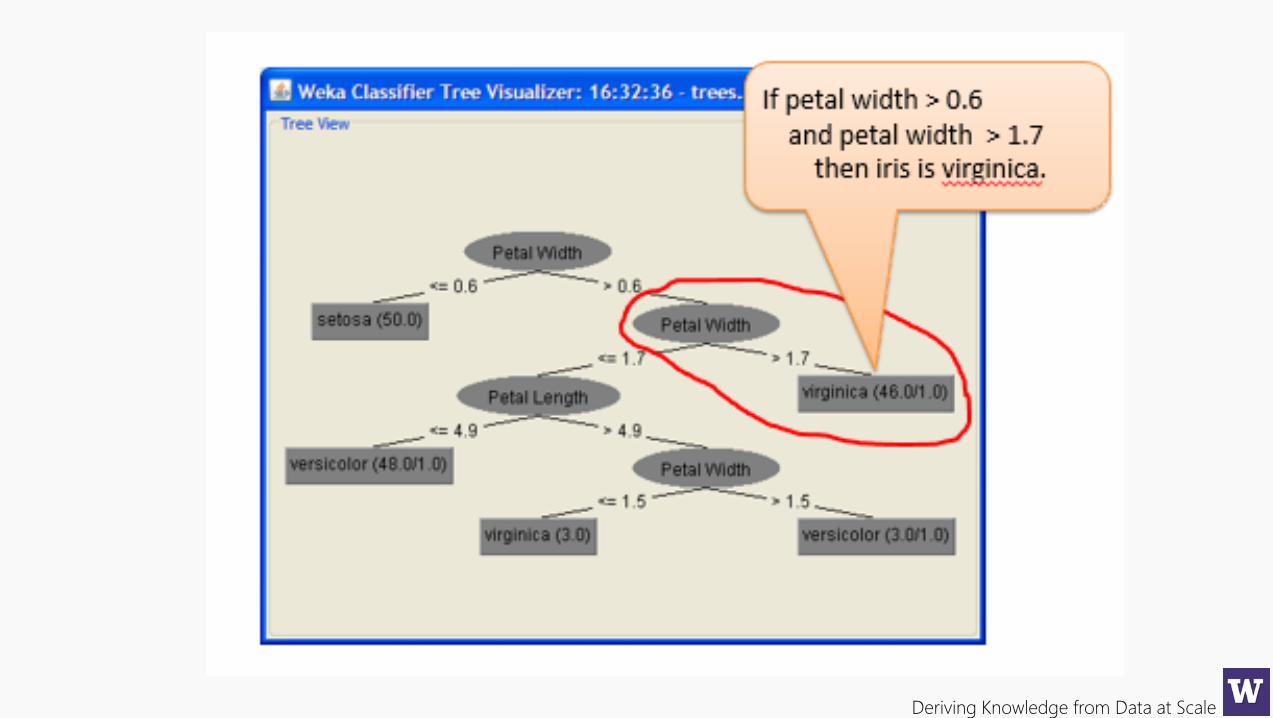
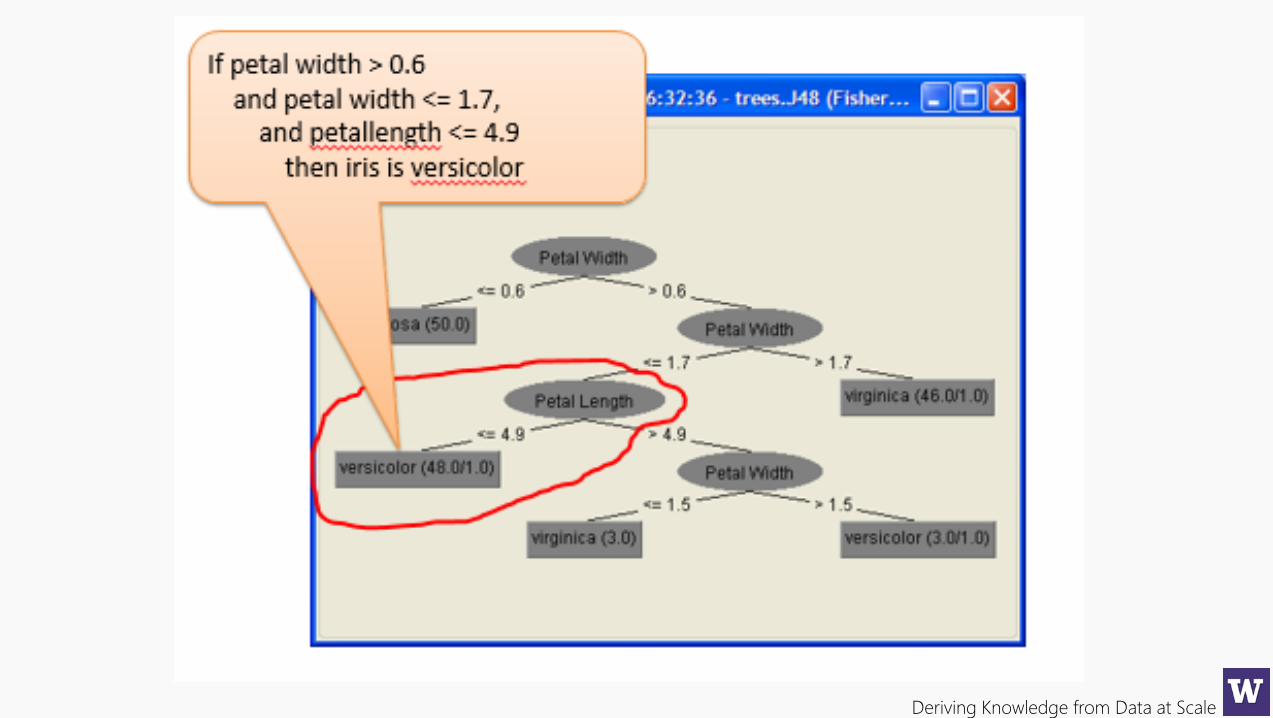
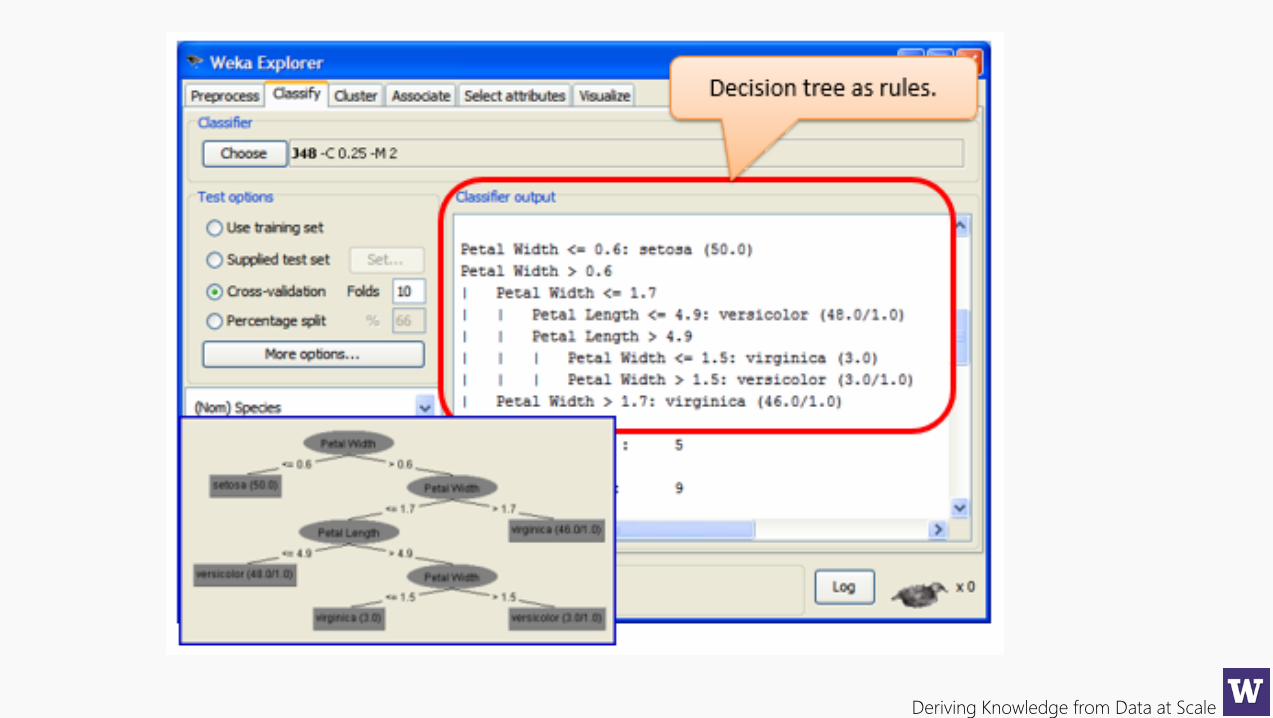
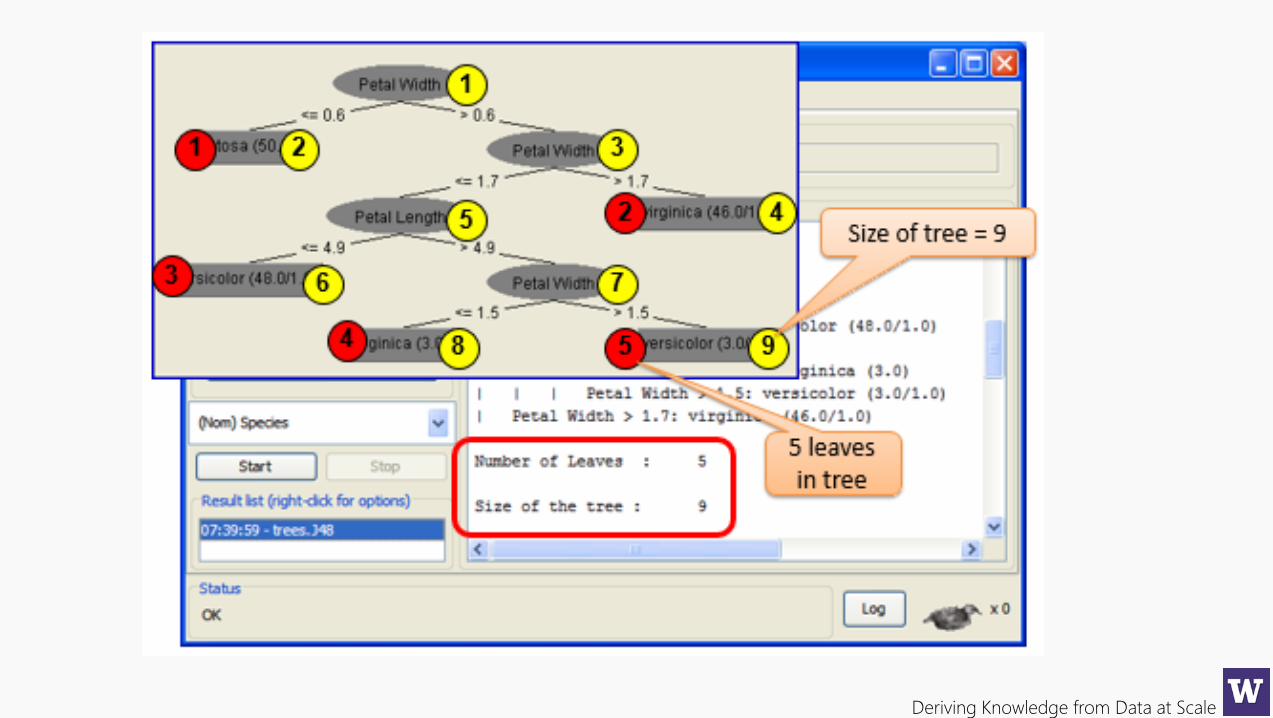
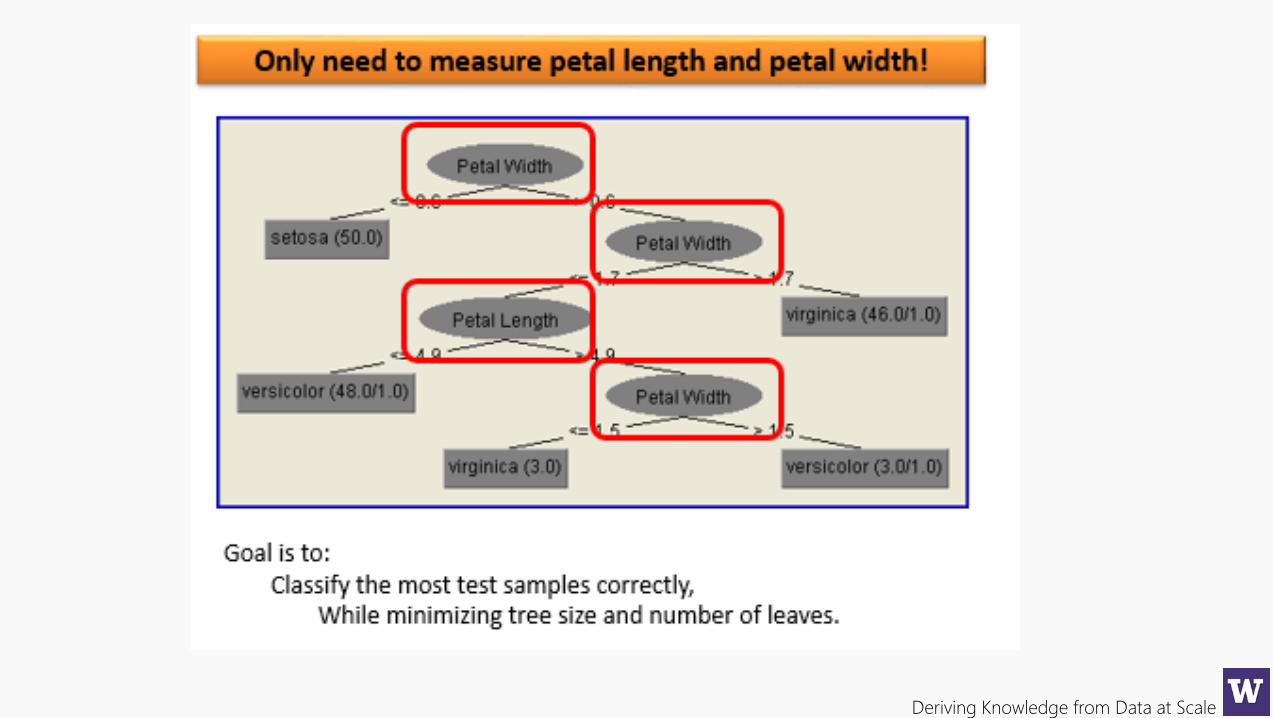
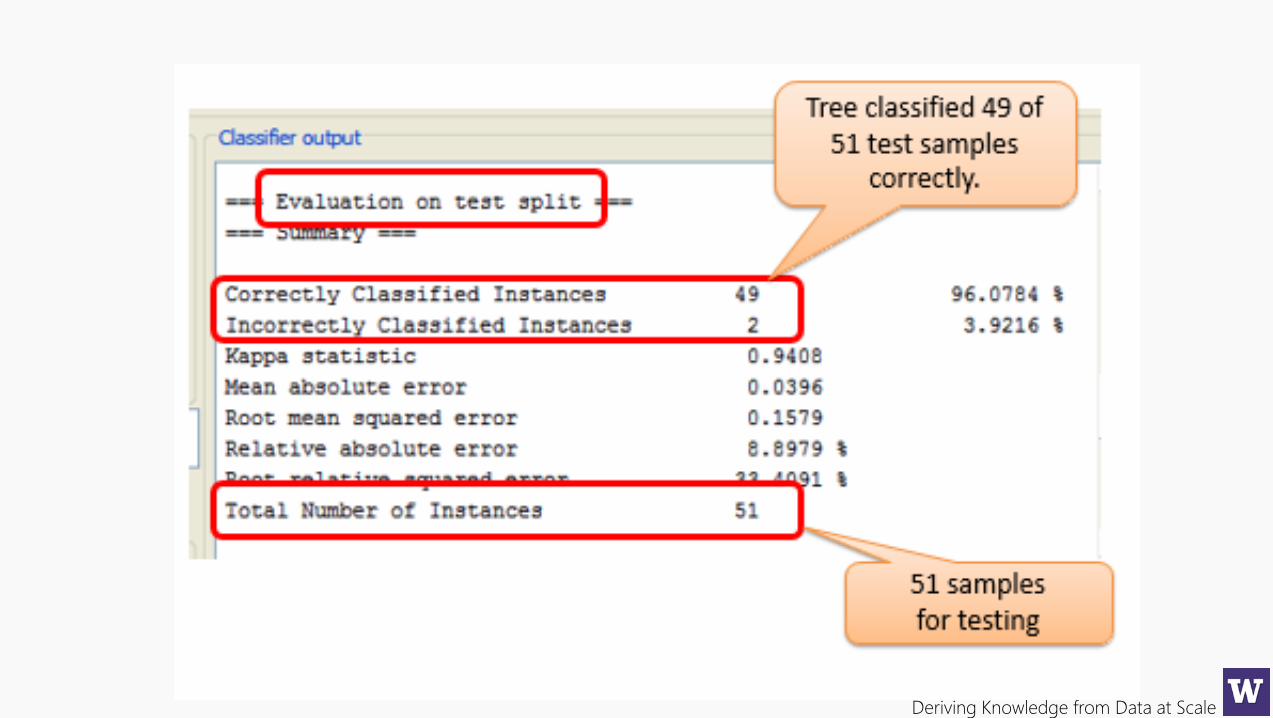
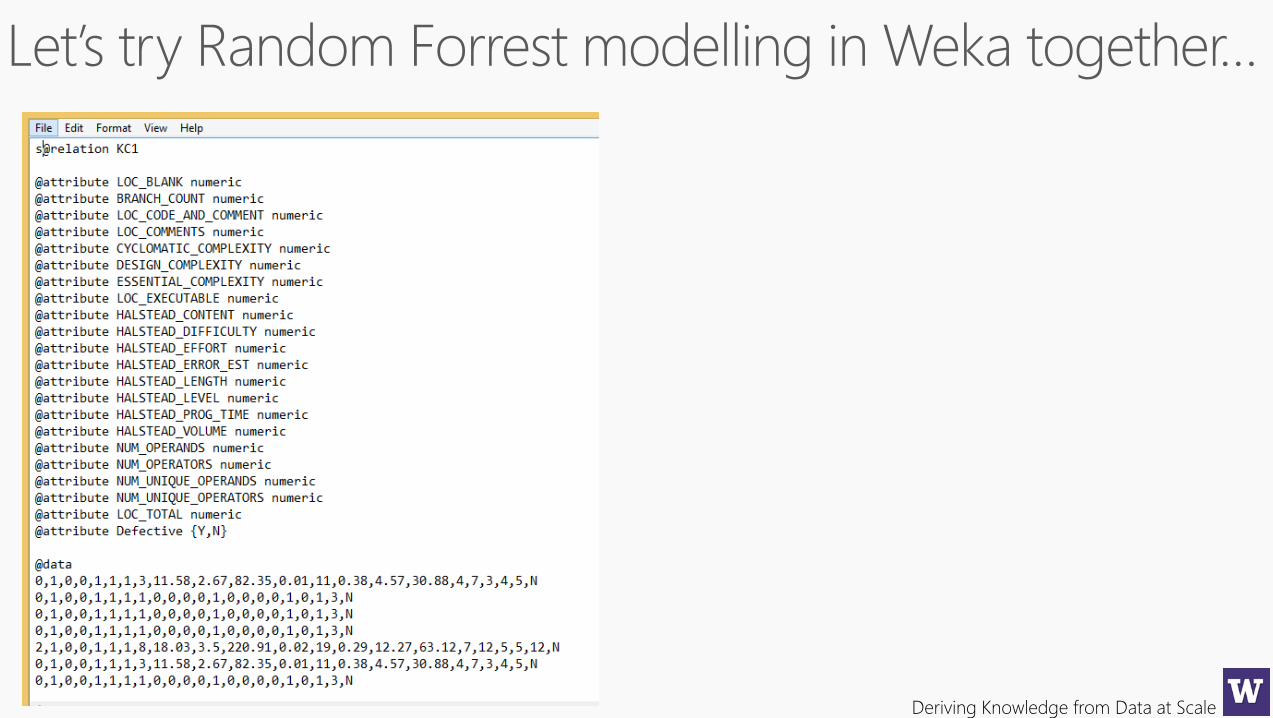
Decision Trees & Weka
Deriving Knowledge from Data at Scale
Deriving Knowledge from Data at Scale
Deriving Knowledge from Data at Scale
Deriving Knowledge from Data at Scale
Deriving Knowledge from Data at Scale
Deriving Knowledge from Data at Scale
Deriving Knowledge from Data at Scale
Deriving Knowledge from Data at Scale
Deriving Knowledge from Data at Scale
Deriving Knowledge from Data at Scale
Deriving Knowledge from Data at Scale
Deriving Knowledge from Data at Scale
Deriving Knowledge from Data at Scale
Deriving Knowledge from Data at Scale
Deriving Knowledge from Data at Scale
Deriving Knowledge from Data at Scale
Deriving Knowledge from Data at Scale
Deriving Knowledge from Data at Scale
Deriving Knowledge from Data at Scale
Deriving Knowledge from Data at Scale
Deriving Knowledge from Data at Scale
When completed, submit this assignment to
the dropbox for homework Lecture 4
Deriving Knowledge from Data at Scale
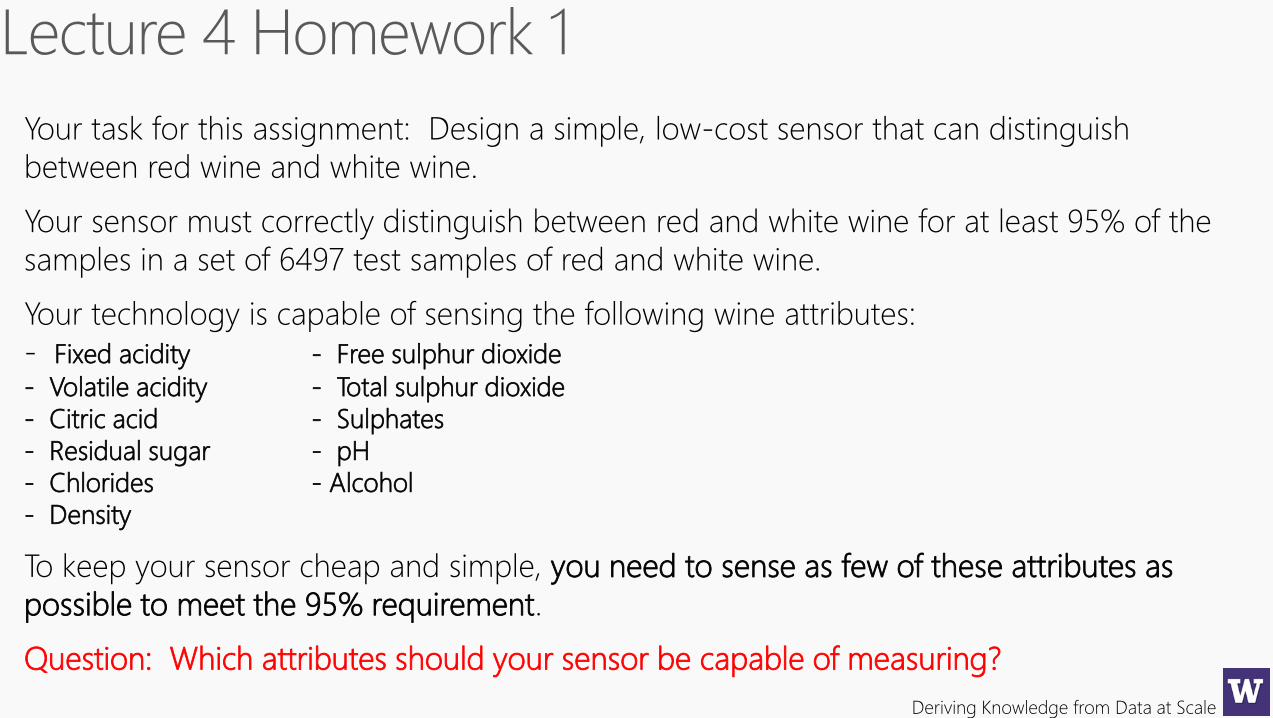
Your task for this assignment: Design a simple, low-cost sensor that can distinguish
between red wine and white wine.
Your sensor must correctly distinguish between red and white wine for at least 95% of the
samples in a set of 6497 test samples of red and white wine.
Your technology is capable of sensing the following wine attributes:
- Fixed acidity - Free sulphur dioxide
- Volatile acidity - Total sulphur dioxide
- Citric acid - Sulphates
- Residual sugar - pH
- Chlorides - Alcohol
- Density
To keep your sensor cheap and simple, you need to sense as few of these attributes as
possible to meet the 95% requirement.
Question: Which attributes should your sensor be capable of measuring?

Deriving Knowledge from Data at Scale
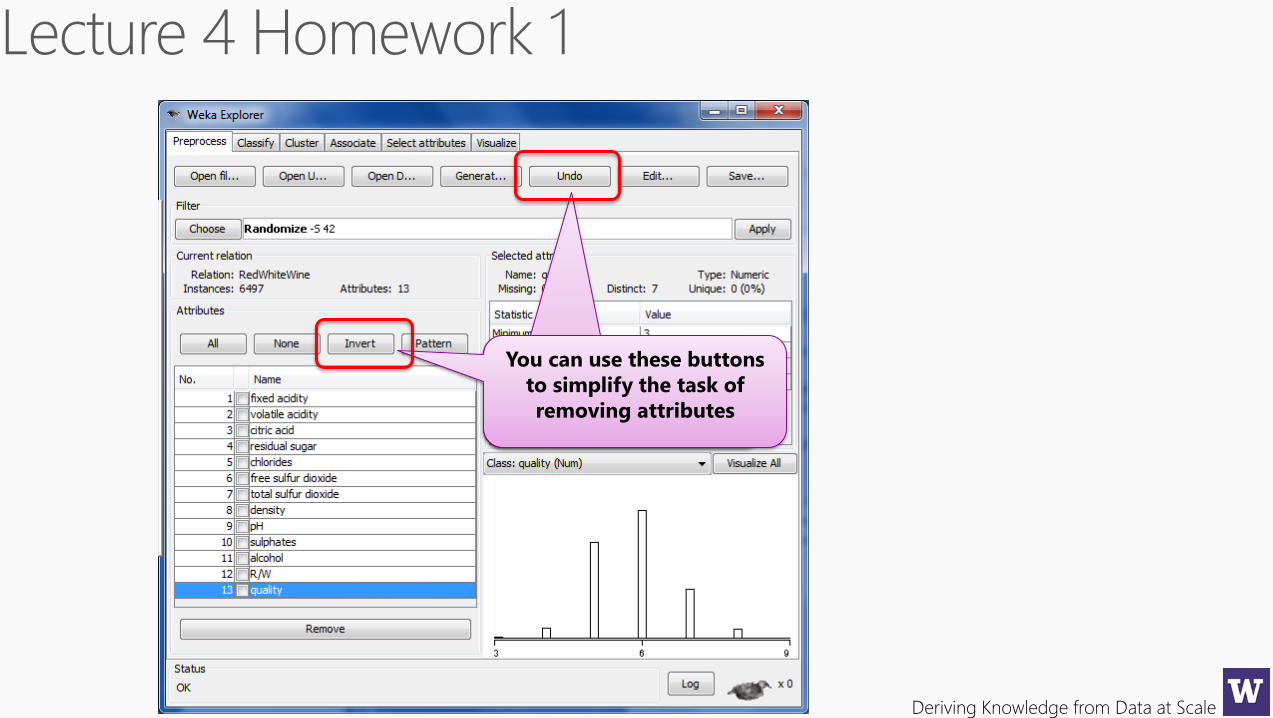
1. Go to our class website, Lecture 4, and download the associated homework files
2. Read WineQuality.pdf.
3. Open the RedWhiteWine.arff file in Weka, and remove the quality attribute, which you
will not need for this assignment.
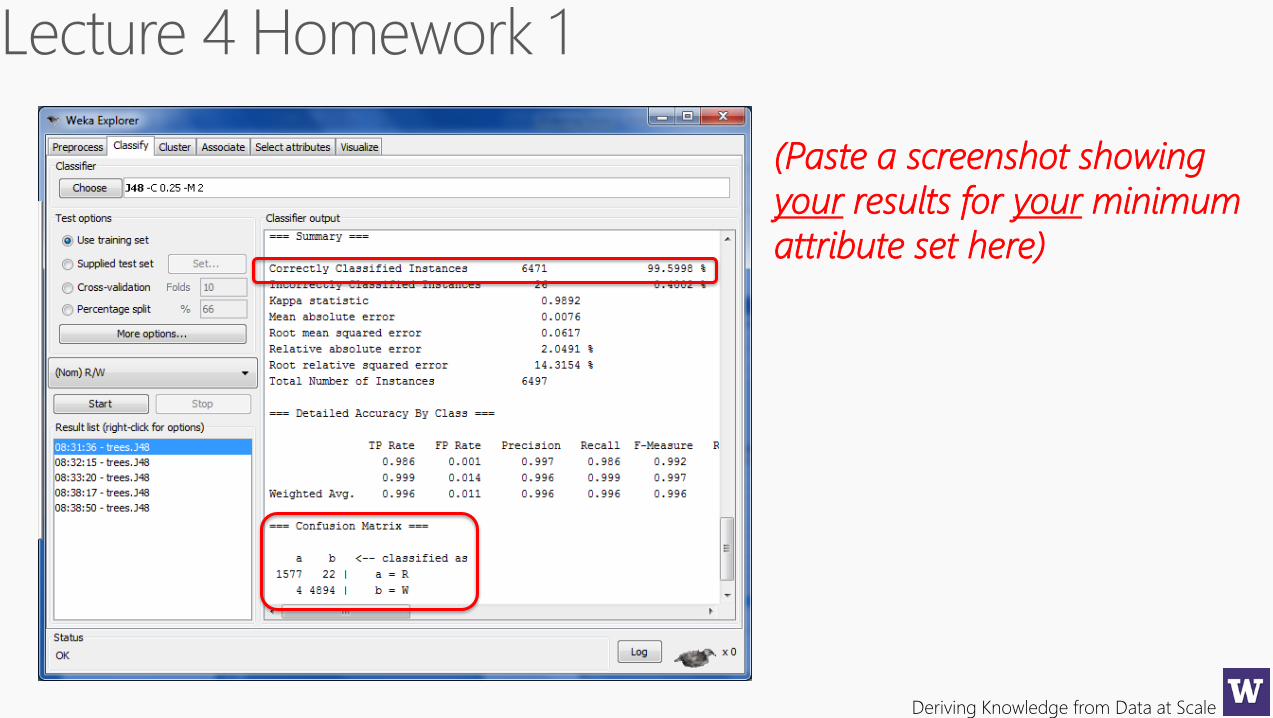
4. Run J48 with default set-up to see what kind of percent correct classification results
you get using all attributes.
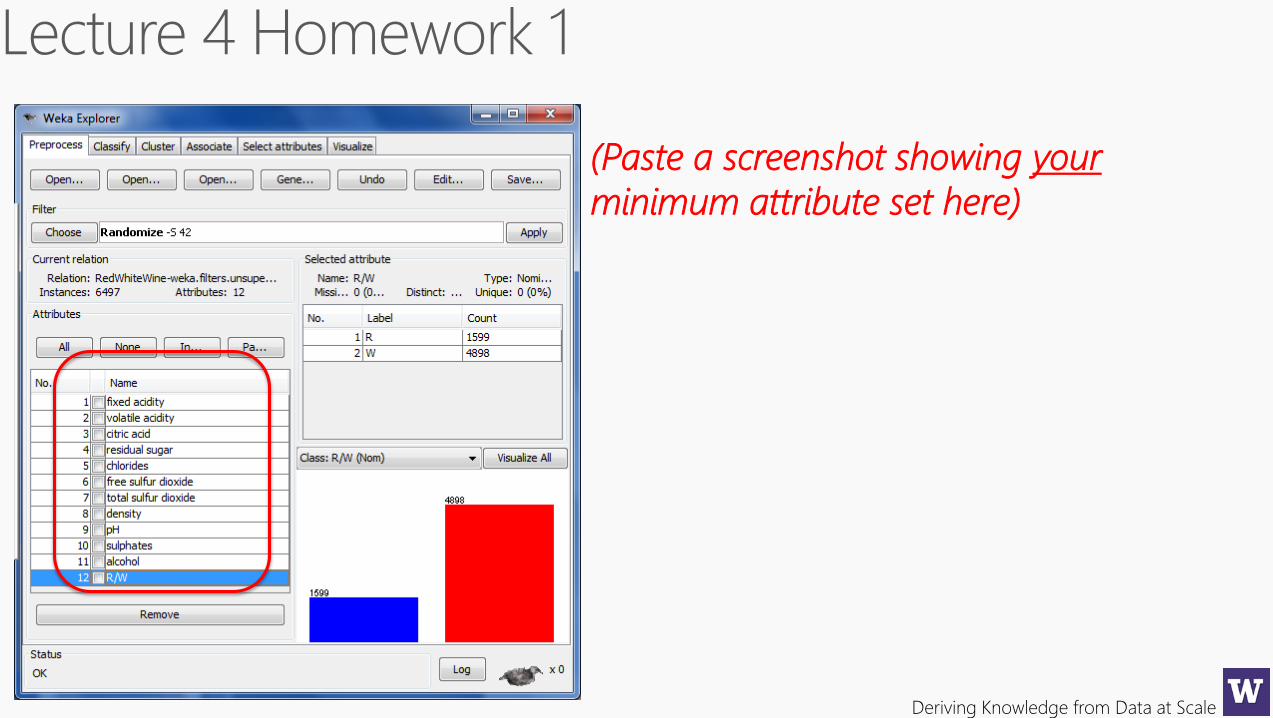
5. Remove attributes to find the minimum
number of attributes needed to meet
the 95% correct classification requirement.
Remove
Deriving Knowledge from Data at Scale
Use these buttons to
simplify the task of
removing attributes
You can use these buttons
to simplify the task of
removing attributes
Deriving Knowledge from Data at Scale
(Paste a screenshot showing your
minimum attribute set here)
Deriving Knowledge from Data at Scale
(Paste a screenshot showing
your results for your minimum
attribute set here)
Deriving Knowledge from Data at Scale
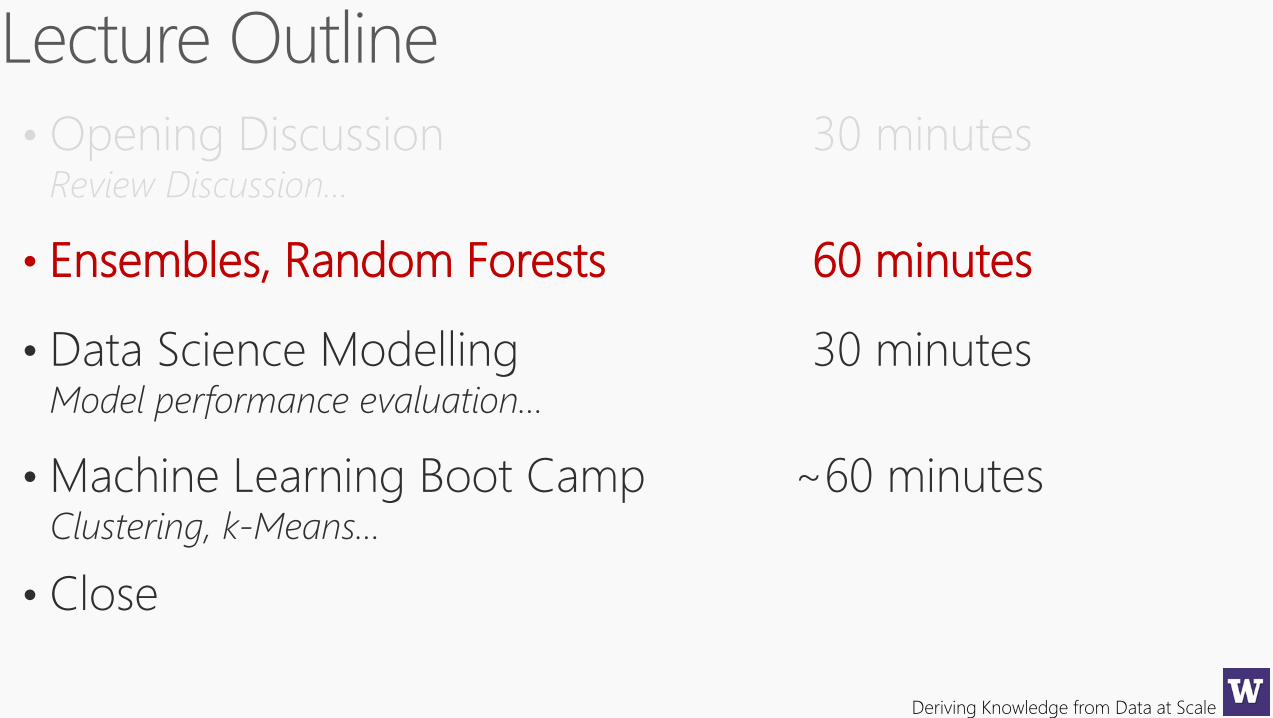
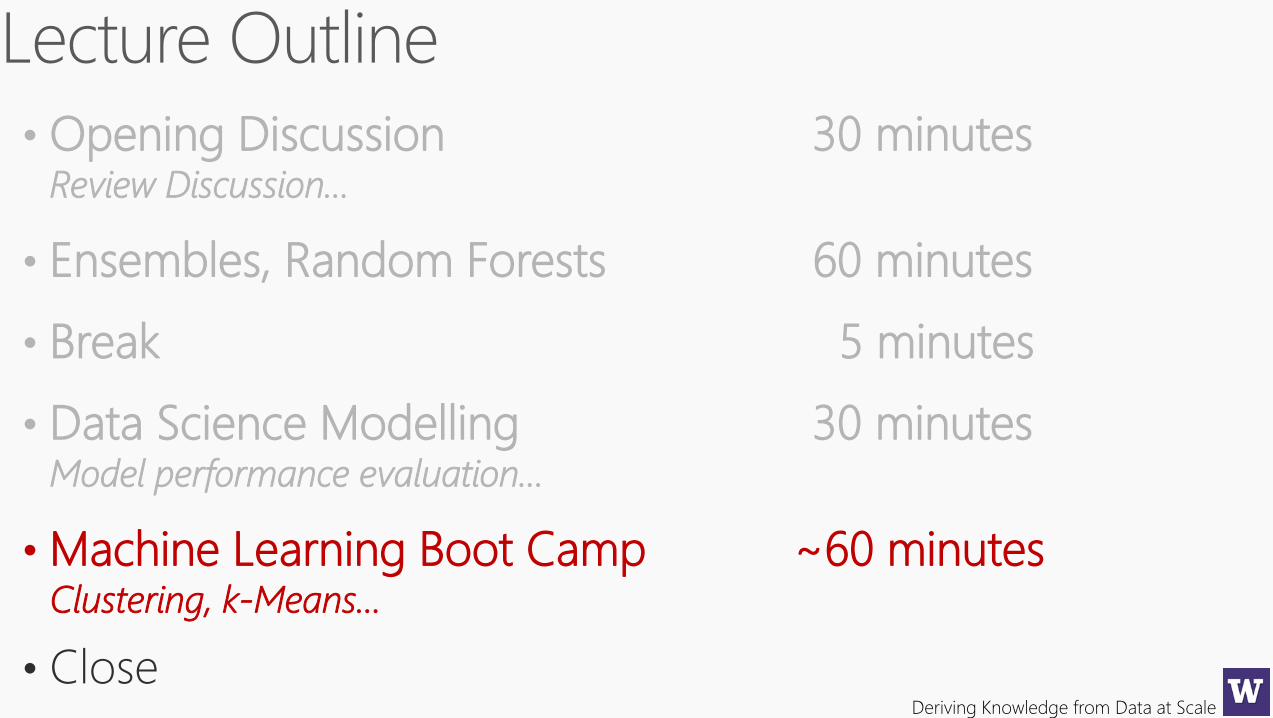
• Opening Discussion 30 minutesReview Discussion…
• Ensembles, Random Forests 60 minutes
• Data Science Modelling 30 minutesModel performance evaluation…
• Machine Learning Boot Camp ~60 minutesClustering, k-Means…
• Close
Deriving Knowledge from Data at Scale
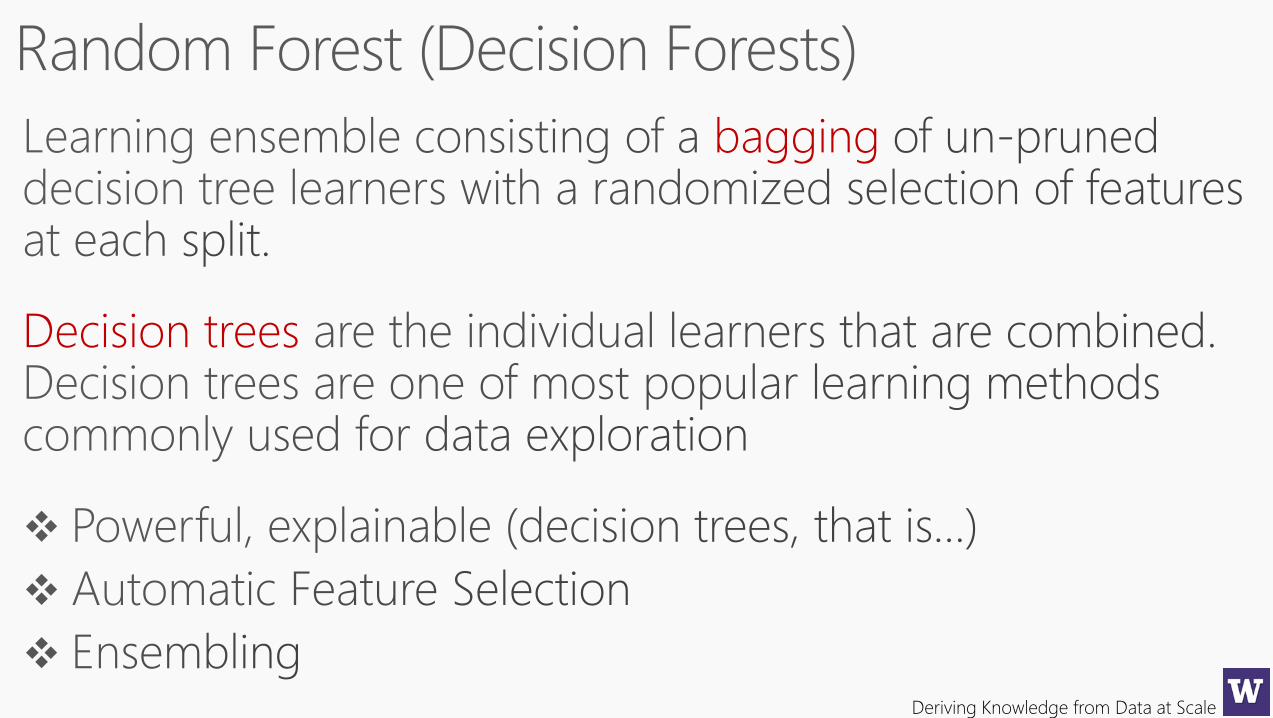
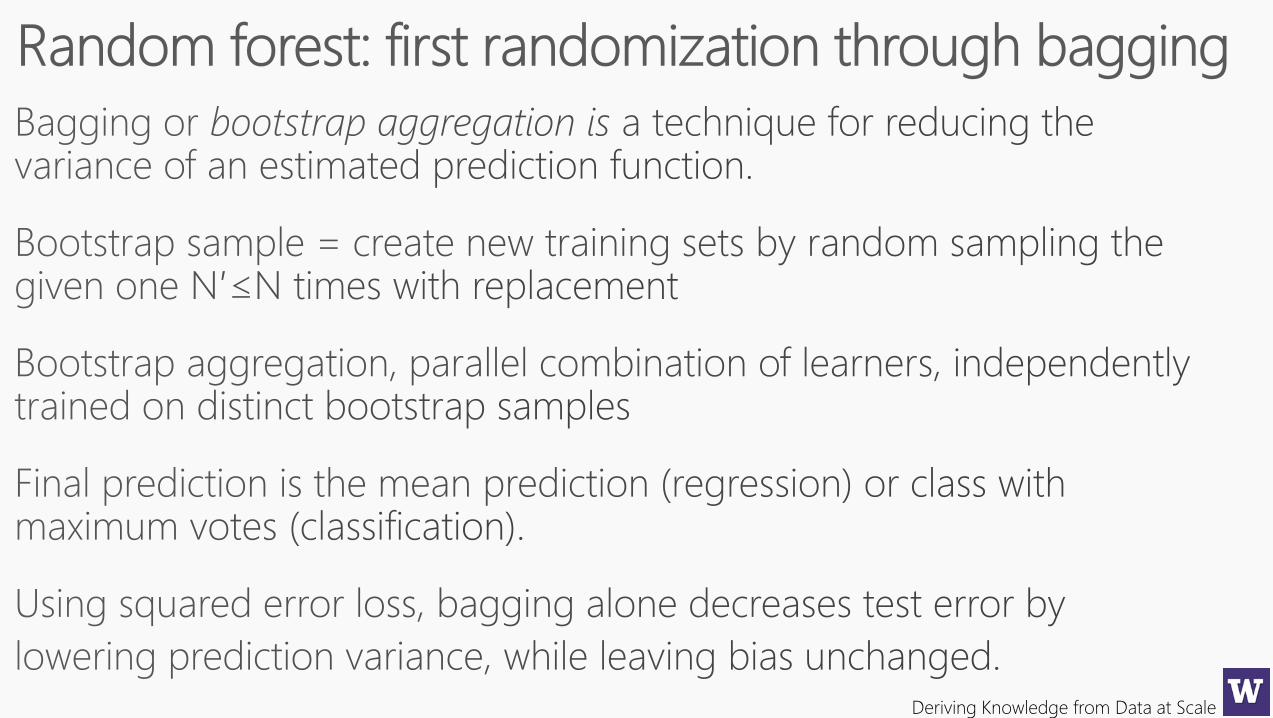
bagging
Decision trees
Deriving Knowledge from Data at Scale
Deriving Knowledge from Data at Scale
Deriving Knowledge from Data at Scale

Deriving Knowledge from Data at Scale
Deriving Knowledge from Data at Scale
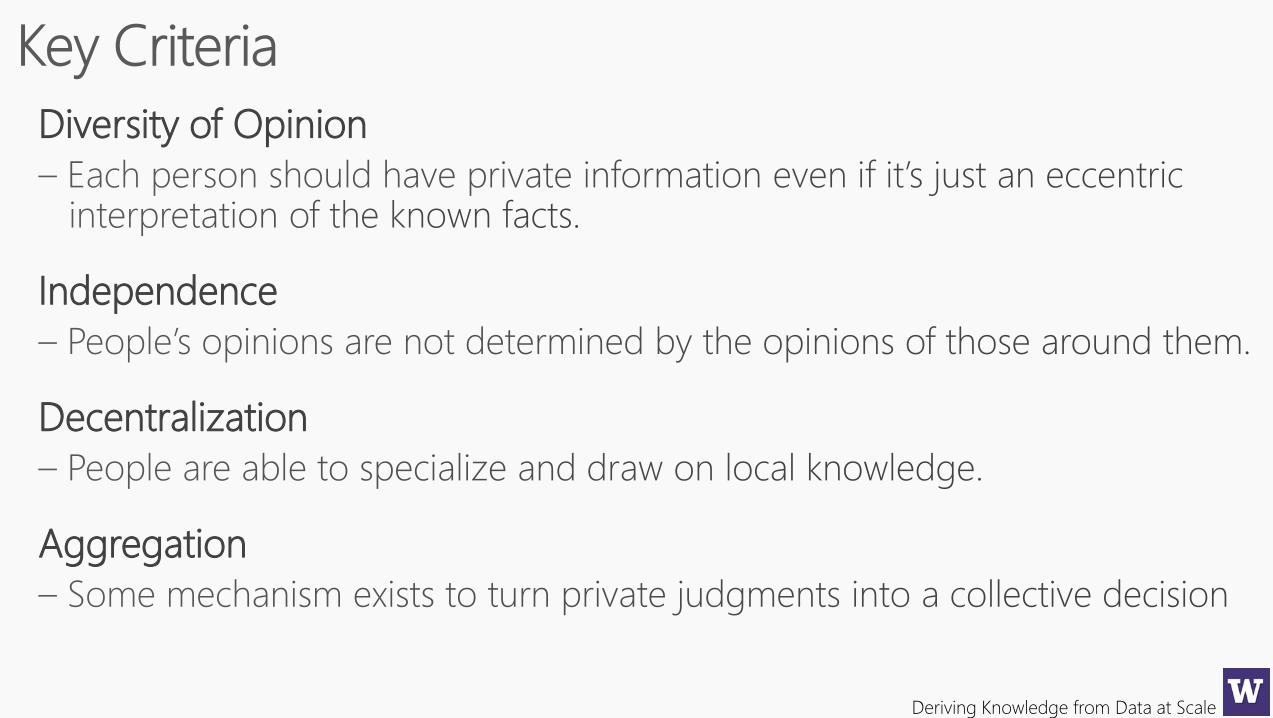
Diversity of Opinion
Independence
Decentralization
Aggregation
Deriving Knowledge from Data at Scale
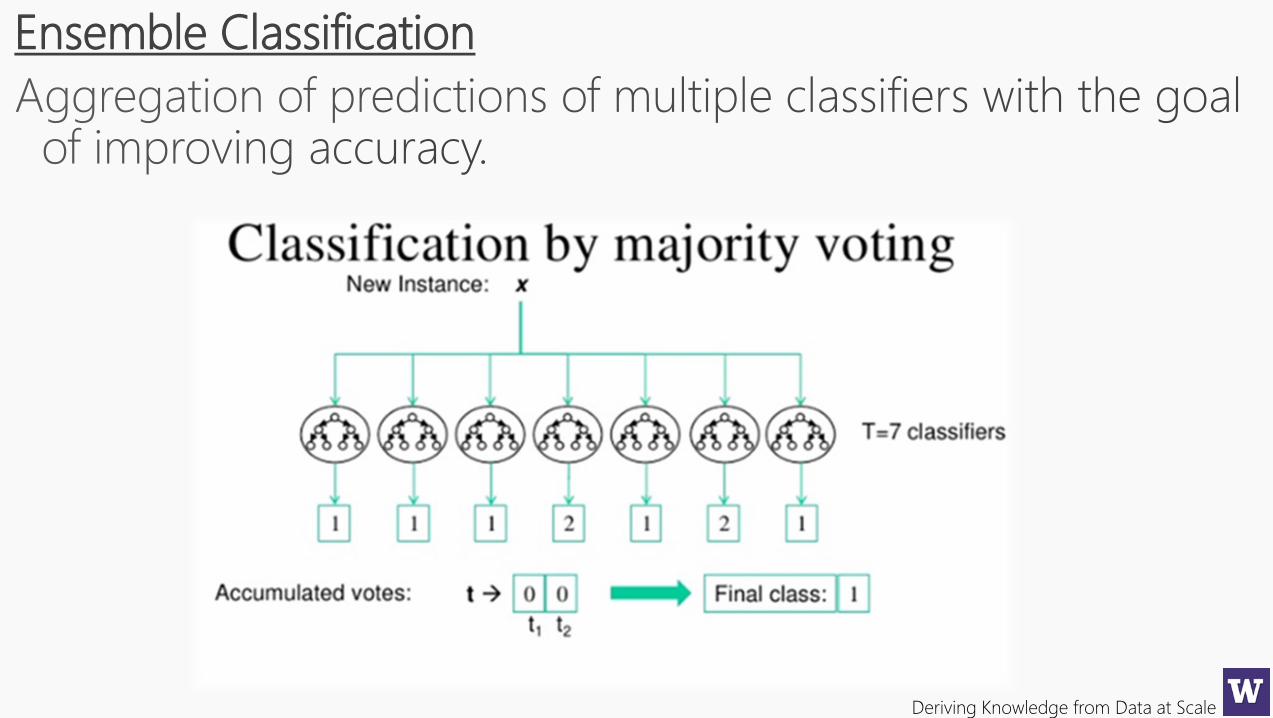
Ensemble Classification
Deriving Knowledge from Data at Scale
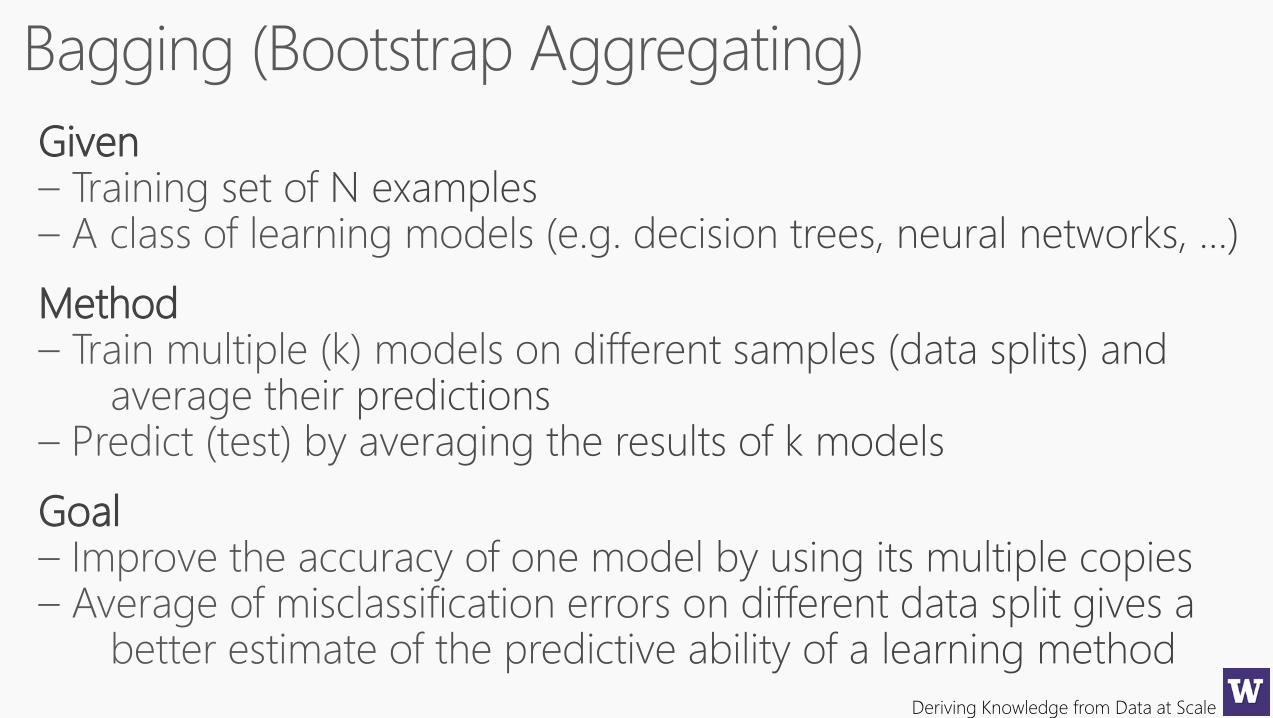
Given
Method
Goal
Deriving Knowledge from Data at Scale
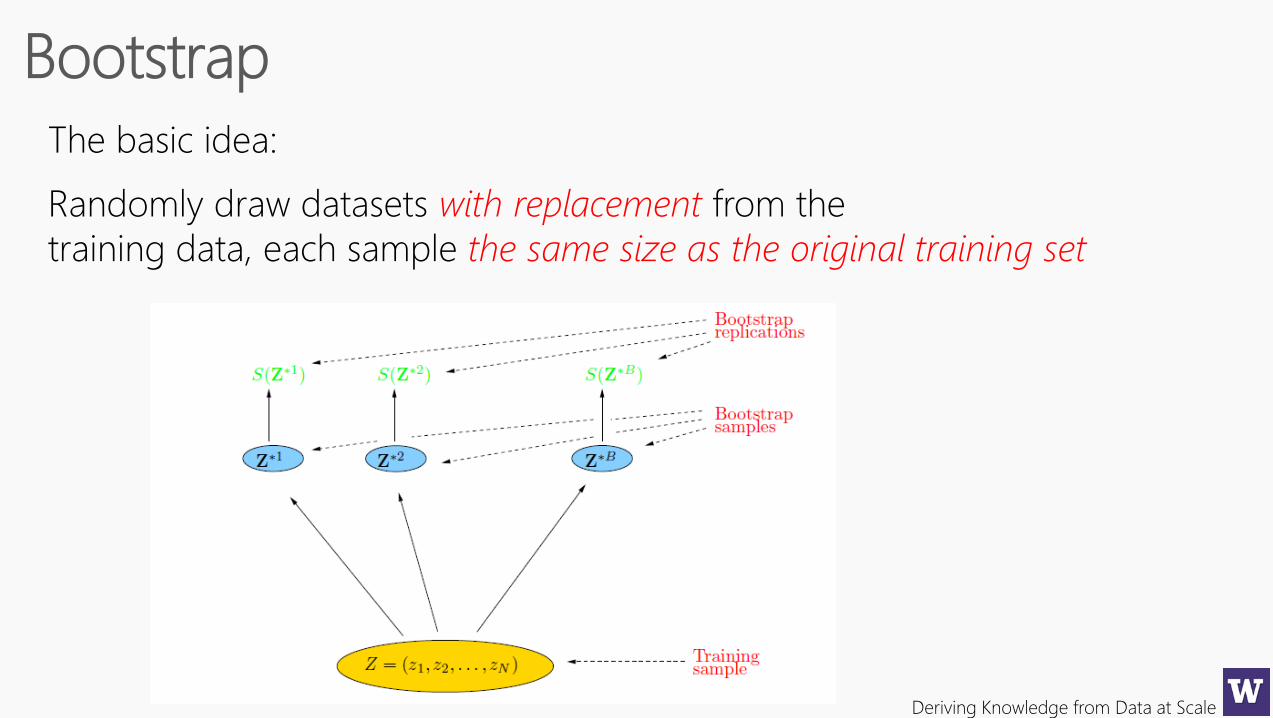
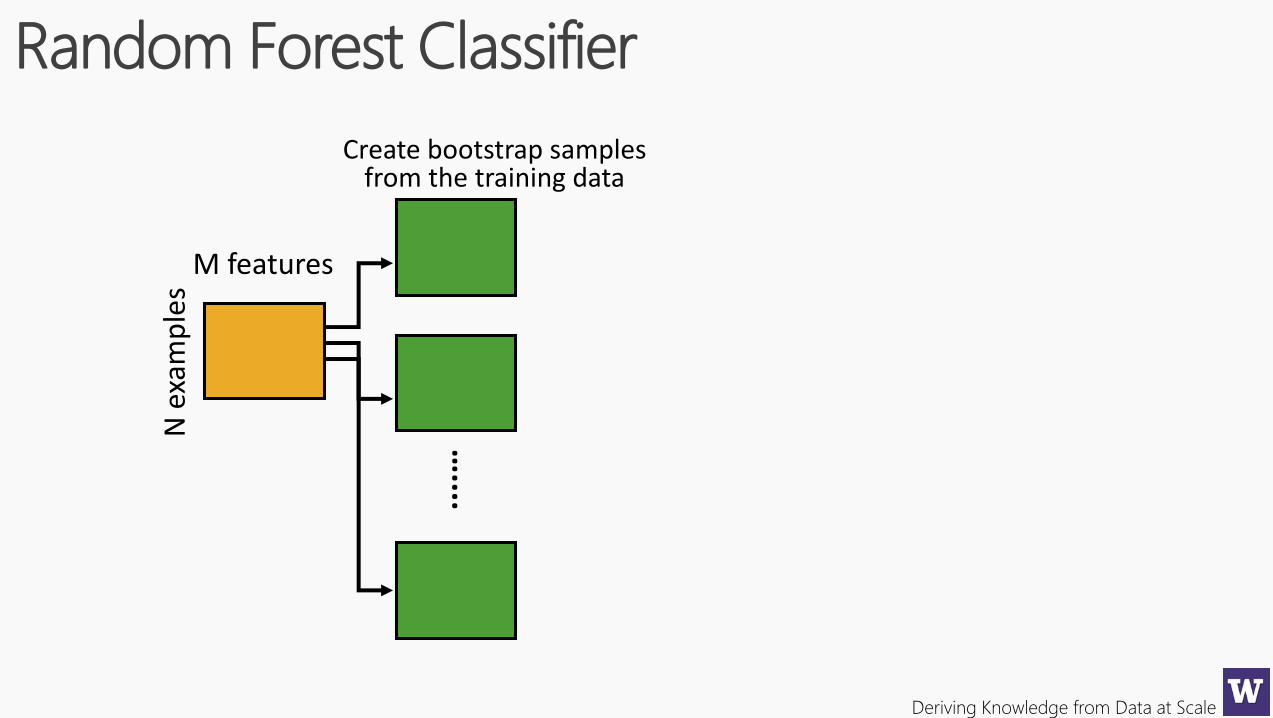
The basic idea:
Randomly draw datasets with replacement from the
training data, each sample the same size as the original training set
Deriving Knowledge from Data at Scale
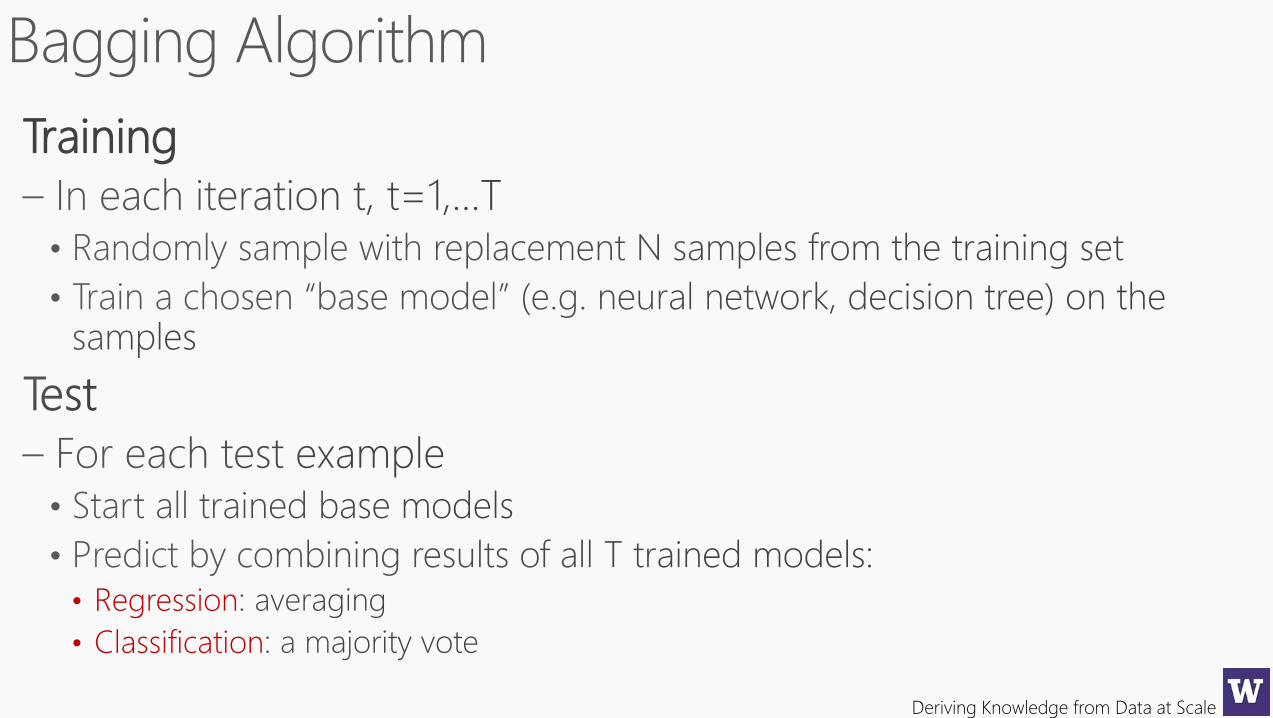
Training
• Regression
• Classification
Deriving Knowledge from Data at Scale
Deriving Knowledge from Data at Scale
Deriving Knowledge from Data at Scale
Deriving Knowledge from Data at Scale
Deriving Knowledge from Data at Scale
Deriving Knowledge from Data at Scale
Deriving Knowledge from Data at Scale
Deriving Knowledge from Data at Scale
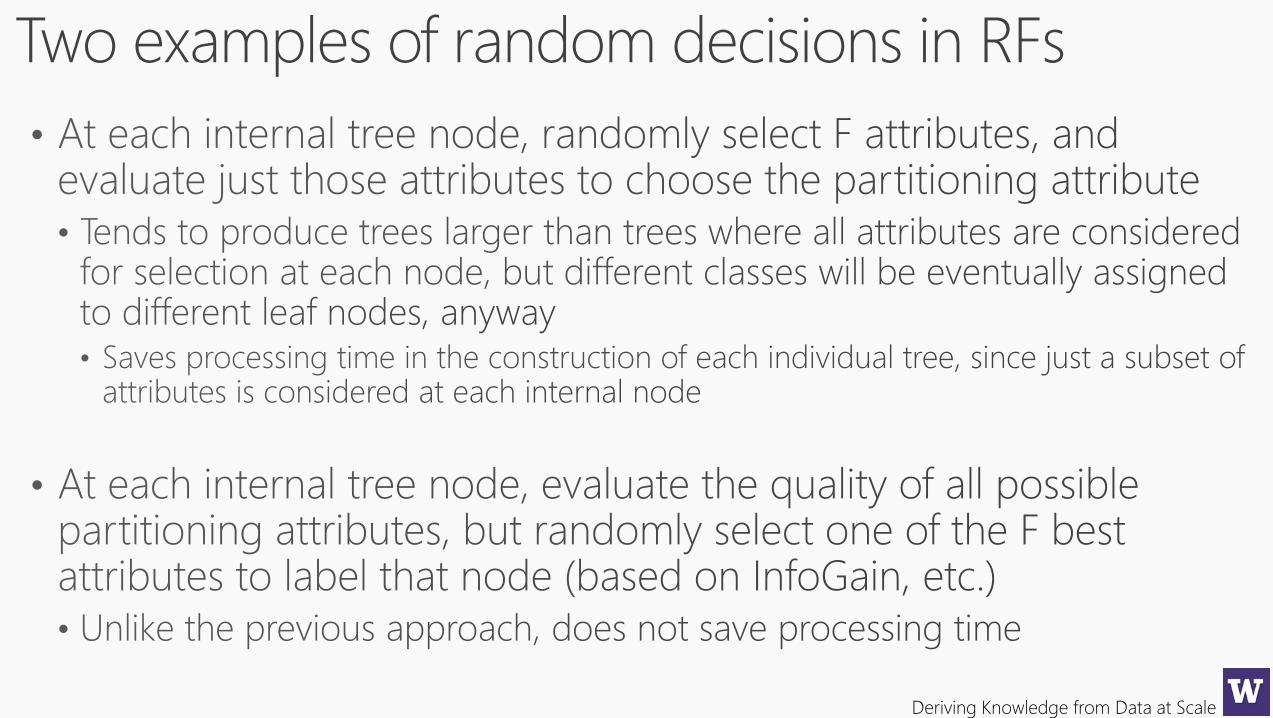
Two examples of random decisions in RFs
Deriving Knowledge from Data at Scale
Deriving Knowledge from Data at Scale
Deriving Knowledge from Data at Scale
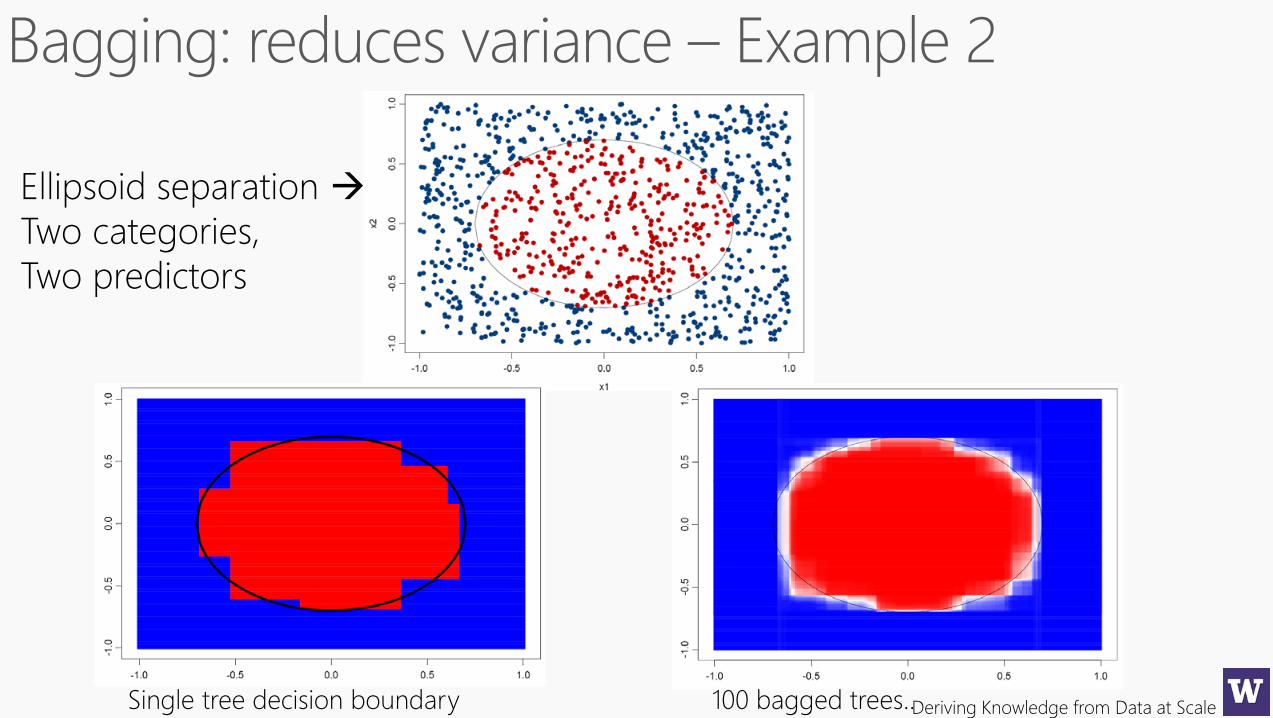
Ellipsoid separation
Two categories,
Two predictors
Single tree decision boundary 100 bagged trees..
Deriving Knowledge from Data at Scale
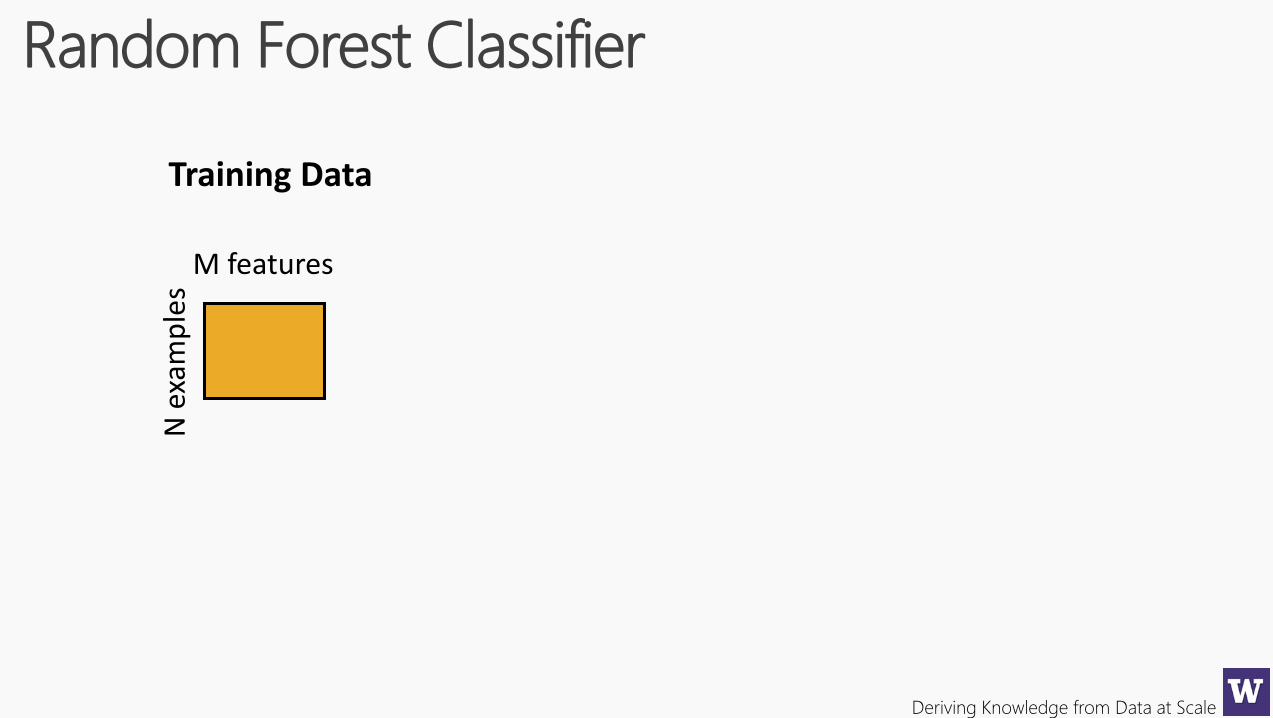
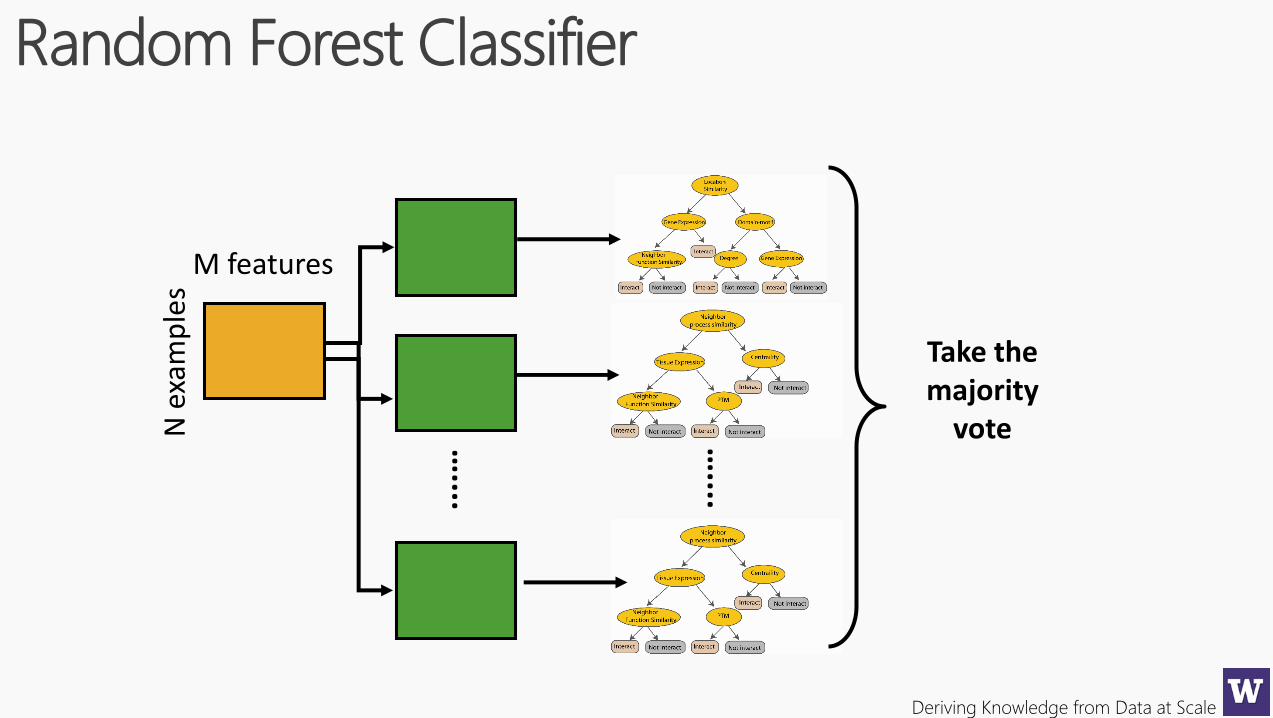
Random Forest Classifier
N e
xam
ple
sTraining Data
M features
Deriving Knowledge from Data at Scale
Random Forest Classifier
N e
xam
ple
sCreate bootstrap samples
from the training data
....…
M features
Deriving Knowledge from Data at Scale
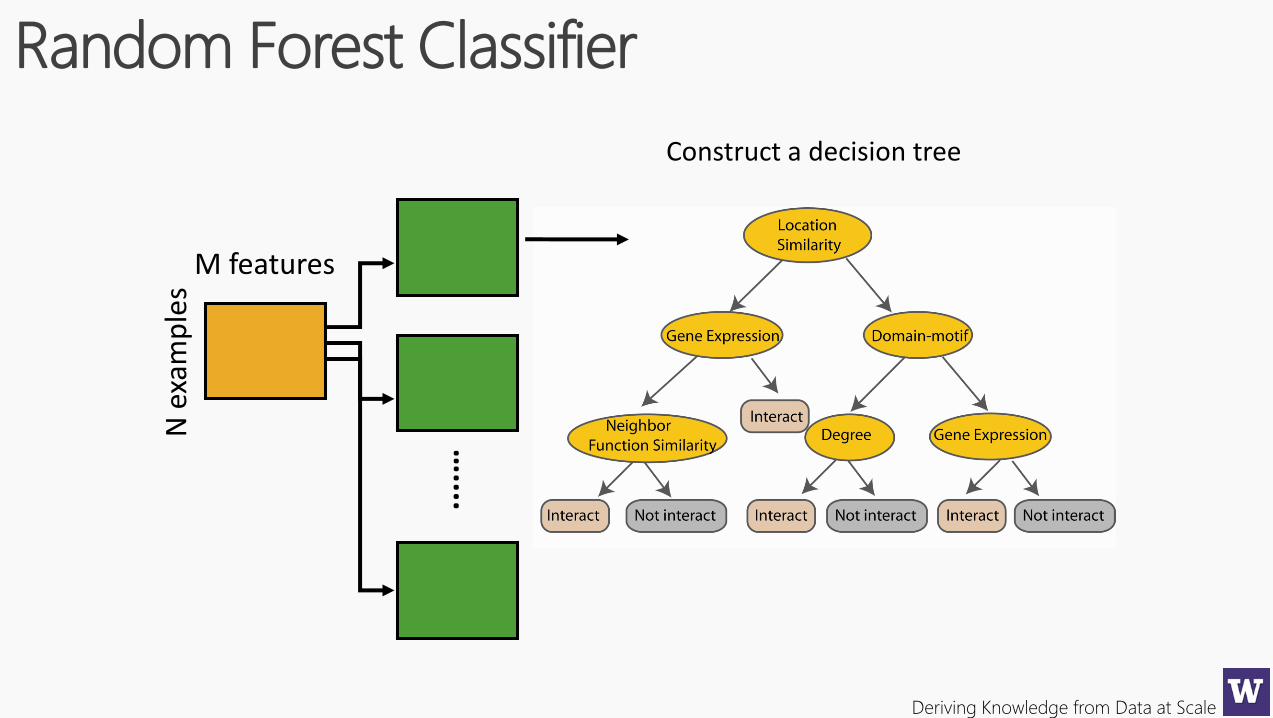
Random Forest Classifier
N e
xam
ple
sConstruct a decision tree
....…
M features
Deriving Knowledge from Data at Scale
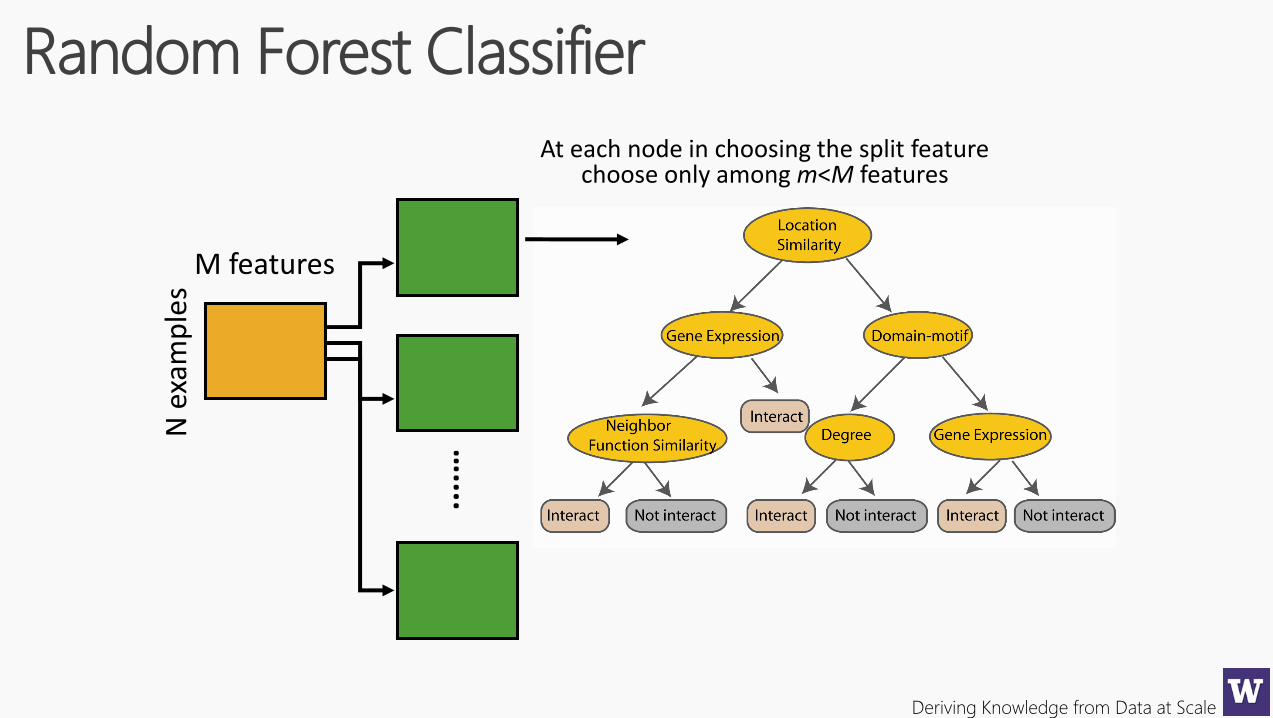
Random Forest Classifier
N e
xam
ple
s
....…
M features
At each node in choosing the split featurechoose only among m<M features
Deriving Knowledge from Data at Scale
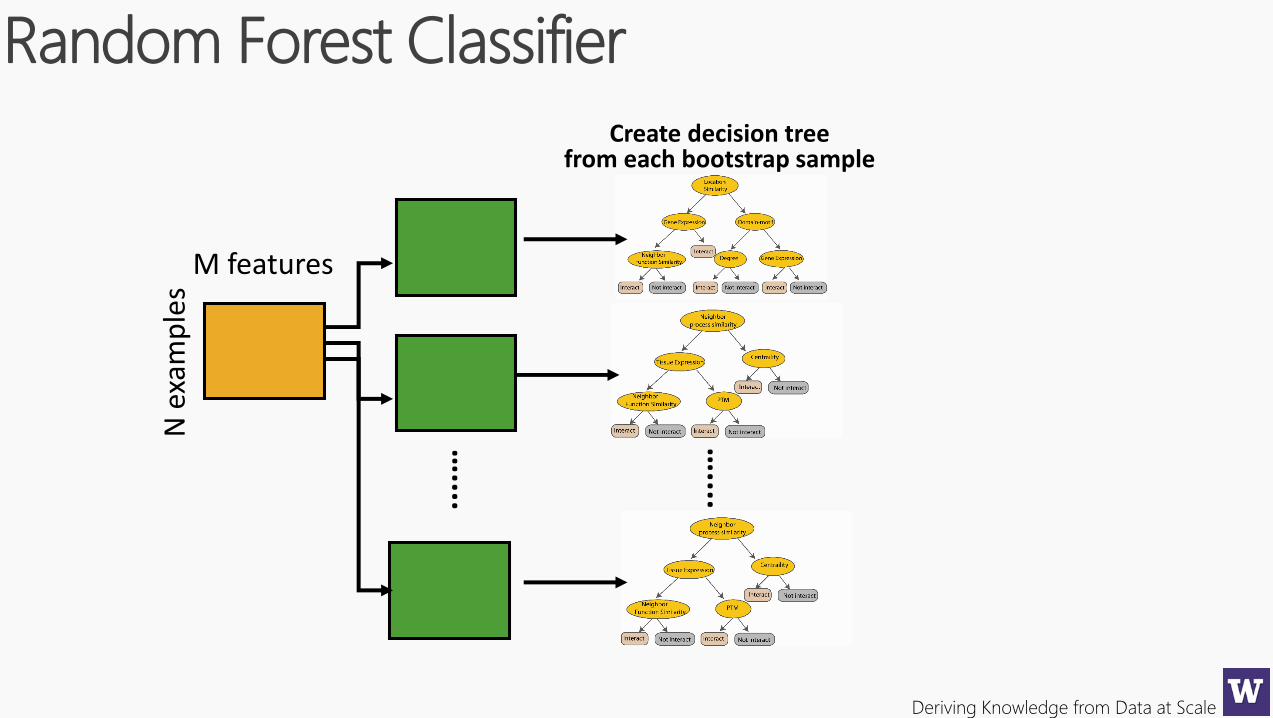
Random Forest Classifier
Create decision treefrom each bootstrap sample
N e
xam
ple
s
....…
....…
M features
Deriving Knowledge from Data at Scale
Random Forest Classifier
N e
xam
ple
s
....…
....…
Take the majority
vote
M features
Deriving Knowledge from Data at Scale
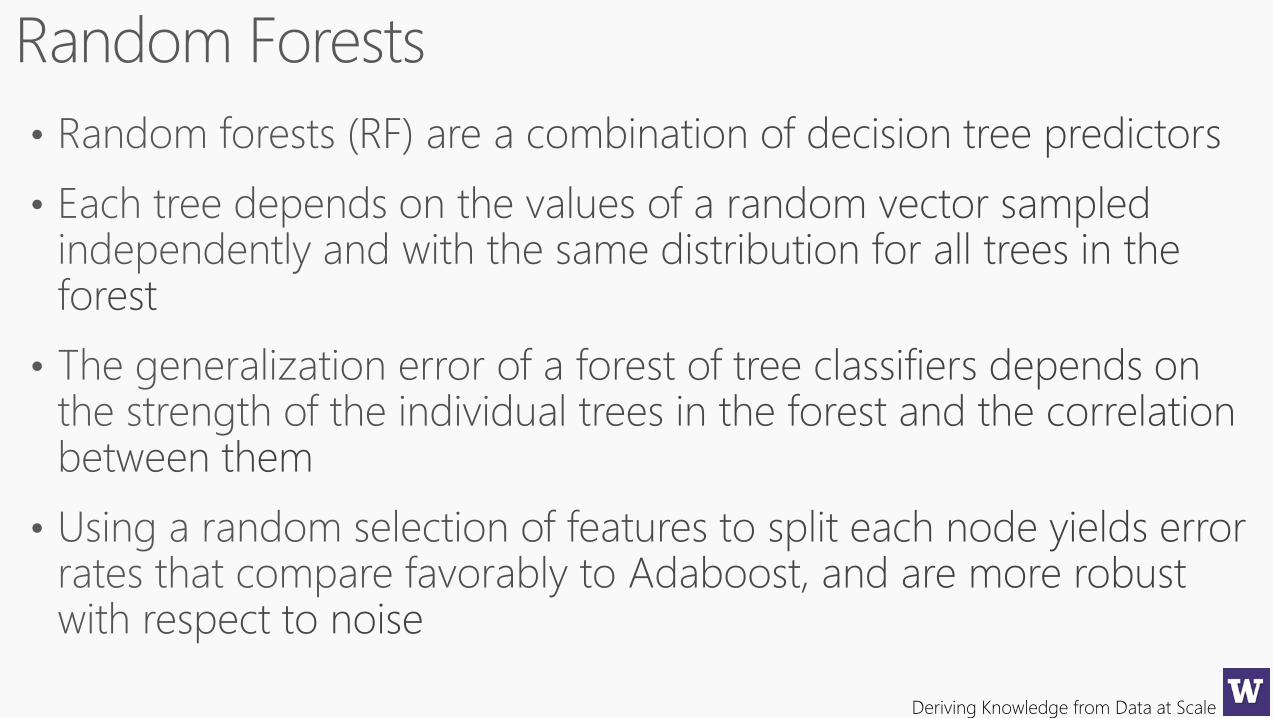
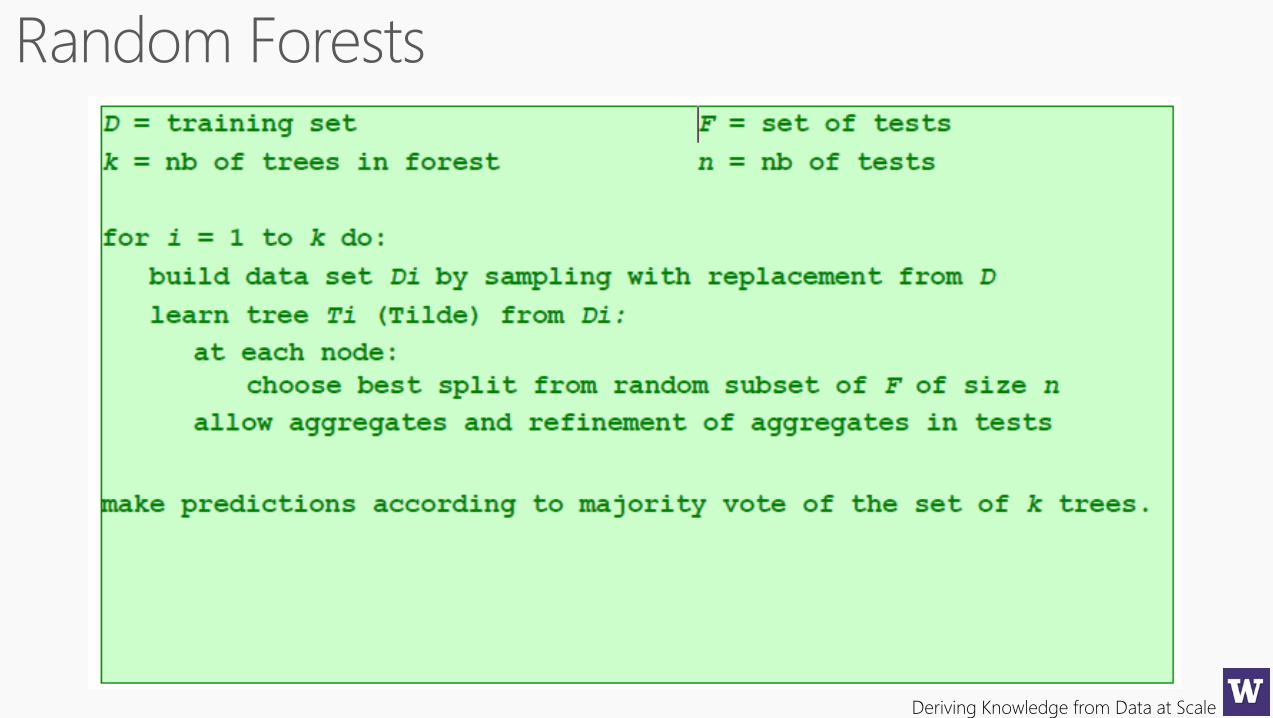
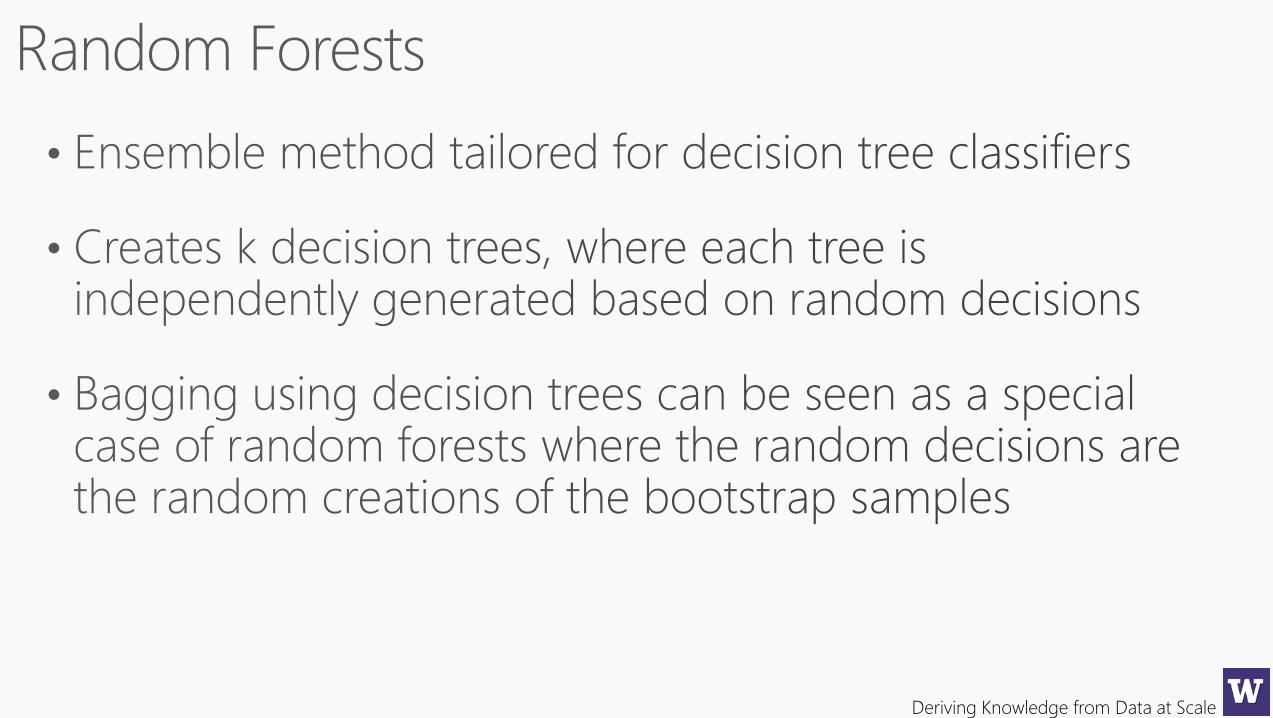
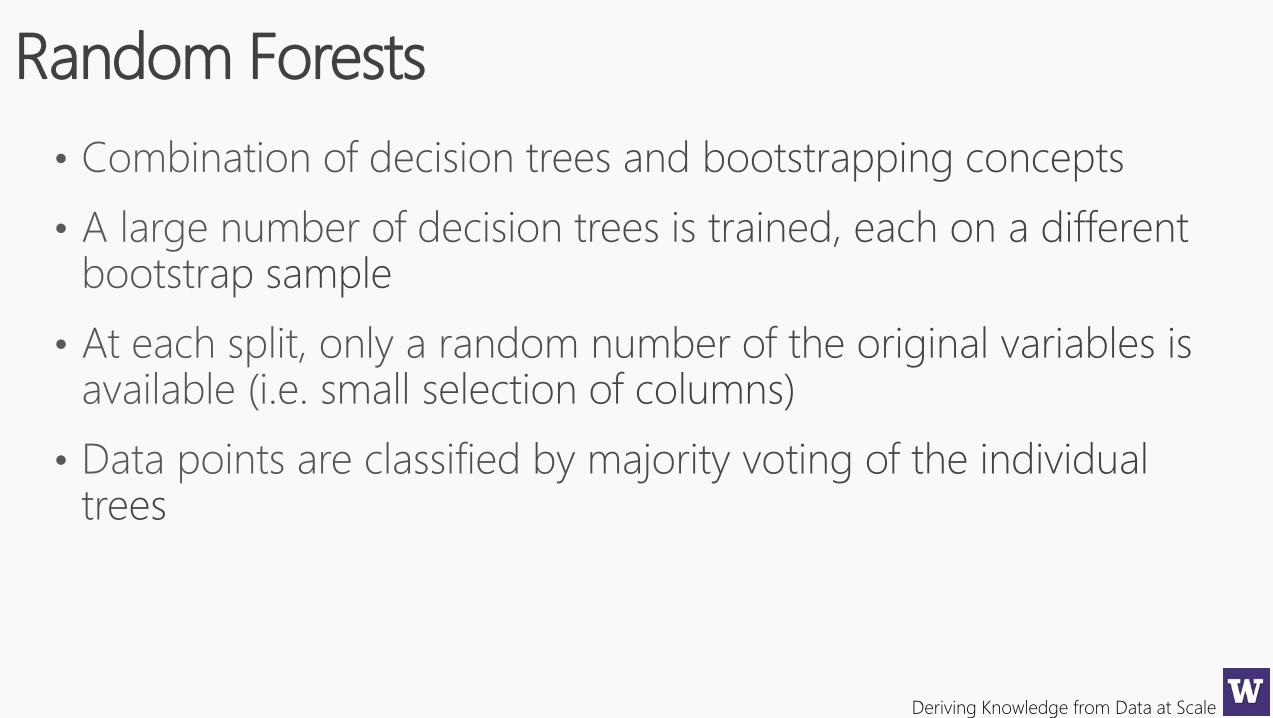
Random Forests
Deriving Knowledge from Data at Scale
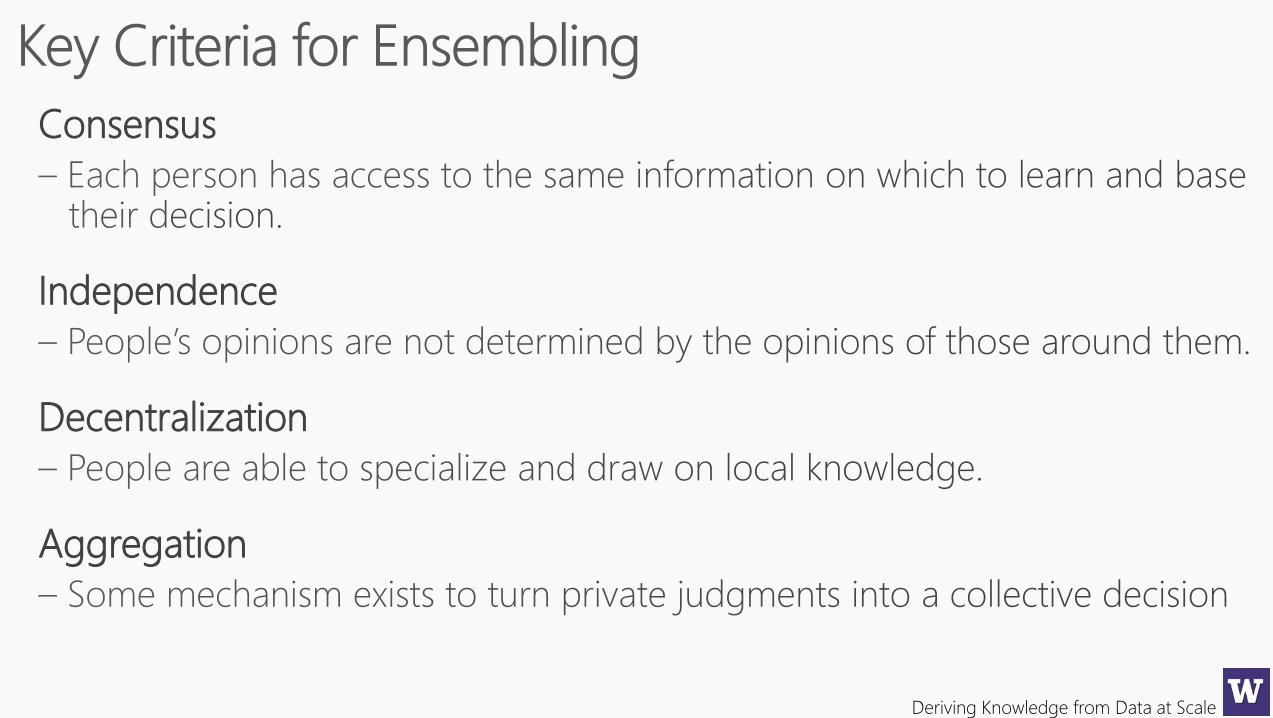
Consensus
Independence
Decentralization
Aggregation
Deriving Knowledge from Data at Scale
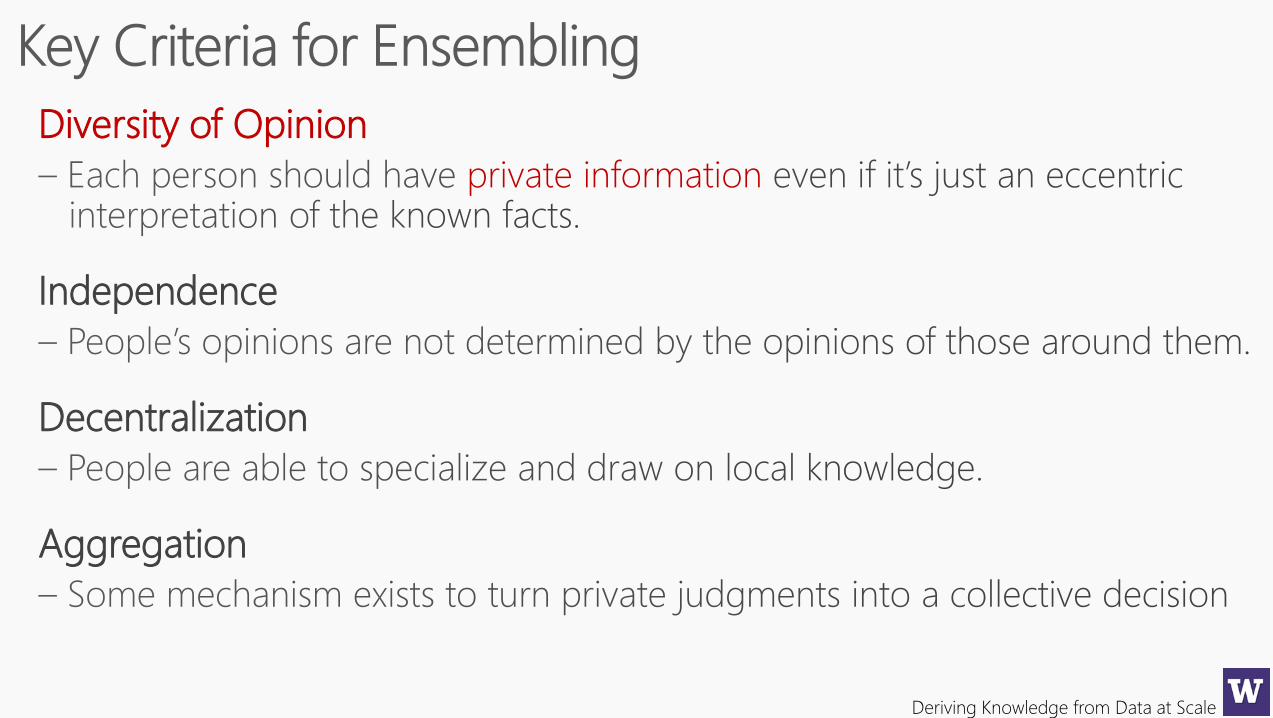
Diversity of Opinion
private information
Independence
Decentralization
Aggregation
Deriving Knowledge from Data at Scale
Deriving Knowledge from Data at Scale
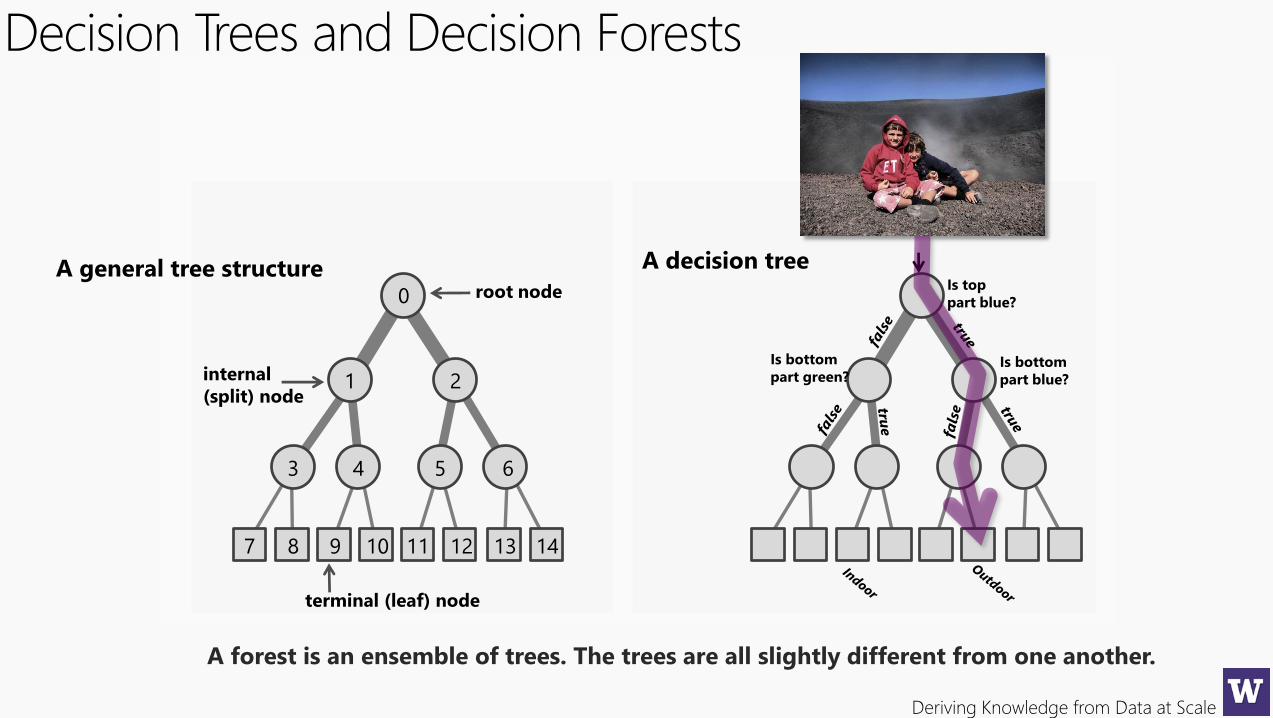
Decision Trees and Decision Forests
A forest is an ensemble of trees. The trees are all slightly different from one another.
terminal (leaf) node
internal
(split) node
root node0
1 2
3 4 5 6
7 8 9 10 11 12 13 14
A general tree structureIs top
part blue?
Is bottom
part green?Is bottom
part blue?
A decision tree
Deriving Knowledge from Data at Scale
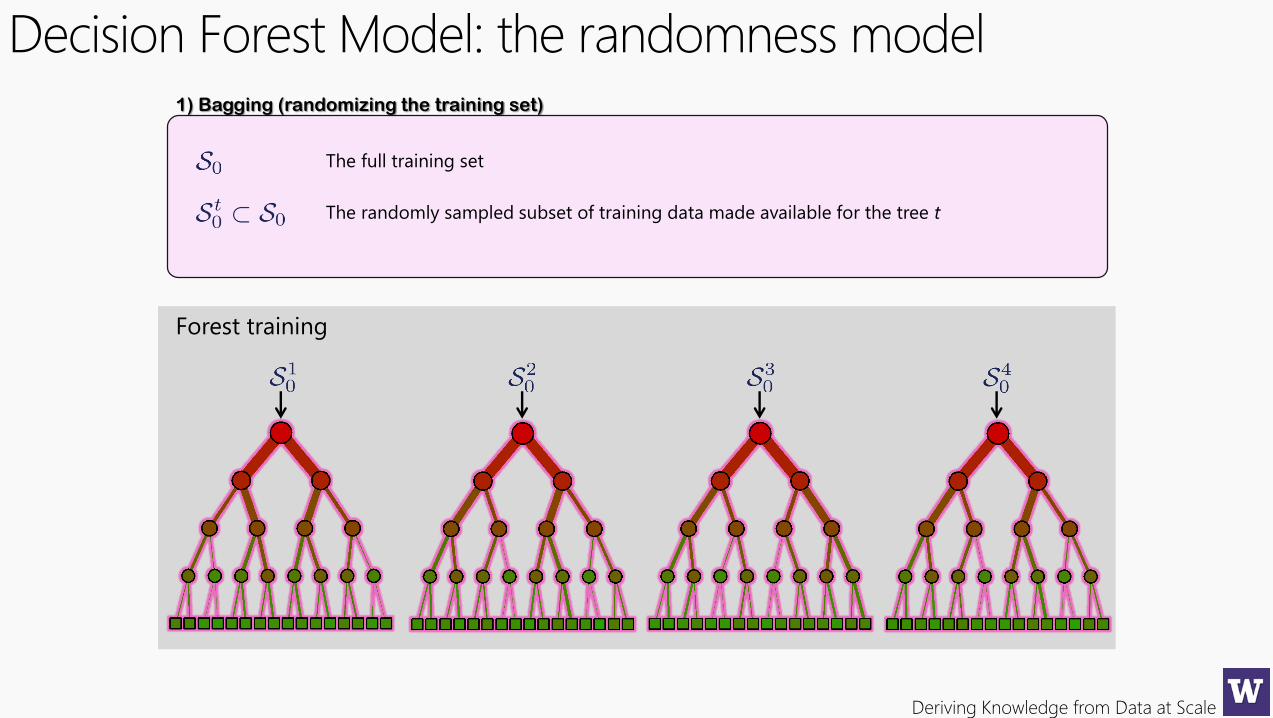
Decision Forest Model: the randomness model1) Bagging (randomizing the training set)
The full training set
The randomly sampled subset of training data made available for the tree t
Forest training
Deriving Knowledge from Data at Scale
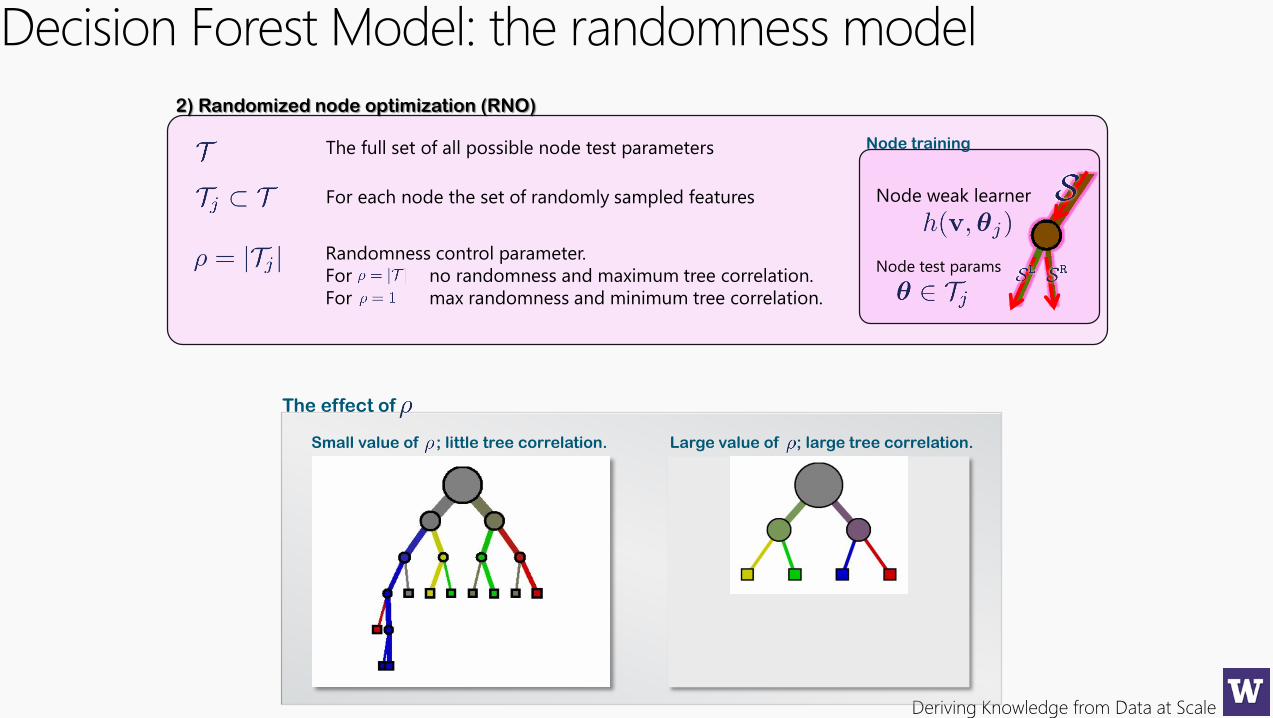
Decision Forest Model: the randomness model
The full set of all possible node test parameters
For each node the set of randomly sampled features
Randomness control parameter.
For no randomness and maximum tree correlation.
For max randomness and minimum tree correlation.
2) Randomized node optimization (RNO)
Small value of ; little tree correlation. Large value of ; large tree correlation.
The effect of
Node weak learner
Node test params
Node training
Deriving Knowledge from Data at Scale
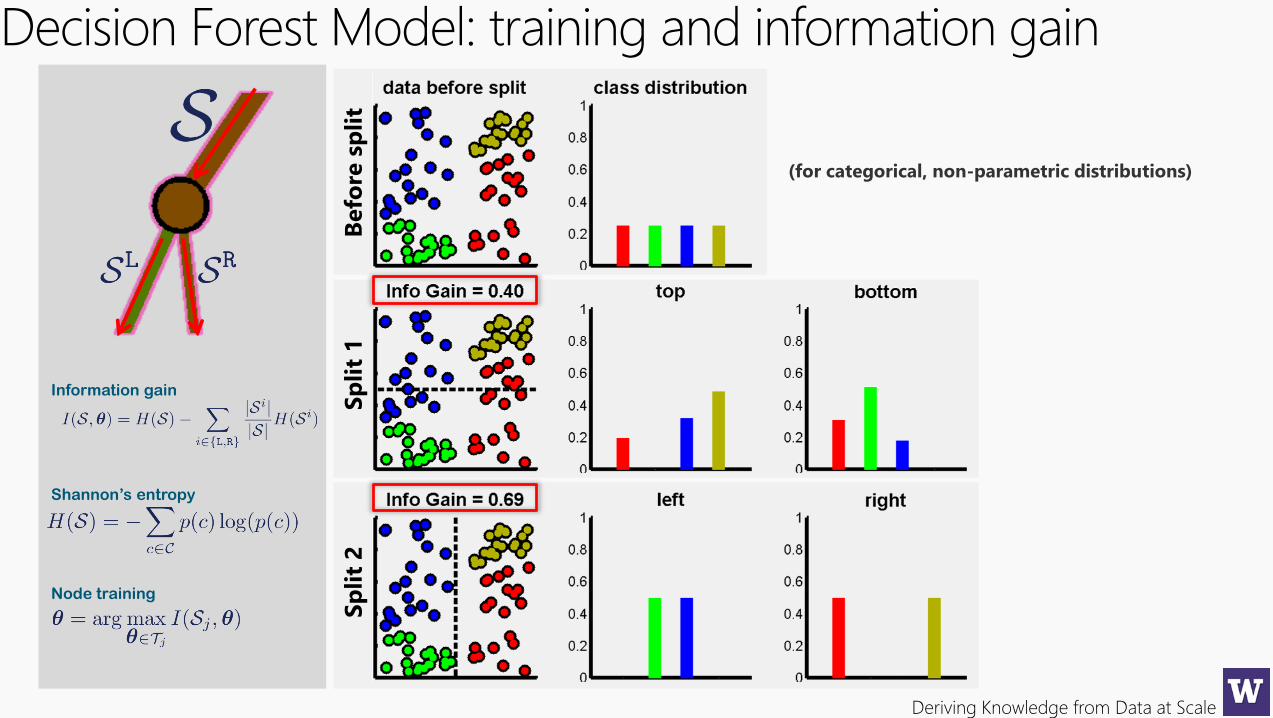
Decision Forest Model: training and information gain
Befo
re s
pli
t
Information gain
Shannon’s entropy
Node training
(for categorical, non-parametric distributions)
Sp
lit
1S
pli
t 2
Deriving Knowledge from Data at Scale
Why we prune…
Deriving Knowledge from Data at Scale
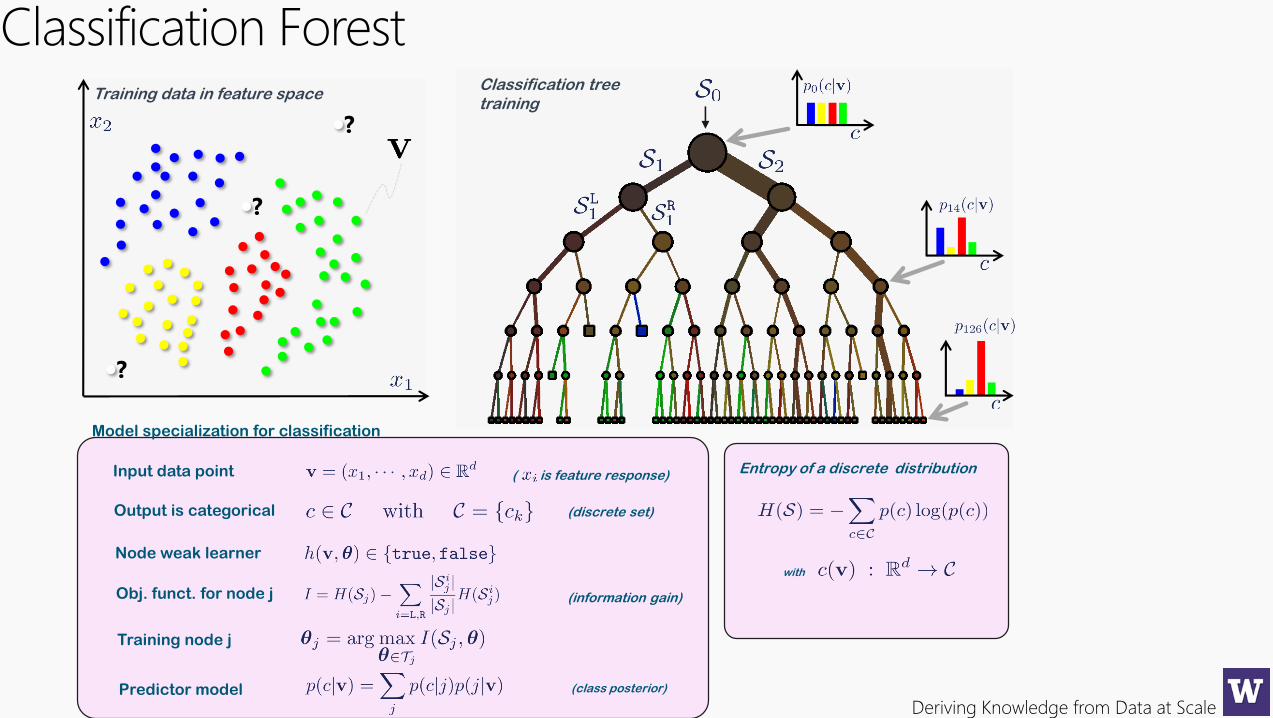
Classification ForestTraining data in feature space
?
?
?
Entropy of a discrete distribution
with
Classification treetraining
Obj. funct. for node j (information gain)
Training node j
Output is categorical
Input data point
Node weak learner
Predictor model (class posterior)
Model specialization for classification
( is feature response)
(discrete set)
Deriving Knowledge from Data at Scale
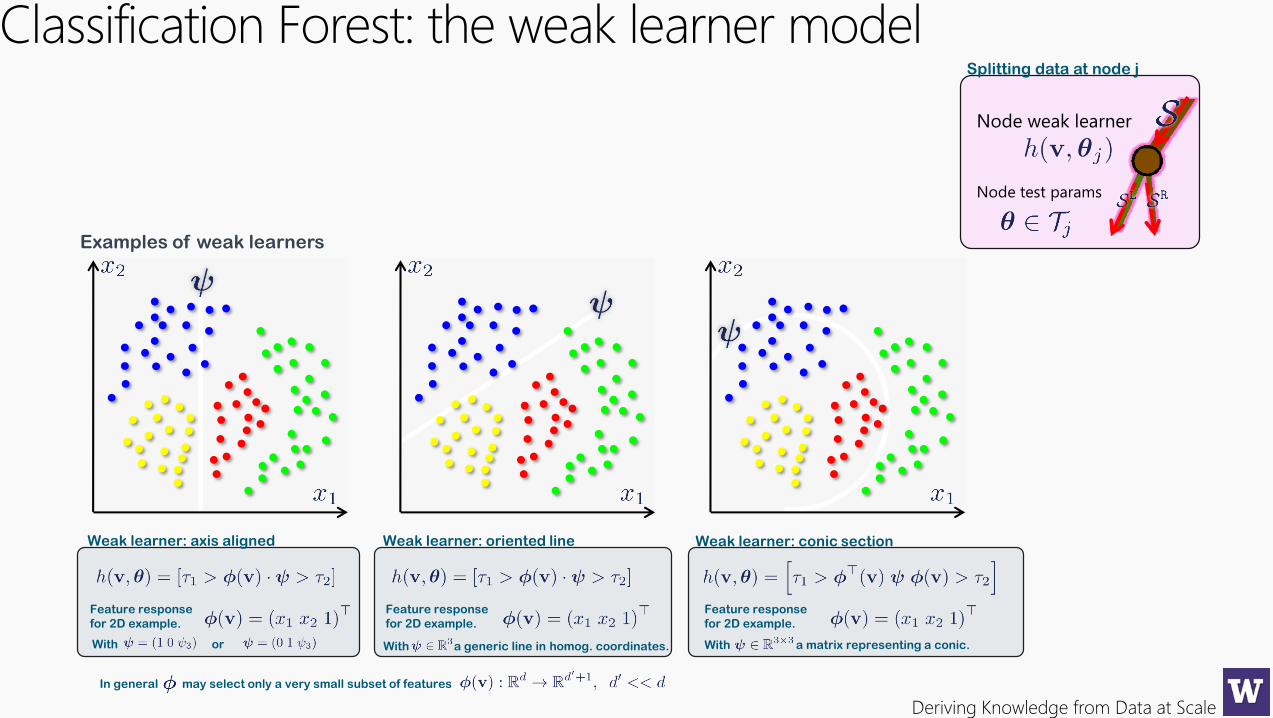
Classification Forest: the weak learner model
Node weak learner
Node test params
Splitting data at node j
Weak learner: axis aligned Weak learner: oriented line Weak learner: conic section
Examples of weak learners
Feature response
for 2D example.
With a generic line in homog. coordinates.
Feature response
for 2D example.
With a matrix representing a conic.
Feature response
for 2D example.
In general may select only a very small subset of features
With or
Deriving Knowledge from Data at Scale
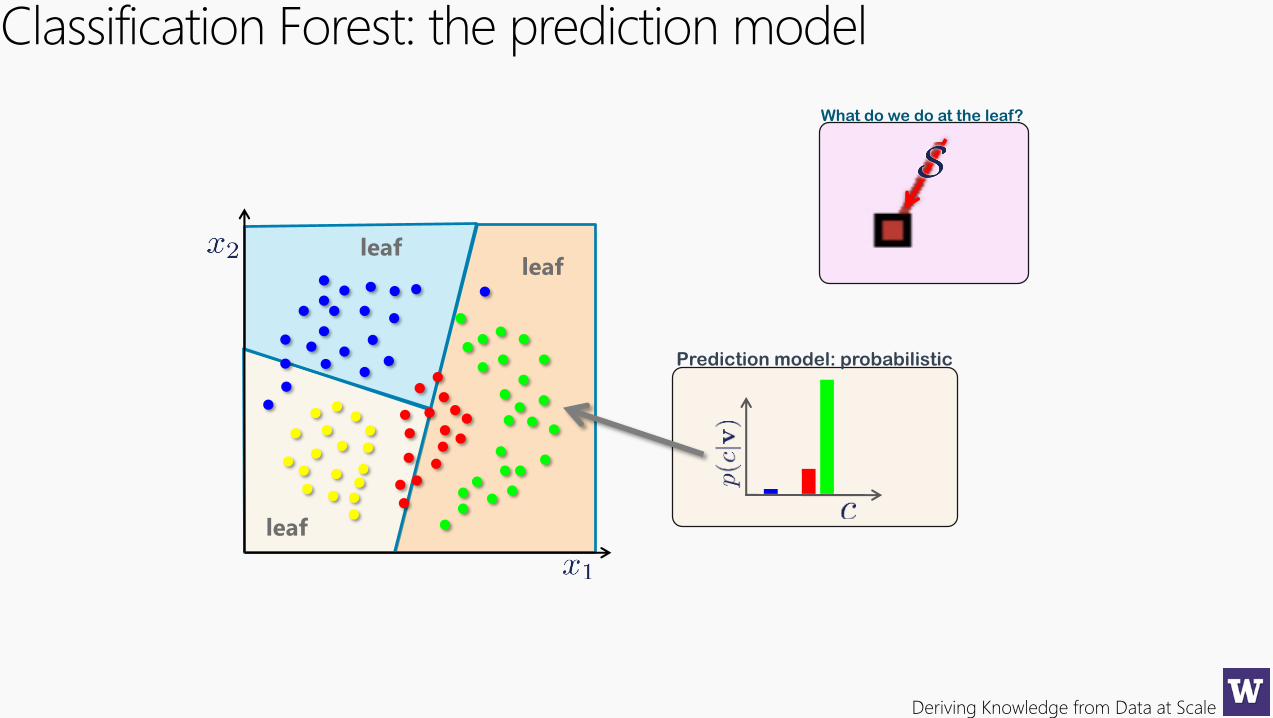
Classification Forest: the prediction model
What do we do at the leaf?
leafleaf
leaf
Prediction model: probabilistic
Deriving Knowledge from Data at Scale
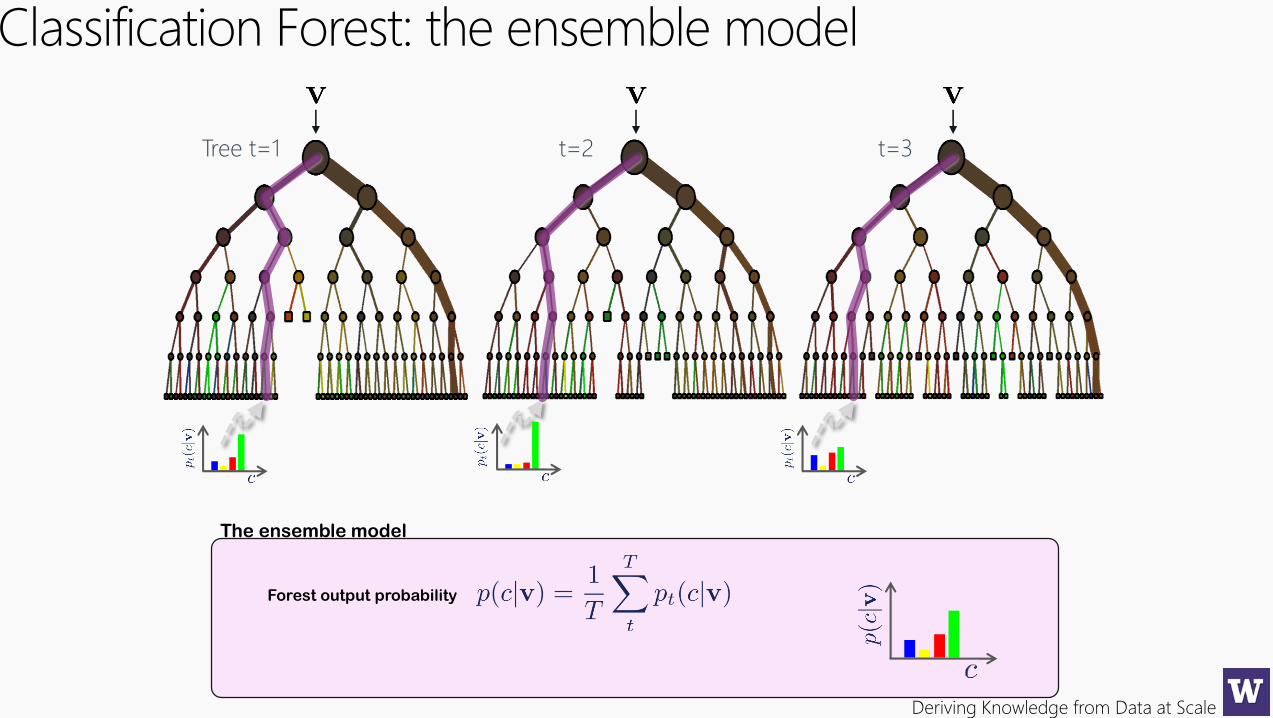
Classification Forest: the ensemble model
Tree t=1 t=2 t=3
Forest output probability
The ensemble model
Deriving Knowledge from Data at Scale
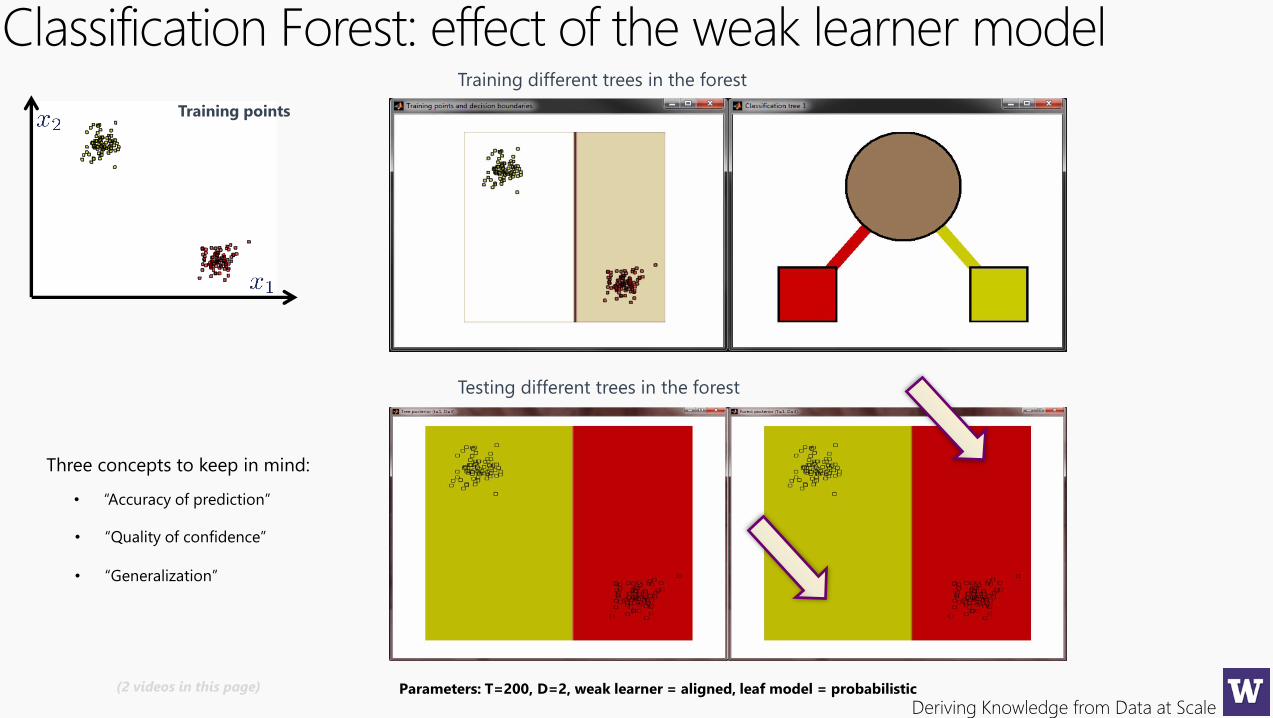
Training different trees in the forest
Testing different trees in the forest
(2 videos in this page)
Classification Forest: effect of the weak learner model
Parameters: T=200, D=2, weak learner = aligned, leaf model = probabilistic
• “Accuracy of prediction”
• “Quality of confidence”
• “Generalization”
Three concepts to keep in mind:
Training points
Deriving Knowledge from Data at Scale
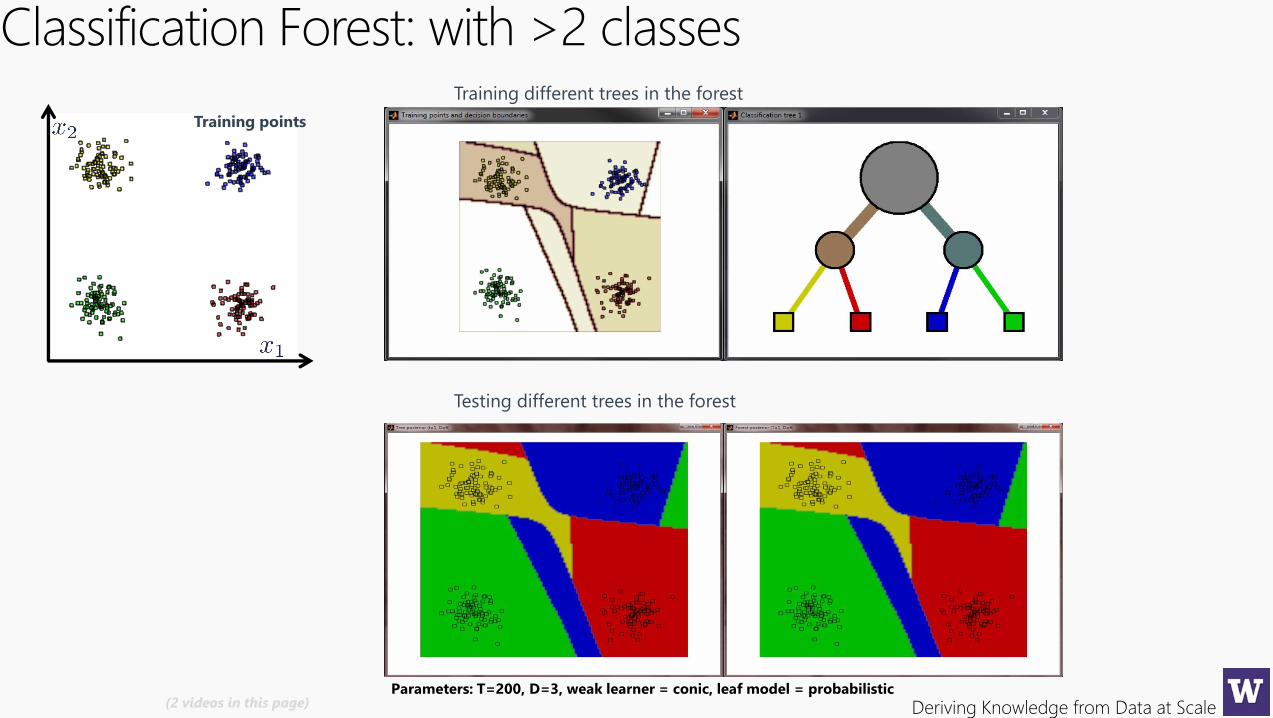
Classification Forest: with >2 classesTraining different trees in the forest
Testing different trees in the forest
Parameters: T=200, D=3, weak learner = conic, leaf model = probabilistic(2 videos in this page)
Training points
Deriving Knowledge from Data at Scale
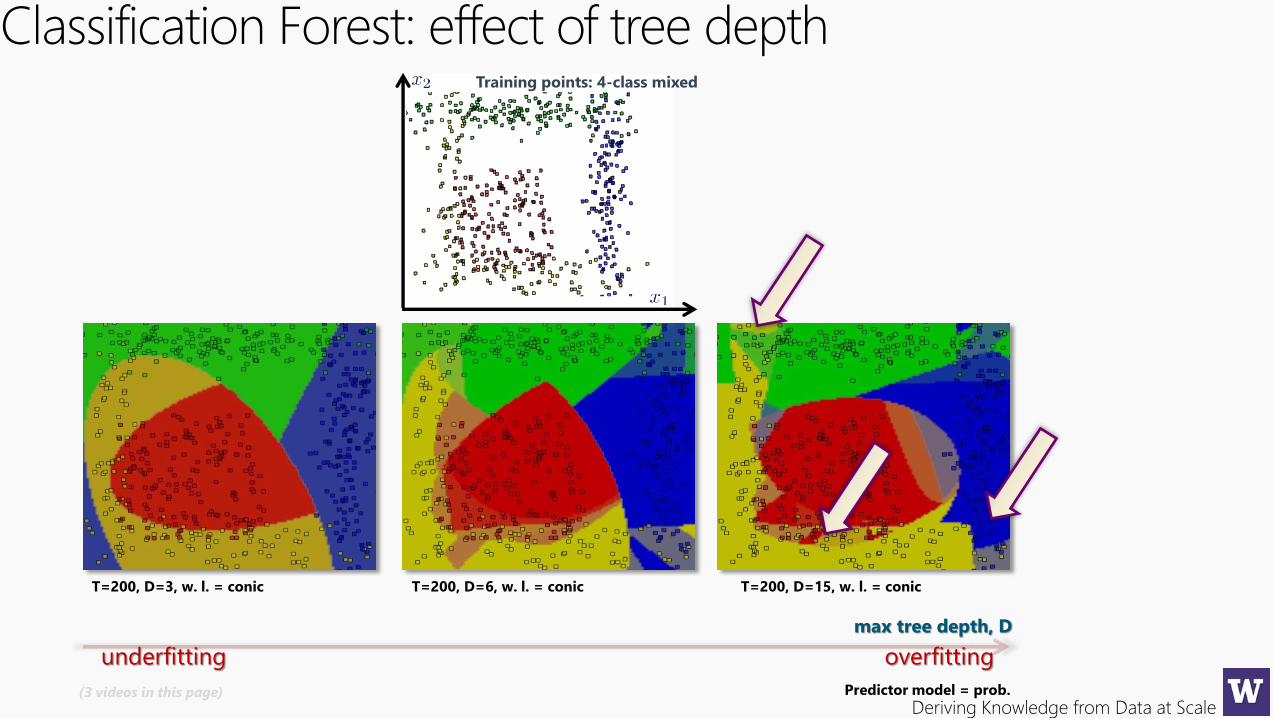
Classification Forest: effect of tree depth
max tree depth, D
overfittingunderfitting
T=200, D=3, w. l. = conic T=200, D=6, w. l. = conic T=200, D=15, w. l. = conic
Predictor model = prob.(3 videos in this page)
Training points: 4-class mixed
Deriving Knowledge from Data at Scale
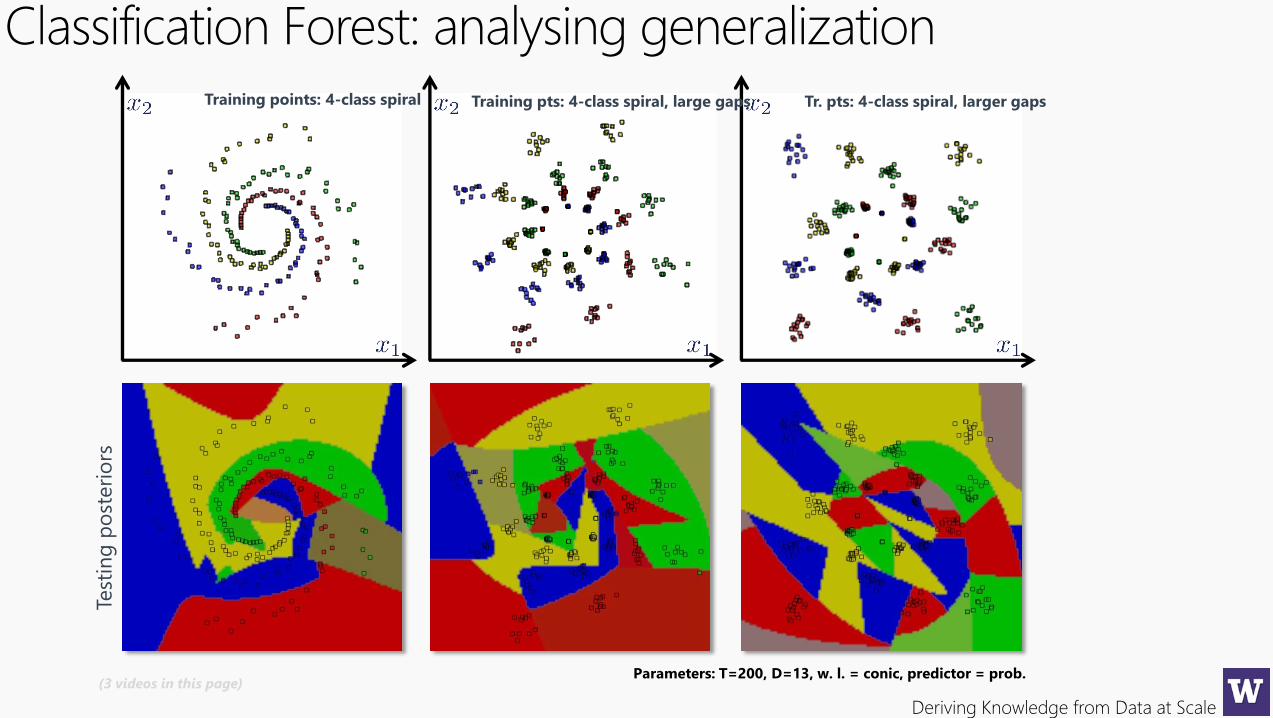
Classification Forest: analysing generalization
Parameters: T=200, D=13, w. l. = conic, predictor = prob.(3 videos in this page)
Training points: 4-class spiral Training pts: 4-class spiral, large gaps Tr. pts: 4-class spiral, larger gapsTe
stin
g p
ost
eri
ors
Deriving Knowledge from Data at Scale
Q

Deriving Knowledge from Data at Scale

Deriving Knowledge from Data at Scale
10 Minute Break…
Deriving Knowledge from Data at Scale
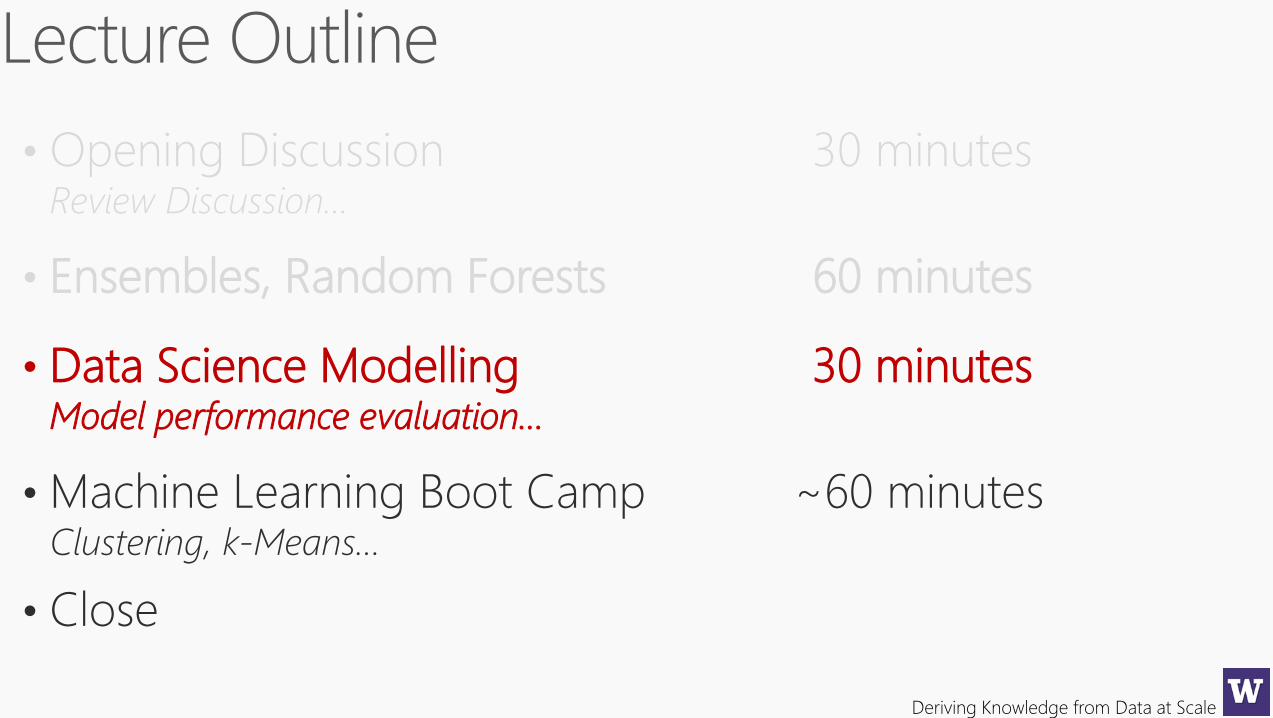
• Opening Discussion 30 minutesReview Discussion…
• Ensembles, Random Forests 60 minutes
• Data Science Modelling 30 minutesModel performance evaluation…
• Machine Learning Boot Camp ~60 minutesClustering, k-Means…
• Close
Deriving Knowledge from Data at Scale
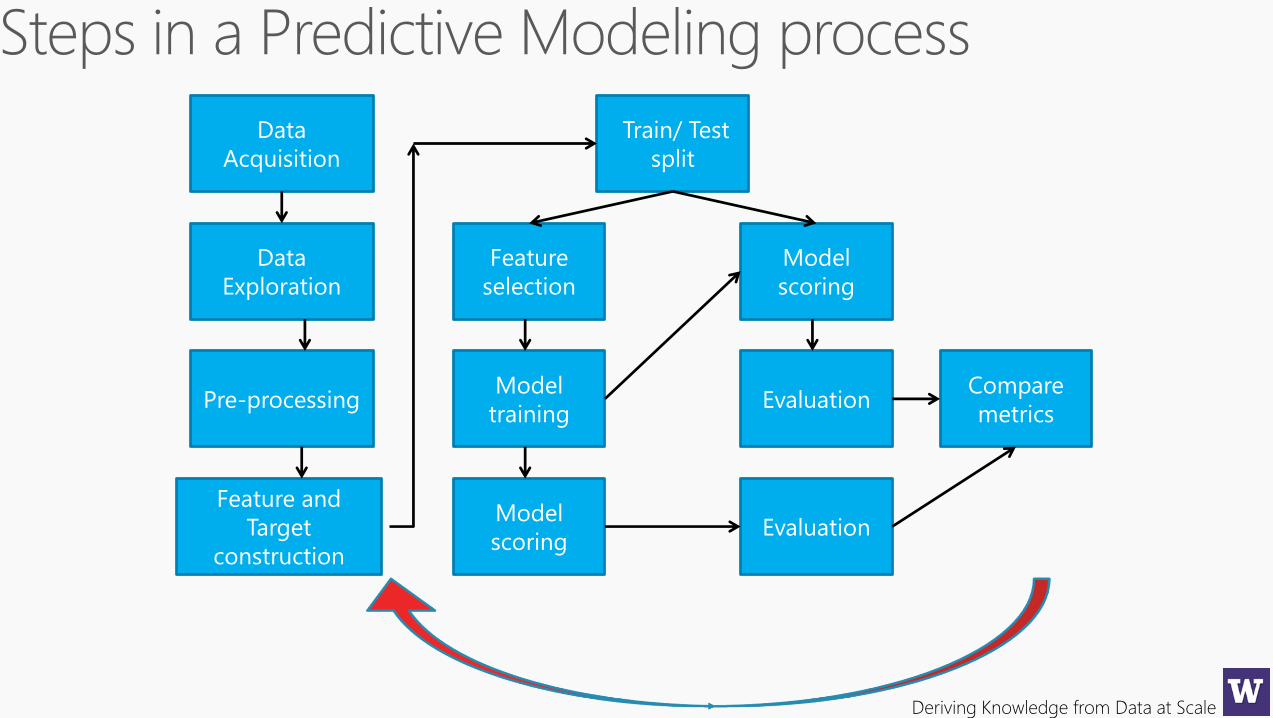
Data
Acquisition
Data
Exploration
Pre-processing
Feature and
Target
construction
Train/ Test
split
Feature
selection
Model
training
Model
scoring
Model
scoring
Evaluation
Evaluation
Compare
metrics
Deriving Knowledge from Data at Scale
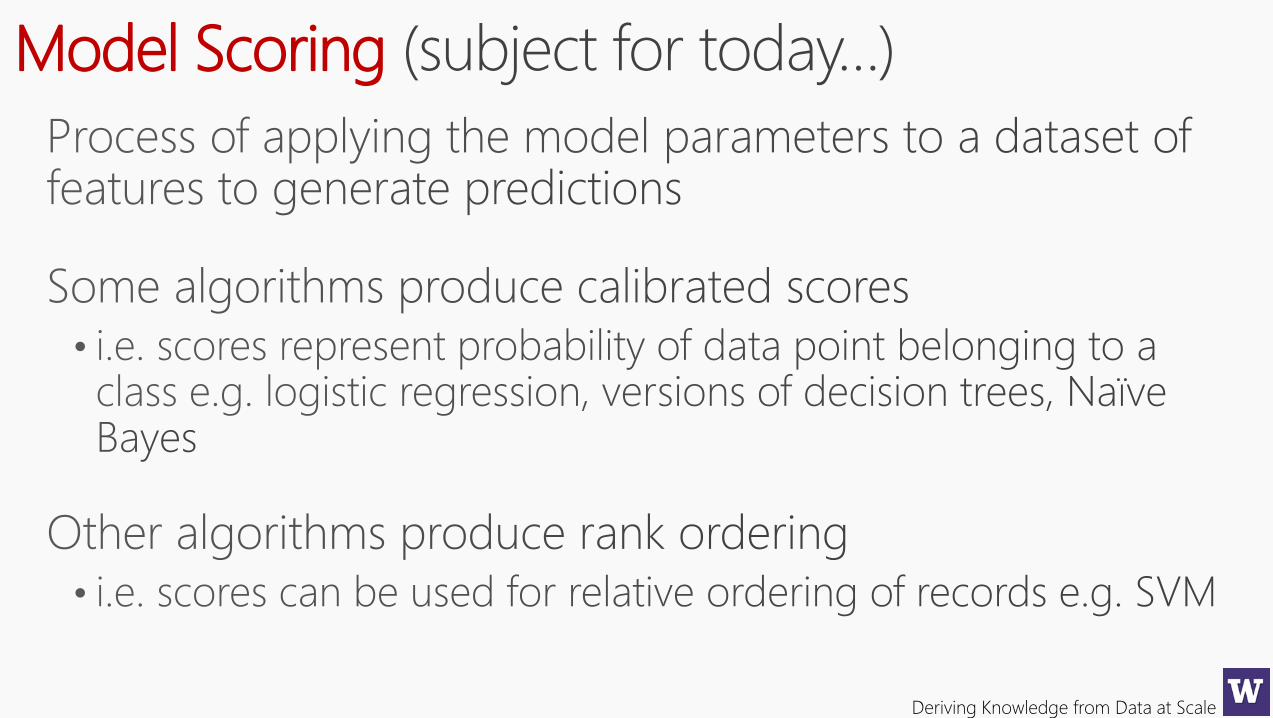
Model Scoring (subject for today…)
Deriving Knowledge from Data at Scale
Deriving Knowledge from Data at Scale
Deriving Knowledge from Data at Scale
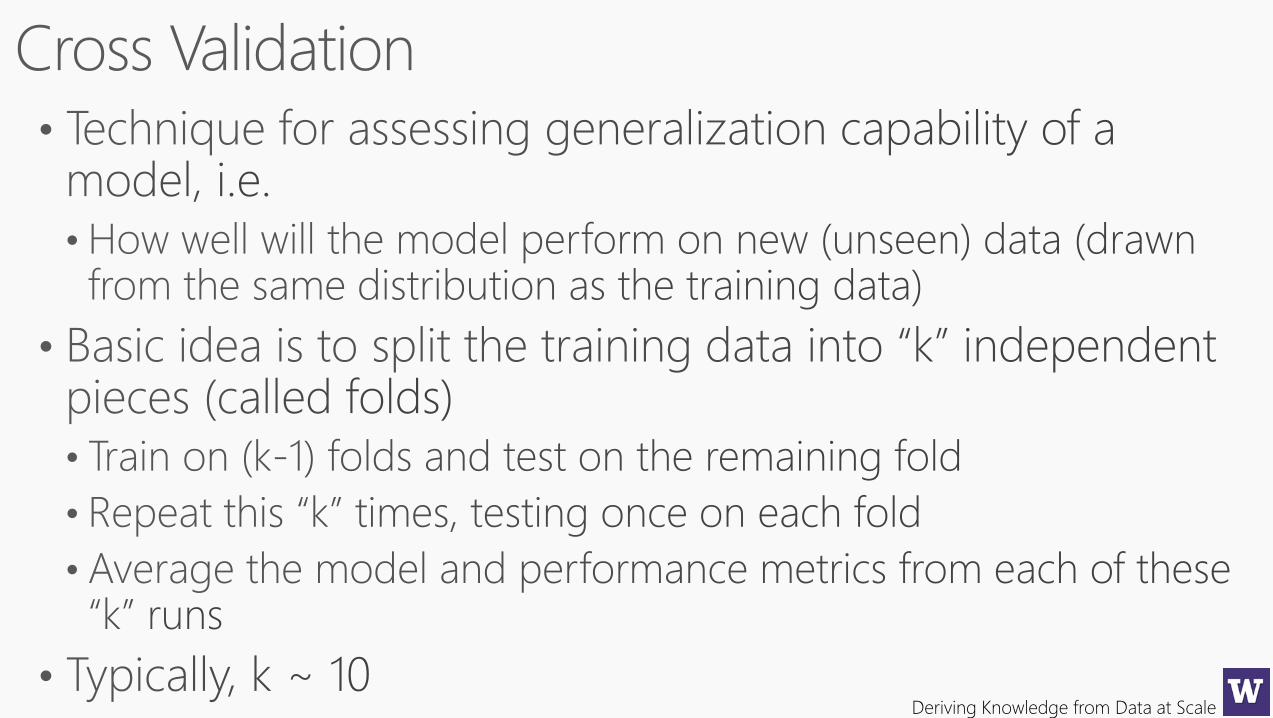
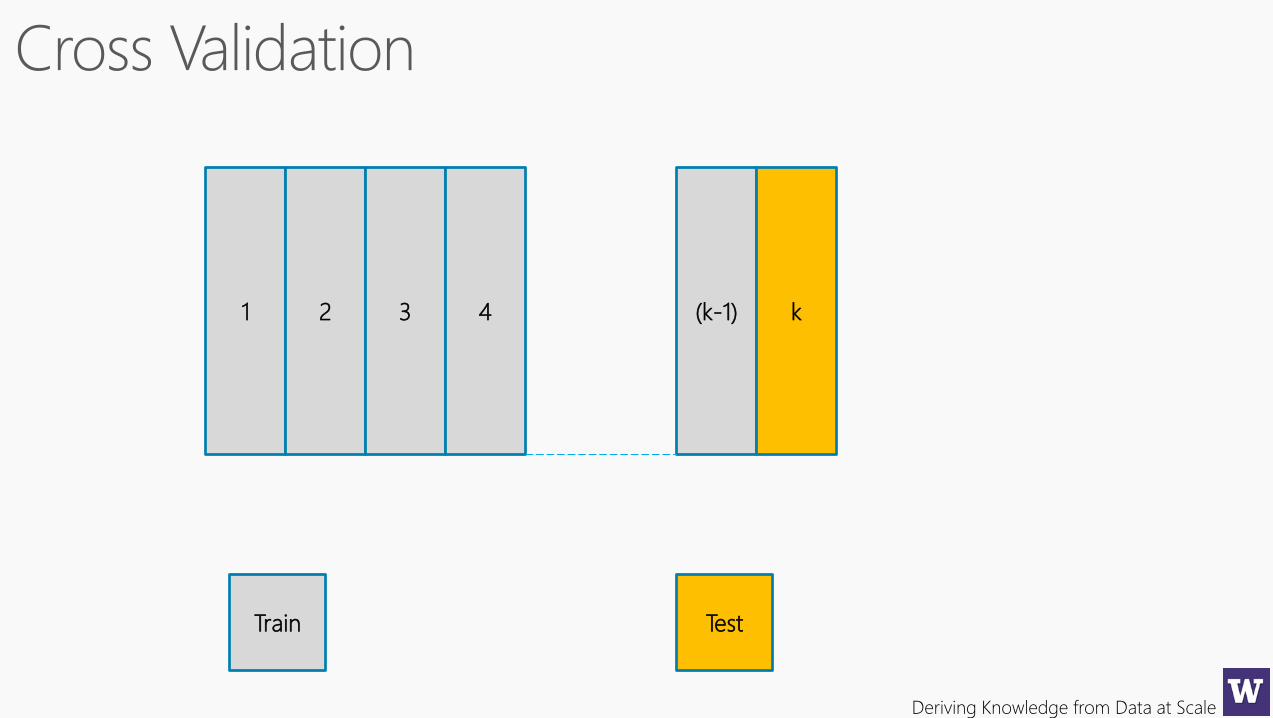
1 2 3 4 (k-1) k
Train Test
Deriving Knowledge from Data at Scale
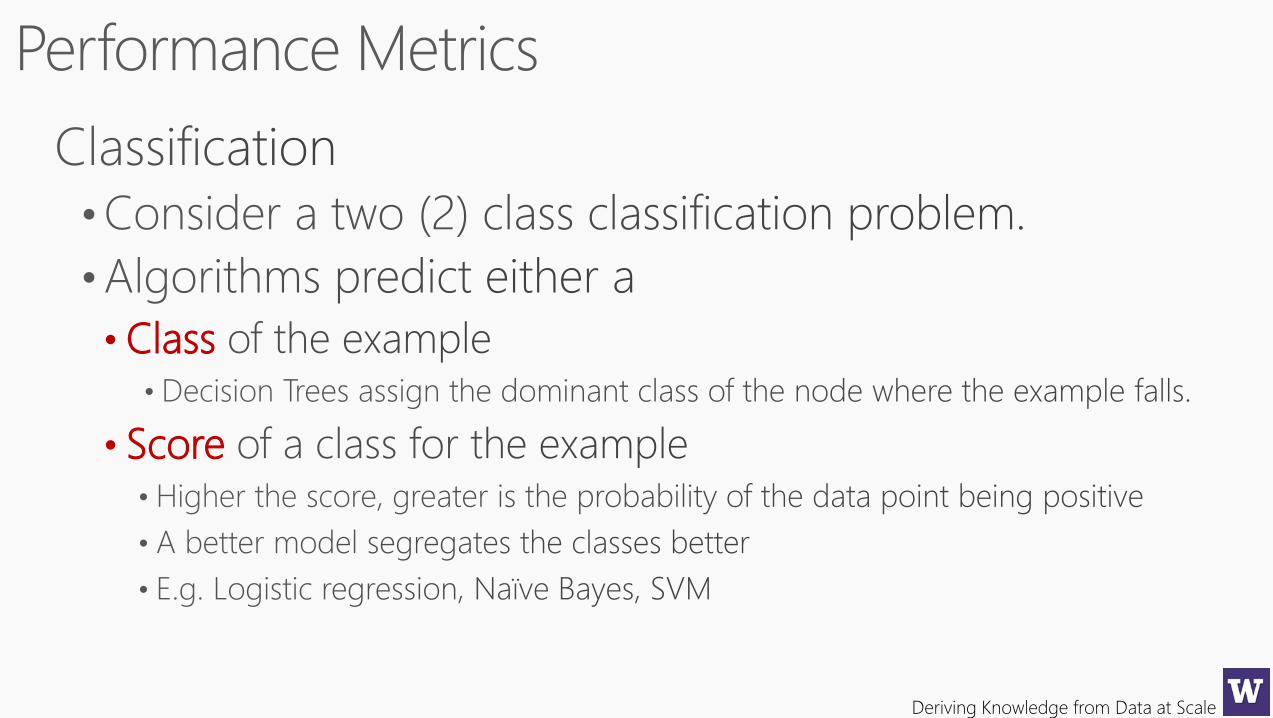
• Class
• Score
Deriving Knowledge from Data at Scale
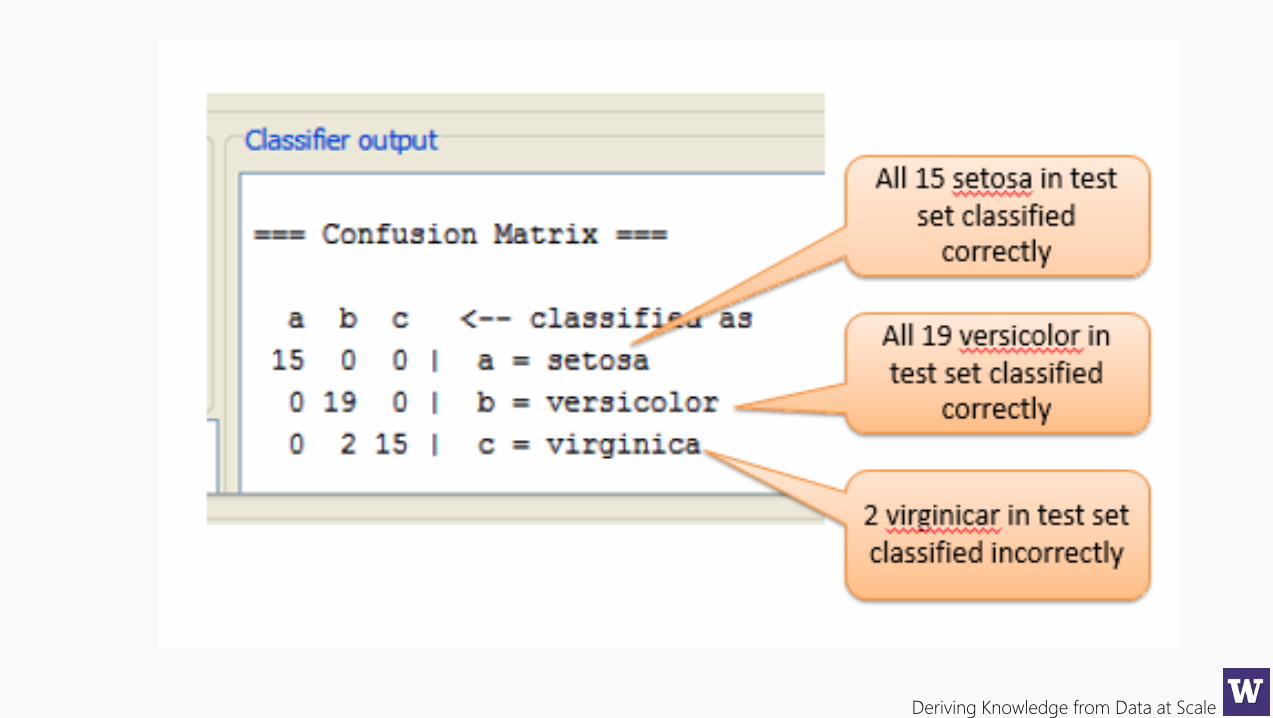
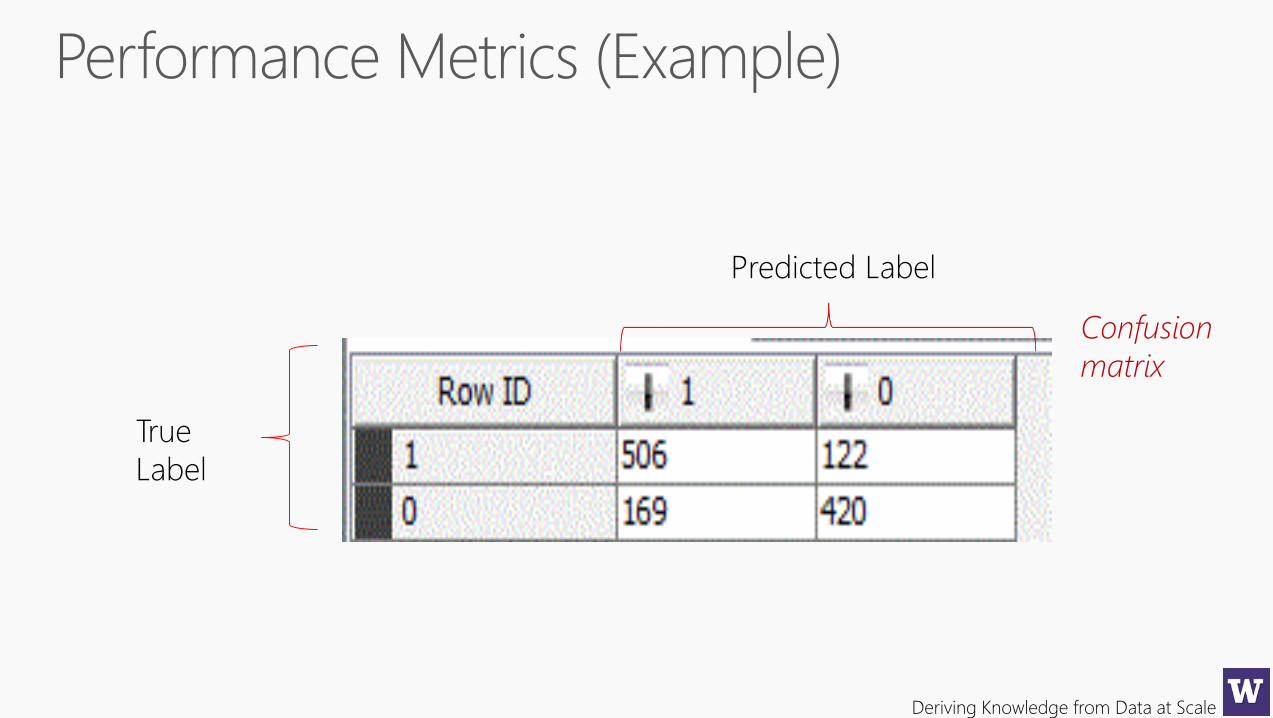
True
Label
Predicted Label
Confusion
matrix
Deriving Knowledge from Data at Scale
Deriving Knowledge from Data at Scale
Deriving Knowledge from Data at Scale
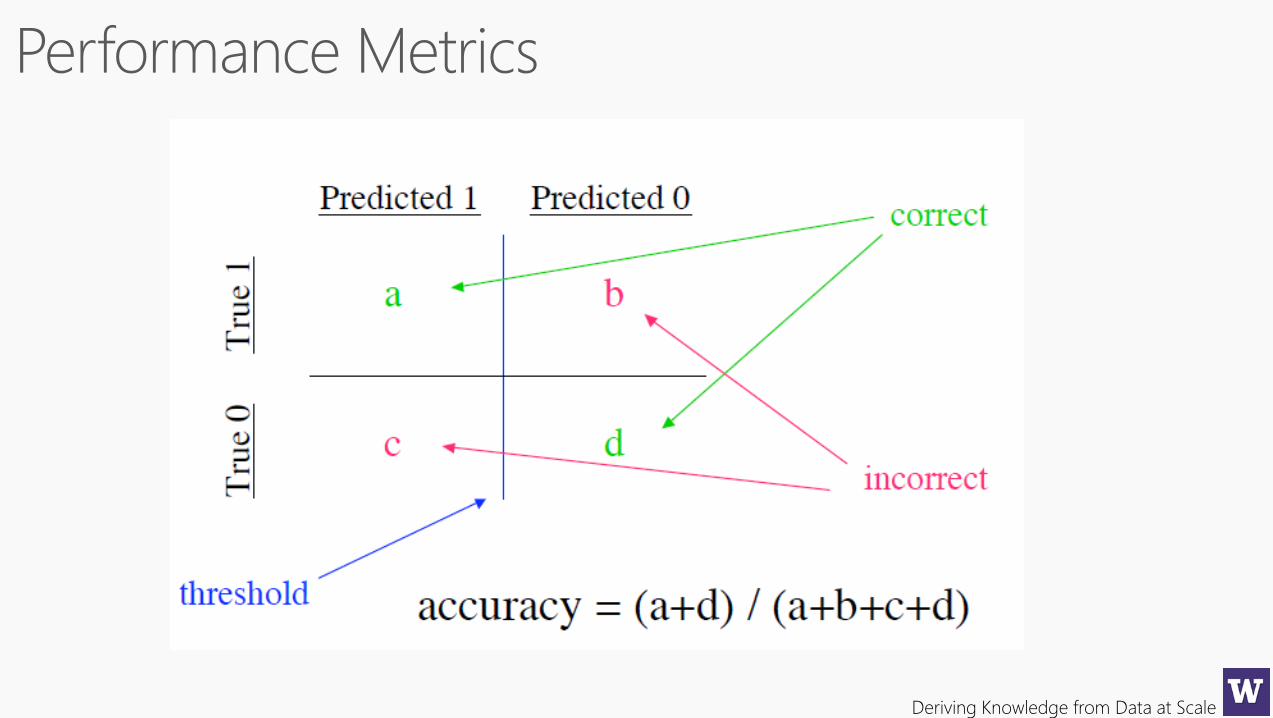
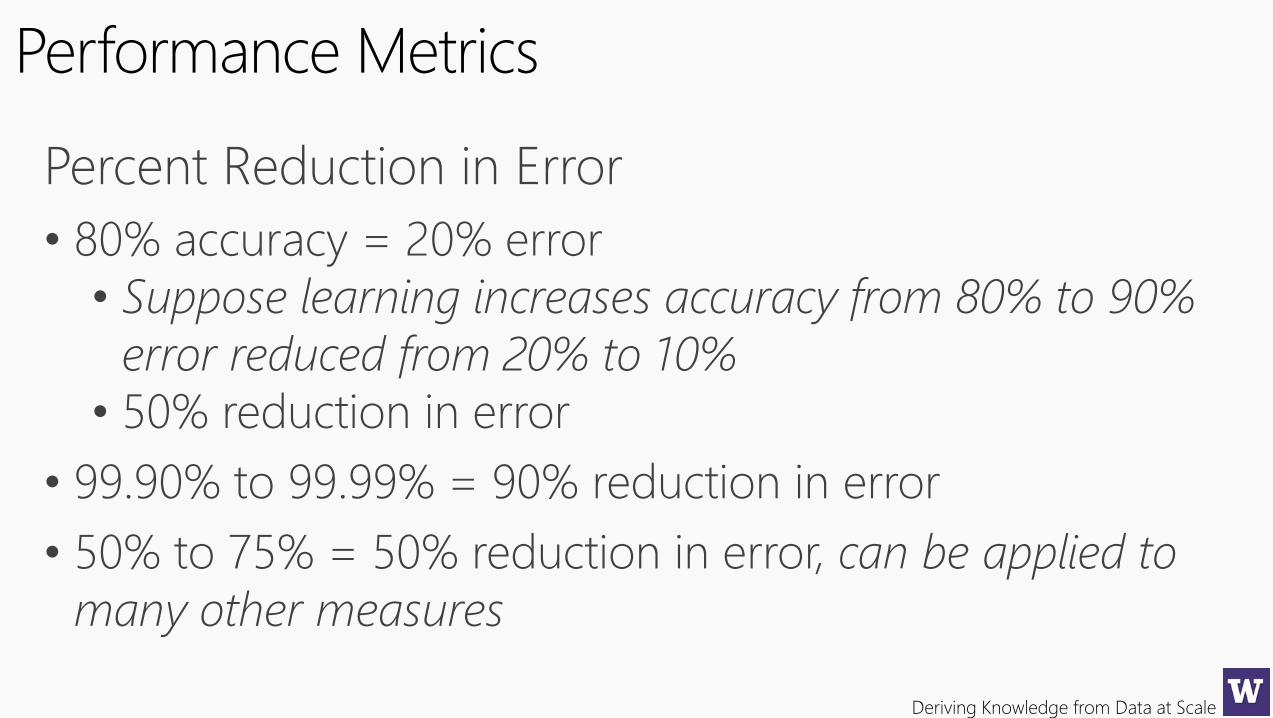
Performance Metrics
Percent Reduction in Error
• 80% accuracy = 20% error
• Suppose learning increases accuracy from 80% to 90%
error reduced from 20% to 10%
• 50% reduction in error
• 99.90% to 99.99% = 90% reduction in error
• 50% to 75% = 50% reduction in error, can be applied to
many other measures
Deriving Knowledge from Data at Scale
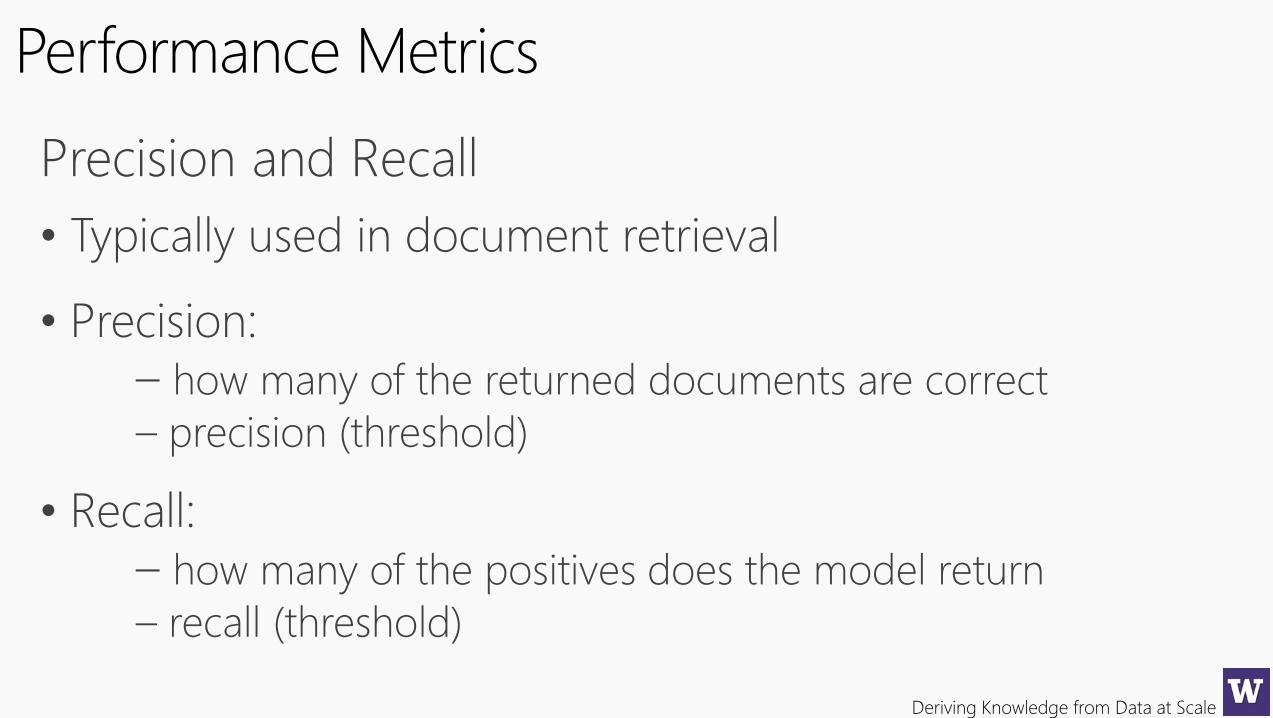
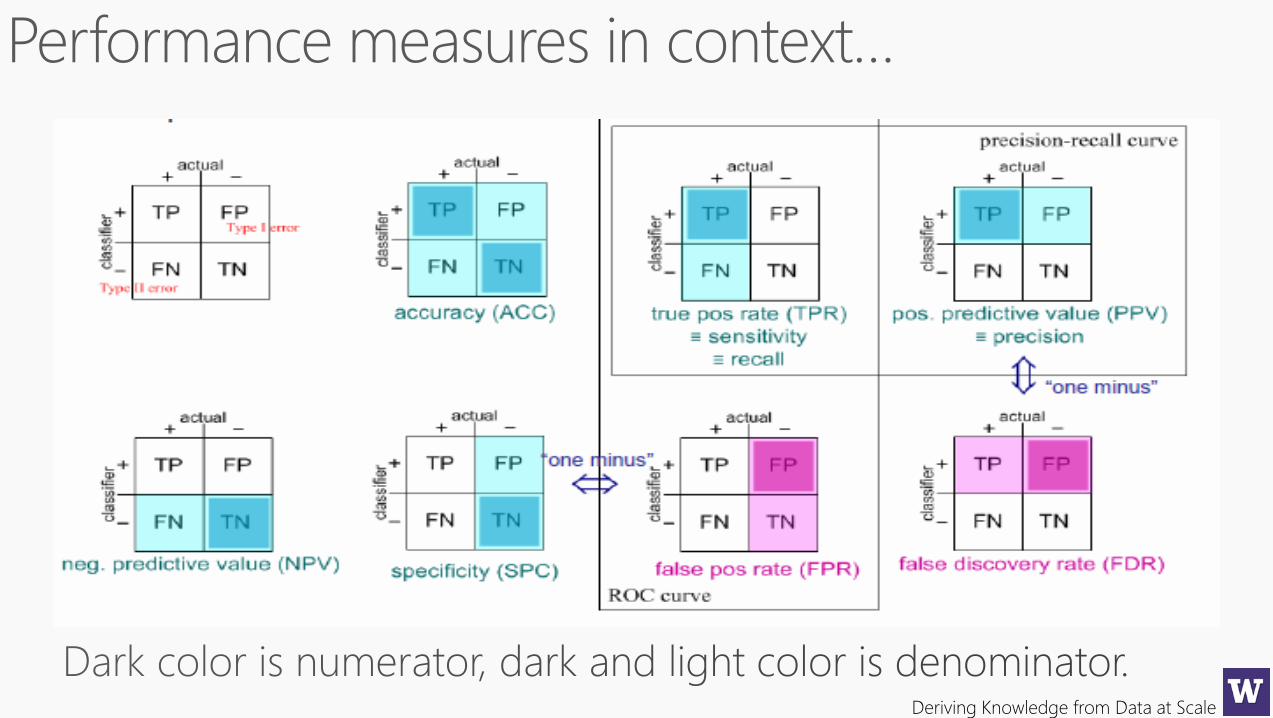
Performance Metrics
Precision and Recall
• Typically used in document retrieval
• Precision:
– how many of the returned documents are correct
– precision (threshold)
• Recall:
– how many of the positives does the model return
– recall (threshold)
Deriving Knowledge from Data at Scale
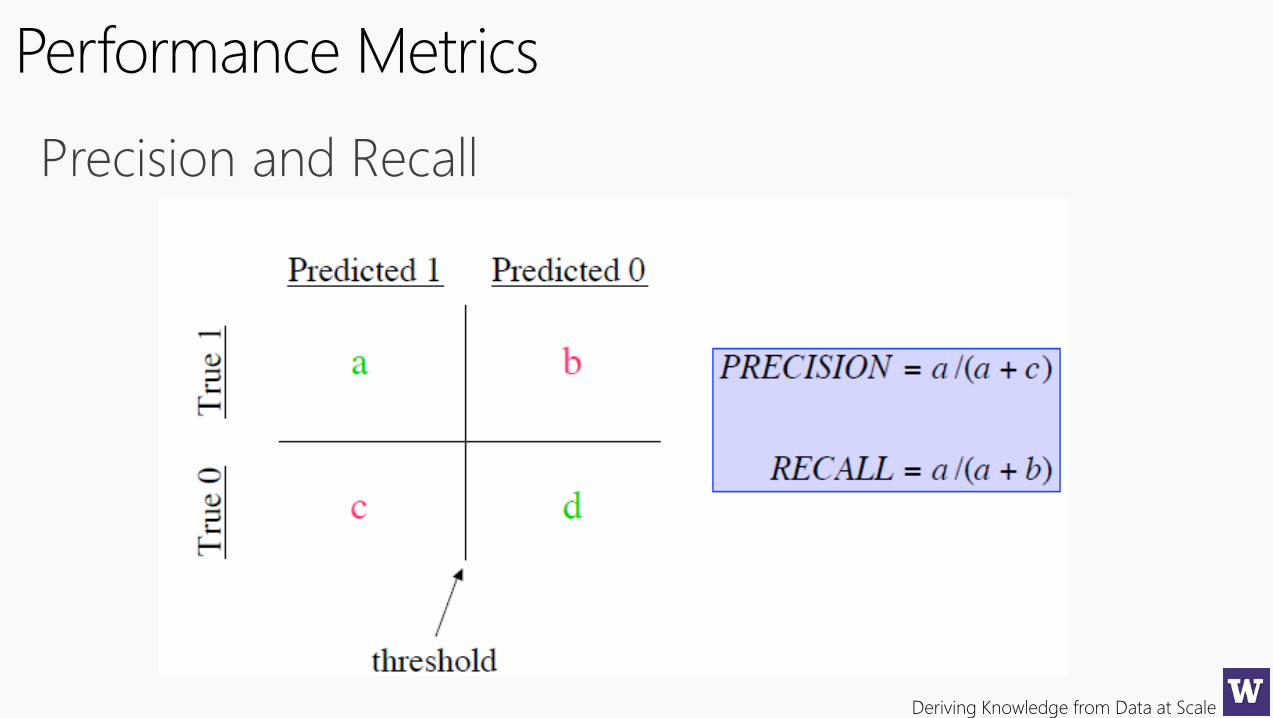
Performance Metrics
Precision and Recall
Deriving Knowledge from Data at Scale
Deriving Knowledge from Data at Scale
Next week we will go deeper with ROC curves, kappa, lift charts, etc…
Deriving Knowledge from Data at Scale
Deriving Knowledge from Data at Scale
• Opening Discussion 30 minutesReview Discussion…
• Ensembles, Random Forests 60 minutes
• Break 5 minutes
• Data Science Modelling 30 minutesModel performance evaluation…
• Machine Learning Boot Camp ~60 minutesClustering, k-Means…
• Close
Deriving Knowledge from Data at Scale
similar
unsupervised learning
data exploration
Deriving Knowledge from Data at Scale
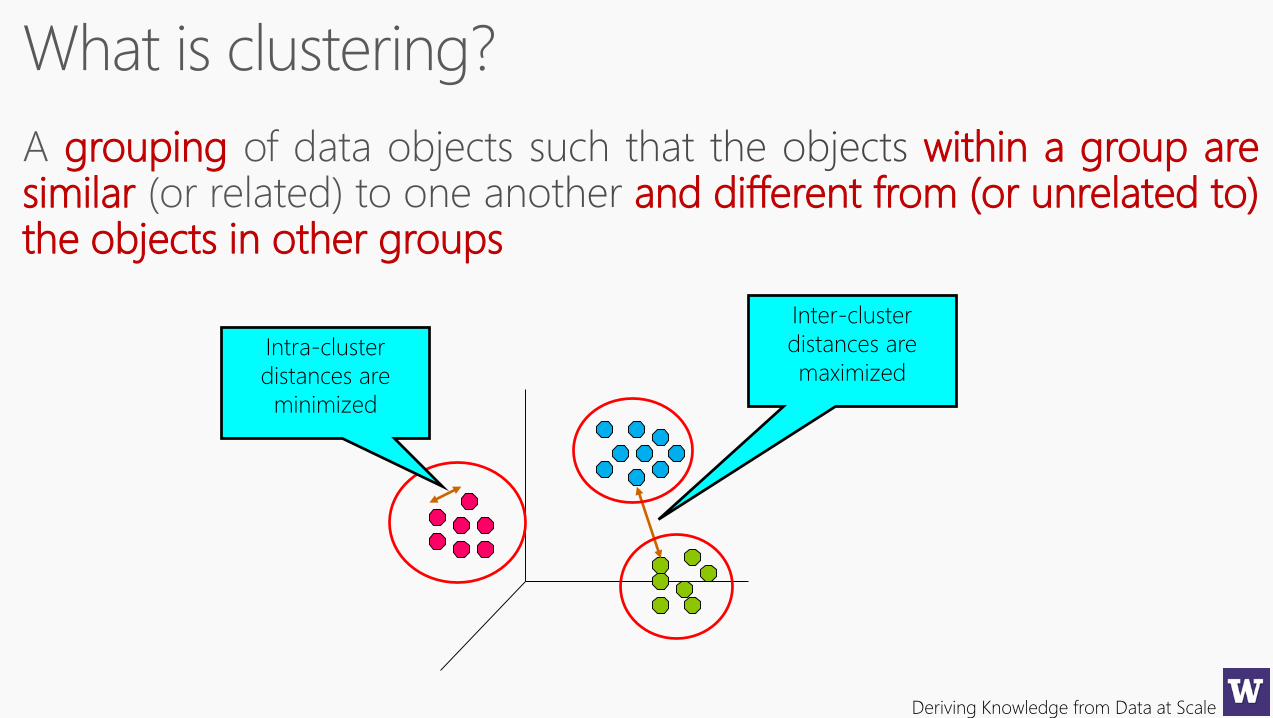
grouping within a group aresimilar and different from (or unrelated to)the objects in other groups
Inter-cluster
distances are
maximizedIntra-cluster
distances are
minimized
Deriving Knowledge from Data at Scale
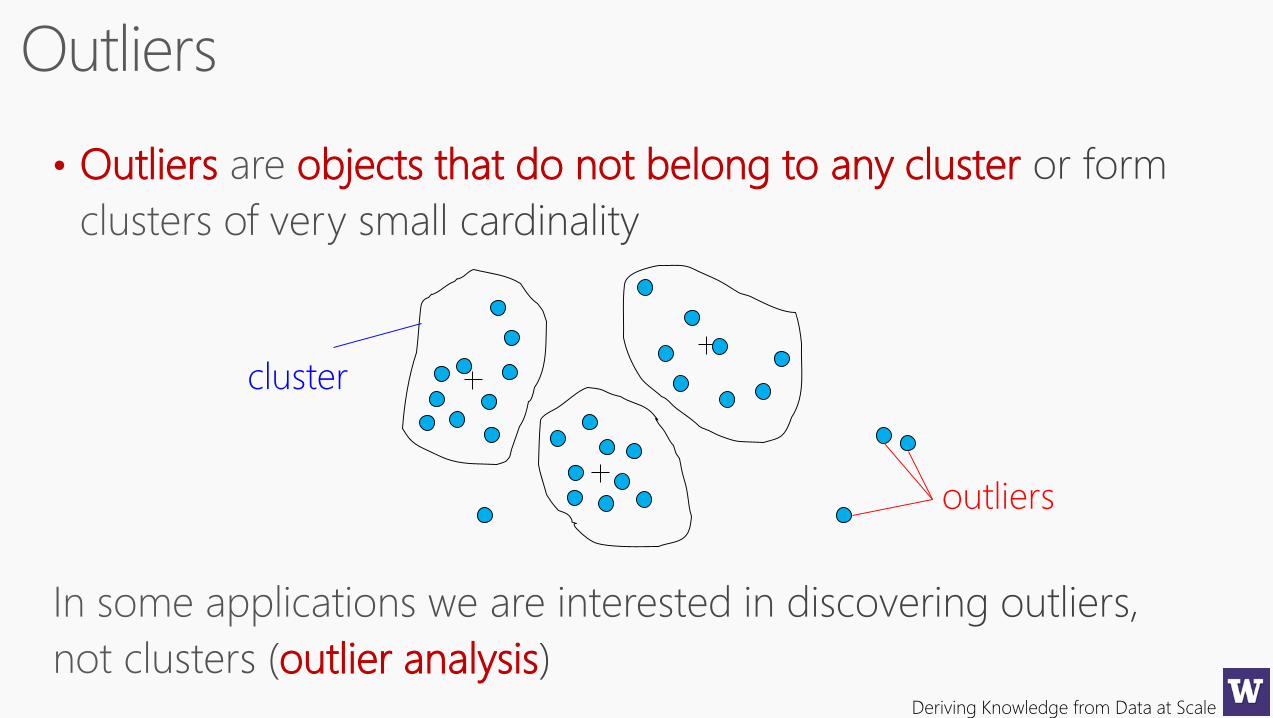
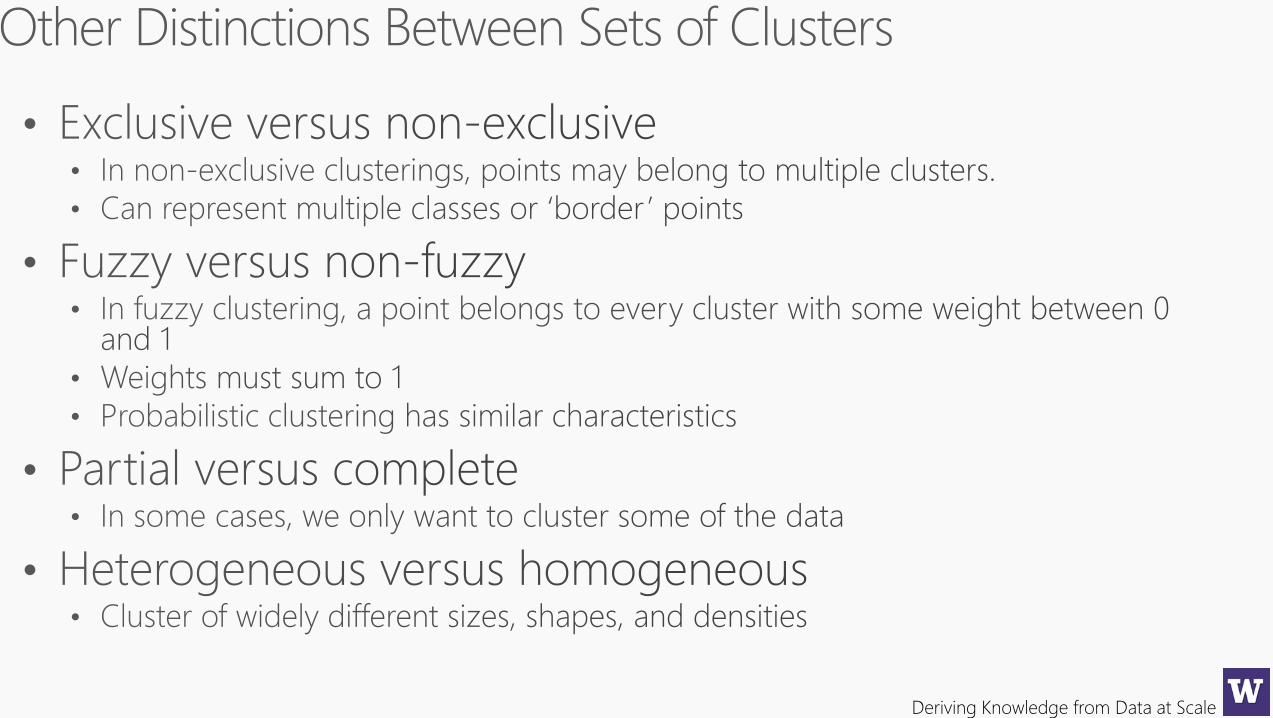
• Outliers objects that do not belong to any cluster
outlier analysis
cluster
outliers
Deriving Knowledge from Data at Scale
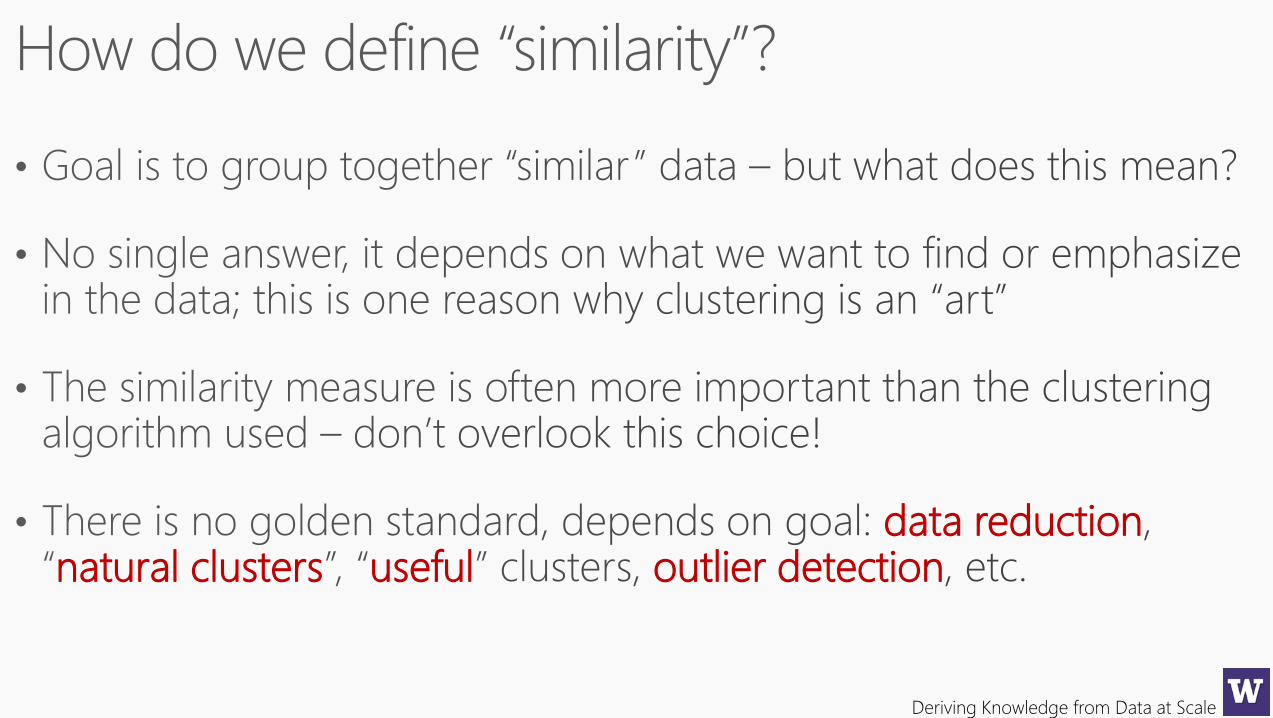
data reductionnatural clusters useful outlier detection
Deriving Knowledge from Data at Scale
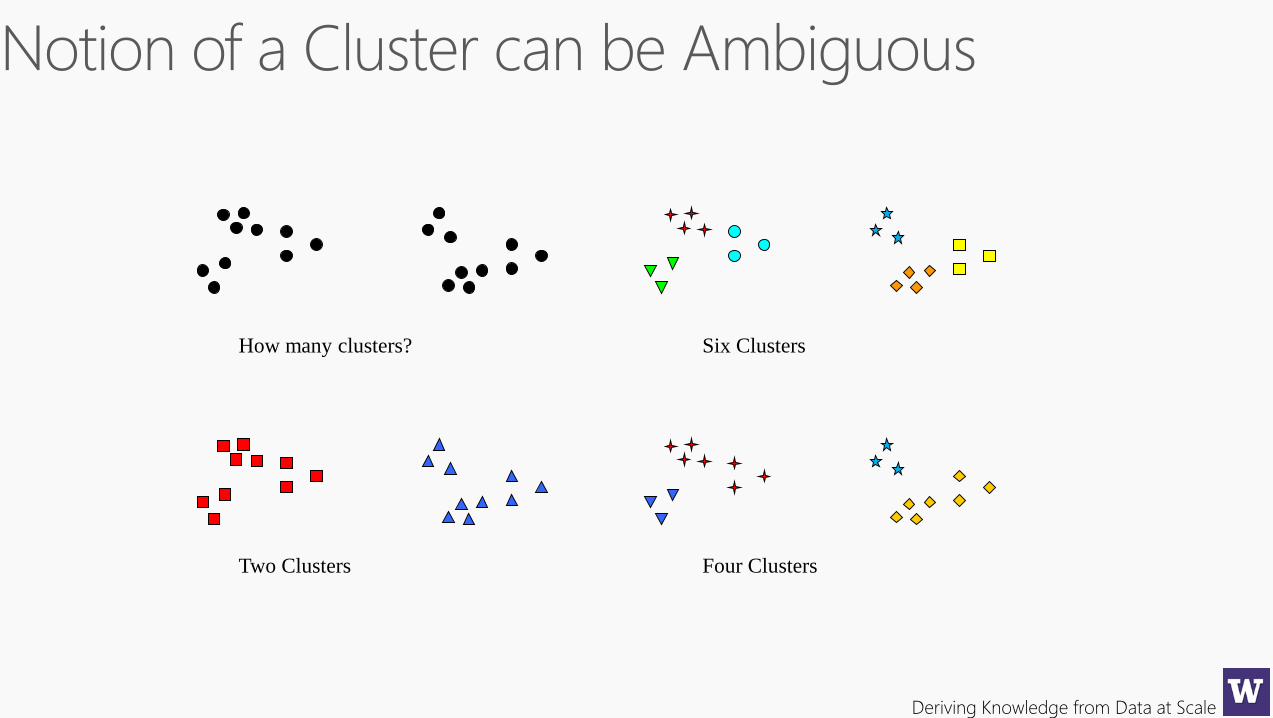
How many clusters?
Four ClustersTwo Clusters
Six Clusters
Deriving Knowledge from Data at Scale
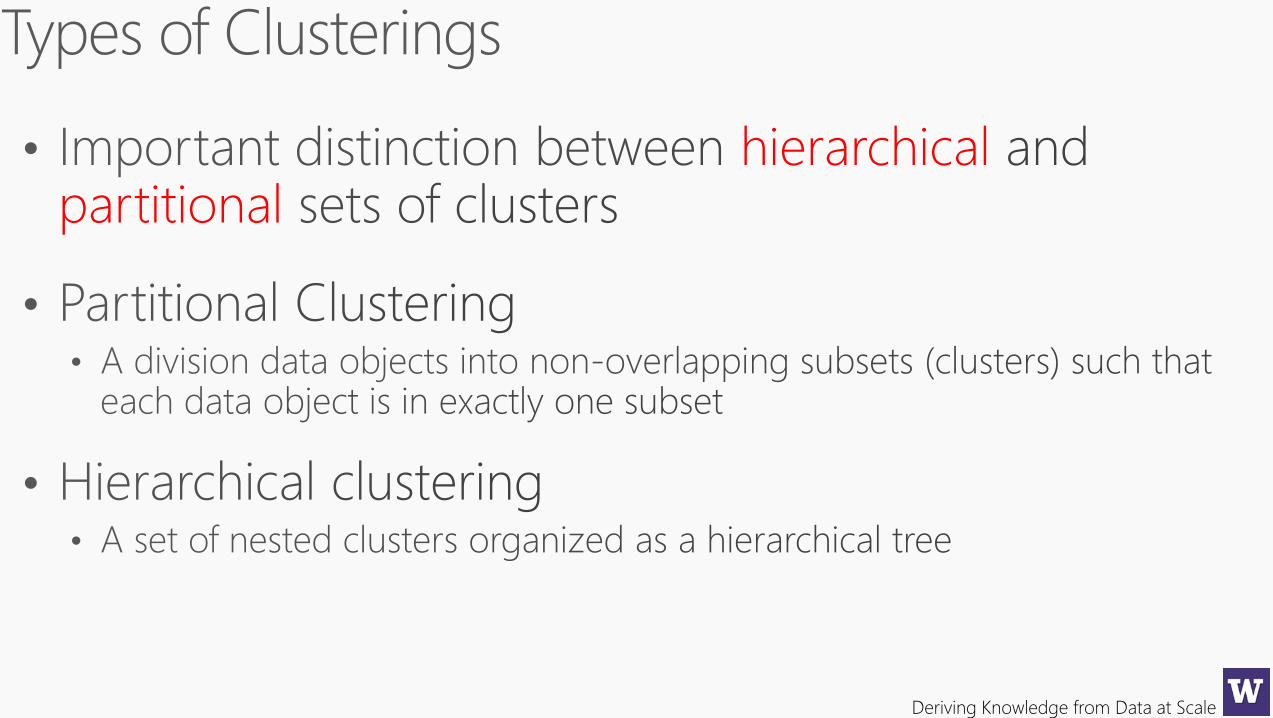
hierarchicalpartitional
Deriving Knowledge from Data at Scale
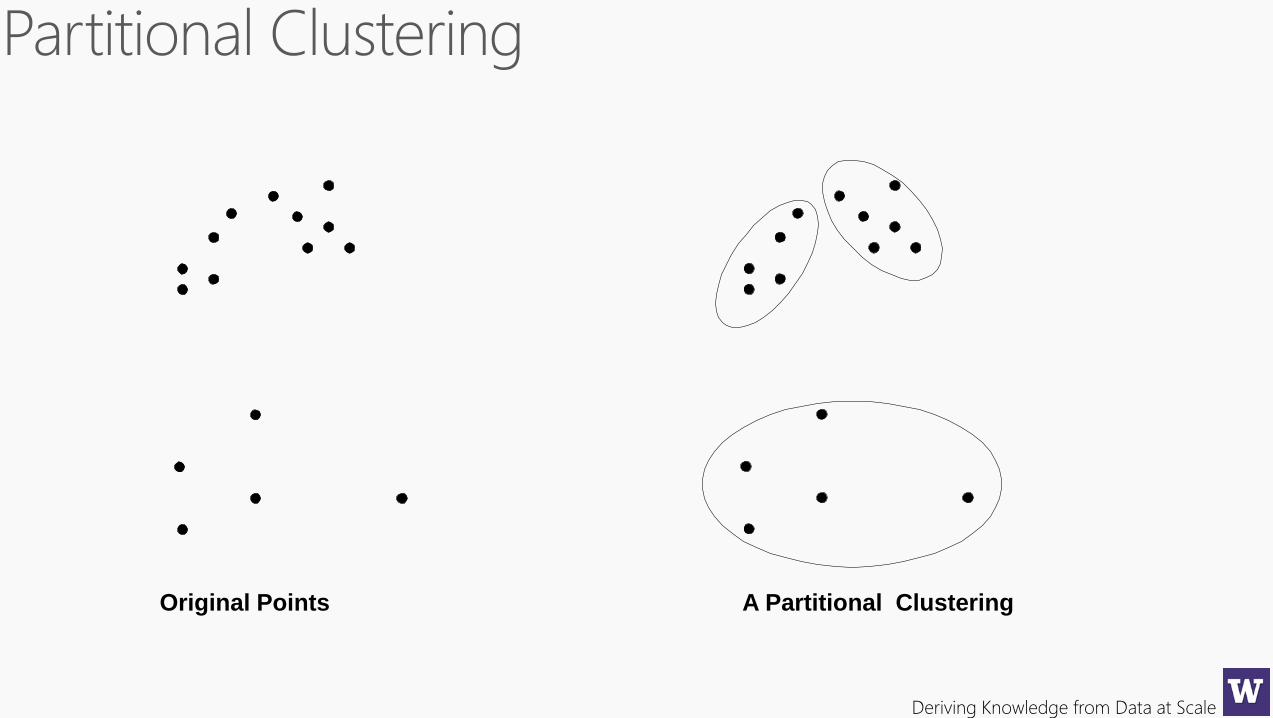
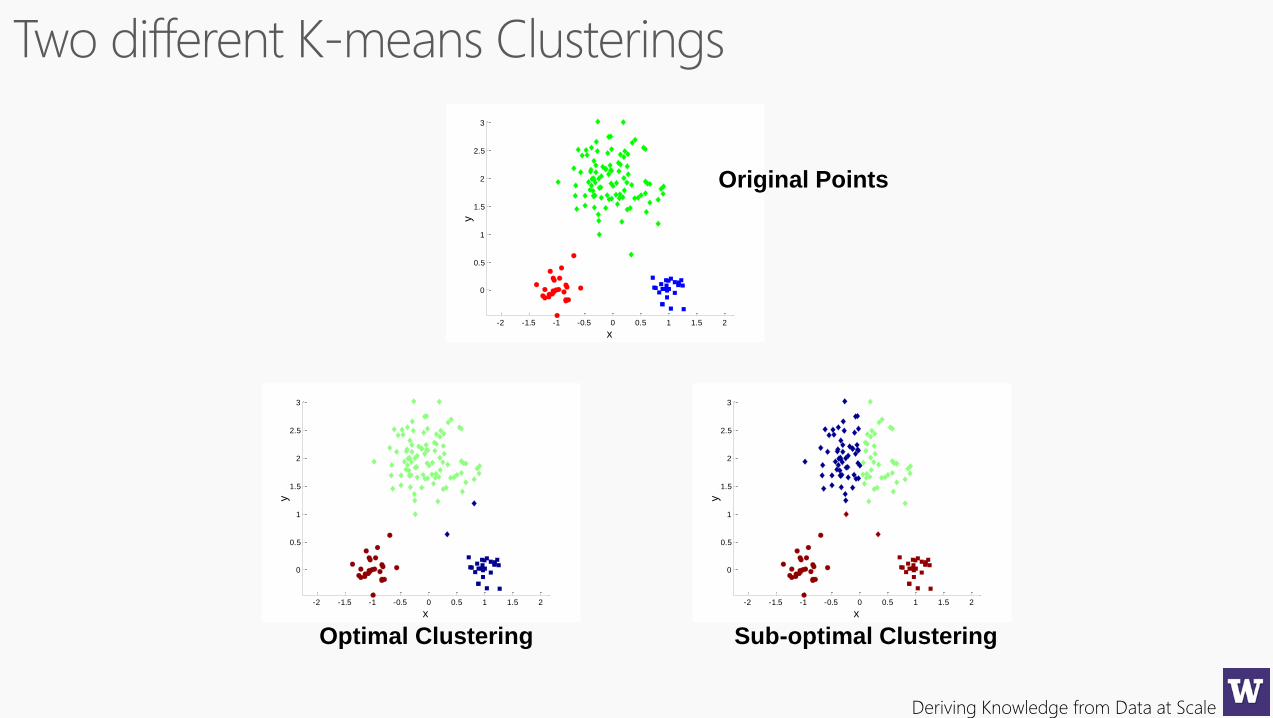
Original Points A Partitional Clustering
Deriving Knowledge from Data at Scale
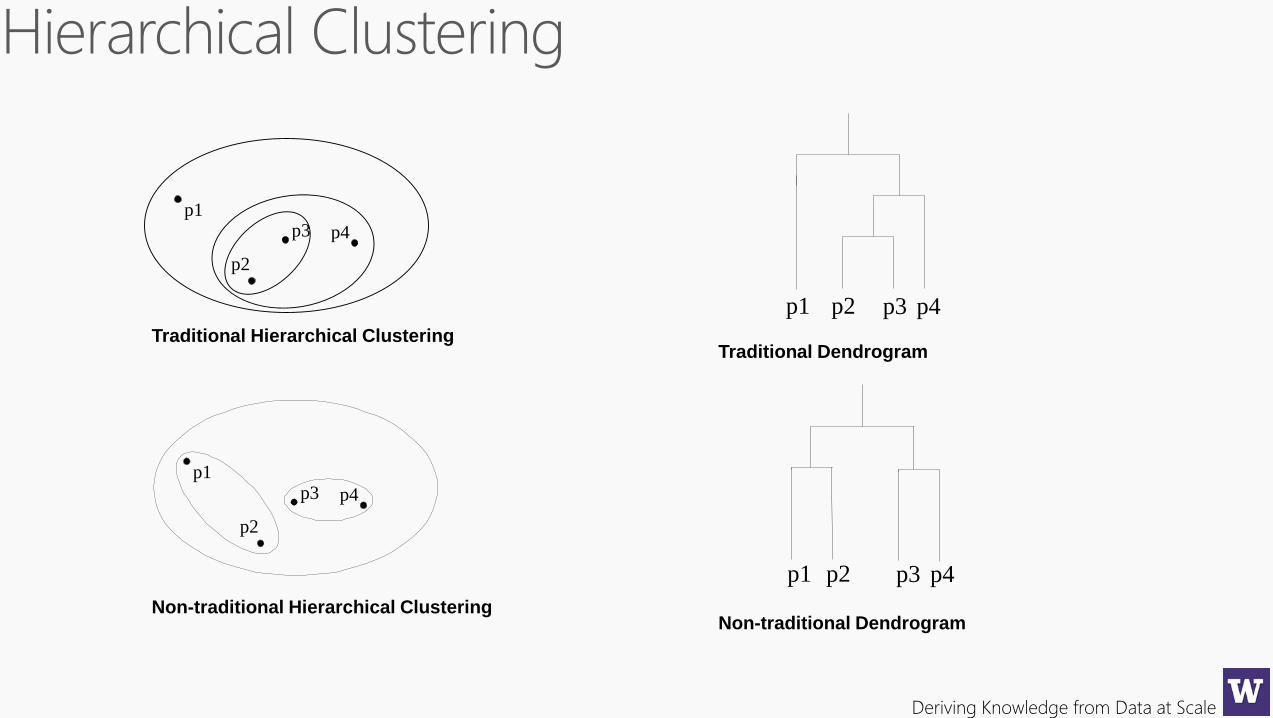
p4
p1p3
p2
p4
p1 p3
p2
p4p1 p2 p3
p4p1 p2 p3
Traditional Hierarchical Clustering
Non-traditional Hierarchical ClusteringNon-traditional Dendrogram
Traditional Dendrogram
Deriving Knowledge from Data at Scale
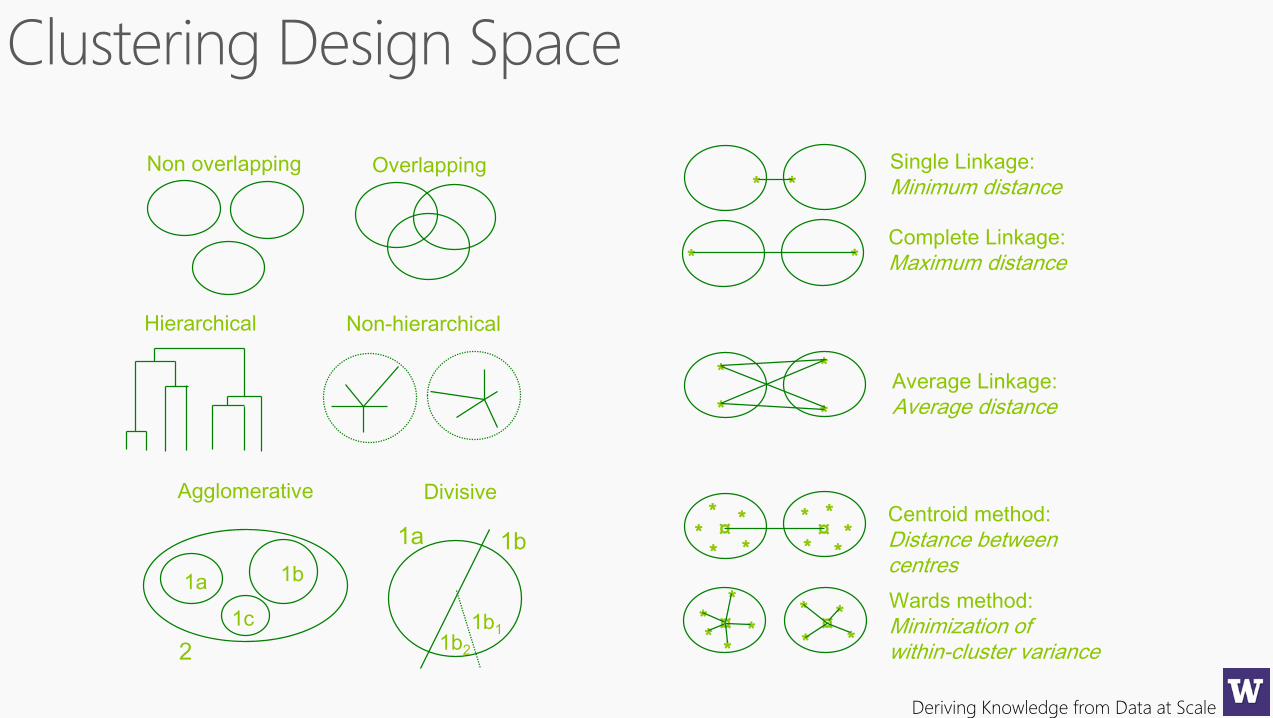
Deriving Knowledge from Data at Scale
Single Linkage:
Minimum distance* *
Complete Linkage:
Maximum distance* *
Average Linkage:
Average distance*
*
*
*
Wards method:
Minimization of within-cluster variance
**
*
**
¤*
* *
*¤
Centroid method:
Distance betweencentres
**
*
* *
***
* *¤ ¤
Non overlapping Overlapping
Hierarchical Non-hierarchical
1a 1b
1c
1a 1b
1b11b22
Agglomerative Divisive
Deriving Knowledge from Data at Scale
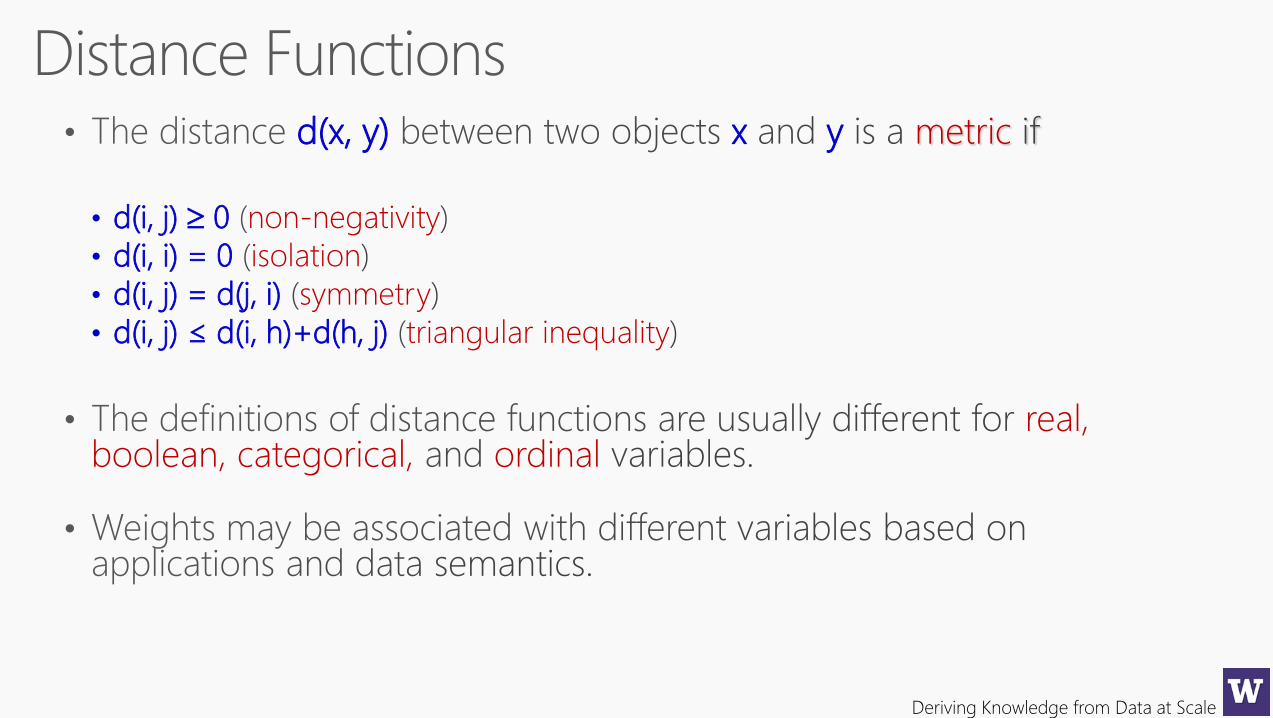
d(x, y) x y metric
• d(i, j) 0 non-negativity
• d(i, i) = 0 isolation
• d(i, j) = d(j, i) symmetry
• d(i, j) ≤ d(i, h)+d(h, j) triangular inequality
real, boolean, categorical, ordinal
Deriving Knowledge from Data at Scale
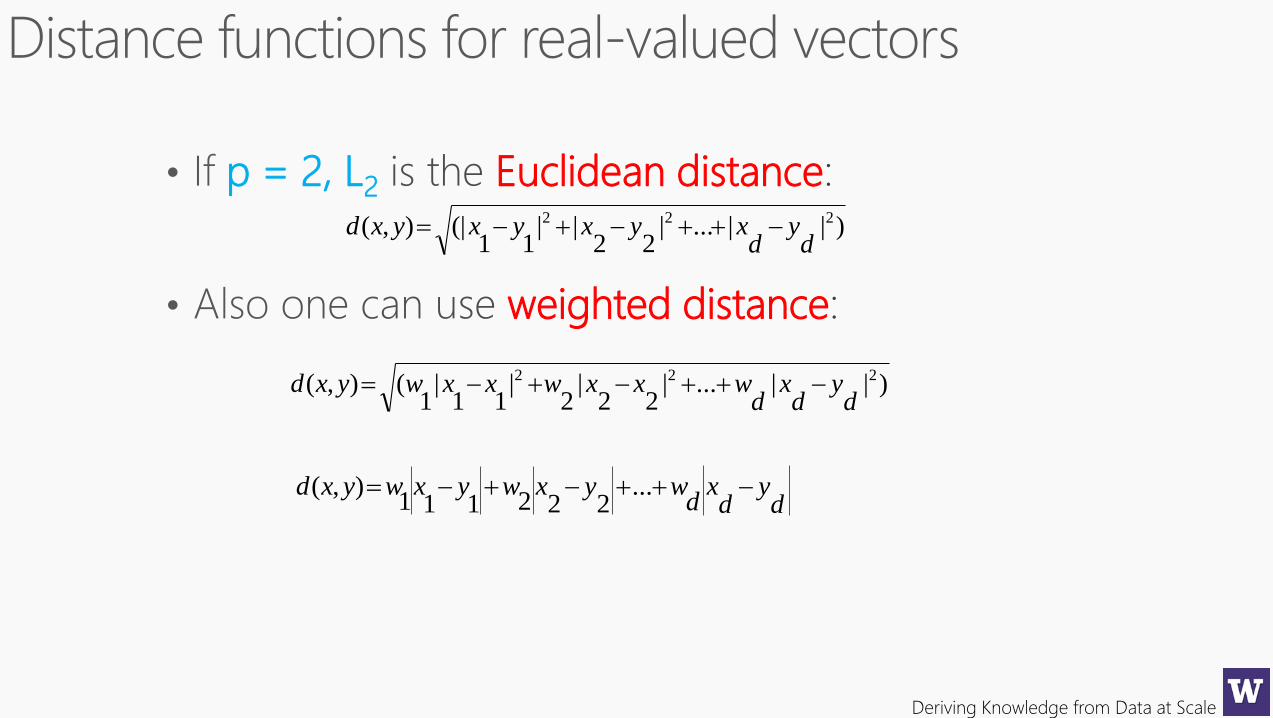
p = 2, L2 Euclidean distance
weighted distance
)||...|22
||11
(|),( 222
dy
dxyxyxyxd
)||...|22
|2
|11
|1
(),( 222
dy
dx
dwxxwxxwyxd
dy
dx
dwyxwyxwyxd ...
222111),(
Deriving Knowledge from Data at Scale
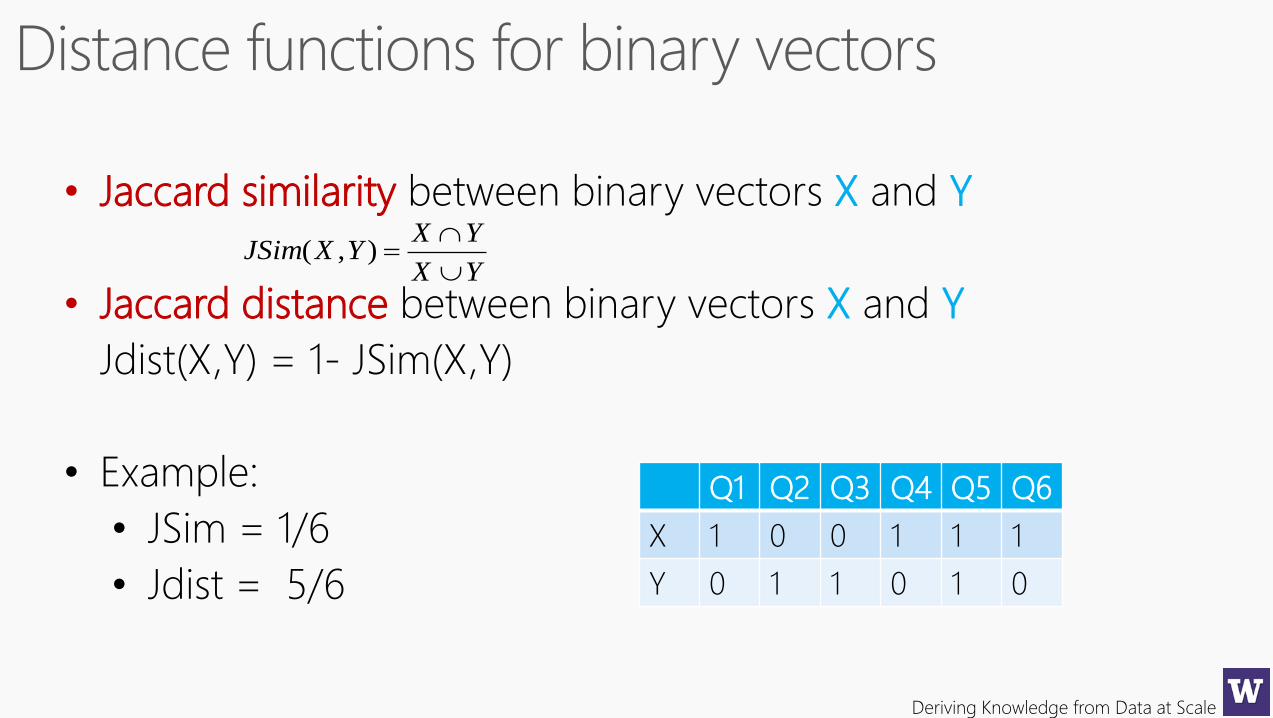
Q1 Q2 Q3 Q4 Q5 Q6
X 1 0 0 1 1 1
Y 0 1 1 0 1 0
• Jaccard similarity between binary vectors X and Y
• Jaccard distance between binary vectors X and Y
Jdist(X,Y) = 1- JSim(X,Y)
• Example:
• JSim = 1/6
• Jdist = 5/6
YX
YXYXJSim
),(
Deriving Knowledge from Data at Scale
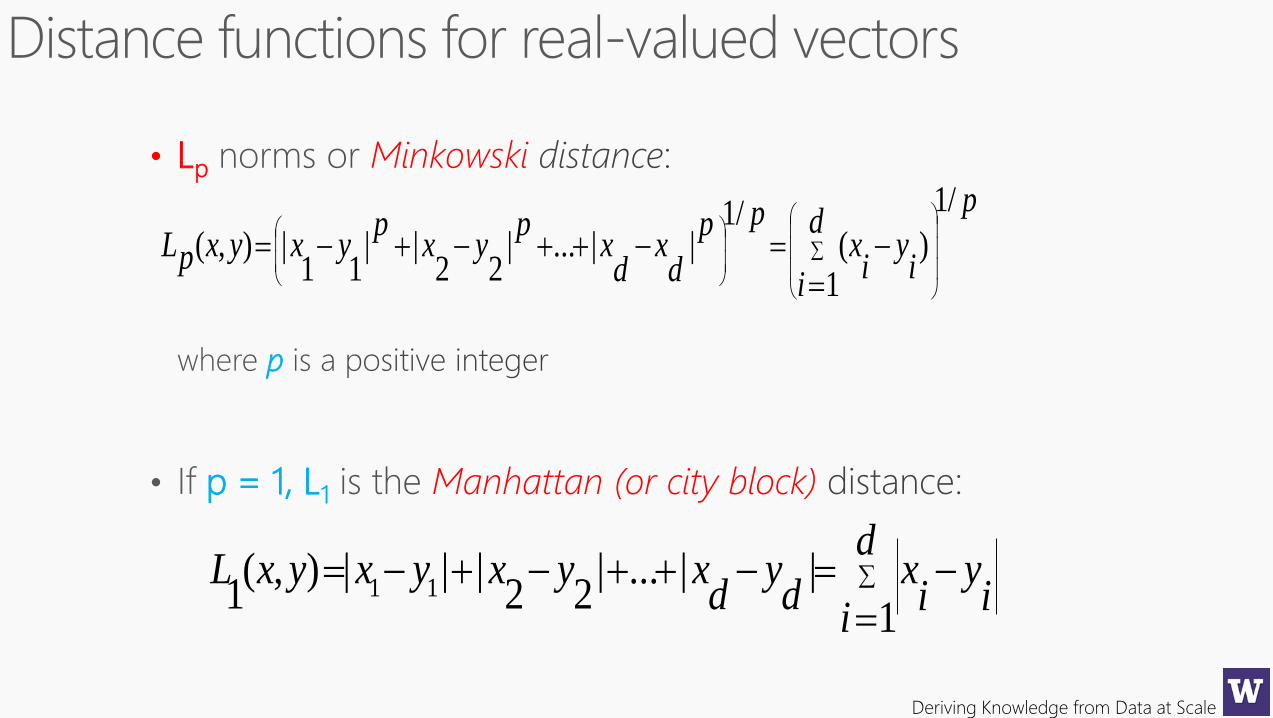
• Lp Minkowski
p
p = 1, L1 Manhattan (or city block)
pd
ii
yi
xpp
dx
dx
pyx
pyxyxpL
/1
1)(
/1||...|
22||
11|),(
d
ii
yi
xd
yd
xyxyxyxL1
||...|22
|||),(1 11
Deriving Knowledge from Data at Scale
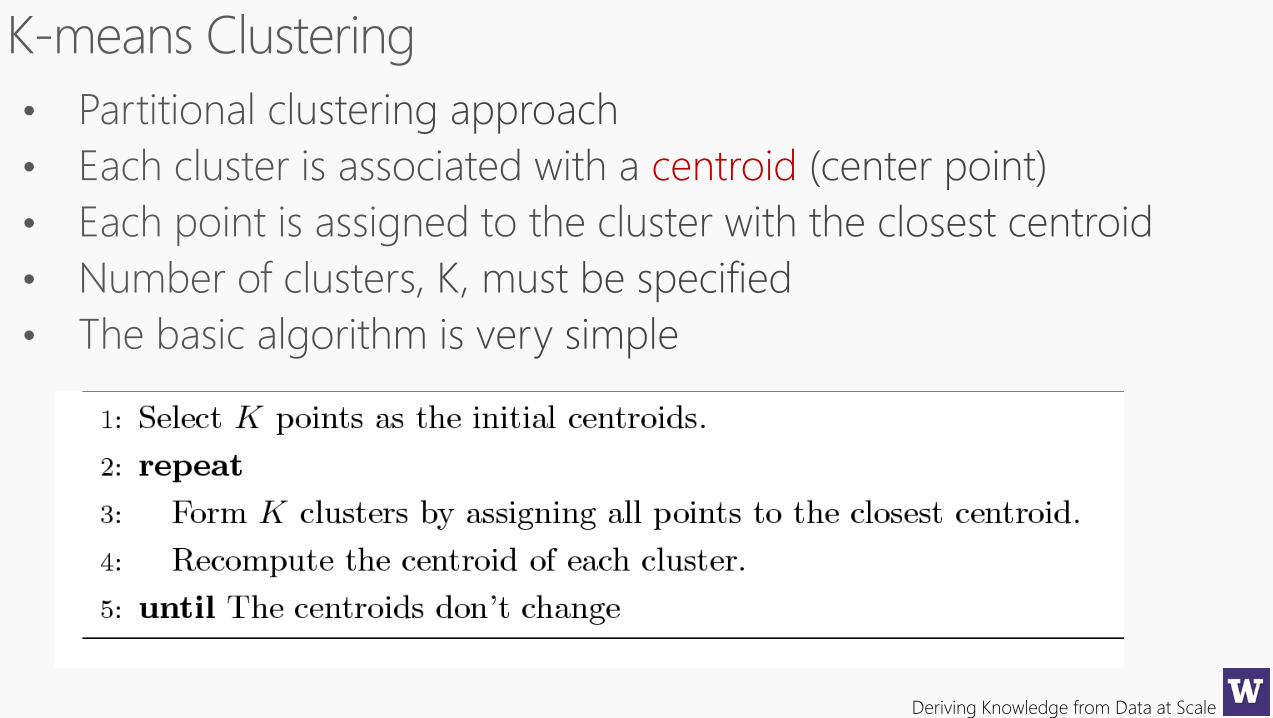
centroid
Deriving Knowledge from Data at Scale
Deriving Knowledge from Data at Scale
-2 -1.5 -1 -0.5 0 0.5 1 1.5 2
0
0.5
1
1.5
2
2.5
3
x
y
-2 -1.5 -1 -0.5 0 0.5 1 1.5 2
0
0.5
1
1.5
2
2.5
3
x
y
Sub-optimal Clustering
-2 -1.5 -1 -0.5 0 0.5 1 1.5 2
0
0.5
1
1.5
2
2.5
3
x
y
Optimal Clustering
Original Points
Deriving Knowledge from Data at Scale
-2 -1.5 -1 -0.5 0 0.5 1 1.5 2
0
0.5
1
1.5
2
2.5
3
x
y
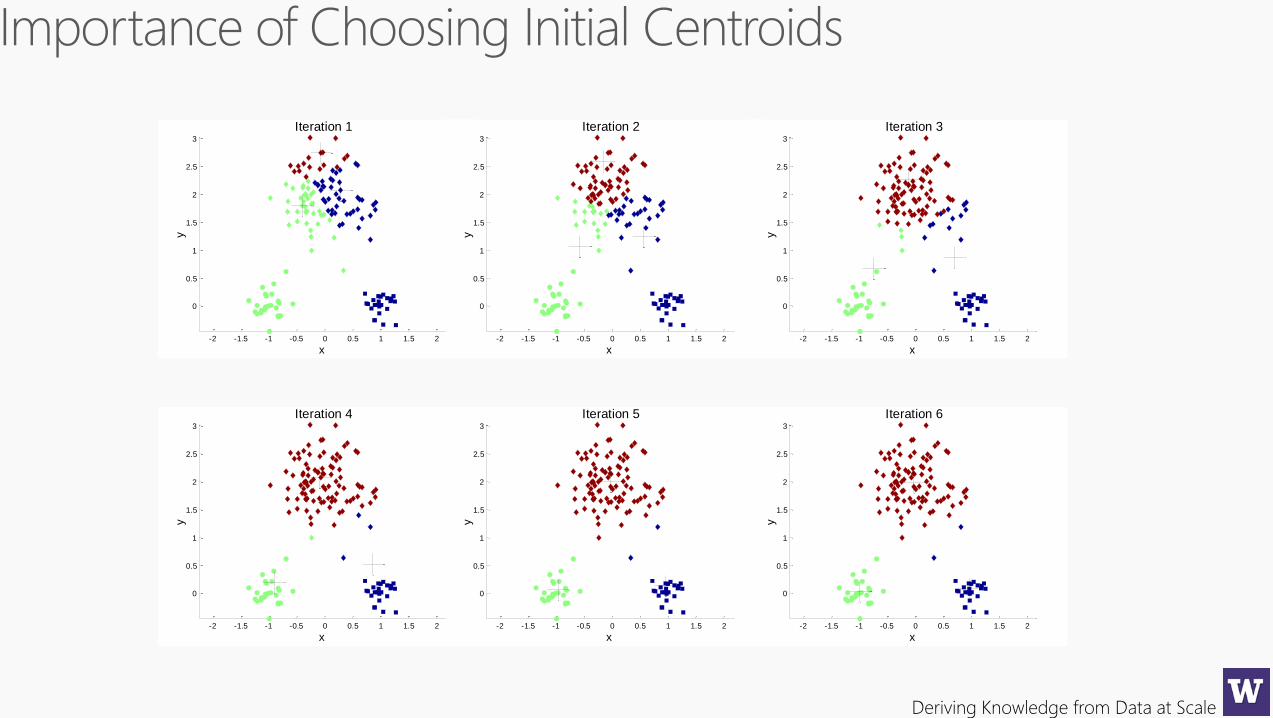
Iteration 1
-2 -1.5 -1 -0.5 0 0.5 1 1.5 2
0
0.5
1
1.5
2
2.5
3
x
y
Iteration 2
-2 -1.5 -1 -0.5 0 0.5 1 1.5 2
0
0.5
1
1.5
2
2.5
3
x
y
Iteration 3
-2 -1.5 -1 -0.5 0 0.5 1 1.5 2
0
0.5
1
1.5
2
2.5
3
x
y
Iteration 4
-2 -1.5 -1 -0.5 0 0.5 1 1.5 2
0
0.5
1
1.5
2
2.5
3
x
y
Iteration 5
-2 -1.5 -1 -0.5 0 0.5 1 1.5 2
0
0.5
1
1.5
2
2.5
3
x
y
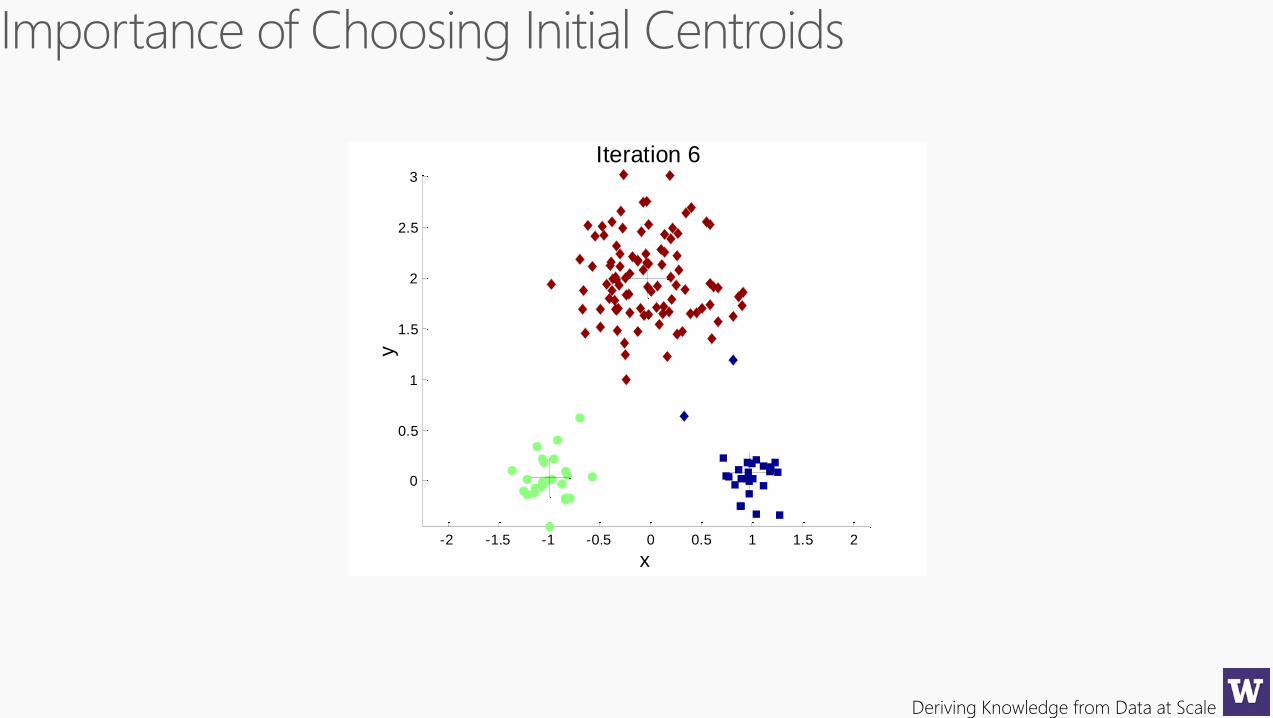
Iteration 6
Deriving Knowledge from Data at Scale
-2 -1.5 -1 -0.5 0 0.5 1 1.5 2
0
0.5
1
1.5
2
2.5
3
x
y
Iteration 1
-2 -1.5 -1 -0.5 0 0.5 1 1.5 2
0
0.5
1
1.5
2
2.5
3
x
y
Iteration 2
-2 -1.5 -1 -0.5 0 0.5 1 1.5 2
0
0.5
1
1.5
2
2.5
3
x
y
Iteration 3
-2 -1.5 -1 -0.5 0 0.5 1 1.5 2
0
0.5
1
1.5
2
2.5
3
x
y
Iteration 4
-2 -1.5 -1 -0.5 0 0.5 1 1.5 2
0
0.5
1
1.5
2
2.5
3
x
y
Iteration 5
-2 -1.5 -1 -0.5 0 0.5 1 1.5 2
0
0.5
1
1.5
2
2.5
3
x
y
Iteration 6
Deriving Knowledge from Data at Scale
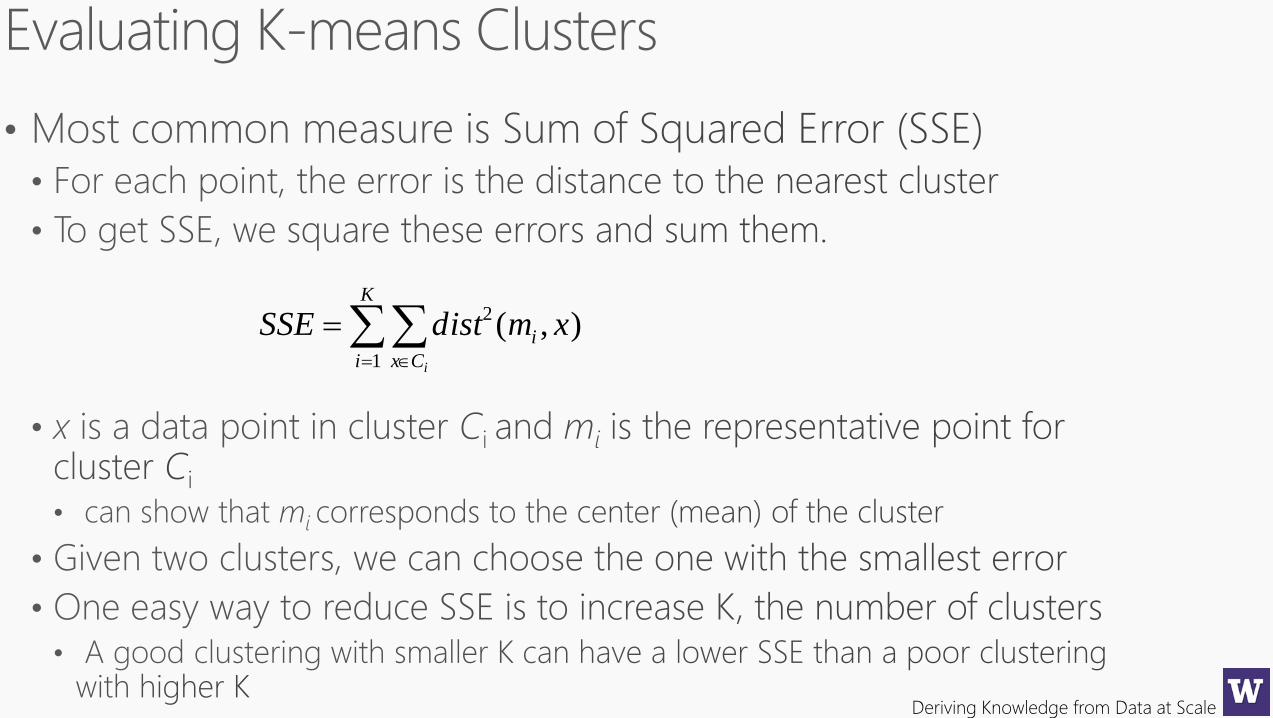
K
i Cx
i
i
xmdistSSE1
2 ),(
Deriving Knowledge from Data at Scale
-2 -1.5 -1 -0.5 0 0.5 1 1.5 2
0
0.5
1
1.5
2
2.5
3
x
y
Iteration 1
-2 -1.5 -1 -0.5 0 0.5 1 1.5 2
0
0.5
1
1.5
2
2.5
3
x
y
Iteration 2
-2 -1.5 -1 -0.5 0 0.5 1 1.5 2
0
0.5
1
1.5
2
2.5
3
x
y
Iteration 3
-2 -1.5 -1 -0.5 0 0.5 1 1.5 2
0
0.5
1
1.5
2
2.5
3
x
y
Iteration 4
-2 -1.5 -1 -0.5 0 0.5 1 1.5 2
0
0.5
1
1.5
2
2.5
3
x
y
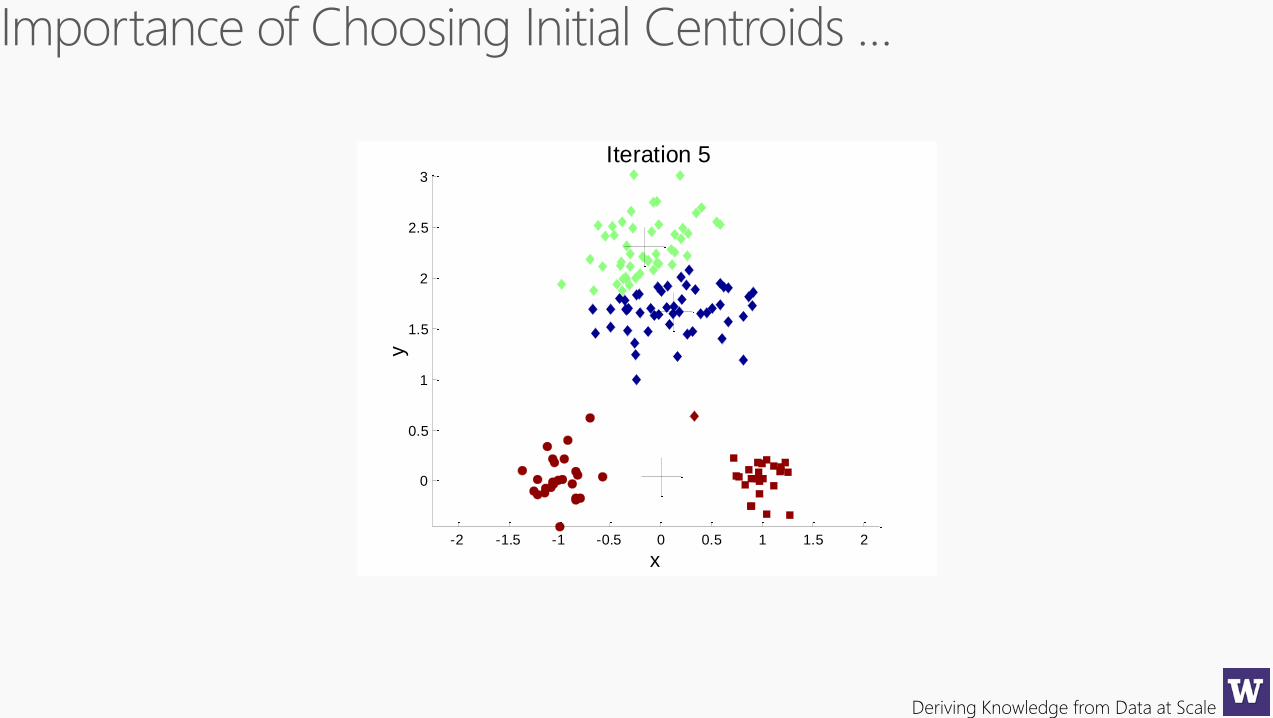
Iteration 5
Deriving Knowledge from Data at Scale
-2 -1.5 -1 -0.5 0 0.5 1 1.5 2
0
0.5
1
1.5
2
2.5
3
x
y
Iteration 1
-2 -1.5 -1 -0.5 0 0.5 1 1.5 2
0
0.5
1
1.5
2
2.5
3
x
y
Iteration 2
-2 -1.5 -1 -0.5 0 0.5 1 1.5 2
0
0.5
1
1.5
2
2.5
3
x
y
Iteration 3
-2 -1.5 -1 -0.5 0 0.5 1 1.5 2
0
0.5
1
1.5
2
2.5
3
x
y
Iteration 4
-2 -1.5 -1 -0.5 0 0.5 1 1.5 2
0
0.5
1
1.5
2
2.5
3
x
y
Iteration 5
Deriving Knowledge from Data at Scale
Deriving Knowledge from Data at Scale
Deriving Knowledge from Data at Scale
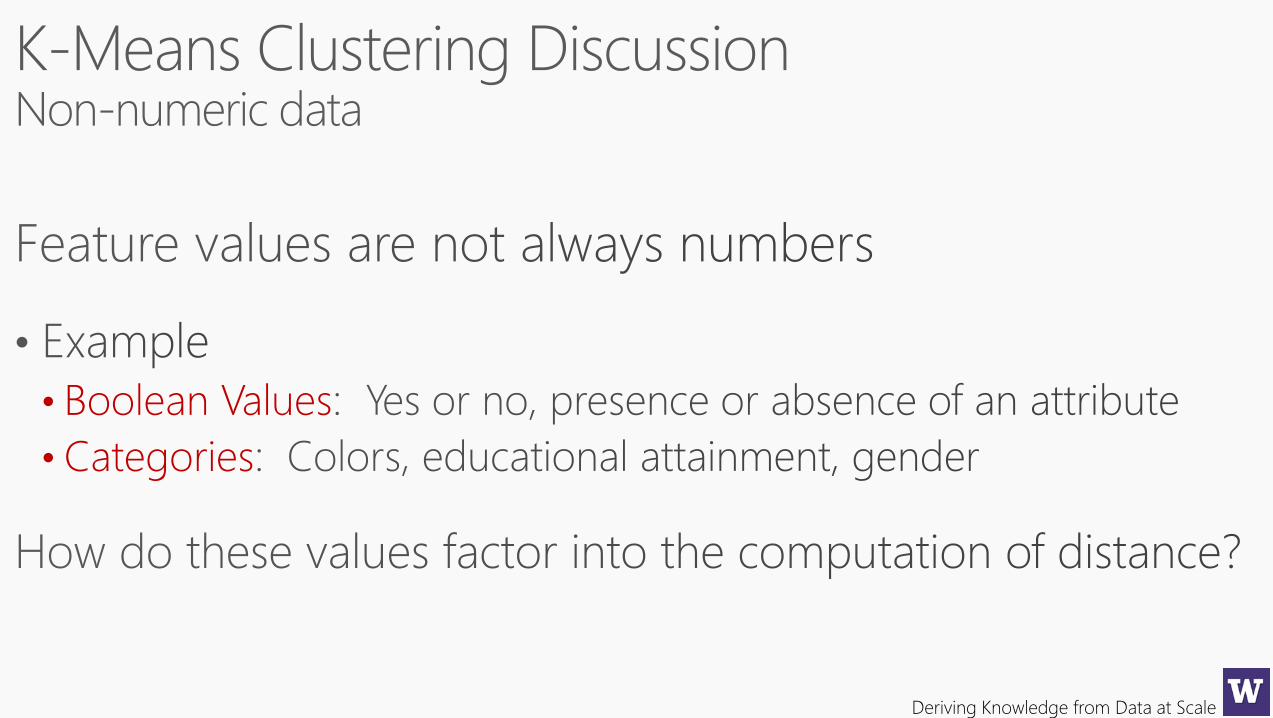
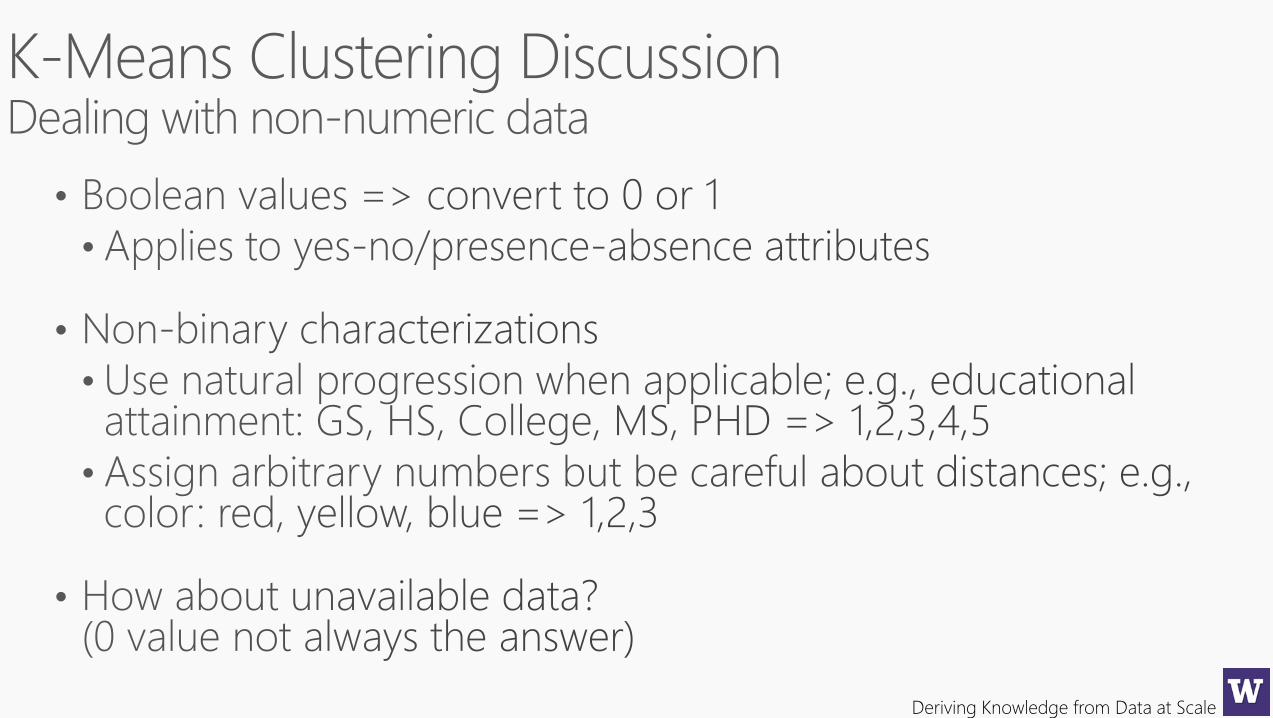
• Boolean Values
• Categories
Deriving Knowledge from Data at Scale
Deriving Knowledge from Data at Scale
Deriving Knowledge from Data at Scale
That’s all for tonight….