Automotive aluminum
castings and market trends
Norberto F. VidañaMarket Intelligence Manager
Aluminum
2
Contents
• Nemak´s overview
• Automotive Industry overview
• Aluminum Market overview
• Price trends
Disclaimer:This report is presented for informational purposes only. It is not intended to be a comprehensive or detailed statement or report on any subject
and no representations or warranties, express or implied, are made as to its accuracy, timeliness or completeness. Nothing in this report is intended to provide financial, legal, accounting or tax advice nor should it be relied upon. Neither NEMAK nor the author is liable whatsoever for any loss or damage caused by, or resulting from, any use of or any inaccuracies, errors or omissions in the information provided.
Nemak’s overview
3
4
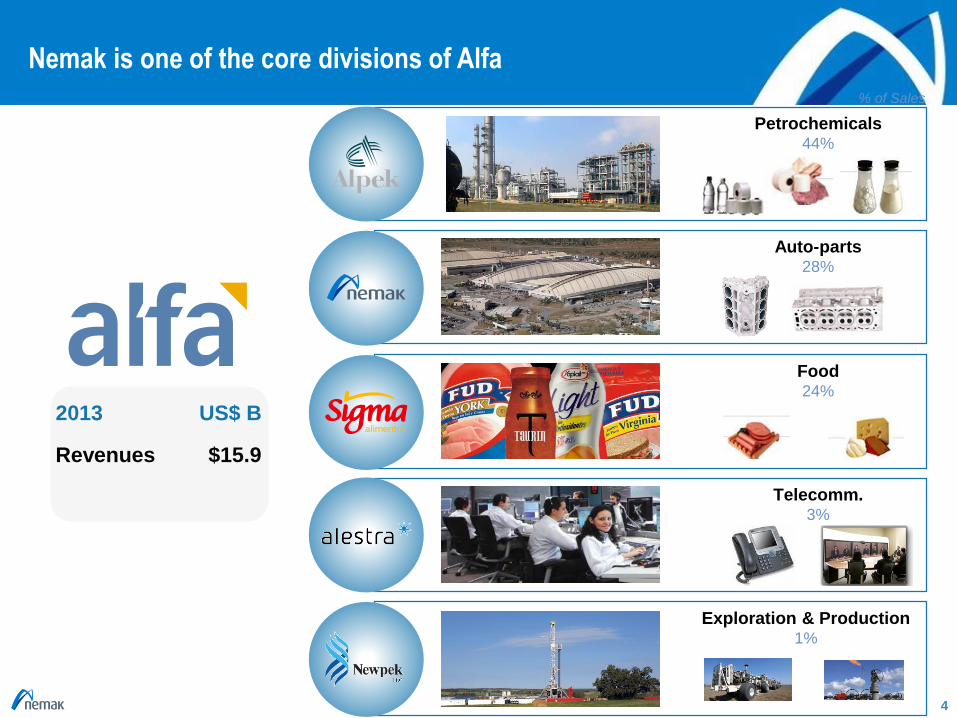
Nemak is one of the core divisions of Alfa
Revenues $15.9
2013 US$ B
Auto-parts28%
Telecomm.3%
Petrochemicals44%
Food24%
Exploration & Production1%
% of Sales
5
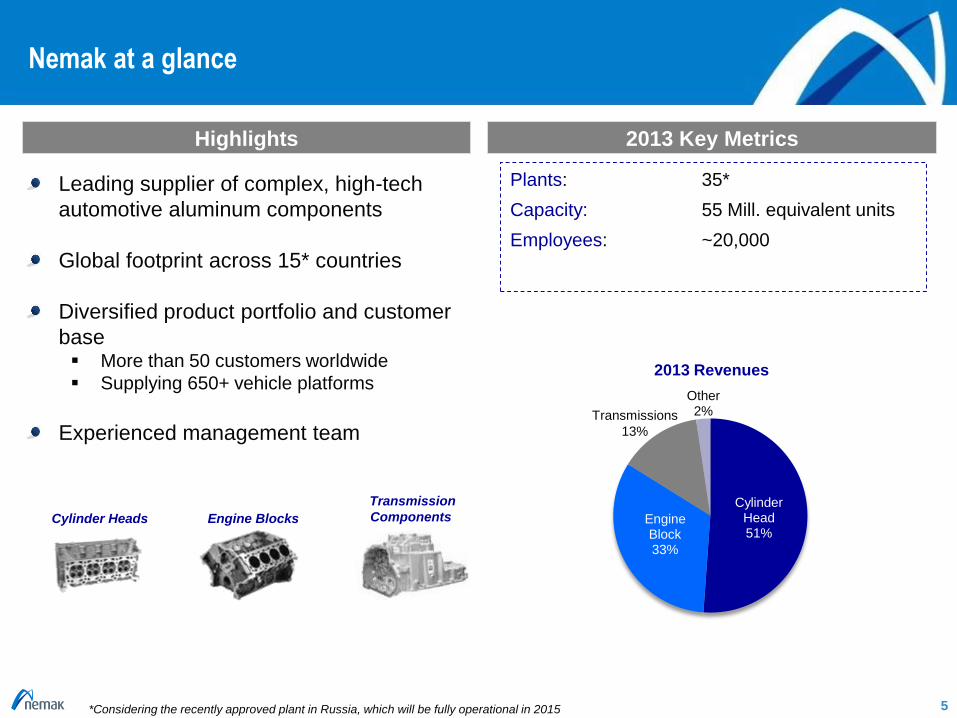
Nemak at a glance
Cylinder Head51%
Engine Block33%
Other2%
Leading supplier of complex, high-tech
automotive aluminum components
Global footprint across 15* countries
Diversified product portfolio and customer
base More than 50 customers worldwide
Supplying 650+ vehicle platforms
Experienced management team
Highlights
Plants: 35*
Capacity: 55 Mill. equivalent units
Employees: ~20,000
Engine BlocksCylinder Heads
Transmission
Components
2013 Revenues
2013 Key Metrics
Transmissions
13%
*Considering the recently approved plant in Russia, which will be fully operational in 2015
6
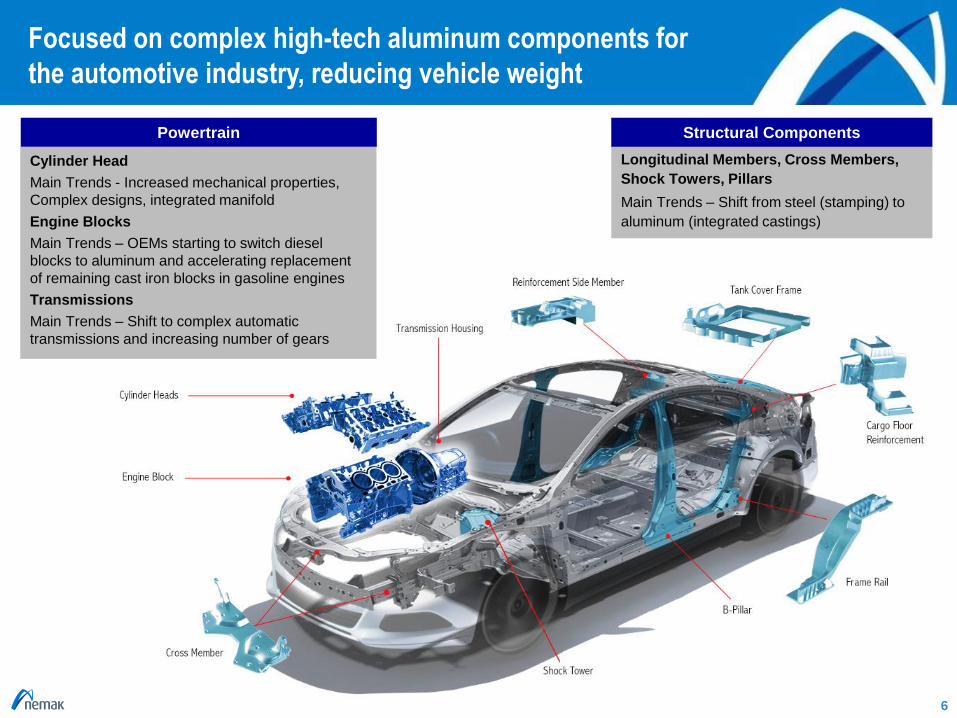
Focused on complex high-tech aluminum components for
the automotive industry, reducing vehicle weight
Cylinder Head
Main Trends - Increased mechanical properties,
Complex designs, integrated manifold
Engine Blocks
Main Trends – OEMs starting to switch diesel
blocks to aluminum and accelerating replacement
of remaining cast iron blocks in gasoline engines
Transmissions
Main Trends – Shift to complex automatic
transmissions and increasing number of gears
Longitudinal Members, Cross Members,
Shock Towers, Pillars
Main Trends – Shift from steel (stamping) to
aluminum (integrated castings)
Structural ComponentsPowertrain
7
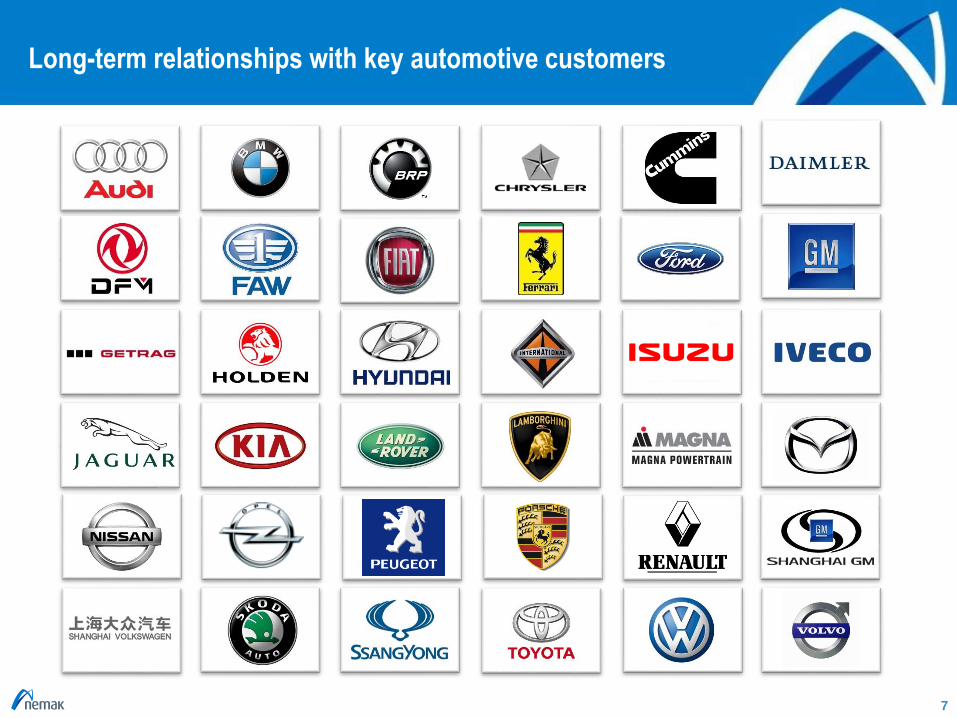
Long-term relationships with key automotive customers
8
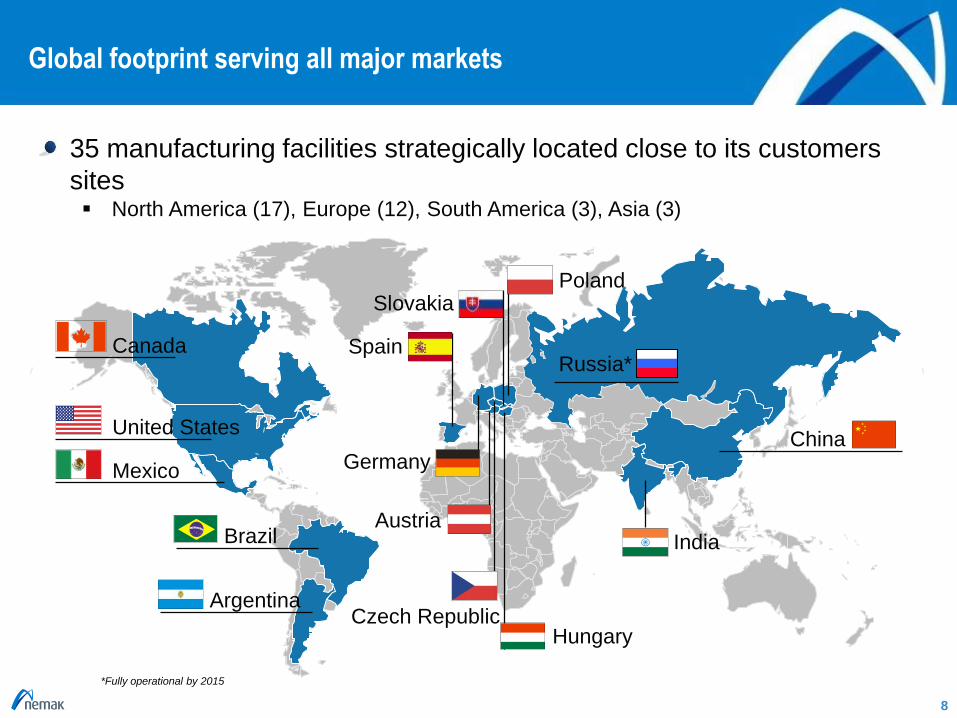
Global footprint serving all major markets
35 manufacturing facilities strategically located close to its customers
sites North America (17), Europe (12), South America (3), Asia (3)
Canada
United States
Mexico
Brazil
China
India
Poland
Austria
Czech Republic
Slovakia
Argentina
Hungary
Germany
SpainRussia*
*Fully operational by 2015
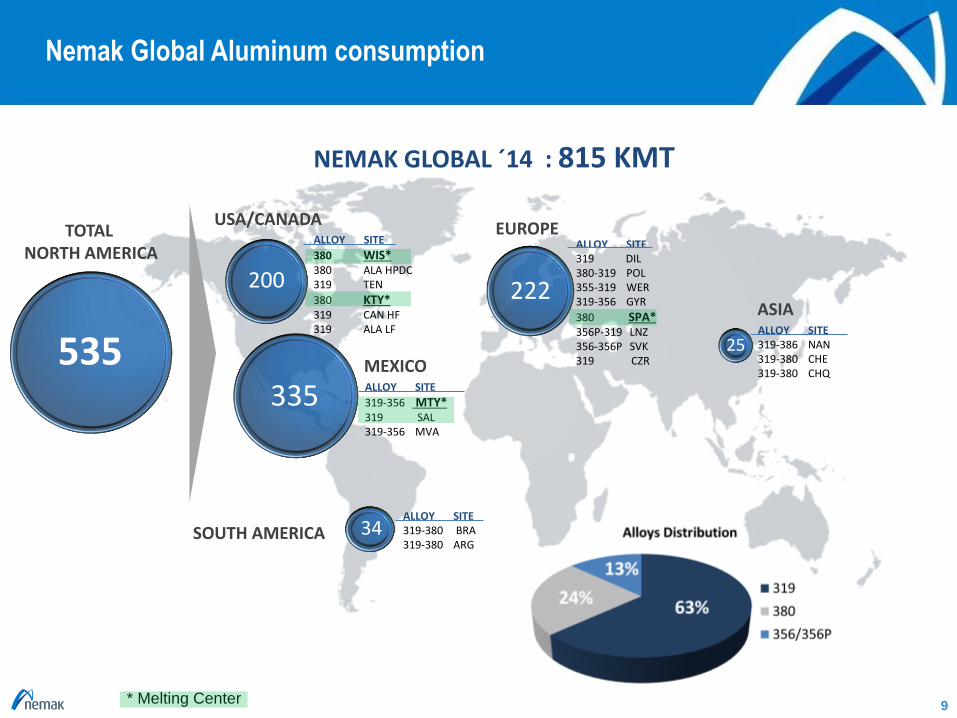
Nemak Global Aluminum consumption
9
34
USA/CANADA
200 222
SOUTH AMERICA
TOTAL NORTH AMERICA
ALLOY SITE 319-380 BRA319-380 ARG
335
535
EUROPE
MEXICOALLOY SITE
319-356 MTY*319 SAL319-356 MVA
ALLOY SITE 319 DIL380-319 POL355-319 WER319-356 GYR
380 SPA*356P-319 LNZ356-356P SVK319 CZR
ALLOY SITE
380 WIS*380 ALA HPDC 319 TEN
380 KTY*319 CAN HF 319 ALA LF ALLOY SITE
319-386 NAN319-380 CHE319-380 CHQ
ASIA
NEMAK GLOBAL ´14 : 815 KMT
25
* Melting Center
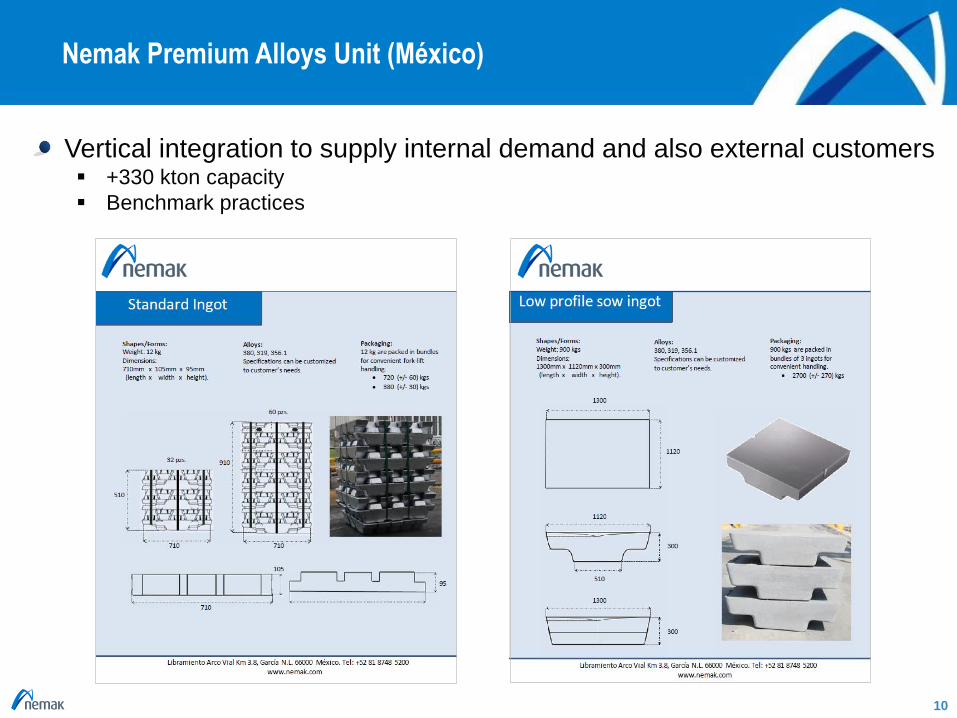
Nemak Premium Alloys Unit (México)
10
Vertical integration to supply internal demand and also external customers +330 kton capacity
Benchmark practices
Automotive Industry Overview
11
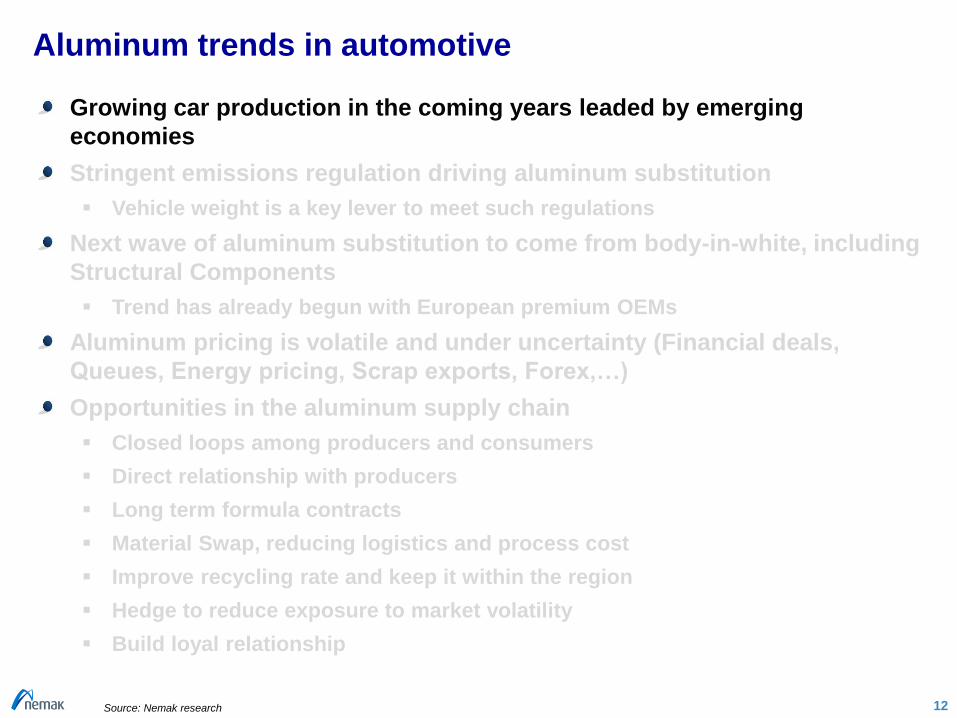
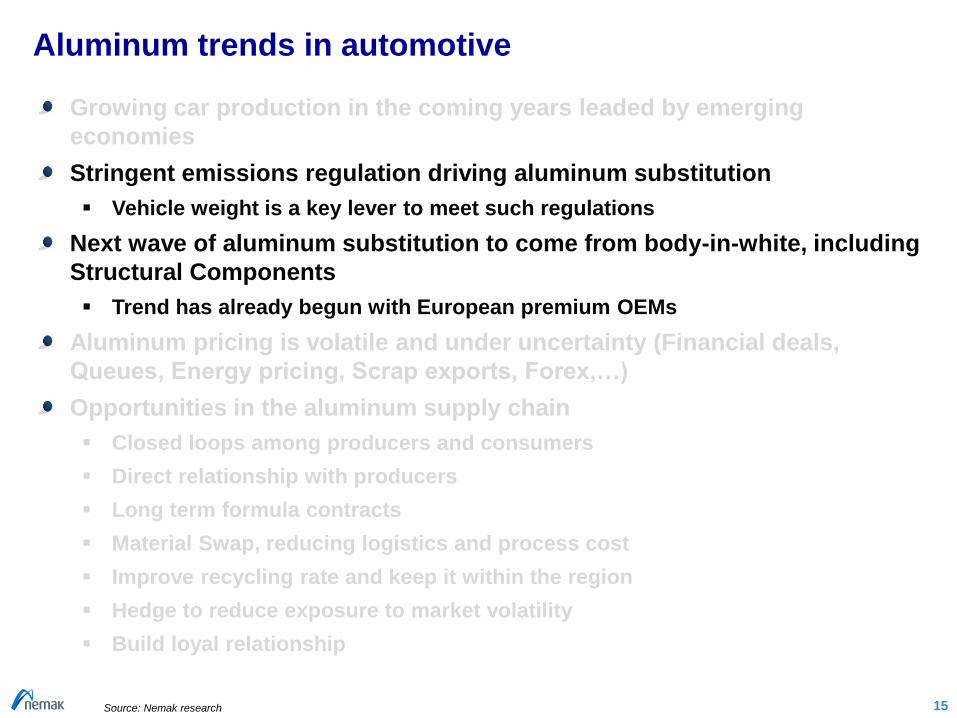
Aluminum trends in automotive
Growing car production in the coming years leaded by emerging
economies
Stringent emissions regulation driving aluminum substitution
Vehicle weight is a key lever to meet such regulations
Next wave of aluminum substitution to come from body-in-white, including
Structural Components
Trend has already begun with European premium OEMs
Aluminum pricing is volatile and under uncertainty (Financial deals,
Queues, Energy pricing, Scrap exports, Forex,…)
Opportunities in the aluminum supply chain
Closed loops among producers and consumers
Direct relationship with producers
Long term formula contracts
Material Swap, reducing logistics and process cost
Improve recycling rate and keep it within the region
Hedge to reduce exposure to market volatility
Build loyal relationship
12Source: Nemak research
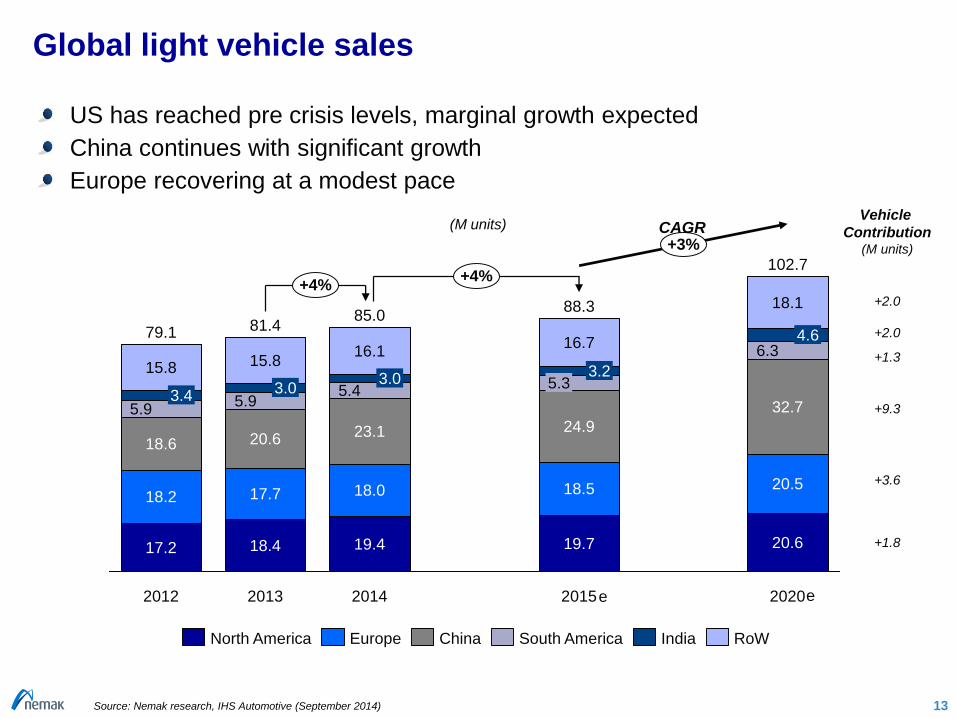
6.3
32.7
+4%
20.5
2020
102.7
+3%
+4%
18.1
20.6
2015
88.3
16.7
3.25.3
24.9
18.5
19.7
2014
85.0
16.1
3.05.4
23.1
18.0
19.4
2013
81.4
15.8
3.0
4.6
20.6
17.7
18.4
2012
79.1
5.93.45.9
18.6
18.2
17.2
15.8
(M units)
Global light vehicle sales
US has reached pre crisis levels, marginal growth expected
China continues with significant growth
Europe recovering at a modest pace
13Source: Nemak research, IHS Automotive (September 2014)
+1.8
+3.6
+9.3
+1.3
+2.0
Vehicle
Contribution(M units)
+2.0
South America RoWIndiaEurope ChinaNorth America
CAGR
e e
Market trend
14
Aluminum trends in automotive
Growing car production in the coming years leaded by emerging
economies
Stringent emissions regulation driving aluminum substitution
Vehicle weight is a key lever to meet such regulations
Next wave of aluminum substitution to come from body-in-white, including
Structural Components
Trend has already begun with European premium OEMs
Aluminum pricing is volatile and under uncertainty (Financial deals,
Queues, Energy pricing, Scrap exports, Forex,…)
Opportunities in the aluminum supply chain
Closed loops among producers and consumers
Direct relationship with producers
Long term formula contracts
Material Swap, reducing logistics and process cost
Improve recycling rate and keep it within the region
Hedge to reduce exposure to market volatility
Build loyal relationship
15Source: Nemak research
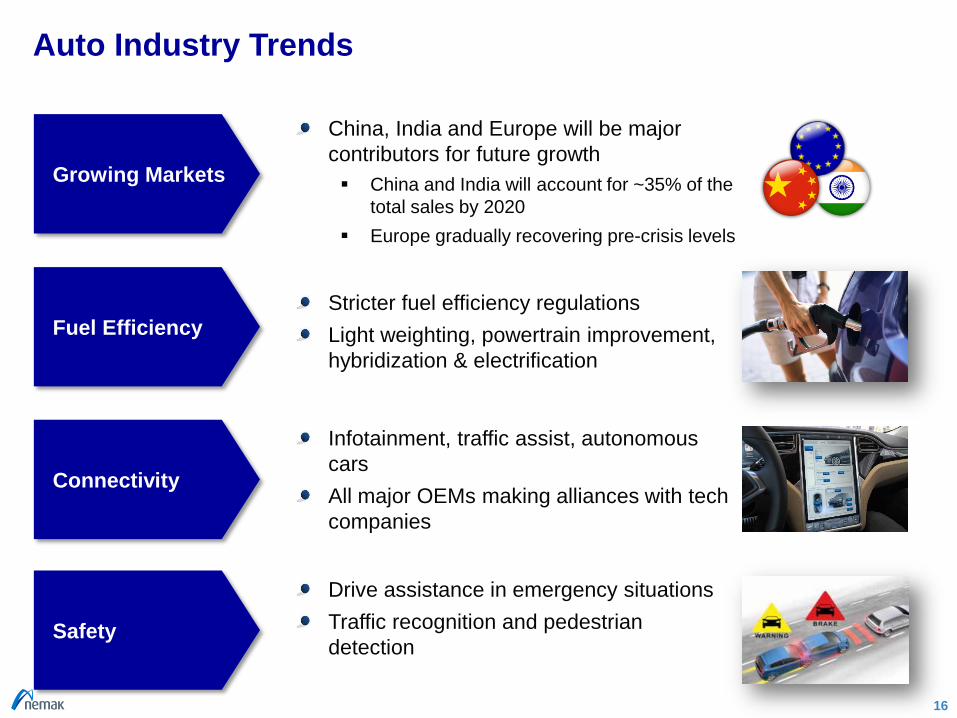
Auto Industry Trends
16
Growing Markets
Fuel Efficiency
Connectivity
Stricter fuel efficiency regulations
Light weighting, powertrain improvement,
hybridization & electrification
Safety
China, India and Europe will be major
contributors for future growth
China and India will account for ~35% of the
total sales by 2020
Europe gradually recovering pre-crisis levels
Infotainment, traffic assist, autonomous
cars
All major OEMs making alliances with tech
companies
Drive assistance in emergency situations
Traffic recognition and pedestrian
detection
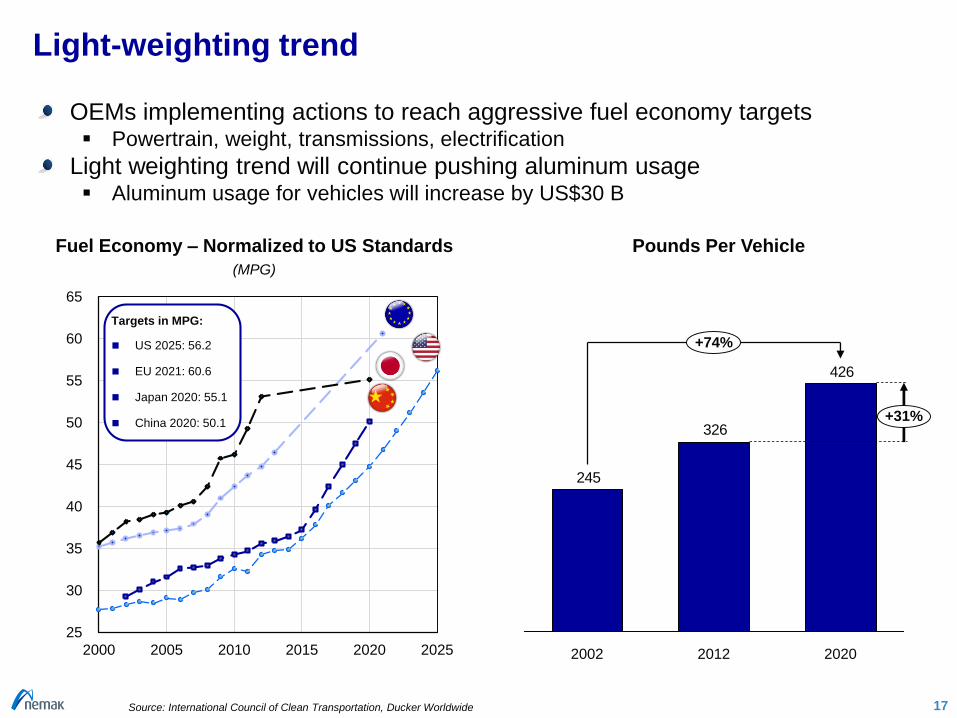
Light-weighting trend
OEMs implementing actions to reach aggressive fuel economy targets Powertrain, weight, transmissions, electrification
Light weighting trend will continue pushing aluminum usage Aluminum usage for vehicles will increase by US$30 B
17
25
30
35
40
45
50
55
60
65
2000 2005 2010 2015 2020 2025
Targets in MPG:
US 2025: 56.2
EU 2021: 60.6
Japan 2020: 55.1
China 2020: 50.1
Fuel Economy – Normalized to US Standards
(MPG)
426
326
245
2020
+31%
20122002
+74%
Pounds Per Vehicle
Source: International Council of Clean Transportation, Ducker Worldwide
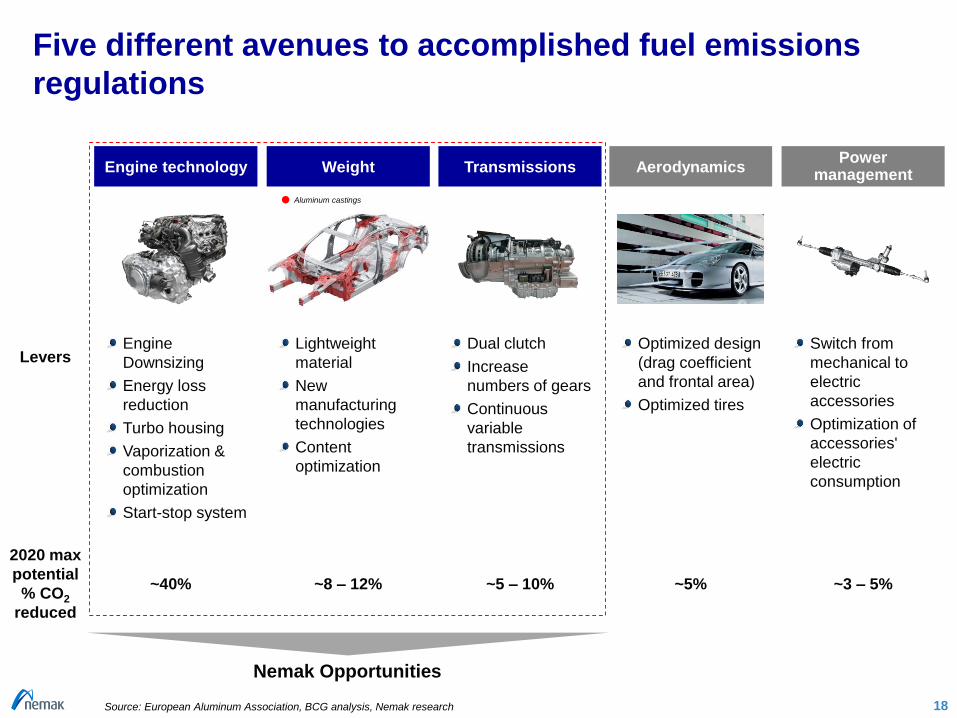
Five different avenues to accomplished fuel emissions
regulations
18
Engine
Downsizing
Energy loss
reduction
Turbo housing
Vaporization &
combustion
optimization
Start-stop system
WeightEngine technology AerodynamicsTransmissionsPower
management
LeversDual clutch
Increase
numbers of gears
Continuous
variable
transmissions
Lightweight
material
New
manufacturing
technologies
Content
optimization
Optimized design
(drag coefficient
and frontal area)
Optimized tires
Aluminum castings
Switch from
mechanical to
electric
accessories
Optimization of
accessories'
electric
consumption
2020 max
potential
% CO2
reduced
~40% ~5 – 10%~8 – 12% ~5% ~3 – 5%
Source: European Aluminum Association, BCG analysis, Nemak research
Nemak Opportunities
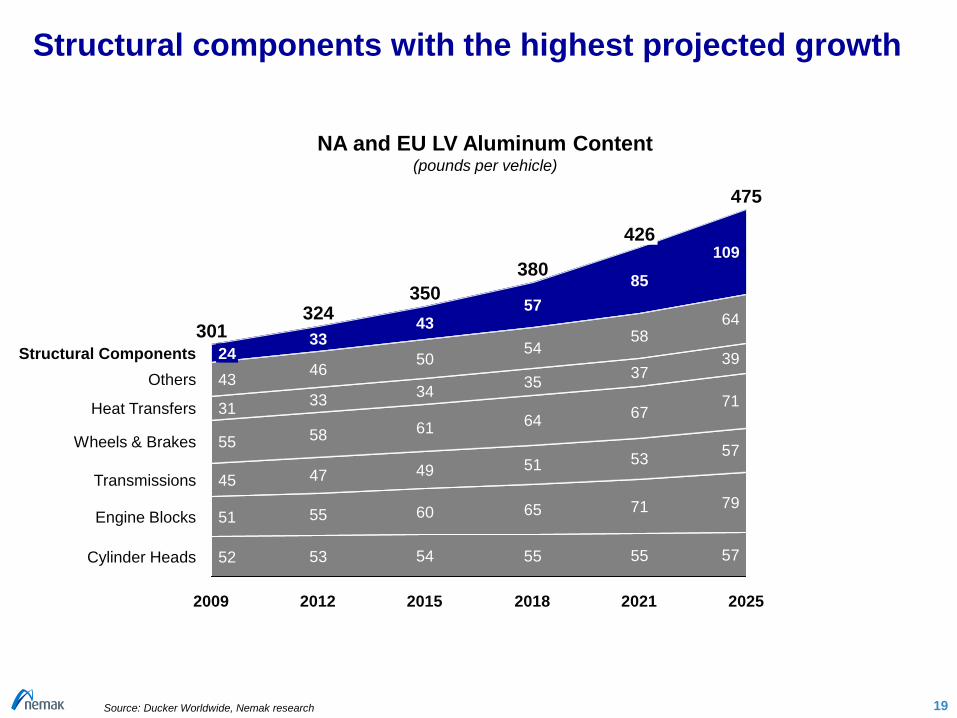
Structural components with the highest projected growth
19
NA and EU LV Aluminum Content(pounds per vehicle)
Cylinder Heads
Engine Blocks
Transmissions
Wheels & Brakes
Heat Transfers
Others
Structural Components
2025
475
57
79
57
71
39
64
109
2021
426
55
71
53
67
37
58
85
2018
380
55
65
51
64
35
54
57
2015
350
54
60
49
61
34
50
43
2012
324
53
55
47
58
33
46
33
2009
301
52
51
45
55
31
43
24
Source: Ducker Worldwide, Nemak research
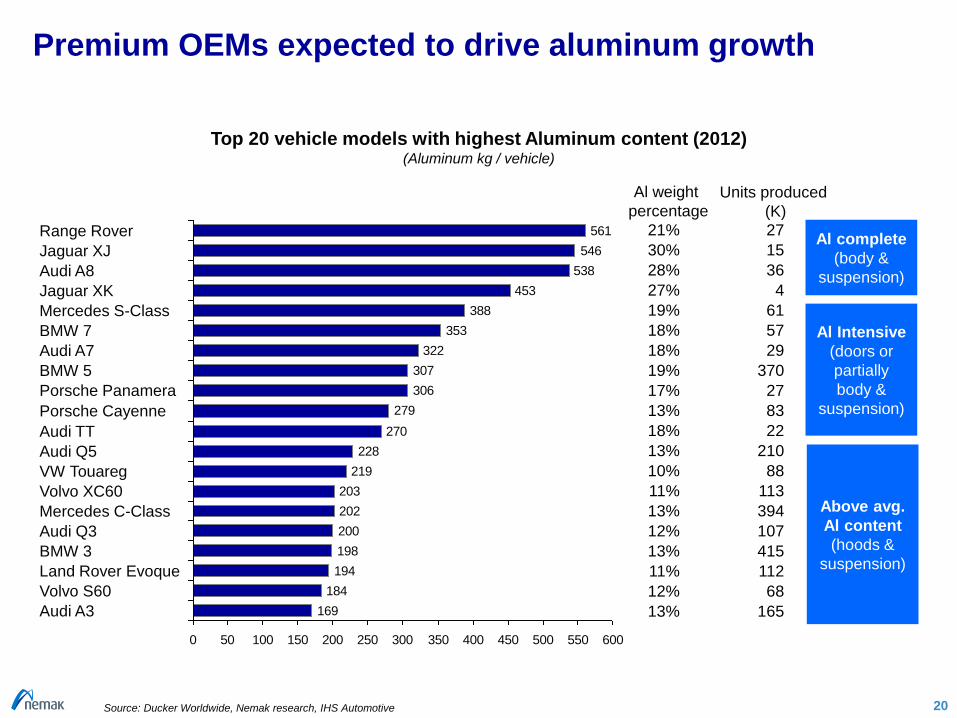
Premium OEMs expected to drive aluminum growth
20
169
184
194
198
200
202
203
219
228
270
279
306
307
322
353
388
453
538
546
561
0 50 100 150 200 250 300 350 400 450 500 550 600
Audi TT
Porsche Cayenne
Porsche Panamera
BMW 5
Audi A7
BMW 7
Mercedes S-Class
Jaguar XK
Audi A8
Jaguar XJ
Range Rover
Audi Q5
Audi A3
Volvo S60
Land Rover Evoque
BMW 3
Audi Q3
Mercedes C-Class
Volvo XC60
VW Touareg
Al complete
(body &
suspension)
Al Intensive
(doors or
partially
body &
suspension)
Above avg.
Al content
(hoods &
suspension)
21%
30%
28%
27%
19%
18%
18%
19%
17%
13%
18%
13%
10%
11%
13%
12%
13%
11%
12%
13%
Al weight
percentage
27
15
36
4
61
57
29
370
27
83
22
210
88
113
394
107
415
112
68
165
Units produced
(K)
Top 20 vehicle models with highest Aluminum content (2012)(Aluminum kg / vehicle)
Source: Ducker Worldwide, Nemak research, IHS Automotive
21
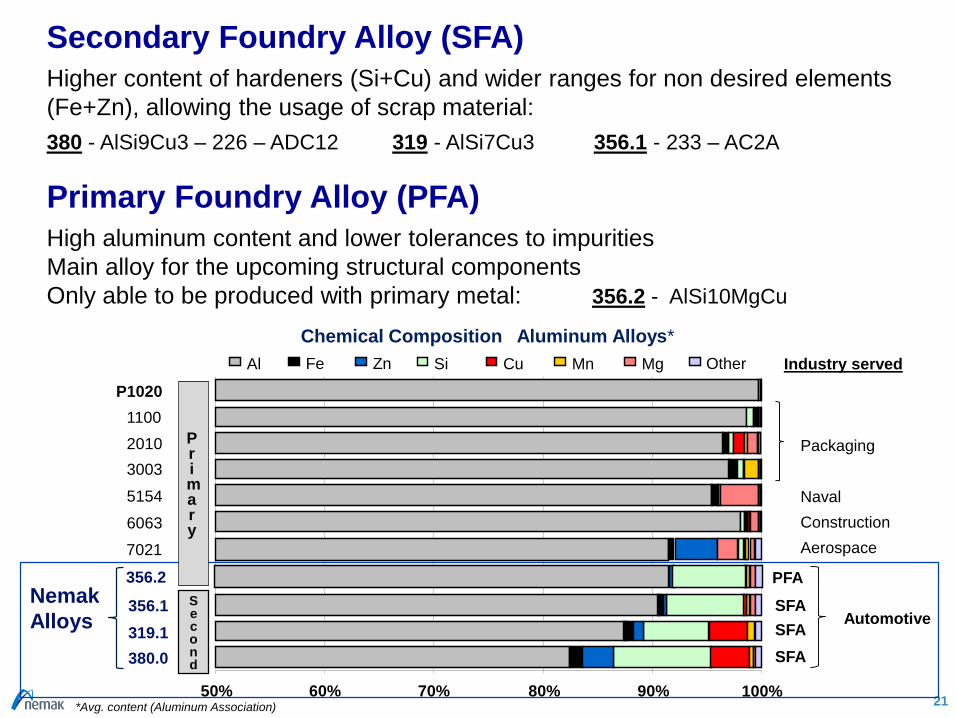
Secondary Foundry Alloy (SFA)
Higher content of hardeners (Si+Cu) and wider ranges for non desired elements
(Fe+Zn), allowing the usage of scrap material:
380 - AlSi9Cu3 – 226 – ADC12 319 - AlSi7Cu3 356.1 - 233 – AC2A
Primary Foundry Alloy (PFA)
High aluminum content and lower tolerances to impurities
Main alloy for the upcoming structural components
Only able to be produced with primary metal: 356.2 - AlSi10MgCu
Chemical Composition Aluminum Alloys*
Al Si Cu Mn MgFe Zn Other
50% 60% 70% 80% 90% 100%
Second
6063
5154
3003
2010
1100
P1020
380.0
319.1
356.1
7021
356.2
*Avg. content (Aluminum Association)
Nemak
Alloys
Packaging
Naval
Aerospace
Construction
Automotive
Industry served
Primary
PFA
SFA
SFA
SFA
Aluminum Market
22
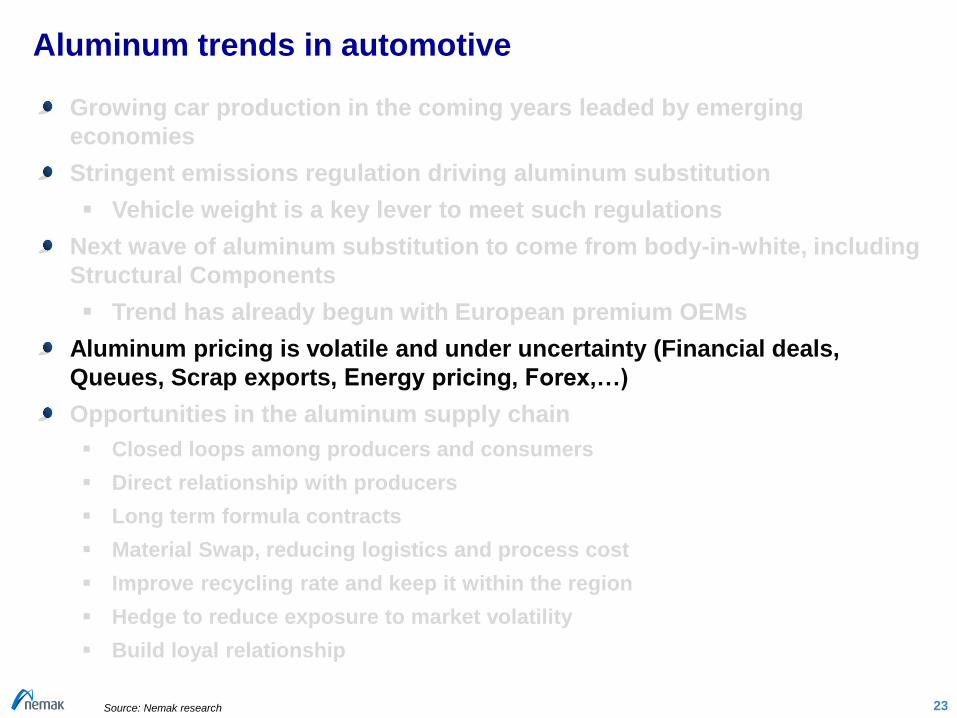
Aluminum trends in automotive
Growing car production in the coming years leaded by emerging
economies
Stringent emissions regulation driving aluminum substitution
Vehicle weight is a key lever to meet such regulations
Next wave of aluminum substitution to come from body-in-white, including
Structural Components
Trend has already begun with European premium OEMs
Aluminum pricing is volatile and under uncertainty (Financial deals,
Queues, Scrap exports, Energy pricing, Forex,…)
Opportunities in the aluminum supply chain
Closed loops among producers and consumers
Direct relationship with producers
Long term formula contracts
Material Swap, reducing logistics and process cost
Improve recycling rate and keep it within the region
Hedge to reduce exposure to market volatility
Build loyal relationship
23Source: Nemak research
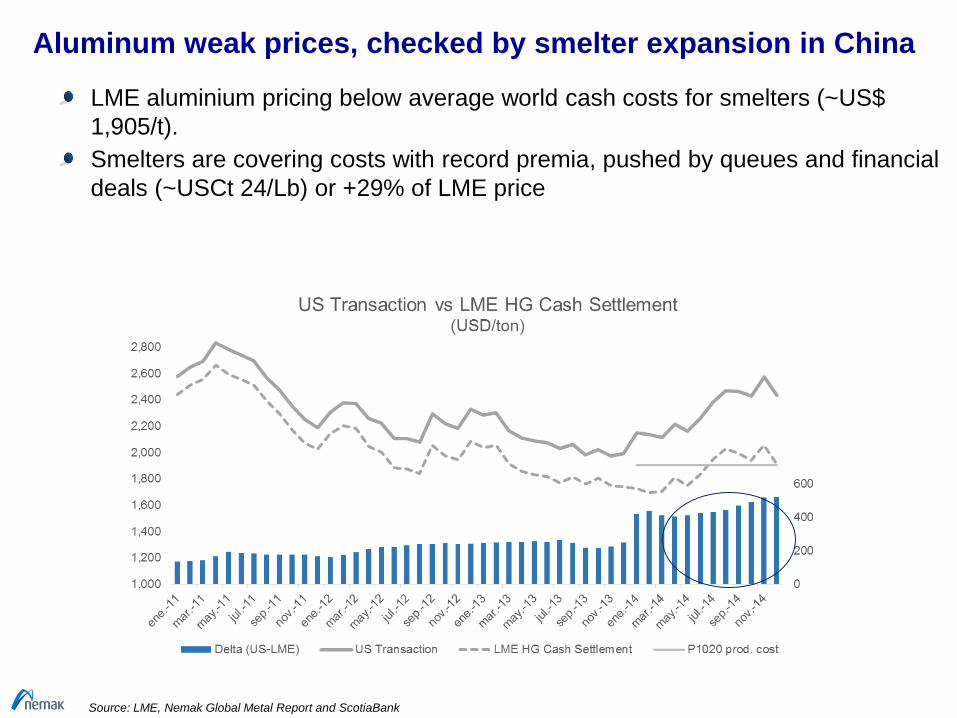
Aluminum weak prices, checked by smelter expansion in China
LME aluminium pricing below average world cash costs for smelters (~US$
1,905/t).
Smelters are covering costs with record premia, pushed by queues and financial
deals (~USCt 24/Lb) or +29% of LME price
Source: LME, Nemak Global Metal Report and ScotiaBank

25
Primary vs Secondary Alloys
Transformation
Silicon
COMEX CU
US Premium
LME AL HG
Composite Index PFAUSD/ton
Source: Nemak Global Metal Report , LME and Platt´s
High pressure alloy (380) derived to smaller discount vs primary alloys
MW380
Composite Index554
142
26
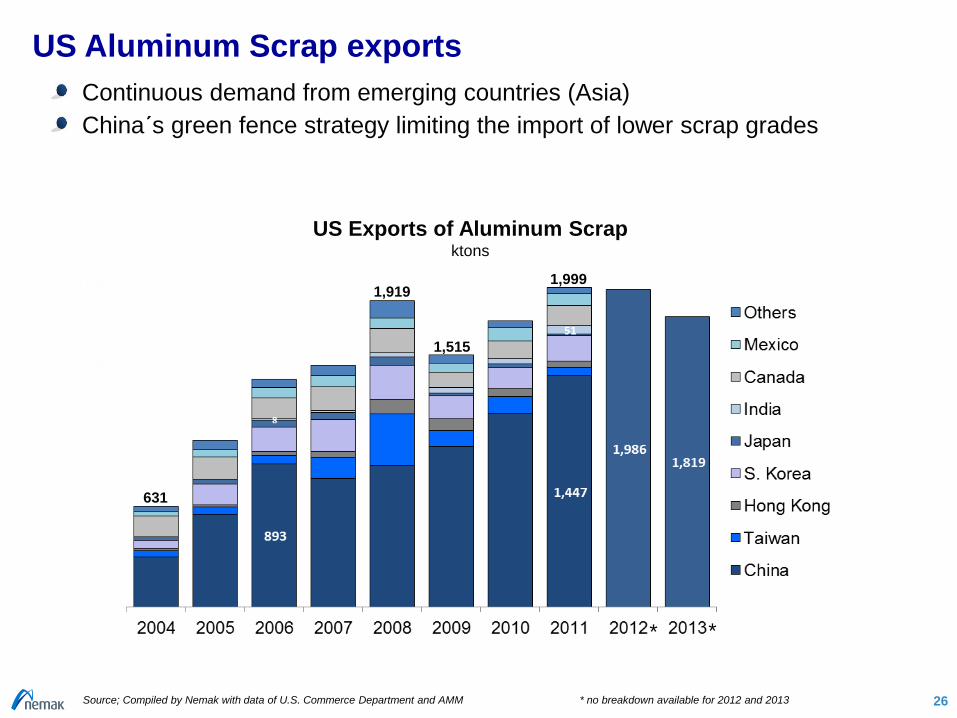
US Aluminum Scrap exports
Continuous demand from emerging countries (Asia)
China´s green fence strategy limiting the import of lower scrap grades
Source; Compiled by Nemak with data of U.S. Commerce Department and AMM * no breakdown available for 2012 and 2013
US Exports of Aluminum Scrapktons
* *
1,919
631
1,999
1,515
27
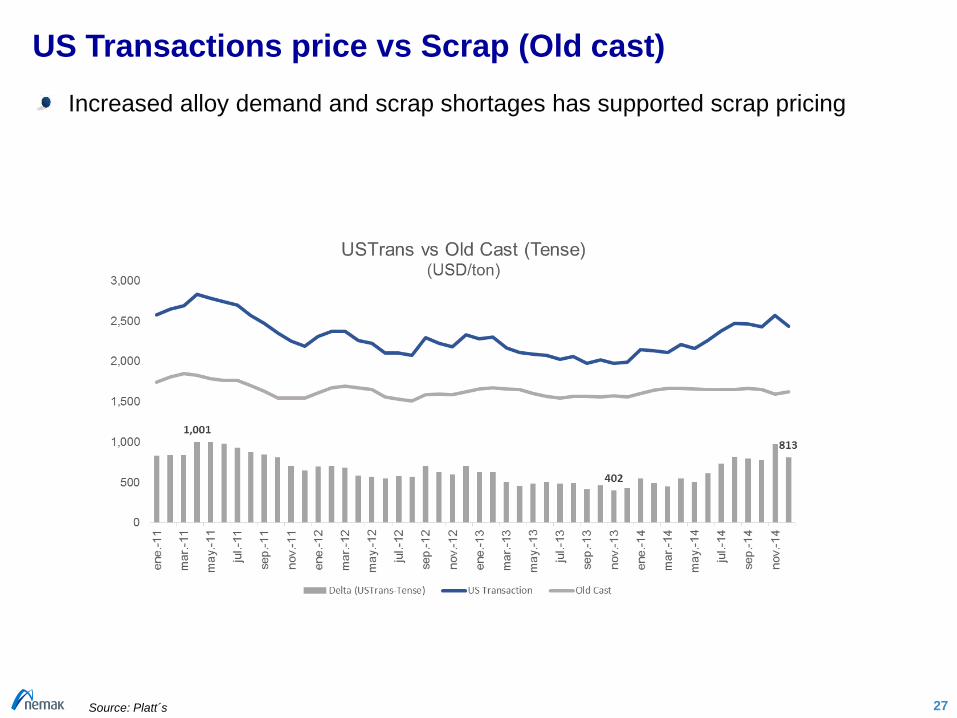
US Transactions price vs Scrap (Old cast)
Increased alloy demand and scrap shortages has supported scrap pricing
Source: Platt´s
28
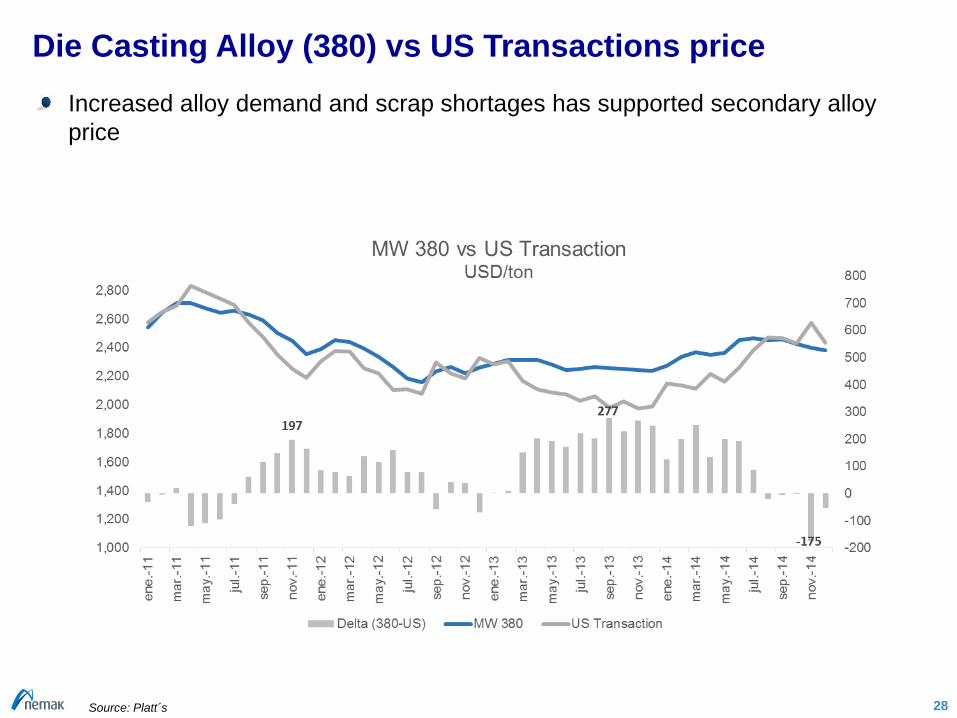
Die Casting Alloy (380) vs US Transactions price
Increased alloy demand and scrap shortages has supported secondary alloy
price
Source: Platt´s
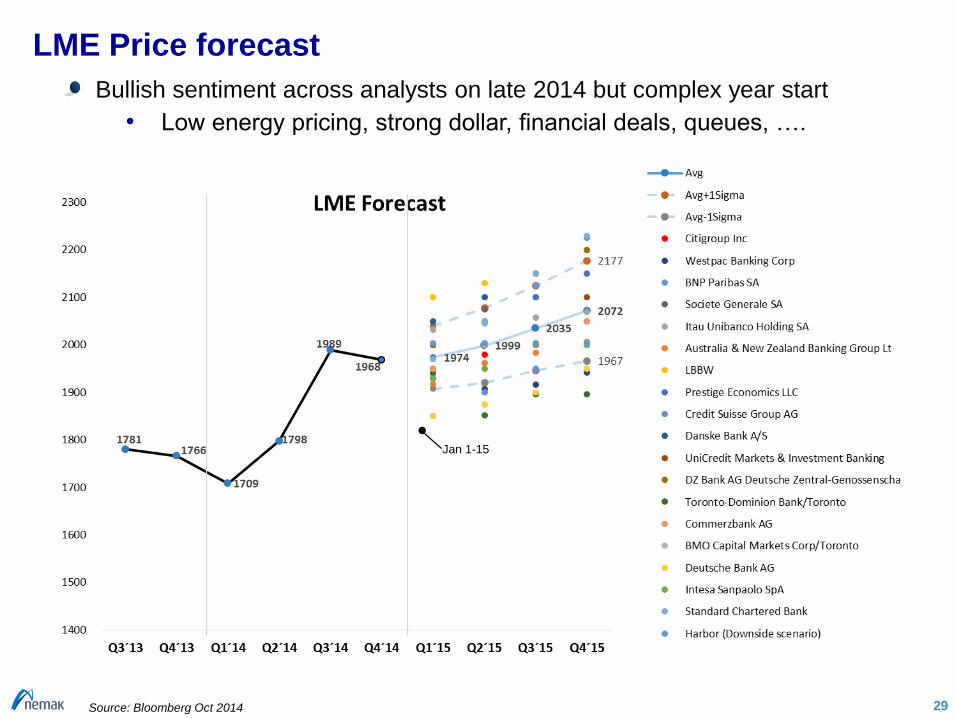
LME Price forecast
29
Bullish sentiment across analysts on late 2014 but complex year start
• Low energy pricing, strong dollar, financial deals, queues, ….
Source: Bloomberg Oct 2014
Jan 1-15
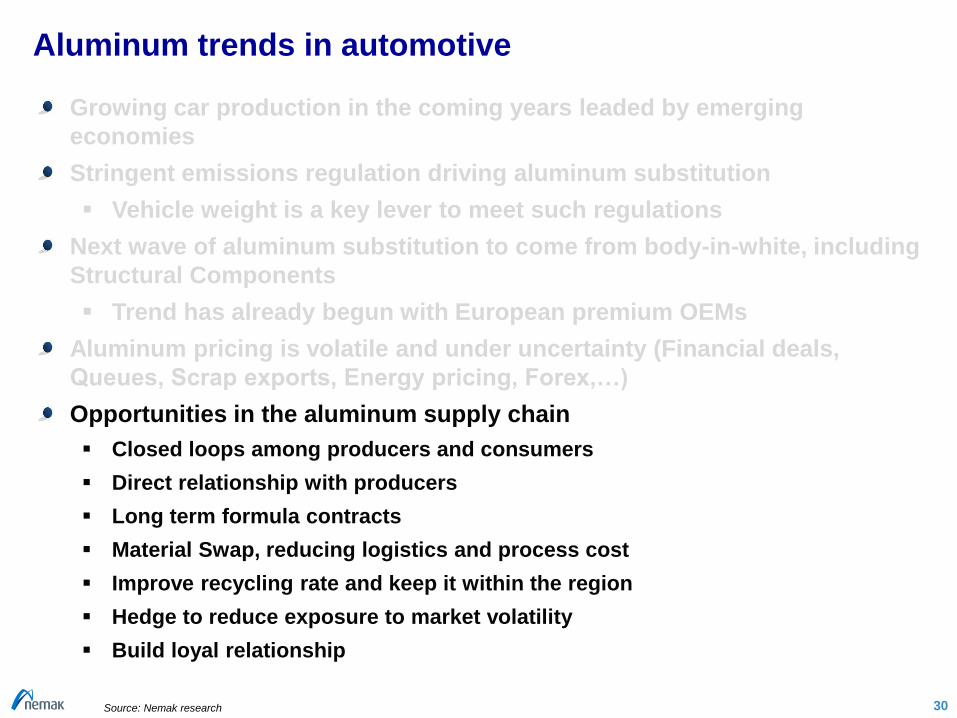
Aluminum trends in automotive
Growing car production in the coming years leaded by emerging
economies
Stringent emissions regulation driving aluminum substitution
Vehicle weight is a key lever to meet such regulations
Next wave of aluminum substitution to come from body-in-white, including
Structural Components
Trend has already begun with European premium OEMs
Aluminum pricing is volatile and under uncertainty (Financial deals,
Queues, Scrap exports, Energy pricing, Forex,…)
Opportunities in the aluminum supply chain
Closed loops among producers and consumers
Direct relationship with producers
Long term formula contracts
Material Swap, reducing logistics and process cost
Improve recycling rate and keep it within the region
Hedge to reduce exposure to market volatility
Build loyal relationship
30Source: Nemak research
Recommended