Auto Injury Claims:The What, Why, and How of it All
CAS Spring Meeting – May 16, 2005 Phoenix, AZ
Adam Carmichael, IRC Senior Research Associate

• Methodology
What
• Sample
• History
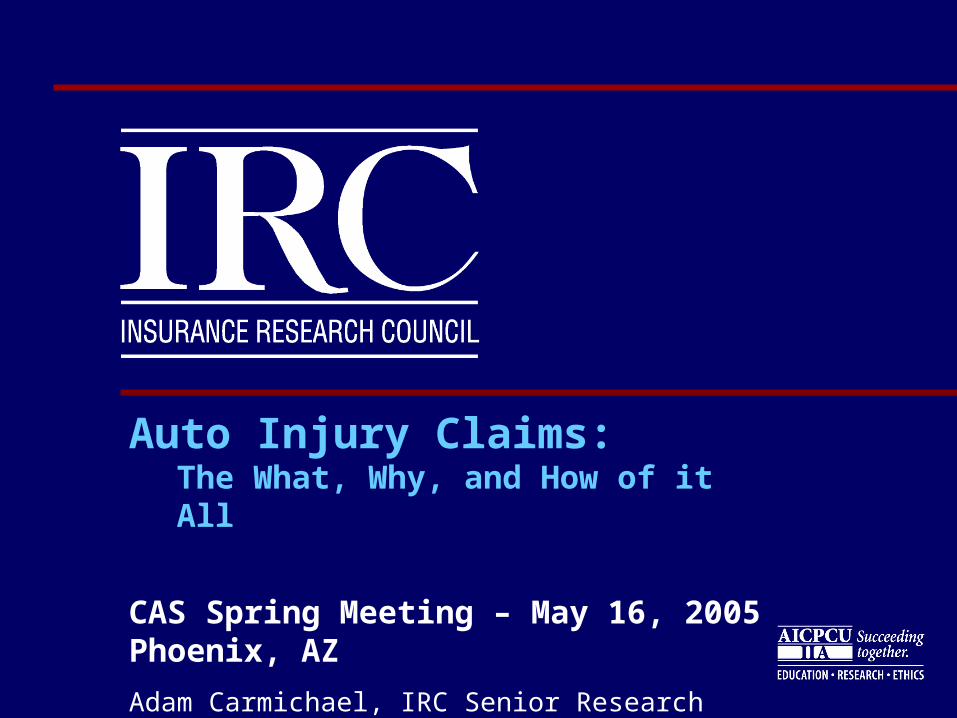
IRC Study of Closed Auto Injury Claims
Are injuries becoming more serious?
No.
• Injury types show little change.
• Claimants overall appear to be less seriously injured than in the past.
2002 Study of Closed Injury Claims
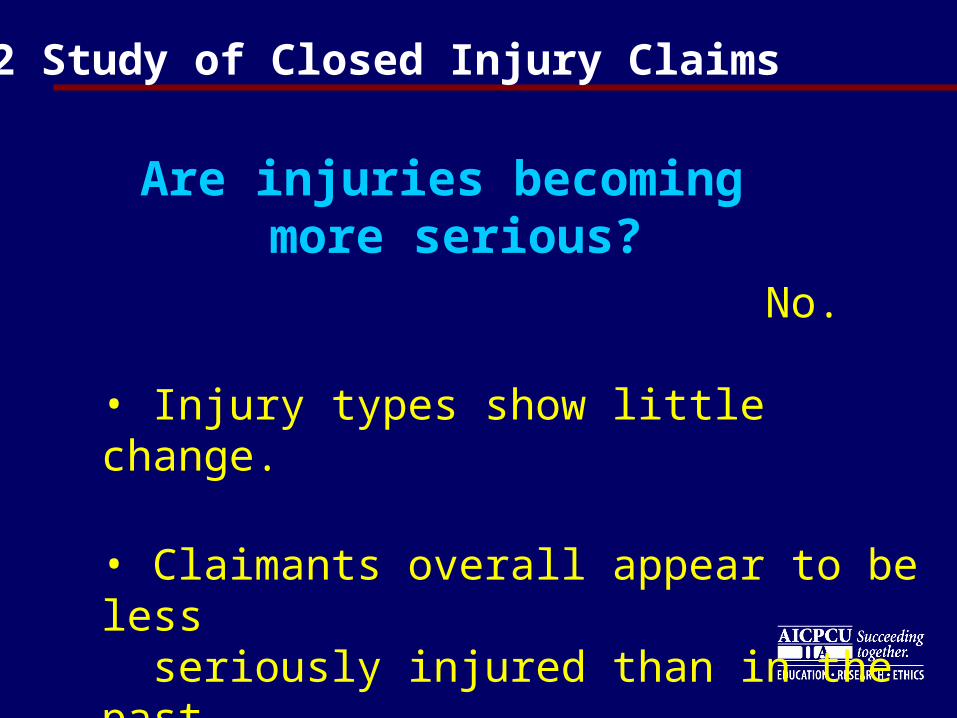
2002 BI Injury Types Are Similar to Those in 1997
4%
6%
8%
10%
11%
11%
10%
55%
66%
3%
5%
7%
9%
2%
12%
9%
56%
66%
Disc injury
Fractures
Knee injury
Shoulder injury
Headache*
Minor cuts/bruises
Other sprain/strain
Back sprain/strain
Neck sprain/strain
1997
2002
*Headache was a write-in category in 1997.
Percentage of BI claimants with each type of injury
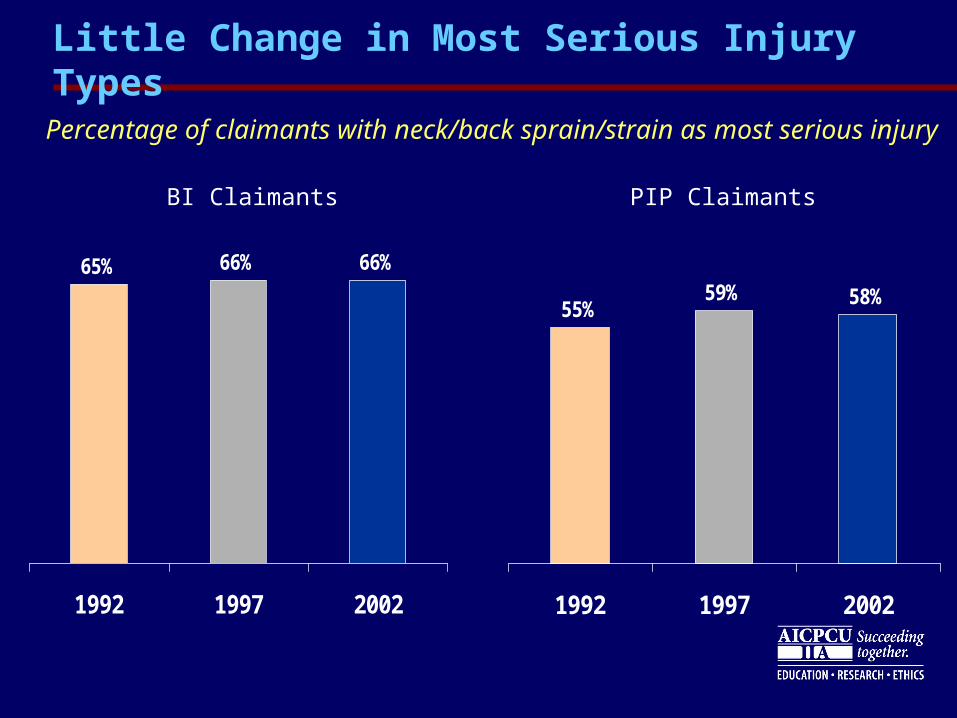
Little Change in Most Serious Injury Types
65% 66% 66%
1992 1997 2002
BI Claimants PIP Claimants
55%59% 58%
1992 1997 2002
Percentage of claimants with neck/back sprain/strain as most serious injury
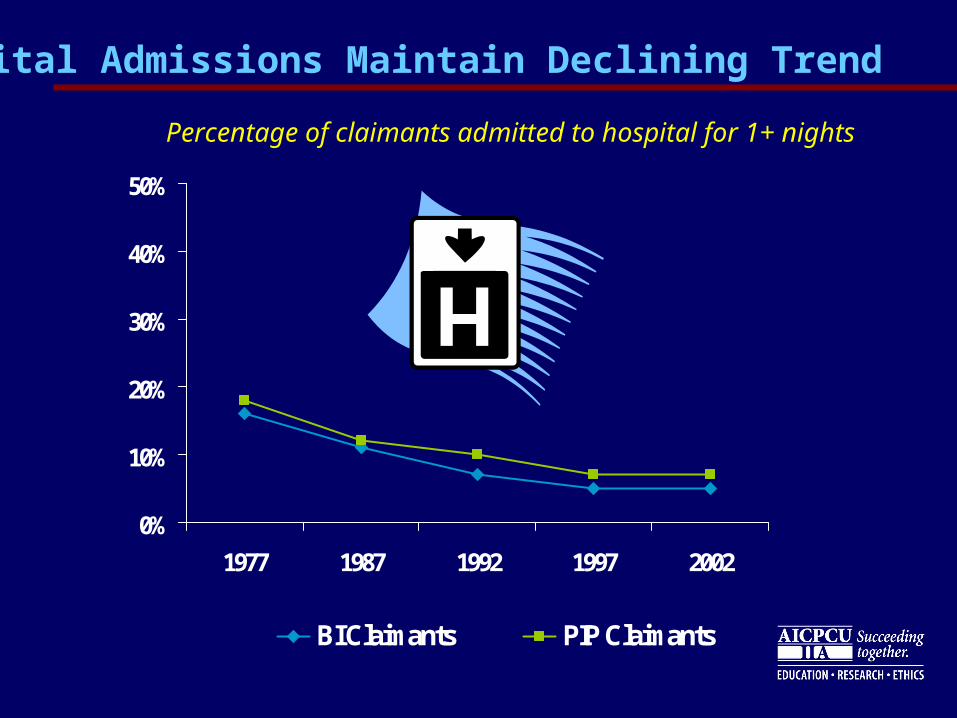
Hospital Admissions Maintain Declining Trend
0%
10%
20%
30%
40%
50%
1977 1987 1992 1997 2002
BI Claimants PIP Claimants
Percentage of claimants admitted to hospital for 1+ nights
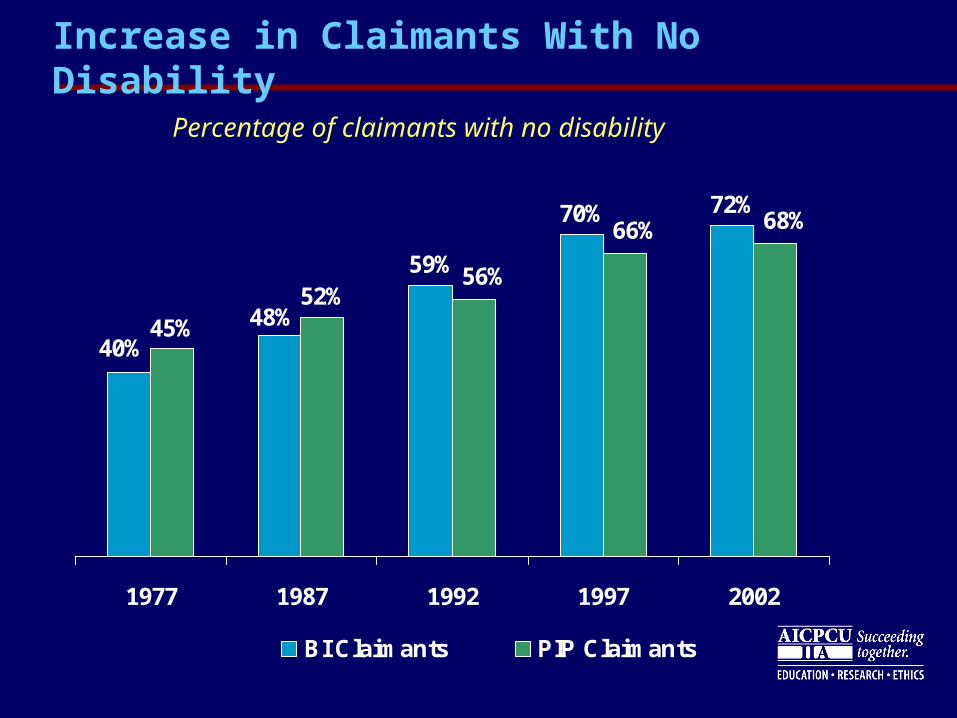
Increase in Claimants With No Disability
59%
70% 72%
45%52%
48%40%
68%66%
56%
1977 1987 1992 1997 2002
BI Claimants PIP Claimants
Percentage of claimants with no disability
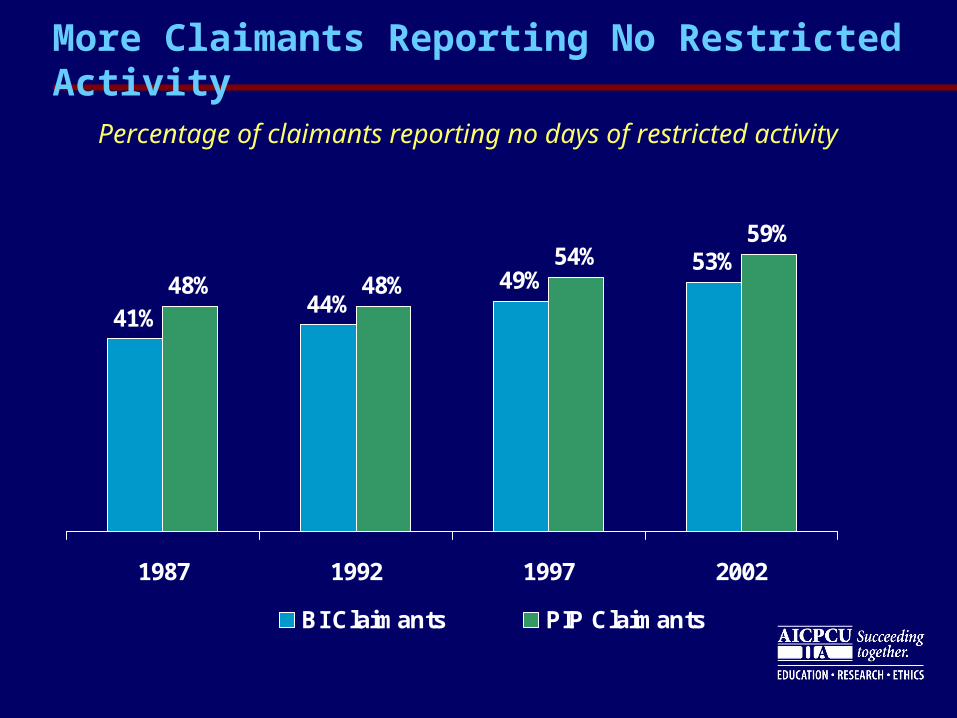
More Claimants Reporting No Restricted Activity
41%44%
49%53%
48% 48%54%
59%
1987 1992 1997 2002
BI Claimants PIP Claimants
Percentage of claimants reporting no days of restricted activity
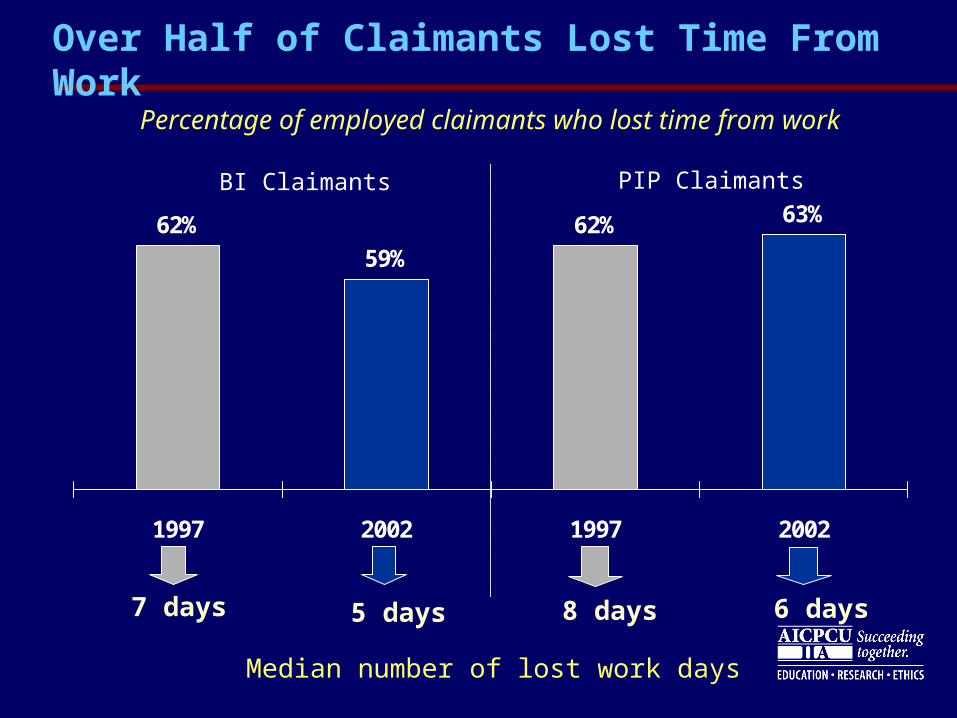
Over Half of Claimants Lost Time From Work
62%
59%
62% 63%
1997 2002 1997 2002
Percentage of employed claimants who lost time from work
7 days 5 days 8 days 6 days
BI Claimants PIP Claimants
Median number of lost work days
Trends in the medical treatment of injuries
• Shift towards more expensive alternatives
• Rise in per-visit costs
2002 Study of Closed Injury Claims
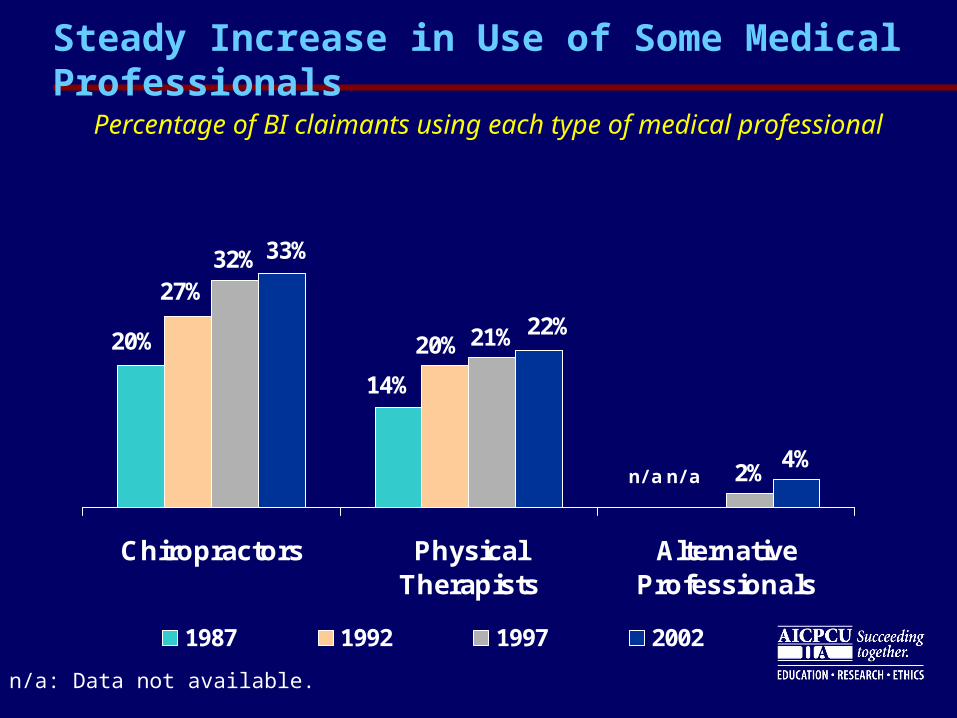
Steady Increase in Use of Some Medical Professionals
32%
21%
2%4%
14%
20% 20%
27%
33%
22%
Chiropractors PhysicalTherapists
AlternativeProfessionals
1987 1992 1997 2002
Percentage of BI claimants using each type of medical professional
n/a n/a
n/a: Data not available.
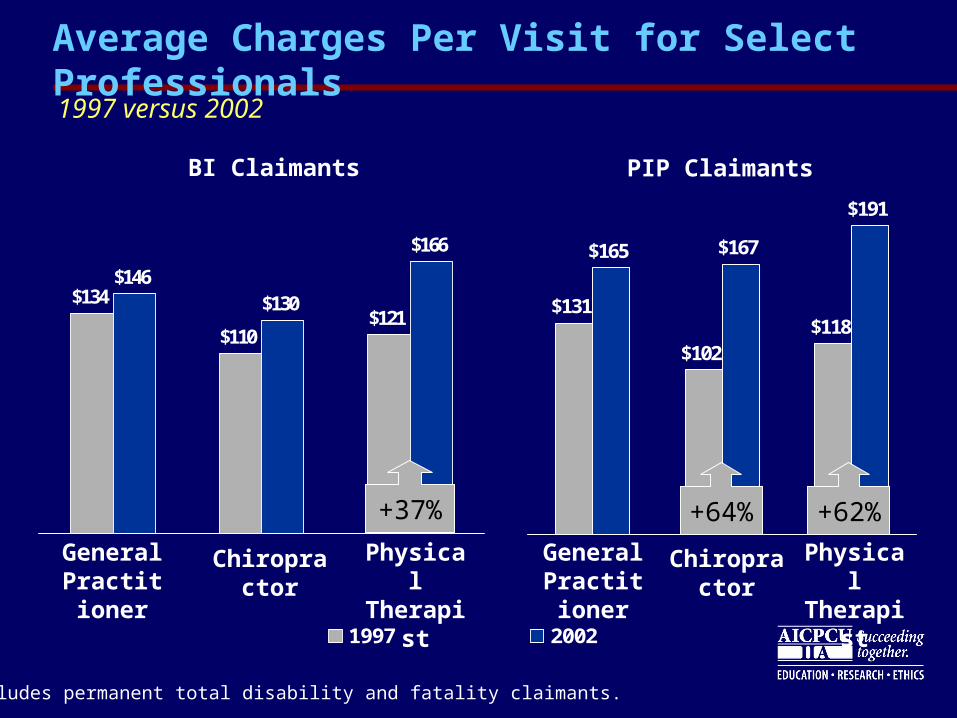
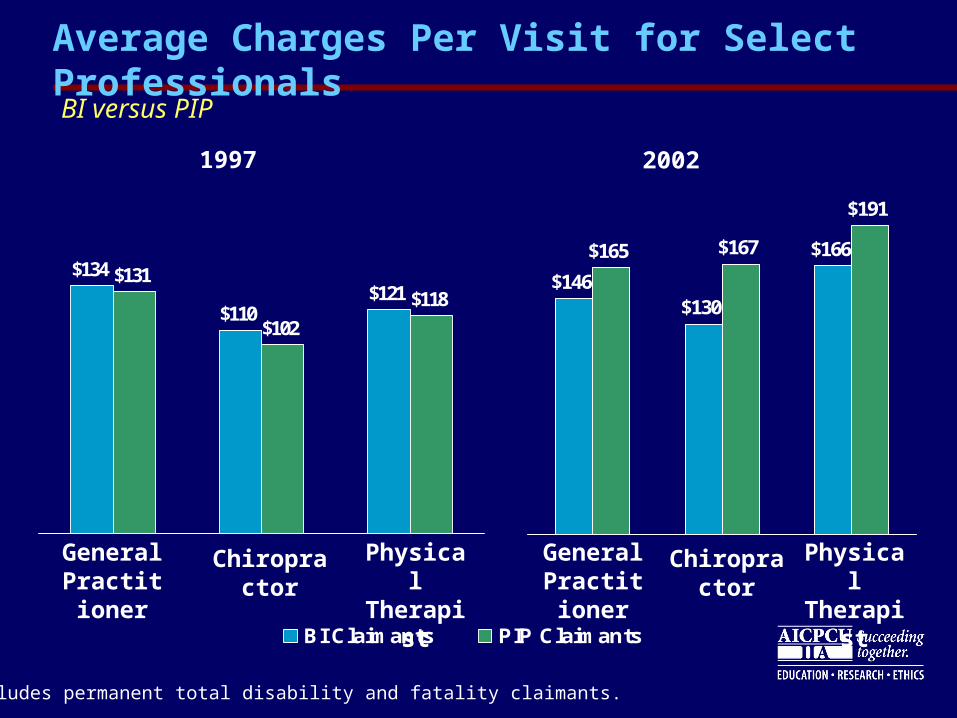
$134
$110$121
$146$130
$166
1997 2002
ChiropractorGeneral Practitioner
Chiropractor Physical Therapist
BI Claimants
Average Charges Per Visit for Select Professionals
$131
$102$118
$165 $167
$191
General Practitioner
Physical Therapist
PIP Claimants
Excludes permanent total disability and fatality claimants.
+37% +64% +62%
1997 versus 2002
$134
$110$121
$131
$102
$118
BI Claimants PIP Claimants
ChiropractorGeneral Practitioner
Chiropractor Physical Therapist
1997
Average Charges Per Visit for Select Professionals
$146$130
$166$165 $167
$191
General Practitioner
Physical Therapist
2002
Excludes permanent total disability and fatality claimants.
BI versus PIP
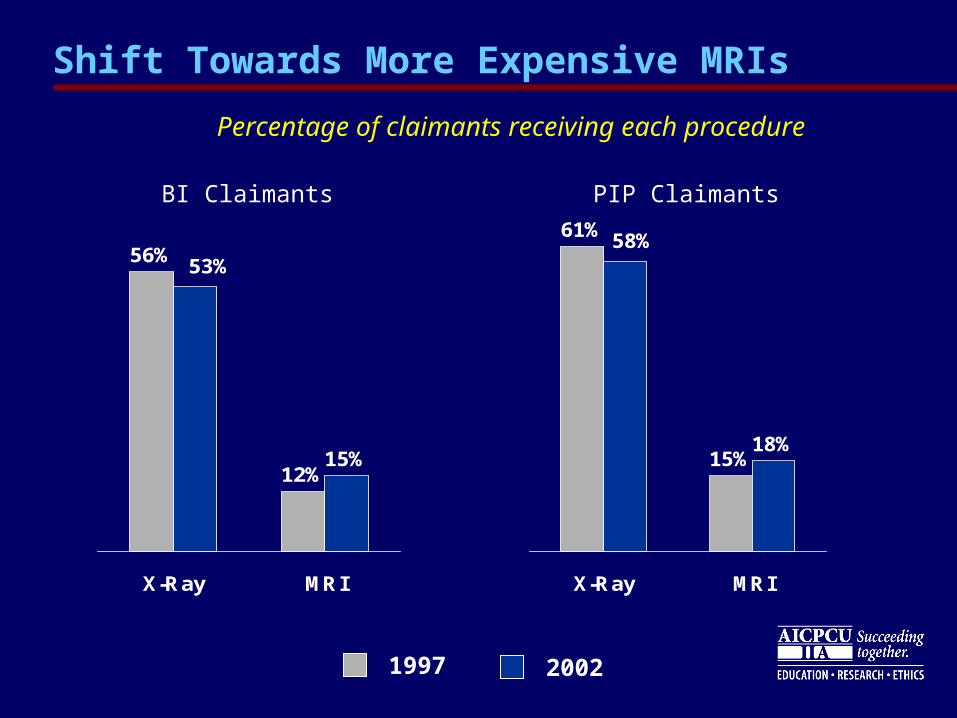
Shift Towards More Expensive MRIs
56%
12%15%
53%
X-Ray MRI
61%
15%18%
58%
X-Ray MRI
1997 2002
Percentage of claimants receiving each procedure
BI Claimants PIP Claimants
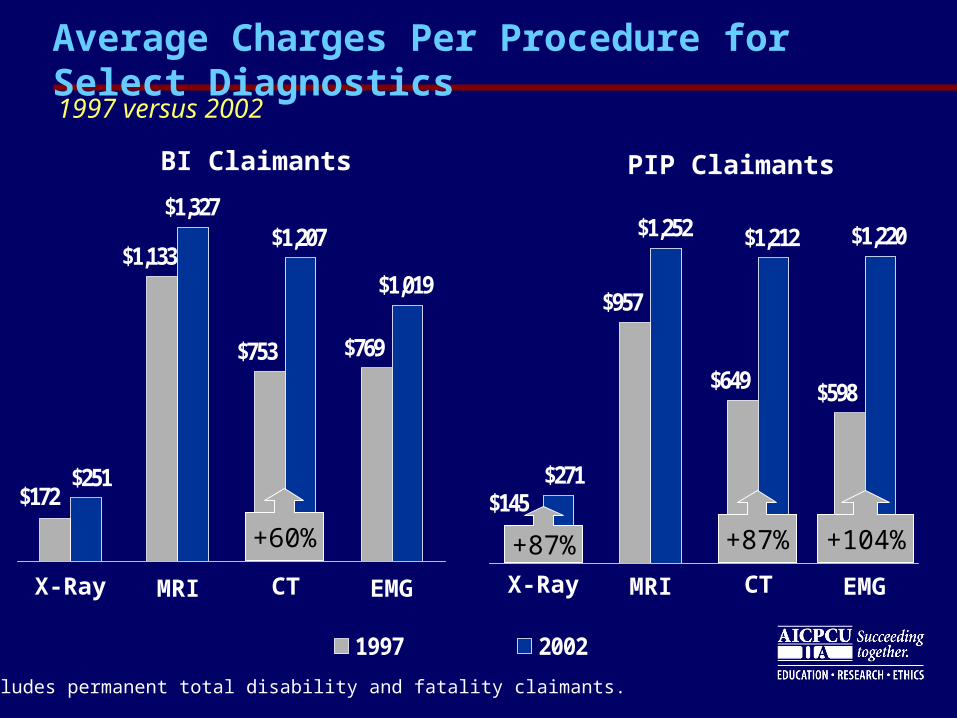
$1,252 $1,212 $1,220
$145
$598$649
$957
$271
$1,327$1,207
$1,019
$172
$769$753
$1,133
$251
1997 2002
BI Claimants
Average Charges Per Procedure for Select Diagnostics
PIP Claimants
X-Ray X-RayMRI MRICT CTEMG EMG
Excludes permanent total disability and fatality claimants.
+60% +87% +87% +104%
1997 versus 2002
2002 Study of Closed Injury Claims
Reported economic losses (special damages) have
surged.• Largely driven by growth in medical expenses
• Growth in wage and other losses more modest
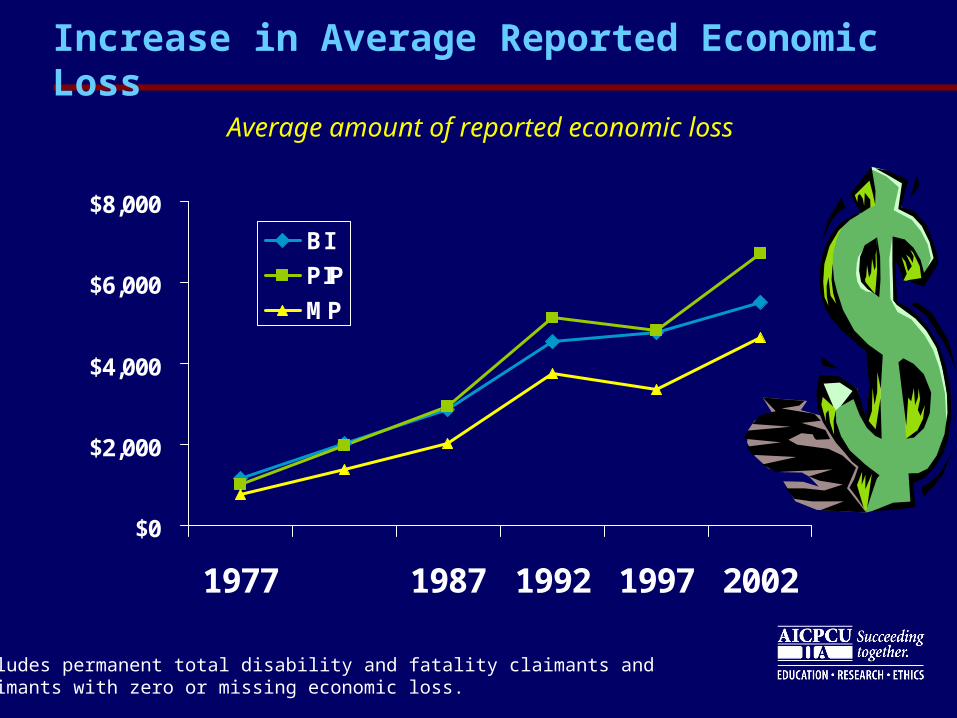
Increase in Average Reported Economic Loss
$0
$2,000
$4,000
$6,000
$8,000
1977 1987 1992 1997 2002
BI
PIP
MP
Excludes permanent total disability and fatality claimants andclaimants with zero or missing economic loss.
Average amount of reported economic loss
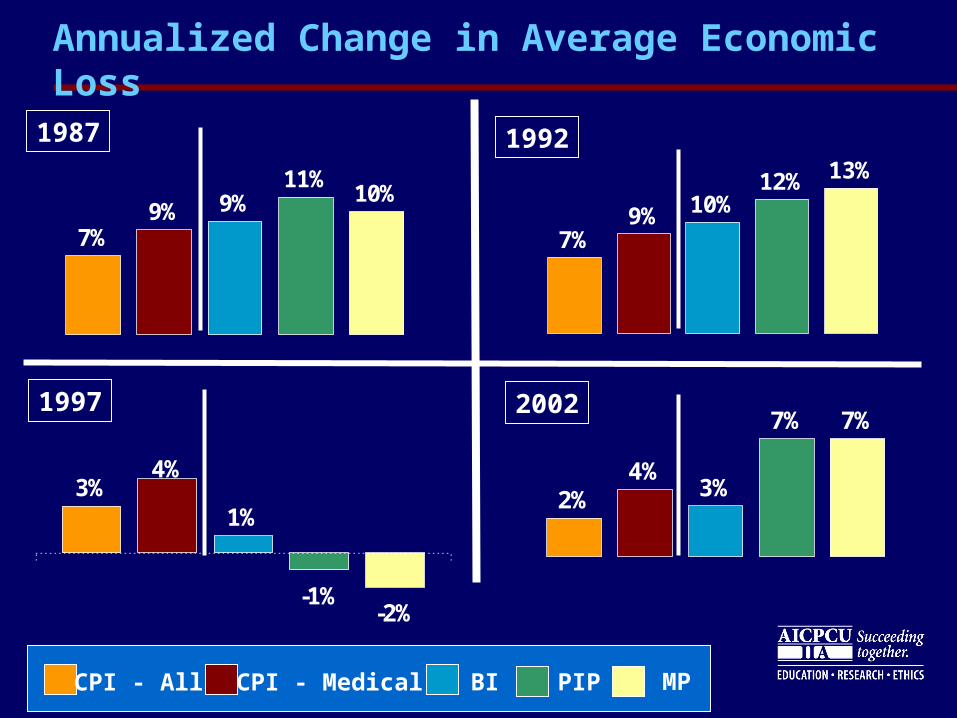
Annualized Change in Average Economic Loss
9% 9%11%
10%
7%
1987
7%9% 10%
12% 13%1992
4%
1%
-1%-2%
3%
1997
2%4%
3%
7% 7%2002
BI PIP MPCPI - All CPI - Medical
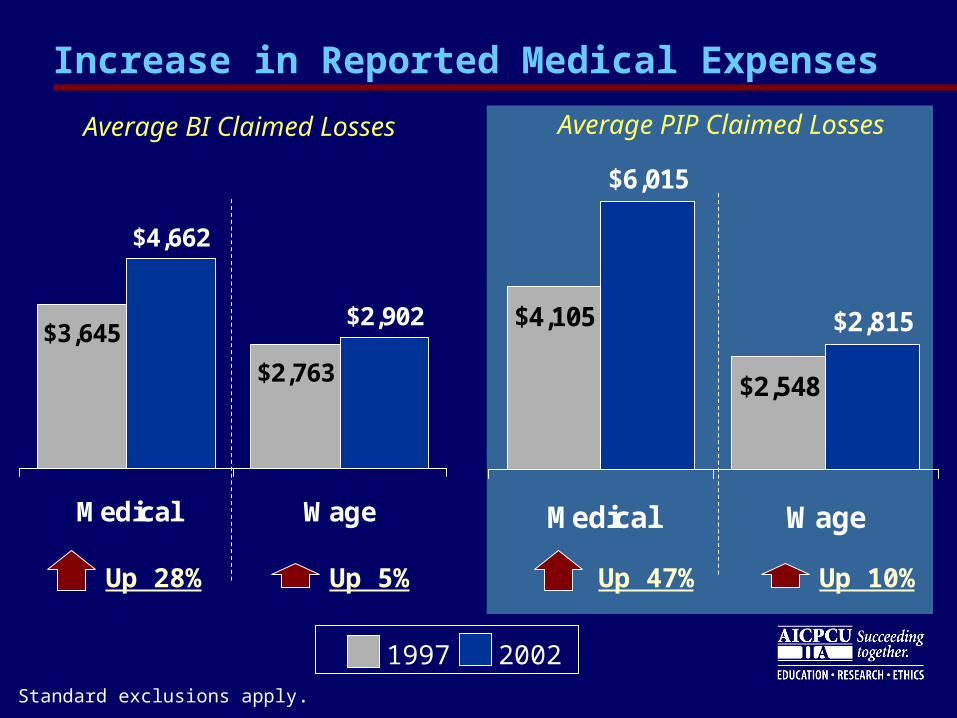
Increase in Reported Medical Expenses
$3,645
$2,763
$4,662
$2,902
Medical Wage
Up 28% Up 5%
Average BI Claimed Losses
Up 47% Up 10%
1997 2002
Standard exclusions apply.
$4,105
$2,548
$6,015
$2,815
Medical Wage
Average PIP Claimed Losses
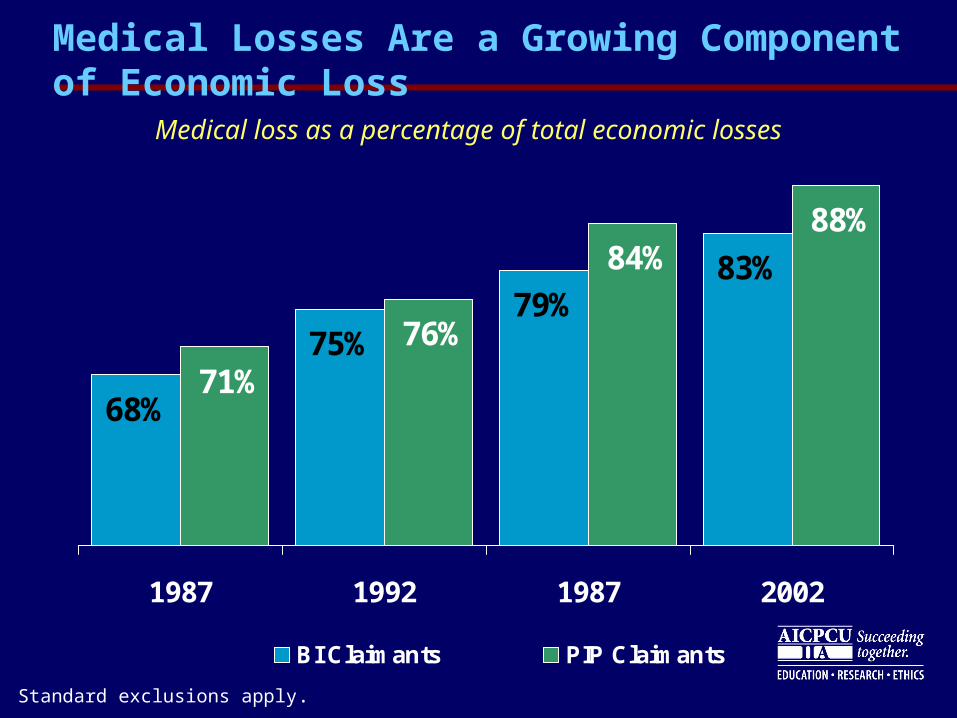
Medical Losses Are a Growing Component of Economic Loss
68%
75%79%
83%
71%
76%
84% 88%
1987 1992 1987 2002
BI Claimants PIP Claimants
Medical loss as a percentage of total economic losses
Standard exclusions apply.
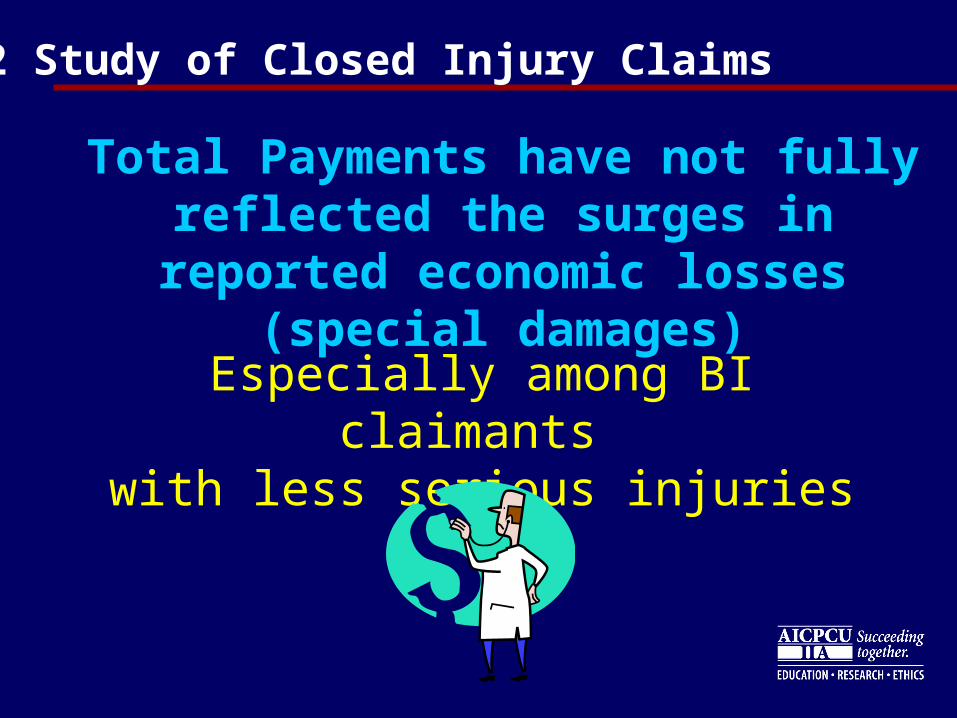
2002 Study of Closed Injury Claims
Total Payments have not fully reflected the surges in reported
economic losses (special damages)
Especially among BI claimants with less serious injuries
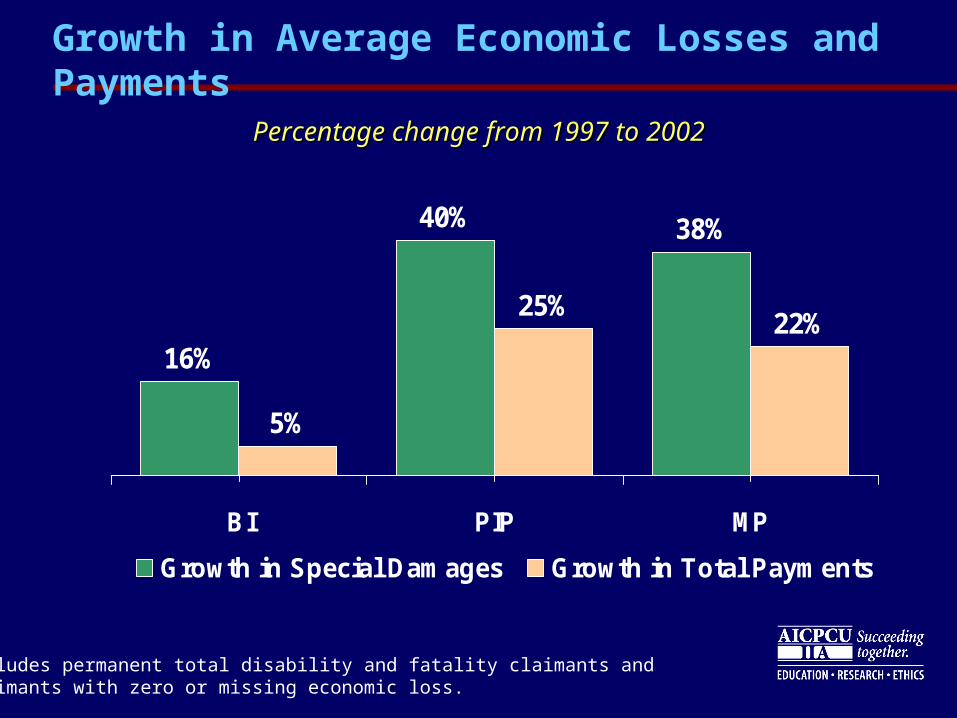
Growth in Average Economic Losses and Payments
16%
40% 38%
5%
25%22%
BI PIP MP
Growth in Special Damages Growth in Total Payments
Percentage change from 1997 to 2002Percentage change from 1997 to 2002
Excludes permanent total disability and fatality claimants andclaimants with zero or missing economic loss.
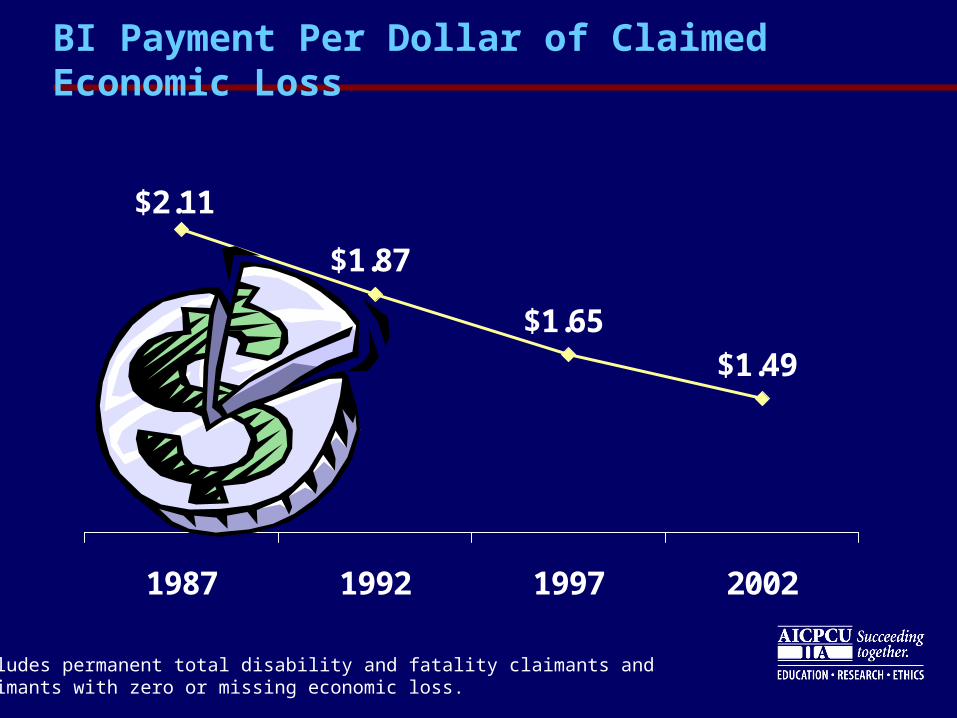
$1.87
$1.65$1.49
$2.11
1987 1992 1997 2002
BI Payment Per Dollar of Claimed Economic Loss
Excludes permanent total disability and fatality claimants andclaimants with zero or missing economic loss.
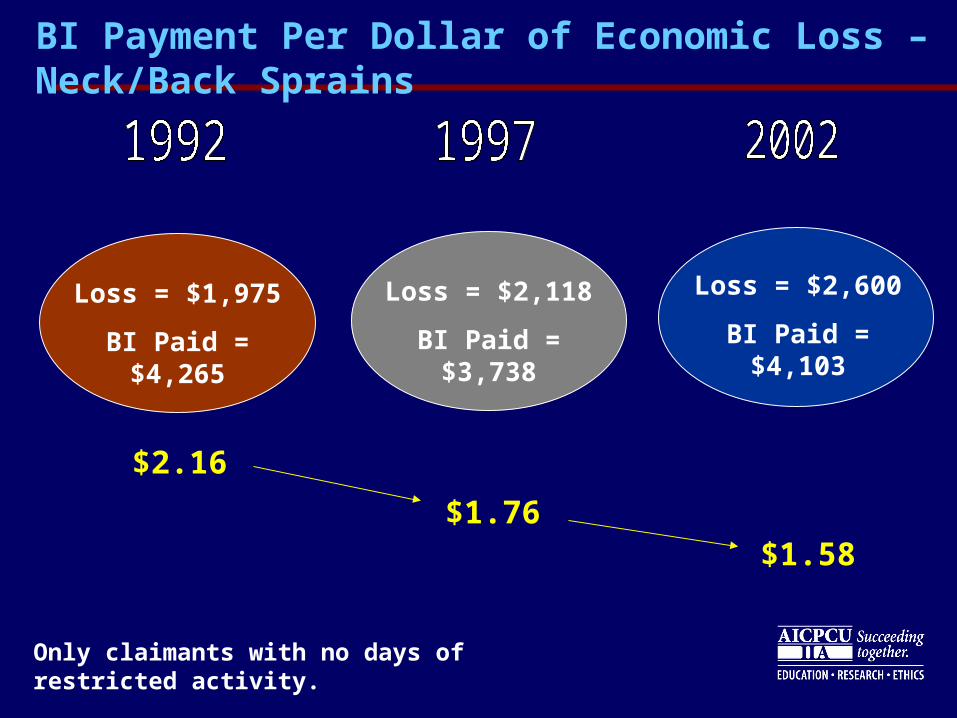
Loss = $1,975
BI Paid = $4,265
Loss = $2,118
BI Paid = $3,738
Loss = $2,600
BI Paid = $4,103
BI Payment Per Dollar of Economic Loss – Neck/Back Sprains
Only claimants with no days of restricted activity.
$2.16
$1.76$1.58
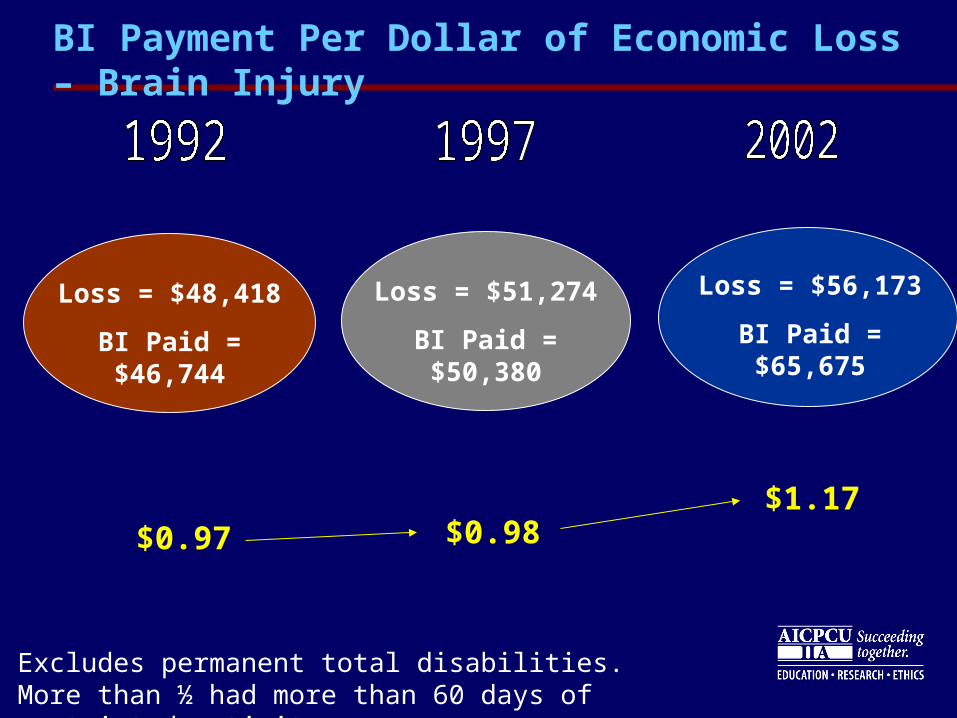
Loss = $48,418
BI Paid = $46,744
Loss = $51,274
BI Paid = $50,380
Loss = $56,173
BI Paid = $65,675
BI Payment Per Dollar of Economic Loss – Brain Injury
$0.97 $0.98$1.17
Excludes permanent total disabilities.More than ½ had more than 60 days of restricted activity.
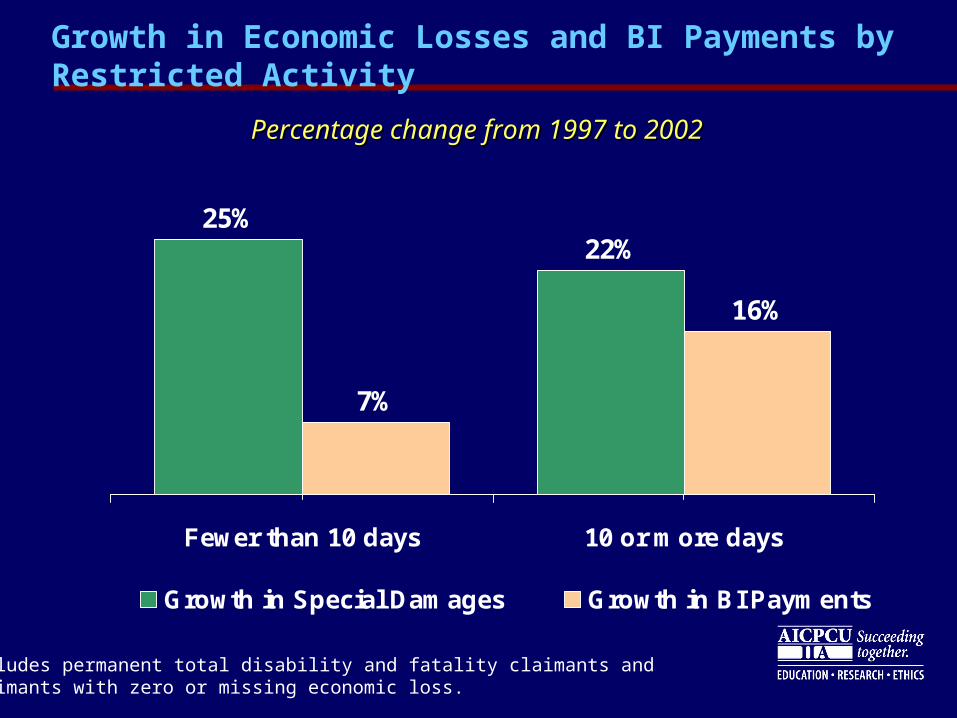
Growth in Economic Losses and BI Payments by Restricted Activity
25%22%
7%
16%
Fewer than 10 days 10 or more days
Growth in Special Damages Growth in BI Payments
Percentage change from 1997 to 2002Percentage change from 1997 to 2002
Excludes permanent total disability and fatality claimants andclaimants with zero or missing economic loss.
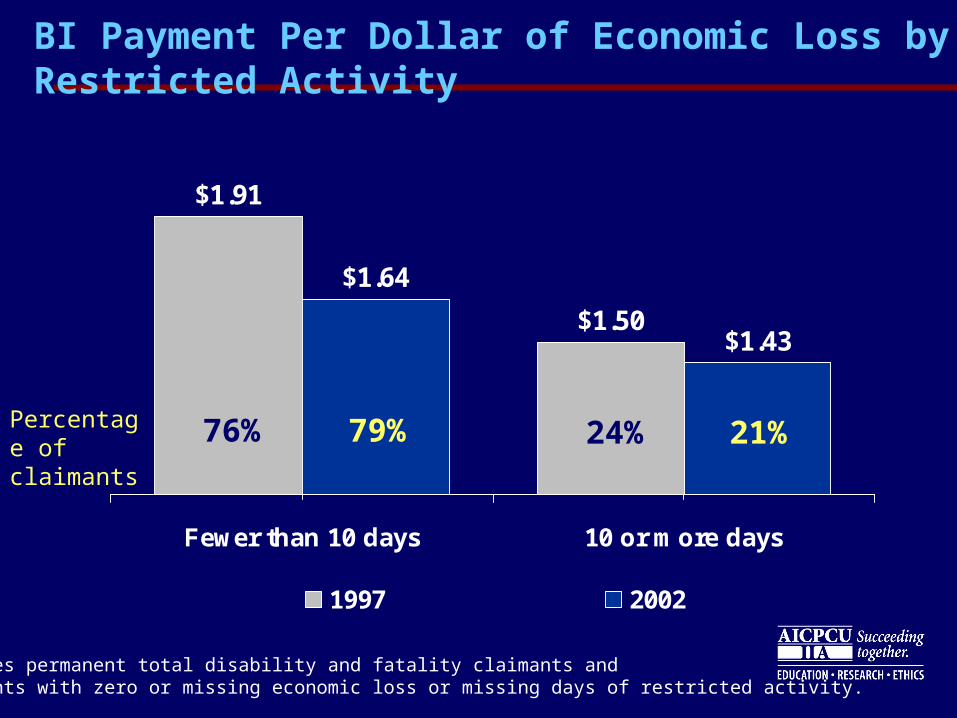
BI Payment Per Dollar of Economic Loss by Restricted Activity
$1.91
$1.50
$1.64
$1.43
Fewer than 10 days 10 or more days
1997 2002
Excludes permanent total disability and fatality claimants andclaimants with zero or missing economic loss or missing days of restricted activity.
Percentage of claimants
76% 79% 21%24%
Claim Handling Techniques
2002 Study of Closed Injury Claims
Help ensure that claimants with legitimate injuries are fairly
compensated
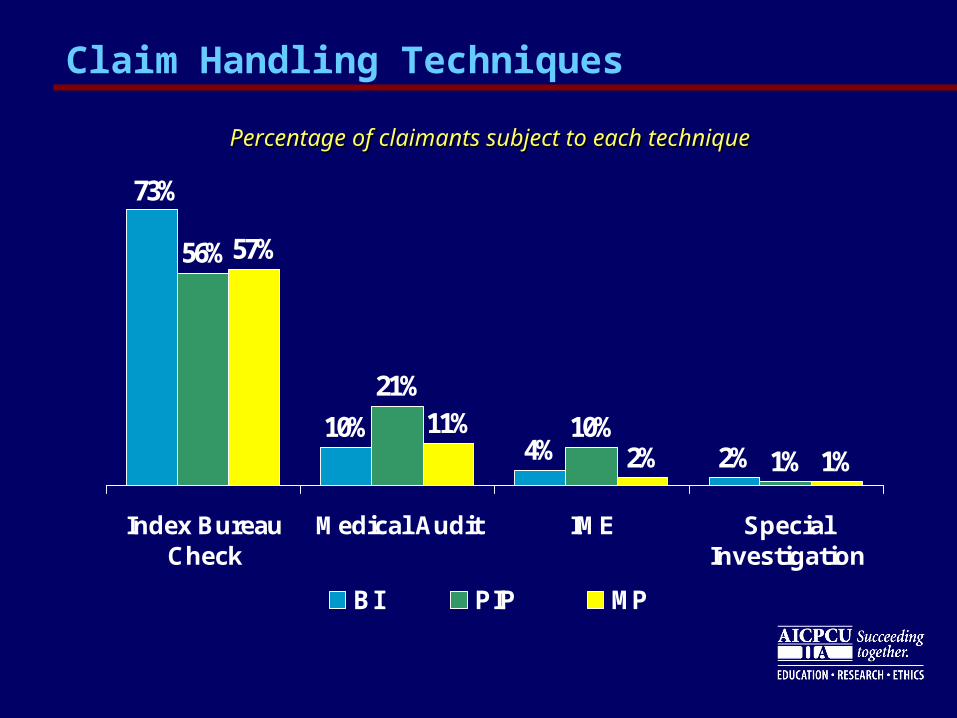
Claim Handling Techniques
10%4% 2%
56%
21%
10%1%
57%
11%2% 1%
73%
Index BureauCheck
Medical Audit IME SpecialInvestigation
BI PIP MP
Percentage of claimants subject to each techniquePercentage of claimants subject to each technique
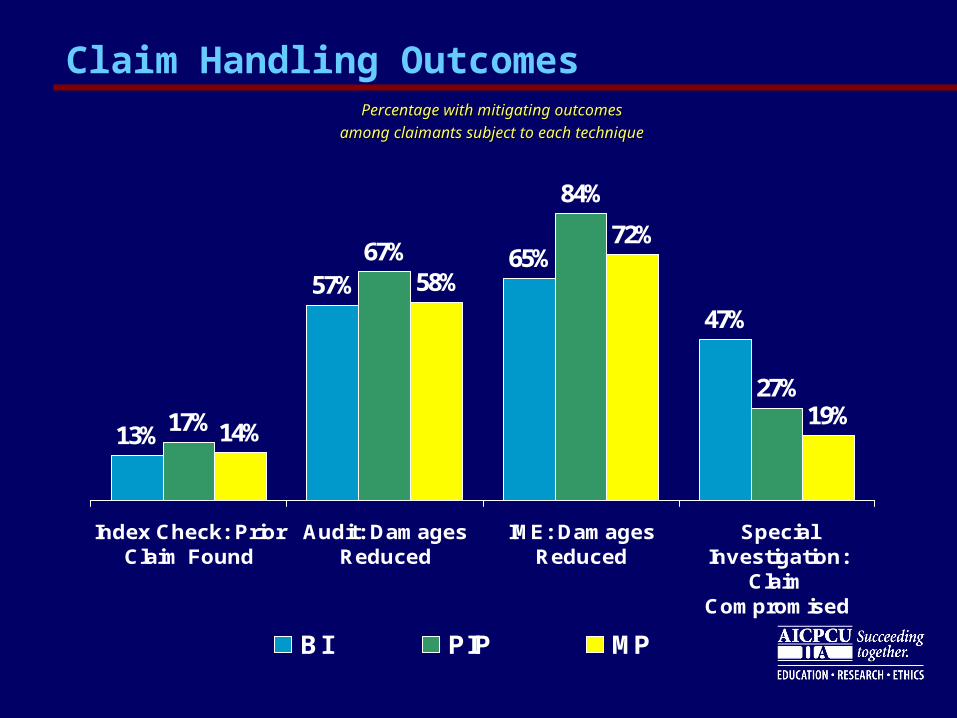
Claim Handling Outcomes
13%
57%65%
47%
17%
67%
84%
27%
14%
58%
72%
19%
Index Check: PriorClaim Found
Audit: DamagesReduced
IME: DamagesReduced
SpecialInvestigation:
ClaimCompromised
BI PIP MP
Percentage with mitigating outcomesPercentage with mitigating outcomes
among claimants subject to each techniqueamong claimants subject to each technique

AttorneyInvolvement
• Fewer claimants are hiring attorneys • Claimants without attorneys receive higher
net payment and experience faster settlement
2002 Study of Closed Injury Claims
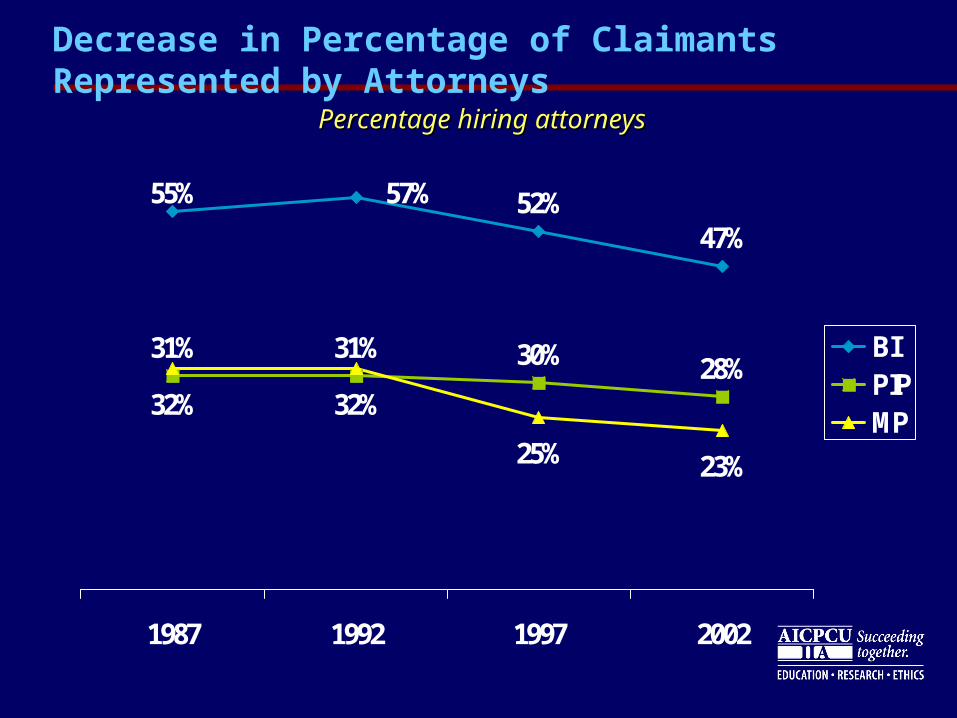
Decrease in Percentage of Claimants Represented by Attorneys
55% 52%47%
31% 31% 30% 28%32% 32%
25% 23%
57%
1987 1992 1997 2002
BIPIPMP
Percentage hiring attorneysPercentage hiring attorneys
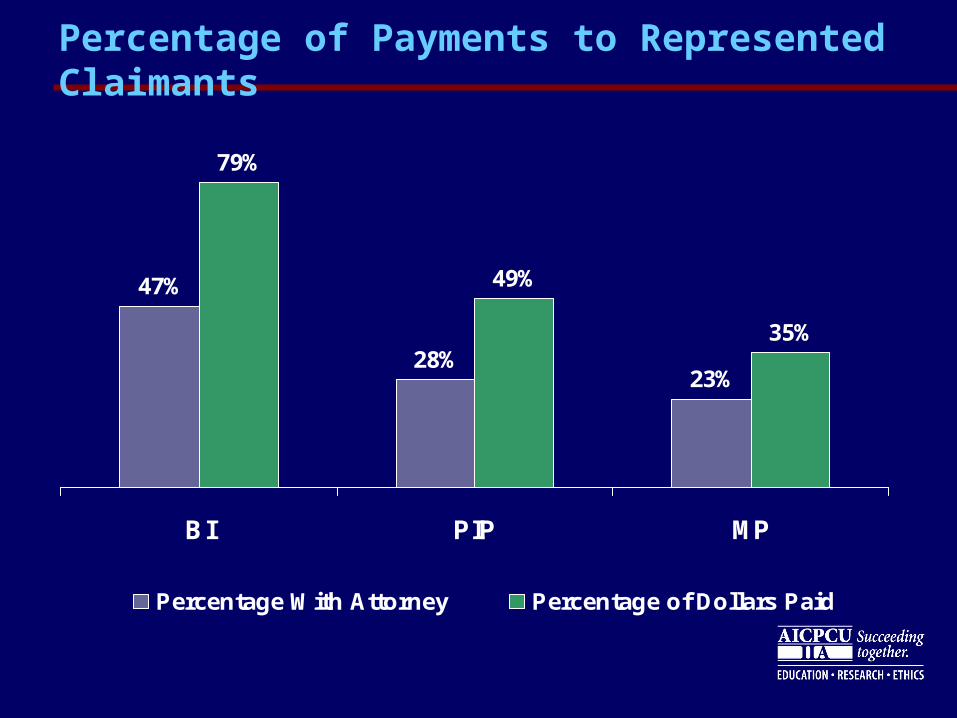
Percentage of Payments to Represented Claimants
47%
28%23%
79%
49%
35%
BI PIP MP
Percentage With Attorney Percentage of Dollars Paid
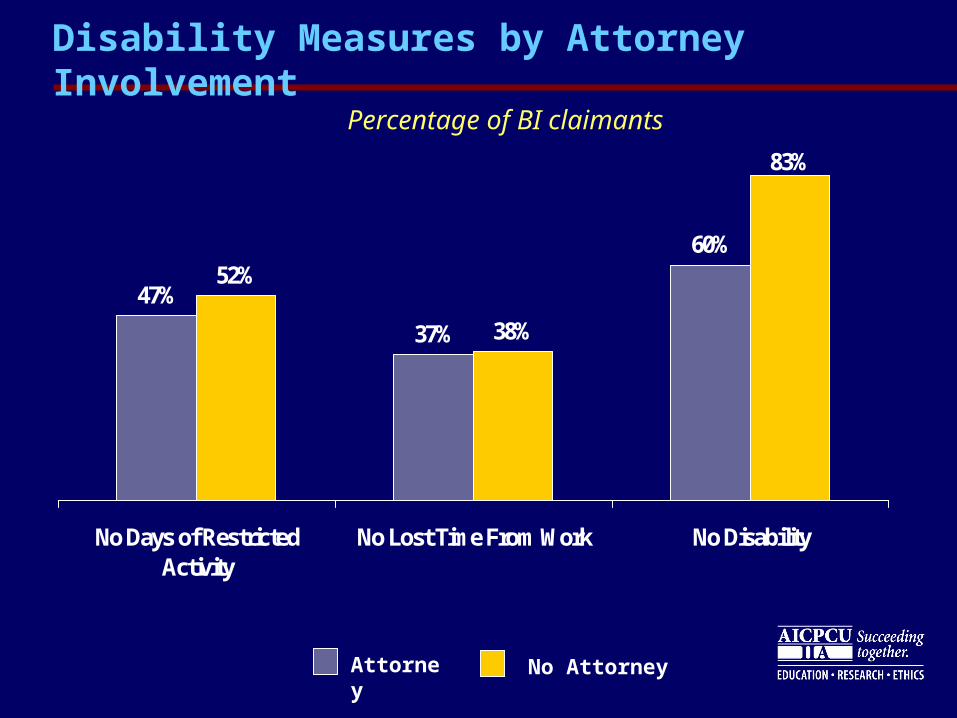
Disability Measures by Attorney Involvement
Attorney No Attorney
Percentage of BI claimants
47%
37%
60%52%
38%
83%
No Days of RestrictedActivity
No Lost Time From Work No Disability
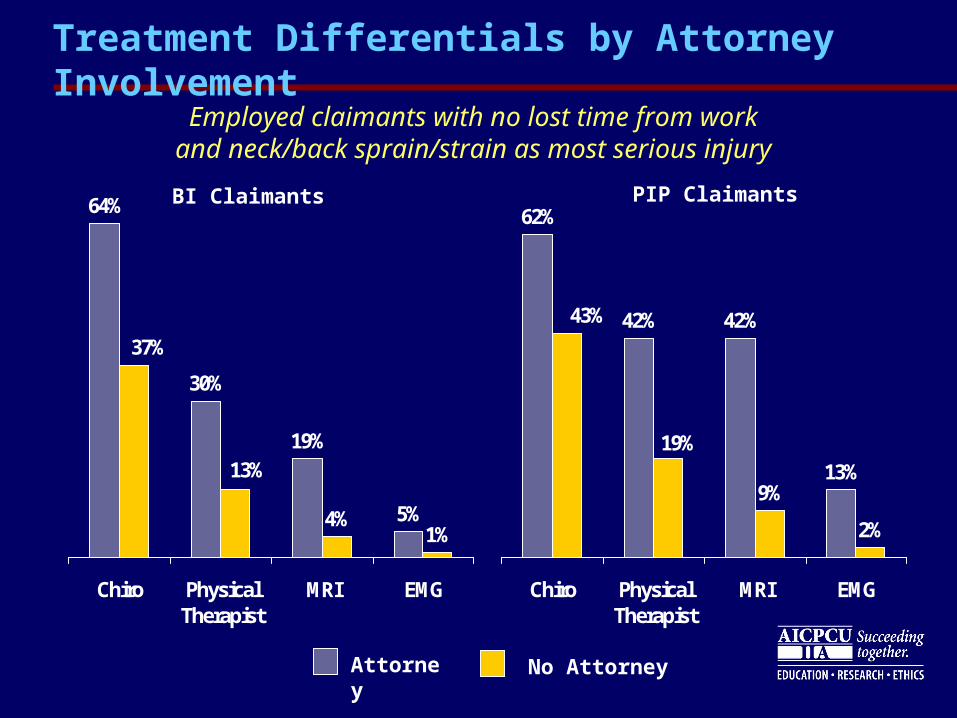
64%
30%
19%
5%4%1%
13%
37%
Chiro PhysicalTherapist
MRI EMG
Treatment Differentials by Attorney Involvement
62%
42% 42%
13%9%
2%
19%
43%
Chiro PhysicalTherapist
MRI EMG
Employed claimants with no lost time from workand neck/back sprain/strain as most serious injury
BI Claimants PIP Claimants
Attorney No Attorney
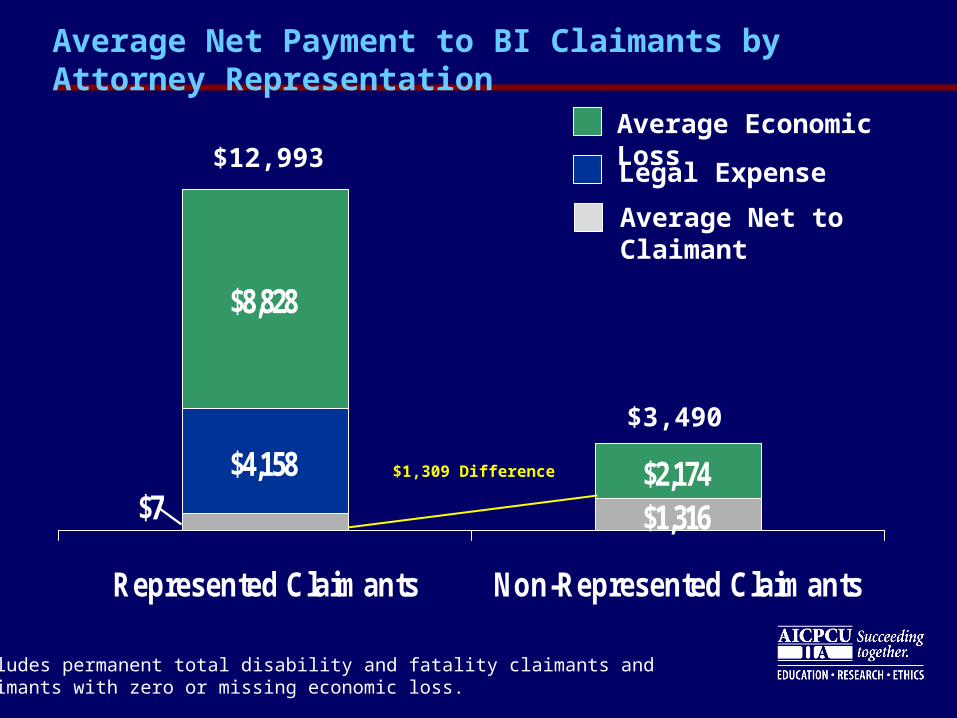
Average Net Payment to BI Claimants by Attorney Representation
$1,316
$4,158
$8,828
$2,174$7
Represented Claimants Non-Represented Claimants
$1,309 Difference
$12,993
$3,490
Average Economic LossLegal Expense
Average Net to Claimant
Excludes permanent total disability and fatality claimants andclaimants with zero or missing economic loss.
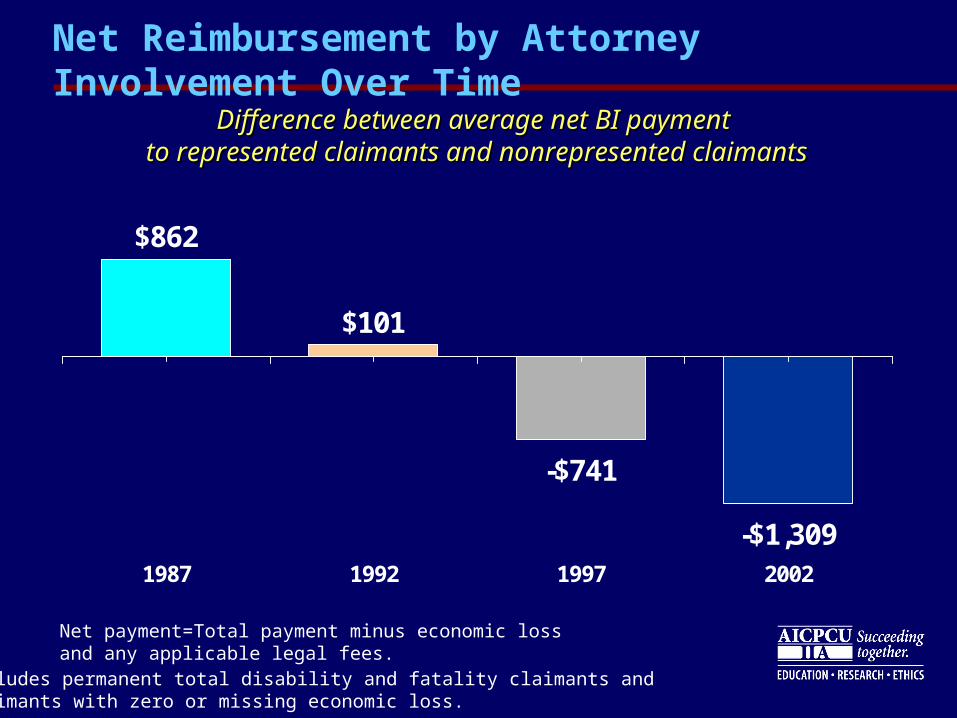
Net Reimbursement by Attorney Involvement Over Time
$862
$101
-$741
-$1,3091987 1992 1997 2002
Difference between average net BI payment Difference between average net BI payment to represented claimants and nonrepresented claimantsto represented claimants and nonrepresented claimants
Net payment=Total payment minus economic loss and any applicable legal fees.Excludes permanent total disability and fatality claimants andclaimants with zero or missing economic loss.
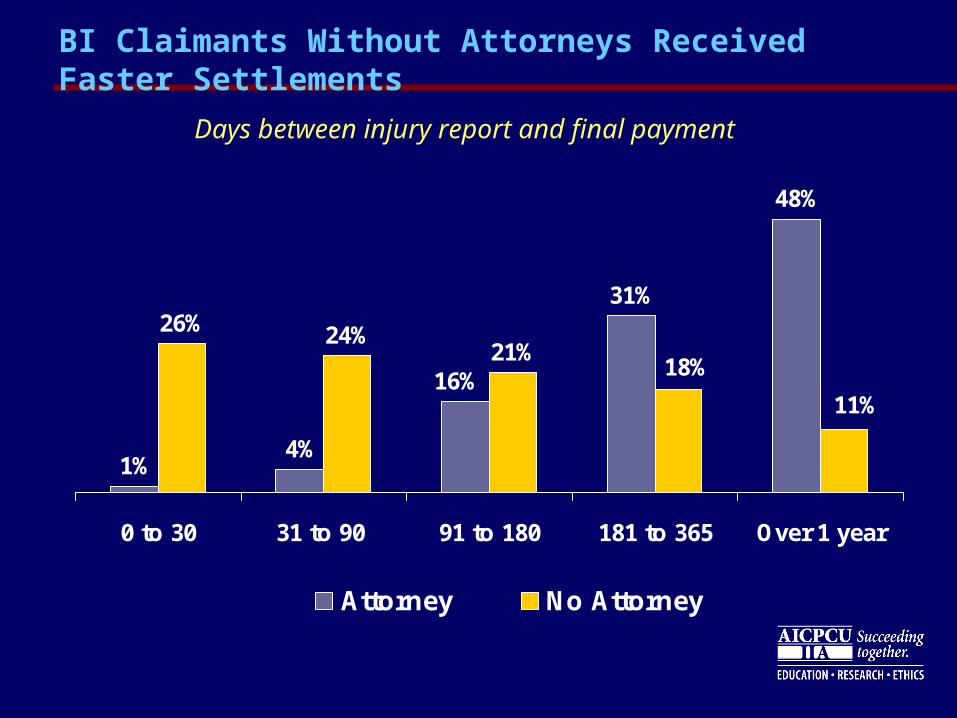
BI Claimants Without Attorneys Received Faster Settlements
1%4%
31%
48%
26% 24%21%
16%11%
18%
0 to 30 31 to 90 91 to 180 181 to 365 Over 1 year
Attorney No Attorney
Days between injury report and final payment
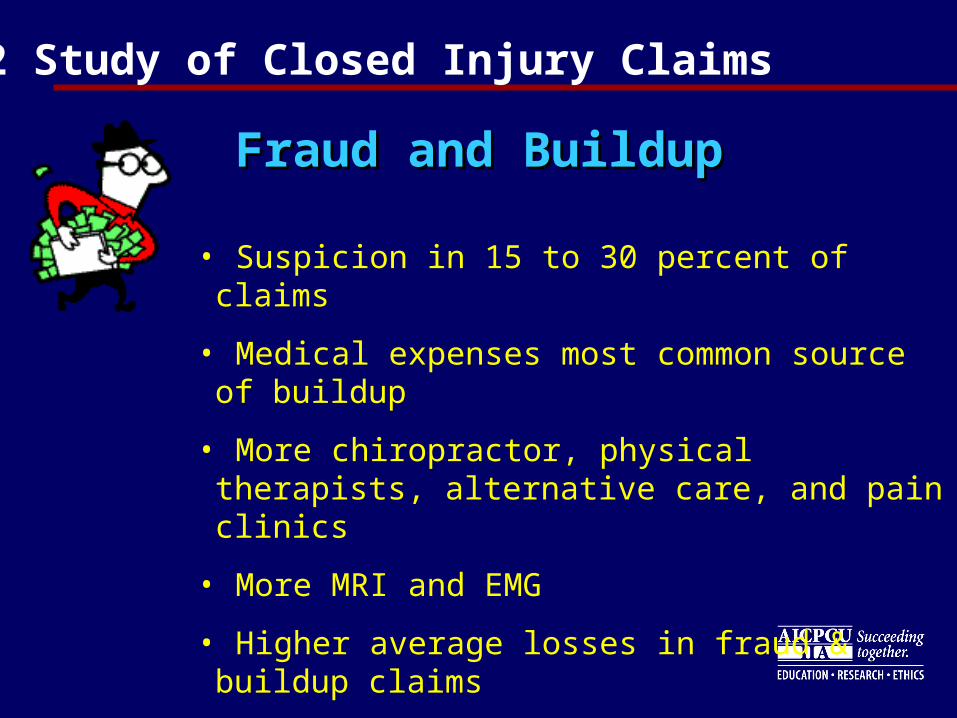
Fraud and BuildupFraud and Buildup
2002 Study of Closed Injury Claims
• Suspicion in 15 to 30 percent of claims
• Medical expenses most common source of buildup
• More chiropractor, physical therapists, alternative care, and pain clinics
• More MRI and EMG
• Higher average losses in fraud & buildup claims
• Higher attorney involvement
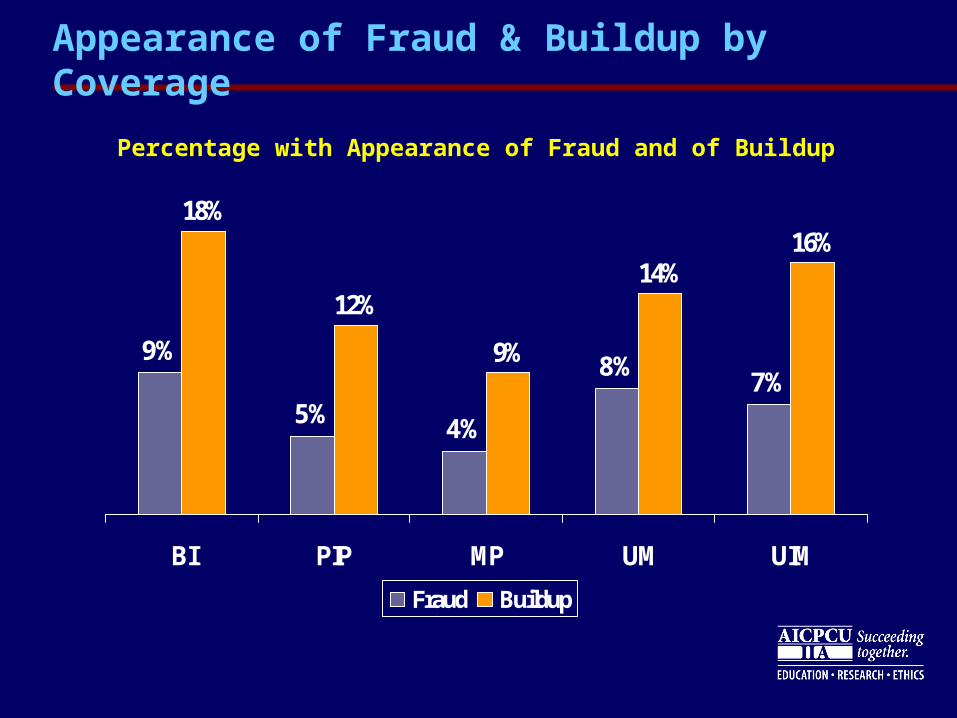
Appearance of Fraud & Buildup by Coverage
9%
5% 4%
8%7%
18%
12%
9%
14%16%
BI PIP MP UM UIM
Fraud Buildup
Percentage with Appearance of Fraud and of Buildup
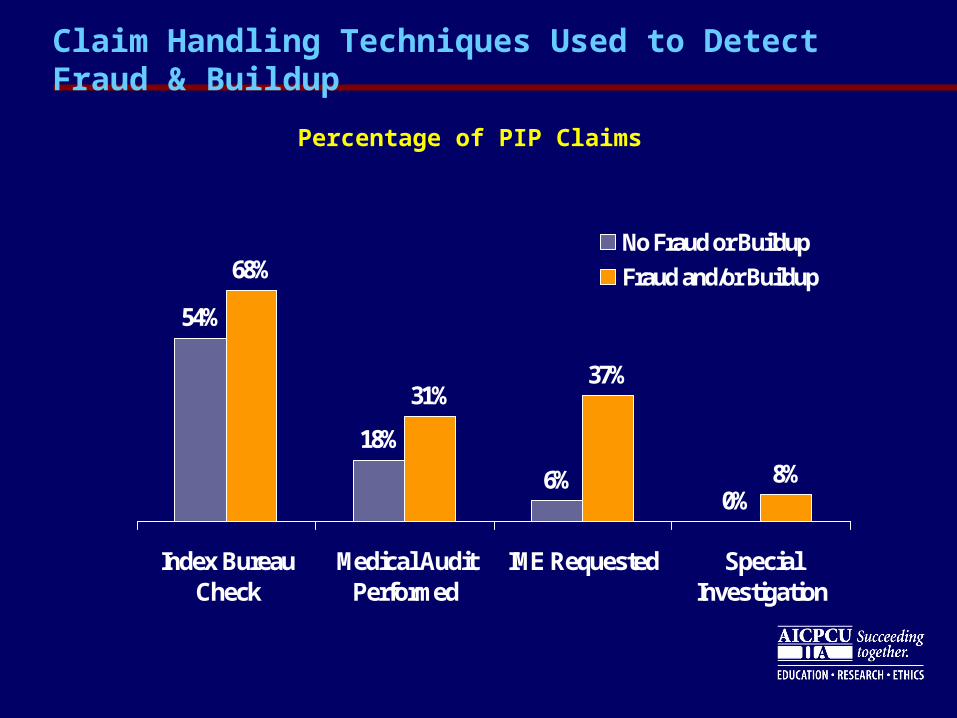
Claim Handling Techniques Used to Detect Fraud & Buildup
54%
18%
6%0%
68%
31%37%
8%
Index BureauCheck
Medical AuditPerformed
IME Requested SpecialInvestigation
No Fraud or Buildup
Fraud and/or Buildup
Percentage of PIP Claims
Summary of Key IRC Closed Claim Findings
Injury patterns show little changeInjury patterns show little change But claimants appear to be less seriously
injured
Modest increases in several areas of medical Modest increases in several areas of medical treatmenttreatment Shift towards more expensive treatment Higher per-visit costs
Summary of Key IRC Closed Claim Findings
Significant growth in reported economic lossesSignificant growth in reported economic losses Largely driven by growth in medical expenses More pronounced in first-party claims Not fully translated into total payments
especially for BI claimants with less serious injuries
Attorney involvementAttorney involvement Shows declines for all coverages Magnifies many adverse trends in claiming
behavior Associated with higher reported losses and
significantly lower net BI payment to claimant
Recommended