Assessment of Sediment QualityAssessment of Sediment Qualityin San Francisco Estuaryin San Francisco Estuary
RMP EEWG MeetingSeptember 6, 2007
SCCWRP Team: Bay, Ranasinghe, Ritter, Barnett, WeisbergSFEI Team: Thompson, Lowe, Connor
• A new regulatory approach
• Methods development since 2004
• Scheduled implementation in 2008
CALIFORNIA SEDIMENT QUALITY OBJECTIVES (SQO)
FOR BAYS AND ESTUARIES
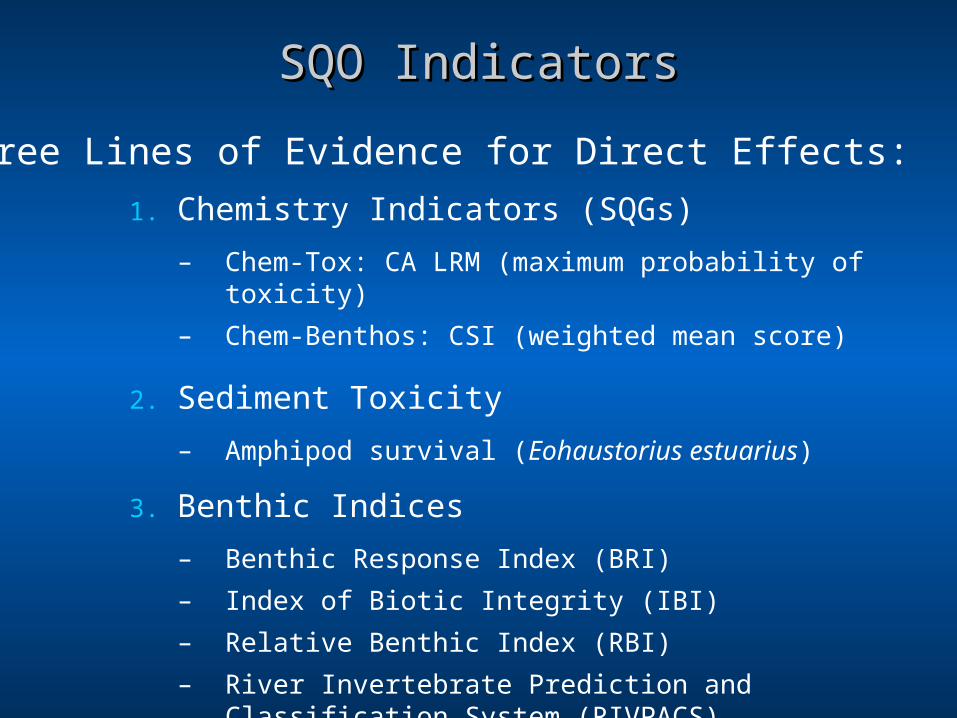
SQO IndicatorsSQO Indicators
1. Chemistry Indicators (SQGs)
– Chem-Tox: CA LRM (maximum probability of toxicity)
– Chem-Benthos: CSI (weighted mean score)
2. Sediment Toxicity
– Amphipod survival (Eohaustorius estuarius)
3. Benthic Indices
– Benthic Response Index (BRI)
– Index of Biotic Integrity (IBI)
– Relative Benthic Index (RBI)
– River Invertebrate Prediction and Classification System (RIVPACS)
Three Lines of Evidence for Direct Effects:
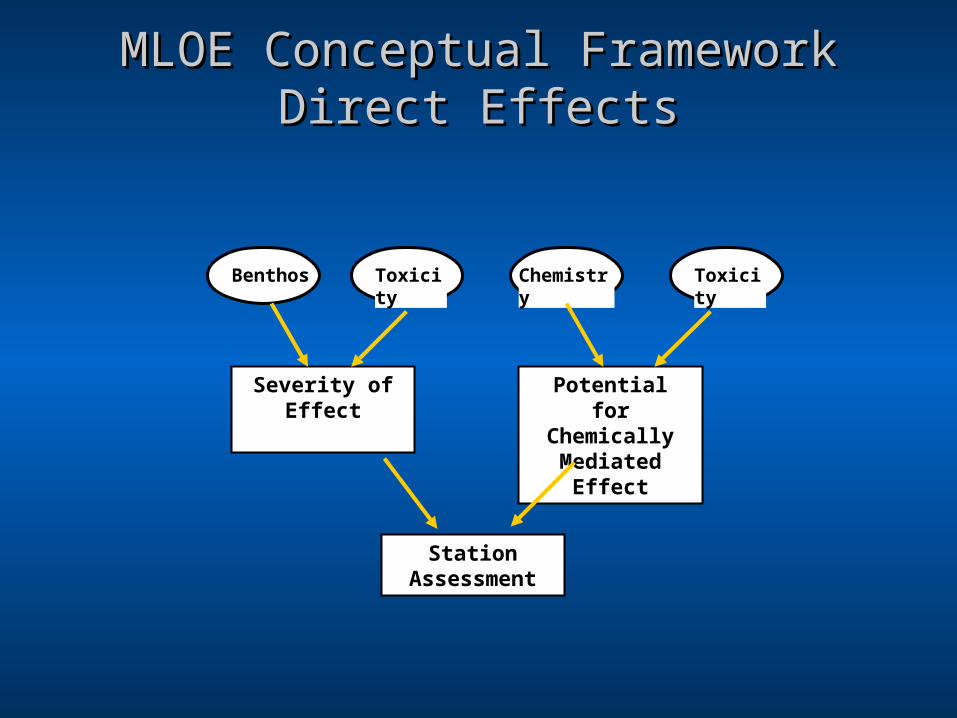
MLOE Conceptual FrameworkMLOE Conceptual FrameworkDirect EffectsDirect Effects
Severity of Effect
Potential for Chemically
Mediated Effect
Station Assessment
Benthos Toxicity Chemistry Toxicity
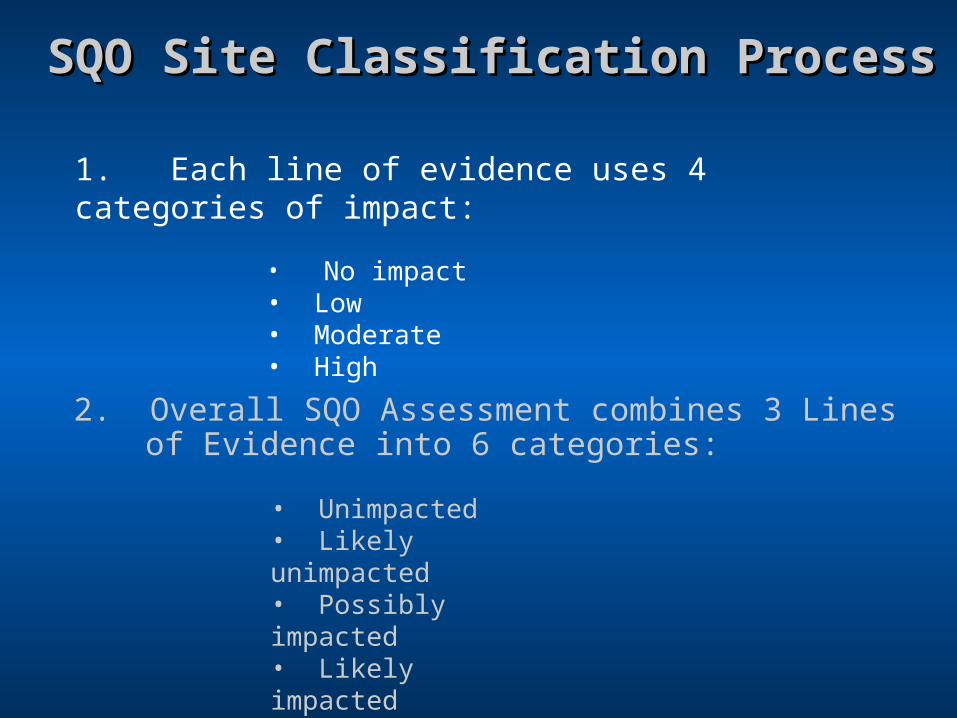
2. Overall SQO Assessment combines 3 Lines of Evidence into 6 categories:
1. Each line of evidence uses 4 categories of impact:
• No impact• Low • Moderate• High
SQO Site Classification ProcessSQO Site Classification Process
• Unimpacted• Likely unimpacted• Possibly impacted• Likely impacted• Clearly impacted• Inconclusive
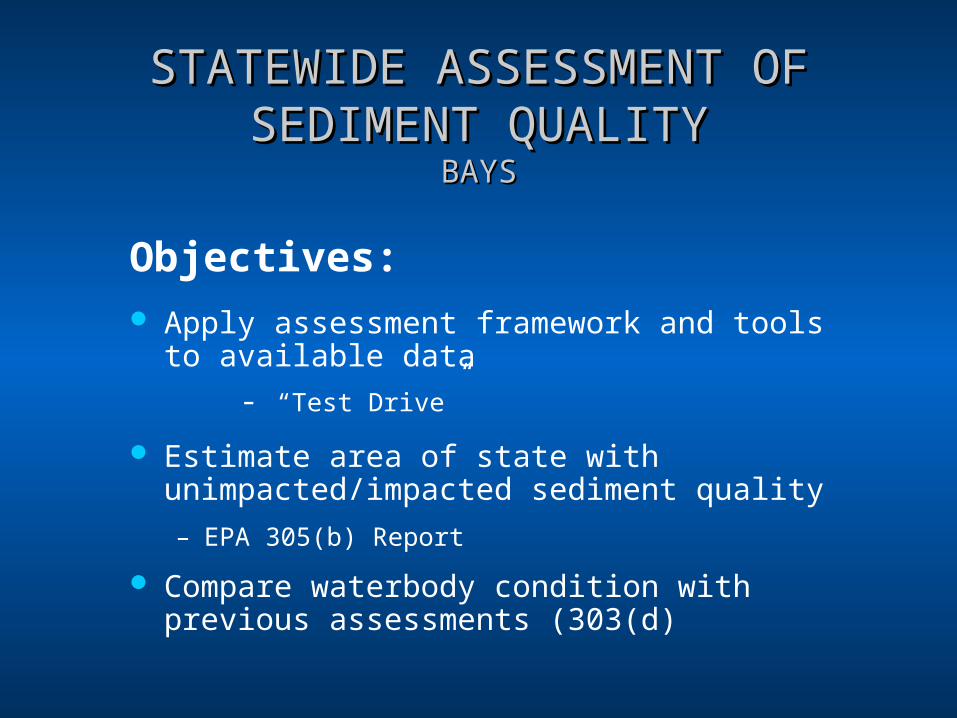
STATEWIDE ASSESSMENT OF STATEWIDE ASSESSMENT OF SEDIMENT QUALITYSEDIMENT QUALITY
BAYSBAYS
Objectives:
Apply assessment framework and tools to available data
- “Test Drive”
Estimate area of state with unimpacted/impacted sediment quality
– EPA 305(b) Report
Compare waterbody condition with previous assessments (303(d)
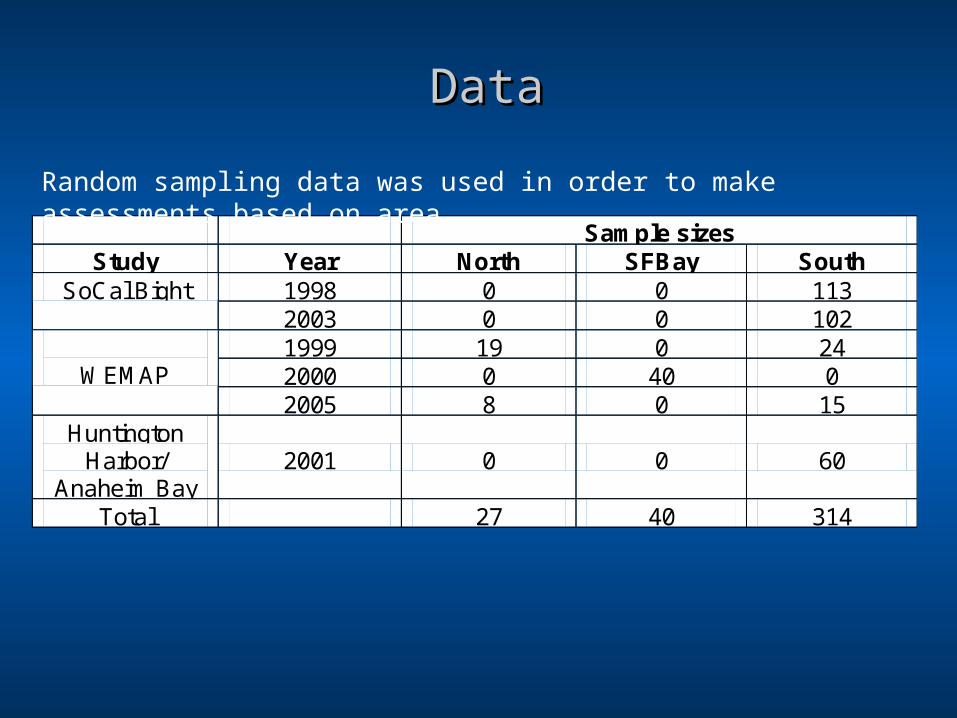
DataData
Sample sizes Study Year North SFBay South
1998 0 0 113 SoCal Bight 2003 0 0 102 1999 19 0 24 2000 0 40 0
WEMAP
2005 8 0 15 Huntington
Harbor/ Anaheim Bay
2001 0 0 60
Total 27 40 314
Random sampling data was used in order to make assessments based on area
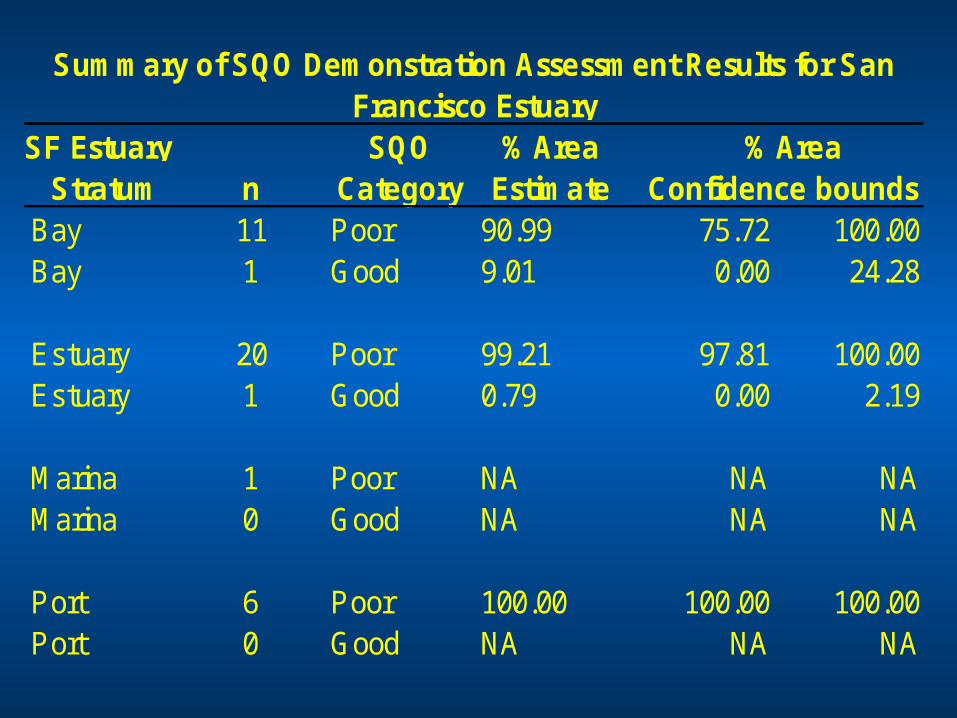
SF Estuary SQO % Area % Area Stratum n Category Estimate Confidence bounds
Bay 11 Poor 90.99 75.72 100.00Bay 1 Good 9.01 0.00 24.28
Estuary 20 Poor 99.21 97.81 100.00Estuary 1 Good 0.79 0.00 2.19
Marina 1 Poor NA NA NAMarina 0 Good NA NA NA
Port 6 Poor 100.00 100.00 100.00Port 0 Good NA NA NA
Summary of SQO Demonstration Assessment Results for San Francisco Estuary
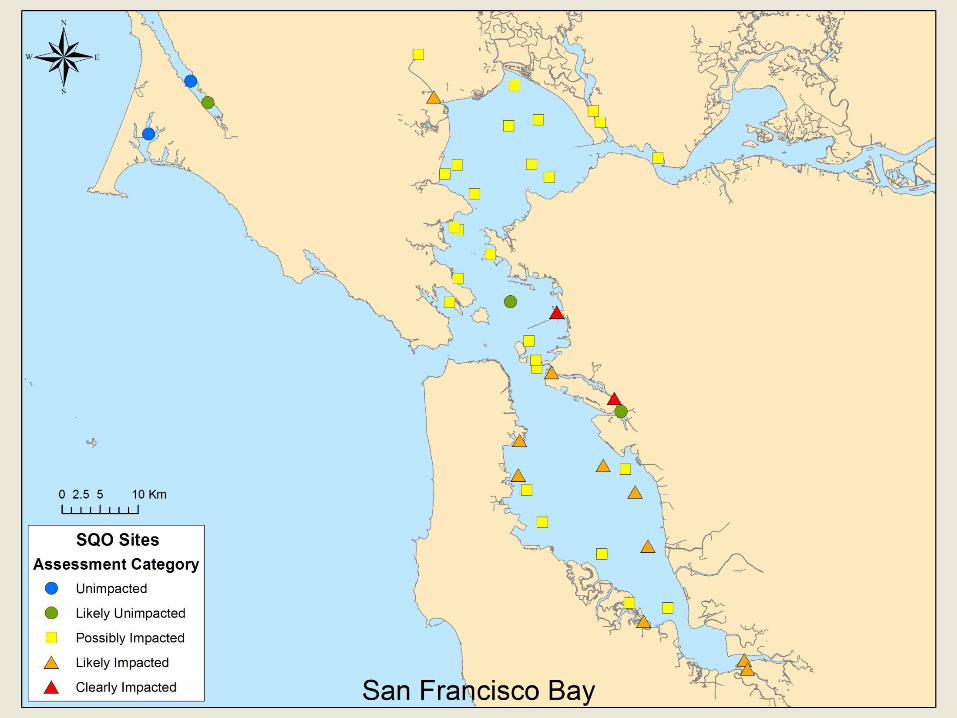
ResultsResults
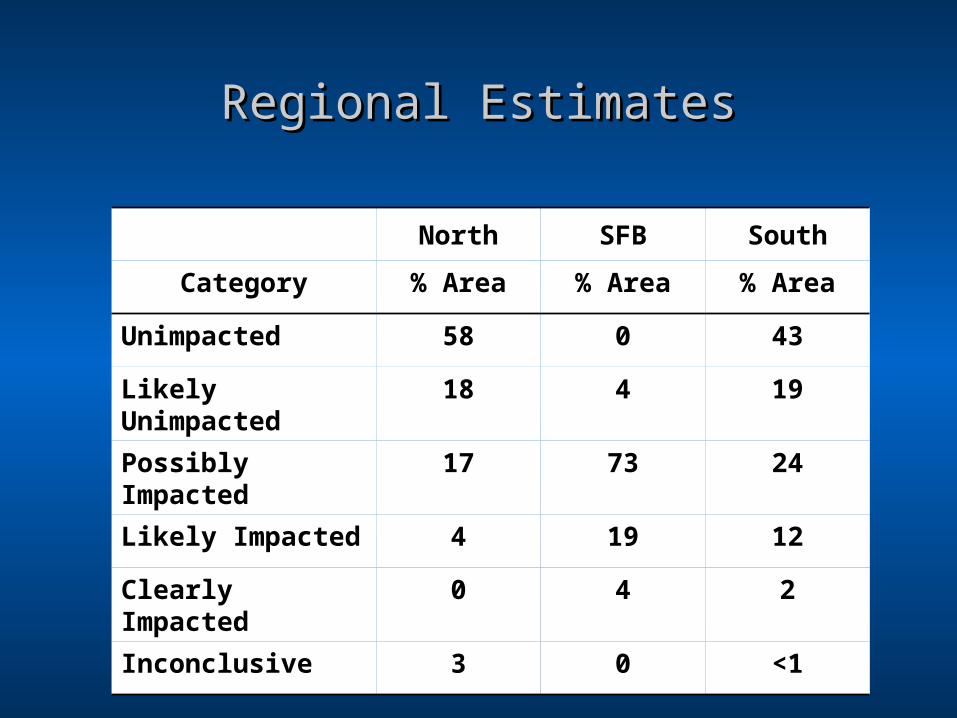
Regional EstimatesRegional Estimates
North SFB South
Category % Area % Area % Area
Unimpacted 58 0 43
Likely Unimpacted 18 4 19
Possibly Impacted 17 73 24
Likely Impacted 4 19 12
Clearly Impacted 0 4 2
Inconclusive 3 0 <1
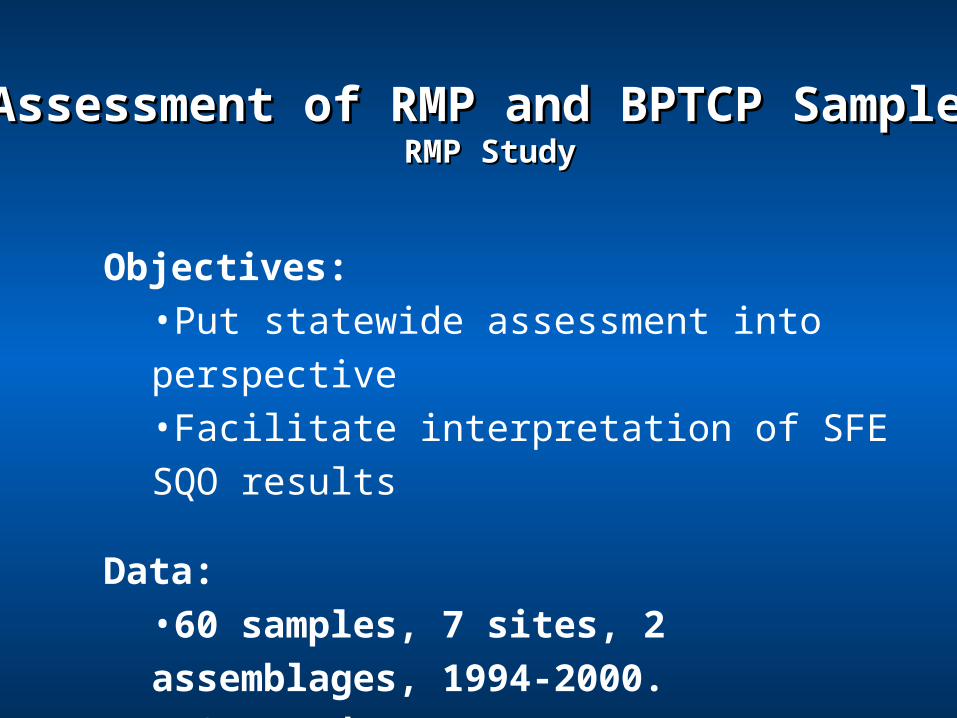
Assessment of RMP and BPTCP SamplesAssessment of RMP and BPTCP SamplesRMP StudyRMP Study
Objectives:•Put statewide assessment into perspective•Facilitate interpretation of SFE SQO results
Data:•60 samples, 7 sites, 2 assemblages, 1994-2000.•NOT random
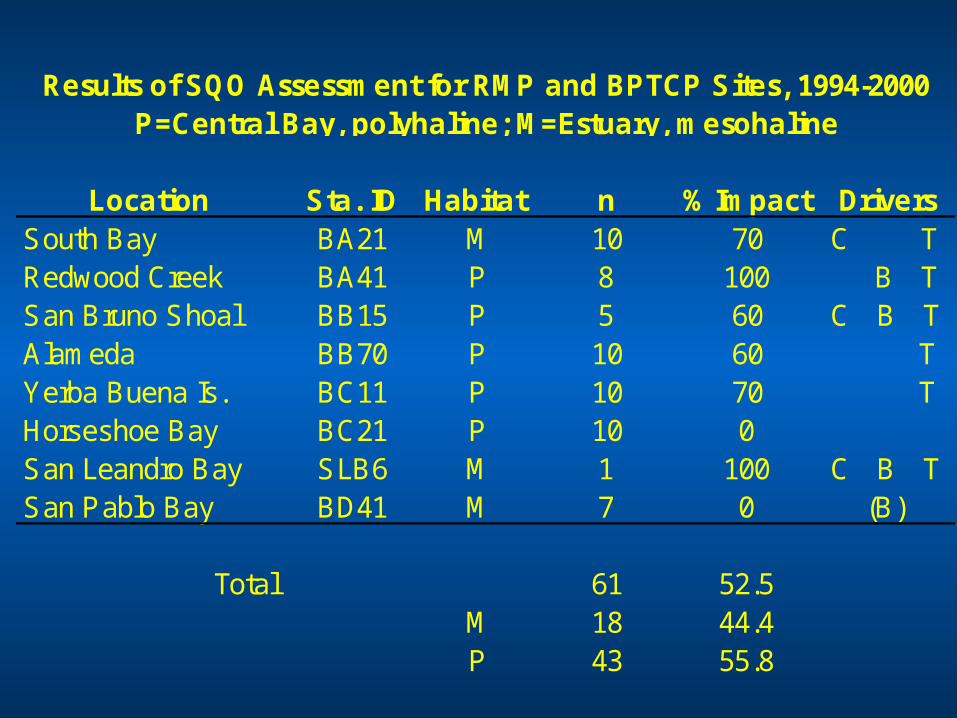
Location Sta. ID Habitat n % Impact DriversSouth Bay BA21 M 10 70 C TRedwood Creek BA41 P 8 100 B T San Bruno Shoal BB15 P 5 60 C B TAlameda BB70 P 10 60 TYerba Buena Is. BC11 P 10 70 THorseshoe Bay BC21 P 10 0San Leandro Bay SLB6 M 1 100 C B TSan Pablo Bay BD41 M 7 0 (B)
Total 61 52.5M 18 44.4P 43 55.8
Results of SQO Assessment for RMP and BPTCP Sites, 1994-2000 P=Central Bay, polyhaline; M=Estuary, mesohaline
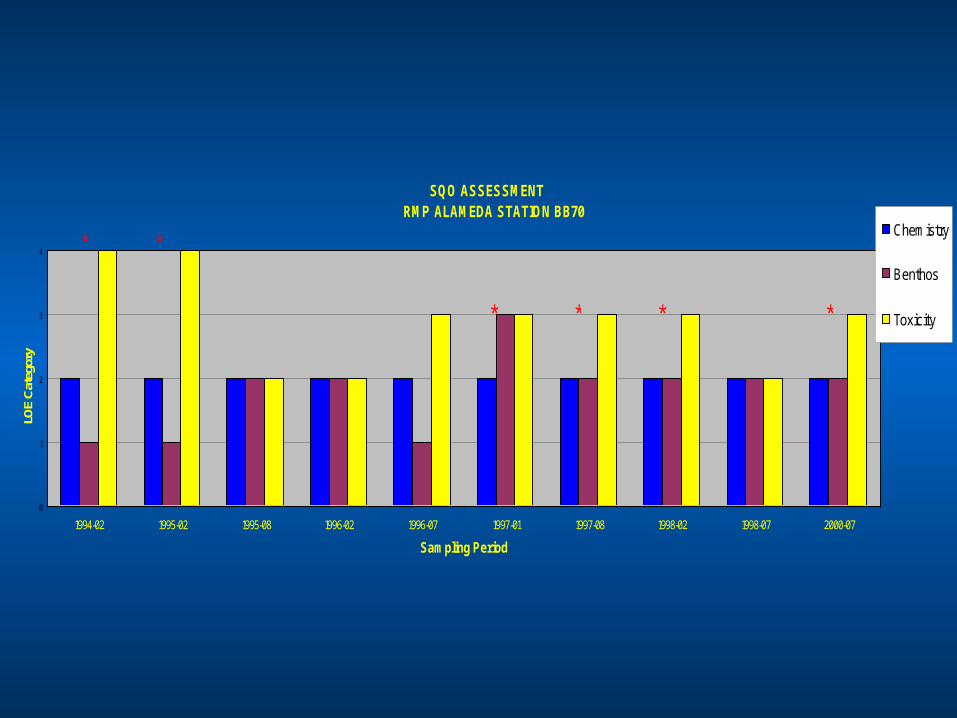
SQO ASSESSMENT RMP ALAMEDA STATION BB70
0
1
2
3
4
1994-02 1995-02 1995-08 1996-02 1996-07 1997-01 1997-08 1998-02 1998-07 2000-07
Sampling Period
LO
E C
ateg
ory
Chemistry
Benthos
Toxicity
**
* * * *
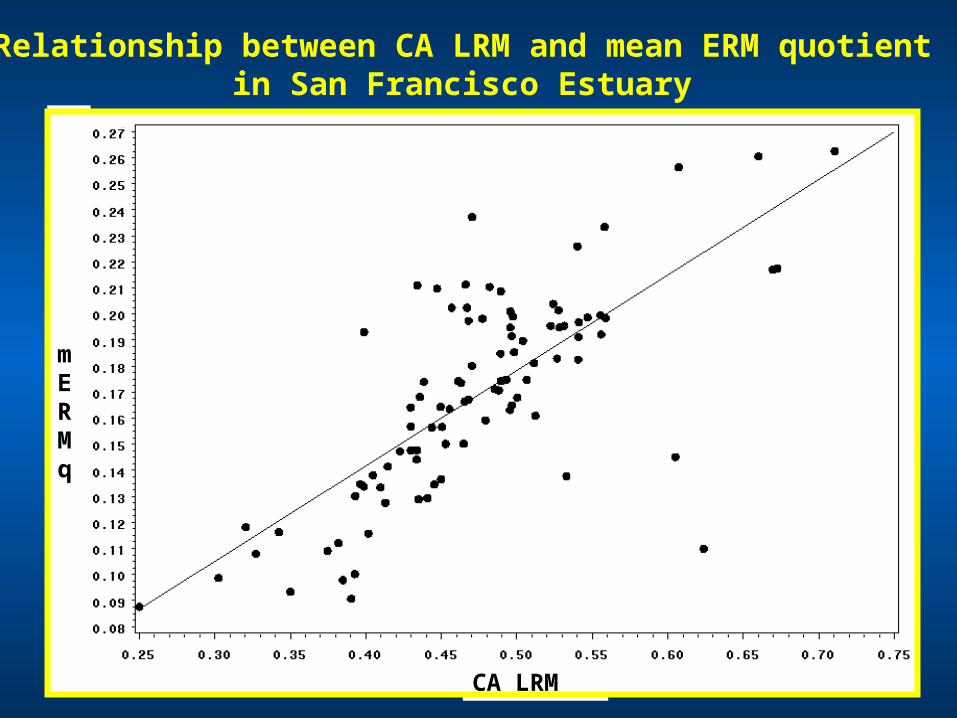
Relationship between CA LRM and mean ERM quotientin San Francisco Estuary
CA LRM
mERMq
Spearman’s r = 0.714
p < 0.0001, n = 94
Summary Summary
SQO methods provide overall assessment of sediment condition using MLOEs
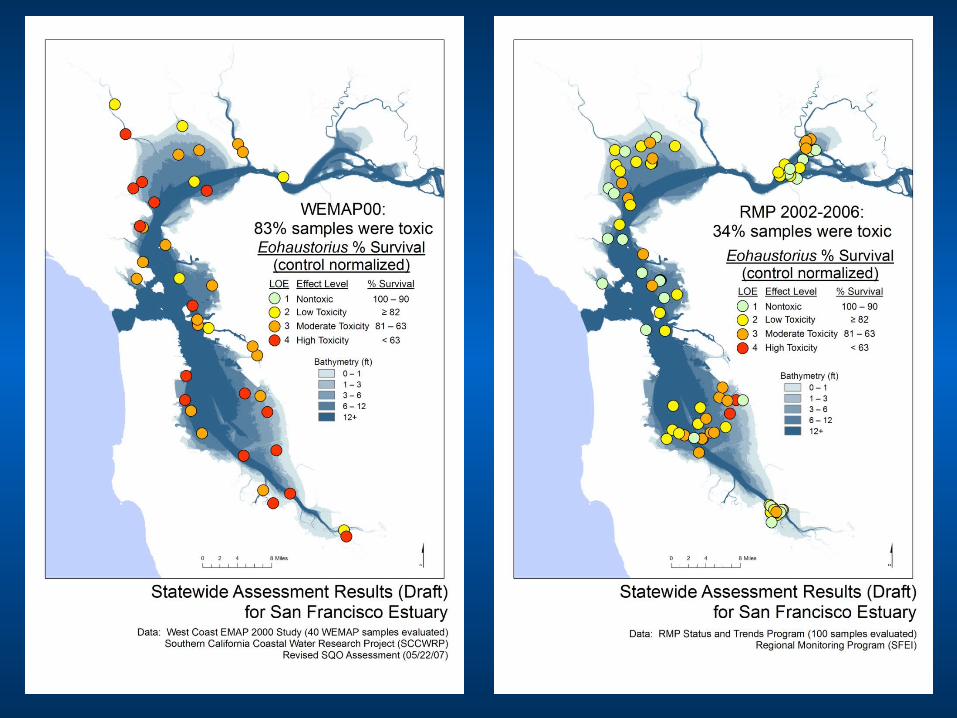
Most of state’s marine embayments have impacted sediments
San Francisco Estuary has more impacted area than other Bays
Difference in incidence of impacts between two sets of samples
Additional analyses and studies needed to refine and interpret results
– Particularly identification of causes of observed impacts, ‘stressor identification’
Recommended