Assessment of Benzene Fenceline Monitoring Data for Corrective Action Planning and Near-field Source Correction
IPEC 2017San Antonio, TX
October 30, 2017

Presentation Objectives
1. Review regulatory framework for benzene fenceline monitoring.
2. Provide a broad overview of fenceline monitoring requirements.
3. Examine some of the details and challenges associated with implementing a fenceline monitoring program.
4. Outline considerations for fenceline monitoring program design and implementation
2

Refinery Sector Rule (RSR) Establishes Three Key Requirements
1. Emission control requirements for: Storage Tanks Flares Delayed Coking Units
2. Elimination of exemptions to emission limits during startup, shutdown, and malfunctions
3. Fenceline monitoring for benzene Method 325 A: VOC from Fugitive & Ambient Sources
(Sampler Placement) Method 325 B: VOC from Fugitive & Ambient Sources
(Analysis)
3

Fenceline Monitoring Program Requirements (1/3)
4
Deploy a network of diffusive samplers around the perimeter of the site in accordance with EPA Method 325A. Two deployment options:
1. Placed at different angles circling the geometric center of the facility along the fenceline. Size of property determines the angles.
2. Placed along the fenceline every 2000 meters. Monitor placed 1.5-3.0 m above the ground.
Diffusive samplers analyzed by EPA Method 325B using GC/MS.
Monitor Placement Varies with Facility Size (1a/3)
Facility Size, Acres Angle, Degrees Number of Monitors
Less than or equal to 750 30 12
Greater than 750 but less than 1500 20 18
Greater than 1500 acres 15 24
5
24 samplers placed along fenceline
Note that extra samplers are required near known sources of VOC emissions
EPA

Fenceline Monitoring Program Requirements (2/3)
6
Sampling episode is defined as 14 days unless there is a reason to sample for a shorter period. Tubes placed in shelters and time and date are noted. Tubes are recovered, thermally desorbed to measure mass
of collected benzene using GC/MS. The difference between the highest and lowest measured
benzene concentrations is determined. Annual rolling average of the difference is calculated. Background and interfering near-field source adjustments
are allowed if described in a sampling plan that is submitted to agency for review and approval.
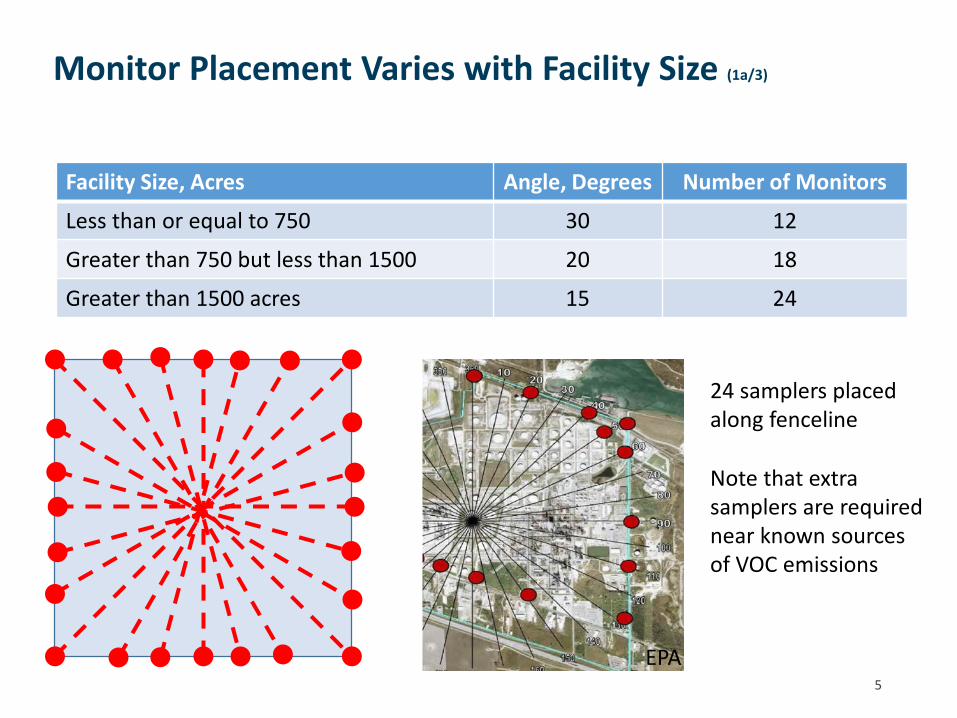
Fenceline Monitoring Program Requirements (3/3)
7
Root Cause Analysis (RCA) & Corrective Action (CA) is required if difference in concentrations exceeds 9 µg/m3 as a rolling annual average. RCA Method 21, optical gas imaging, visual inspections,
additional 325A sampling Submit a formal Corrective Action Plan (CAP) to EPA if
corrective action is ineffective or will take more than 60 days.
Attempted corrective actions, additional measures, schedules
Report data quarterly using EPA’s Compliance and Emissions Data Reporting Interface (CEDRI).

Root Cause Analysis/Corrective Action Timeline
8
Evaluate Data within 45 Days
Perform Root Cause Analysis (RCA) within 5
Days
Complete Corrective Action (CA)
within 45 Days
Sampling Period End Date
Submit Corrective Action Plan (CAP) to Agency within 60 days of triggering event if:
• Corrective Action Is Ineffective• Corrective Action Takes Longer than 45 Days to
Complete
Action Level Exceeded

Real World RCA and CAP Timeline
9
0.0
5.0
10.0
15.0
20.0
25.0
30.0
35.0
40.0
45.0
01/05/16 02/05/16 03/05/16 04/05/16 05/05/16 06/05/16 07/05/16 08/05/16 09/05/16
Benz
ene,
µg/
m3
Date
Benzene Fenceline Data
Period Difference
Rolling Average
Action Level
RCA = Root Cause AnalysisCA = Corrective ActionCAP = Corrective Action Plan
No Regulatory Action Required RCA & CA RequiredCA Declared Complete
CAP Required

Maximum Differential Concentrations…….
10
0.0
20.0
40.0
60.0
80.0
100.0
120.0
140.0
160.0
01/0
5/16
01/1
2/16
01/1
9/16
01/2
6/16
02/0
2/16
02/0
9/16
02/1
6/16
02/2
3/16
03/0
1/16
03/0
8/16
03/1
5/16
03/2
2/16
03/2
9/16
04/0
5/16
04/1
2/16
04/1
9/16
04/2
6/16
05/0
3/16
05/1
0/16
05/1
7/16
05/2
4/16
05/3
1/16
06/0
7/16
06/1
4/16
06/2
1/16
06/2
8/16
07/0
5/16
07/1
2/16
07/1
9/16
07/2
6/16
08/0
2/16
Benz
ene
Conc
entr
atio
n, u
g/m
3
Date
Maximum Differential Benzene Concentration
Measured Differential Concentration Action Level

Have Long-term Effect on the Calculated Rolling Average
11
0.0
10.0
20.0
30.0
40.0
50.0
60.0
01/0
5/16
01/1
2/16
01/1
9/16
01/2
6/16
02/0
2/16
02/0
9/16
02/1
6/16
02/2
3/16
03/0
1/16
03/0
8/16
03/1
5/16
03/2
2/16
03/2
9/16
04/0
5/16
04/1
2/16
04/1
9/16
04/2
6/16
05/0
3/16
05/1
0/16
05/1
7/16
05/2
4/16
05/3
1/16
06/0
7/16
06/1
4/16
06/2
1/16
06/2
8/16
07/0
5/16
07/1
2/16
07/1
9/16
07/2
6/16
08/0
2/16
Benz
ene
Conc
entr
atio
n, u
g/m
3
Date
Rolling Average Benzene Concentration
Based on Measured Differential Concentration Action Level

What Caused the Spike?
Compliant tank cleaning operations. Possibly an “interfering near-field source”
12
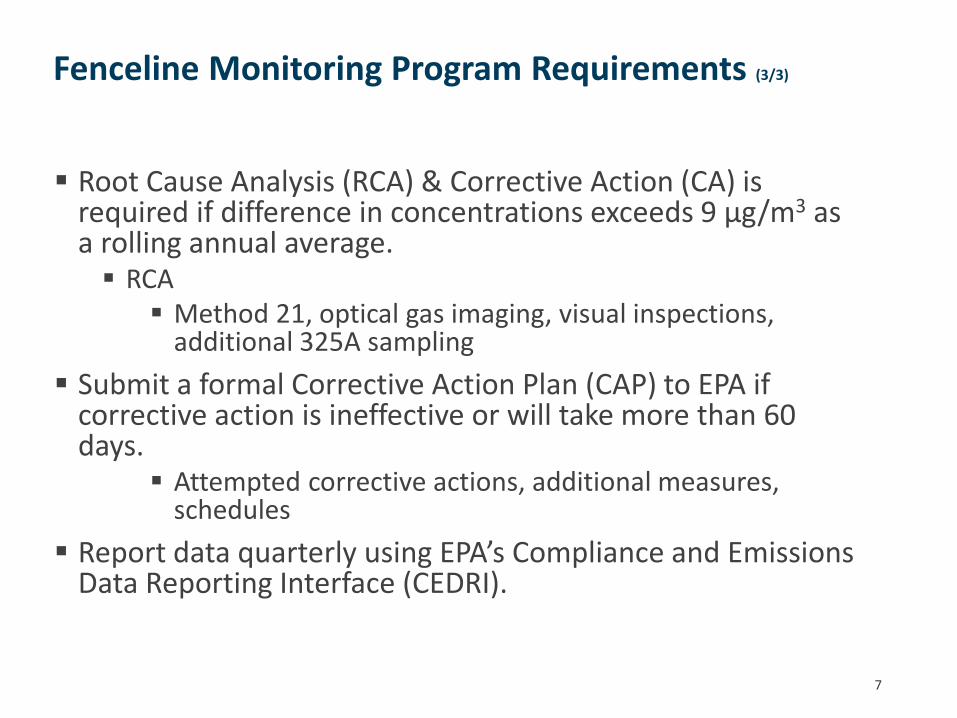
Rule Allows for Interfering Near-field Source Correction
Essentially subtract the contribution from the interfering source:∆Ci = MFCi – NFSi – UBwhere:∆Ci = Differential Concentration for location iMFCi = Measured Fenceline Concentration for location iNFSi = Near-Field Interfering Source Concentration for location iUB = Uniform Background Concentration
13

NFS Correction Requires Site-Specific Monitoring Plan
Site-Specific Monitoring Plan must: Outline the justification for interfering NFS
Document criteria for UB sampling location(s) selection Document criteria for interfering NFS sampling location(s) selection Describe the fenceline measurement location(s) affected by the NFS(s)
Describe the calculation procedures When NFS correction are used, an on-site meteorological monitoring
station is required to measure: Temperature and barometric pressure (hourly)
Wind speed and direction (hourly) Sigma theta (daily)
14

Adjustment of Measurement Data for Interfering NFS Changes the Picture…..
15
0.0
20.0
40.0
60.0
80.0
100.0
120.0
140.0
160.0
01/0
5/16
01/1
2/16
01/1
9/16
01/2
6/16
02/0
2/16
02/0
9/16
02/1
6/16
02/2
3/16
03/0
1/16
03/0
8/16
03/1
5/16
03/2
2/16
03/2
9/16
04/0
5/16
04/1
2/16
04/1
9/16
04/2
6/16
05/0
3/16
05/1
0/16
05/1
7/16
05/2
4/16
05/3
1/16
06/0
7/16
06/1
4/16
06/2
1/16
06/2
8/16
07/0
5/16
07/1
2/16
07/1
9/16
07/2
6/16
08/0
2/16
Benz
ene
Conc
entr
atio
n, u
g/m
3
Date
Maximum Differential Benzene Concentration
No NFS Correction With NFS Correction Action Level

And the Rolling Average
16
0.0
10.0
20.0
30.0
40.0
50.0
60.0
01/0
5/16
01/1
2/16
01/1
9/16
01/2
6/16
02/0
2/16
02/0
9/16
02/1
6/16
02/2
3/16
03/0
1/16
03/0
8/16
03/1
5/16
03/2
2/16
03/2
9/16
04/0
5/16
04/1
2/16
04/1
9/16
04/2
6/16
05/0
3/16
05/1
0/16
05/1
7/16
05/2
4/16
05/3
1/16
06/0
7/16
06/1
4/16
06/2
1/16
06/2
8/16
07/0
5/16
07/1
2/16
07/1
9/16
07/2
6/16
08/0
2/16
Benz
ene
Conc
entr
atio
n, u
g/m
3
Date
Rolling Average Benzene Concentration
No NFS Correction With NFS Correction Action Level

Fenceline Monitoring Program Design & Implementation Considerations
Evaluate the data as it is generated. Under the RSR triggers for RCA, CA, and CAP. Test root cause analysis and corrective action plan approaches. If interfering NFS are identified, develop a site-specific
monitoring plan. Site-specific monitoring plans require time to develop and time
for approval.
17
Recommended