Embed Size (px)
Citation preview
Monitoring of CO, NO2, SO2, ozone, benzene and benzo(a)pyrene in New Zealand Air Quality Technical Report No. 42
Environet Limited
October 2003
Published in January 2004 by the Ministry for the Environment Manatū Mō Te Taiao PO Box 10-362, Wellington, New Zealand
Air Quality Technical Report 42
This document is available on the Ministry for the Environment’s website: www.mfe.govt.nz
Technical report – this is not Government policy.
Monitoring of CO, NO2, SO2, ozone, benzene and benzo(a)pyrene in New Zealand iii
Foreword Information about the state of New Zealand’s air quality is important for estimating potential health effects and determining where emissions should be reduced to improve air quality. This report summarises our current knowledge about the concentrations of carbon monoxide (CO), nitrogen dioxide (NO2), sulphur dioxide (SO2), ozone (O3), benzene and benzo(a)pyrene (BaP) in New Zealand’s air.
The results indicate that concentrations of these pollutants are generally low and within guideline values in New Zealand, and in many areas air quality in New Zealand is extremely good. However, there are some urban areas where CO, NO2, O3, benzene and BaP reach levels that are high enough to cause adverse health effects. These typically occur in Auckland and Christchurch close to busy roads or where inversion layers trap wintertime pollution from domestic fires. Further analysis of such potential health effects is described in an accompanying report.
I would like to thank you those councils and others who contributed data and commented on this report.
Barry Carbon Chief Executive Ministry for the Environment
Technical document – this is not Government policy.
iv Monitoring of CO, NO2, SO2, ozone, benzene and benzo(a)pyrene in New Zealand
Acknowledgements The Ministry would like to thank the following for their contribution of data for the report: • Paul Baynham, Northland Regional Council • Karen Roberts, Hawkes Bay Regional Council • Perry Davy, Wellington Regional Council • Teresa Aberkane, Environment Canterbury • Richard Chilton, Kevin Mahon and Peter Day, Auckland Regional Council • Ross Jones, Environment Waikato • Gary Bedford, Taranaki Regional Council • Trevor James, West Coast Regional Council • Leif Pigott, Otago Regional Council • Paul Sheldon, Nelson City Council • Shane Ironmonger, Environment Bay of Plenty.
Technical report – this is not Government policy.
Monitoring of CO, NO2, SO2, ozone, benzene and benzo(a)pyrene in New Zealand v
Contents
Foreword iii
Acknowledgements iv
Executive Summary xi
1 Introduction 1 1.1 Air quality monitoring in New Zealand 3
2 Carbon monoxide (CO) 4 2.1 Auckland region 4
2.1.1 Queen Street 7 2.1.2 Takapuna 8 2.1.3 Khyber Pass 9 2.1.4 Hobson 9 2.1.5 Henderson and Dominion Road 10 2.1.6 Manurewa and Pakuranga 10 2.1.7 Manukau 11
2.2 Wellington region 13 2.3 Hamilton 15 2.4 Northland region 16 2.5 Hawkes Bay region 16 2.6 Bay of Plenty region 17 2.7 Canterbury region 21
2.7.1 Christchurch 23 2.7.2 Ashburton, Rangiora and Kaiapoi 26
2.8 Otago region 28 2.9 Nelson 29 2.10 Southland 30 2.11 Summary of CO concentrations 30
3 Nitrogen Oxide (NOx) Emissions 31 3.1 Auckland region 31 3.2 Wellington region 35 3.3 Hamilton 36 3.4 Taranaki region 37 3.5 Hawkes Bay region 38 3.6 Canterbury region 39 3.7 Otago region 41 3.8 Nelson 42 3.9 Summary of NO2 concentrations 44
Technical document – this is not Government policy.
vi Monitoring of CO, NO2, SO2, ozone, benzene and benzo(a)pyrene in New Zealand
4 Sulphur Dioxide (SO2) 45 4.1 Auckland region 45 4.2 Taranaki region 46 4.3 Hawkes Bay region 47 4.4 Canterbury region 47
4.4.1 Christchurch 50 4.4.2 Timaru 52 4.4.3 Ashburton, Rangiora and Kaiapoi 53
4.5 West Coast 54 4.6 Otago region 54 4.7 Northland region 55 4.8 Summary of SO2 concentrations 56
5 Ozone 57 5.1 Auckland 57 5.2 Christchurch 59
6 Benzene 61 6.1 Auckland, Hamilton, Christchurch and Dunedin – the MoH study 61 6.2 Auckland 62 6.3 Christchurch 62 6.4 Nelson 64 6.5 West Coast 64 6.6 Bay of Plenty 65
7 Benzo(a)pyrene (BaP) 66 7.1 Auckland 66 7.2 Christchurch 67
8 Trends in Contaminant Concentrations in New Zealand 68
9 Summary 69
References 70
Appendix One 71
About the Ministry for the Environment 75
Technical report – this is not Government policy.
Monitoring of CO, NO2, SO2, ozone, benzene and benzo(a)pyrene in New Zealand vii
List of Tables Table 1.1: Ministry for the Environment’s air quality categories 2 Table 1.2: Summary of the ambient air quality guidelines for contaminants discussed in
this report 2 Table 2.1: Summary data for CO monitoring in Auckland 5 Table 2.2: Summary data for CO monitoring in Wellington 13 Table 2.3: Summary data for CO monitoring in Hamilton 15 Table 2.4: Summary data for CO monitoring in the Hawkes Bay region 16 Table 2.5: Summary data for CO monitoring in the Bay of Plenty 18 Table 2.6: Summary data for CO monitoring in the Canterbury region 21 Table 2.7: Summary data for CO monitoring in Nelson 29 Table 3.1: Summary data for NO2 monitoring in Auckland 31 Table 3.2: Summary data for NO2 monitoring in the Wellington region 35 Table 3.3: Summary data for NO2 monitoring in Hamilton 37 Table 3.4: Summary data for NO2 monitoring in Hawkes Bay 39 Table 3.5: Summary data for NO2 monitoring in Christchurch 40 Table 3.6: Concentrations of NO2 measured in Otago (wet chemical) 42 Table 3.7: Summary data for NO2 monitoring in Nelson 42 Table 4.1: Summary data for SO2 monitoring in Auckland 45 Table 4.2: Ambient SO2 monitoring results from around the Ravensdown site for
1996–97 and 1997–98 monitoring periods 46 Table 4.3: Summary data for SO2 monitoring in Hawkes Bay 47 Table 4.4: Summary data for SO2 monitoring in Canterbury 48 Table 4.5: Concentrations of SO2 measured in Dunedin (wet chemical) 55 Table 9.1: Areas where CO, NO2, SO2 and O3 have exceeded guideline values between
1992 and 2002 69
Technical document – this is not Government policy.
viii Monitoring of CO, NO2, SO2, ozone, benzene and benzo(a)pyrene in New Zealand
List of Figures Figure 2.1: Percentage of measured one-hour and eight-hour average CO concentrations
within air quality categories at Queen Street (Tisdalls), Auckland 7 Figure 2.2: Percentage of measured one-hour and eight-hour average CO concentrations
within air quality categories at Queen Street (carpark site), Auckland 8 Figure 2.3: Percentage of measured one-hour and eight-hour average CO concentrations
within air quality categories at Takapuna, Auckland 8 Figure 2.4: Percentage of measured one-hour and eight-hour average CO concentrations
within air quality categories at Khyber Pass, Auckland 9 Figure 2.5: Percentage of measured one-hour and eight-hour average CO concentrations
within air quality categories at Hobson, Auckland 9 Figure 2.6: Percentage of measured one-hour and eight-hour average CO concentrations
within air quality categories at Henderson and Dominion Road, Auckland 10 Figure 2.7: Percentage of measured one-hour and eight-hour average CO concentrations
within air quality categories at Manurewa and Pakuranga, Auckland 11 Figure 2.8: Percentage of measured one-hour and eight-hour average CO concentrations
within air quality categories at Manukau, Auckland 12 Figure 2.9: Percentage of measured one-hour and eight-hour average CO concentrations
within air quality categories in Wellington 14 Figure 2.10: Percentage of measured eight-hour average CO concentrations within air
quality categories at the Civic Centre, Wellington and Huia Pool 14 Figure 2.11: Percentage of measured one-hour and eight-hour average CO concentrations
within air quality categories in Upper Hutt, Lower Hutt and Masterton 15 Figure 2.12: Percentage of measured one-hour and eight-hour average CO concentrations
within air quality categories in Hamilton 16 Figure 2.13: Percentage of measured one-hour and eight-hour average CO concentrations
within air quality categories in Napier and Hastings 17 Figure 2.14: Percentage of measured one-hour and eight-hour average CO concentrations
within air quality categories in Rotorua and Tauranga 19 Figure 2.15: Percentage of measured one-hour and eight-hour average CO concentrations
within air quality categories in Rotorua and Tauranga traffic-peak sites 20 Figure 2.16: Percentage of measured one-hour and eight-hour average CO concentrations
within air quality categories in Opotiki 20 Figure 2.17: Percentage of measured one-hour and eight-hour average CO concentrations
within air quality categories at Packe Street and Coles Place, Christchurch 23 Figure 2.18: Maximum eight-hour average CO concentrations and number of days per year
the guideline value was exceeded at Packe Street, Christchurch 24 Figure 2.19: Percentage of measured one-hour and eight-hour average CO concentrations
within air quality categories at Hornby and Beckenham, Christchurch 25 Figure 2.20: Percentage of measured one-hour and eight-hour average CO concentrations
within air quality categories on Riccarton Road, Christchurch 26 Figure 2.21: Percentage of measured one-hour and eight-hour average CO concentrations
within air quality categories in Rangiora, Ashburton and Kaiapoi 27 Figure 2.22: Percentage of measured one-hour and eight-hour average CO concentrations
within air quality categories in Dunedin and Mosgiel 28
Technical report – this is not Government policy.
Monitoring of CO, NO2, SO2, ozone, benzene and benzo(a)pyrene in New Zealand ix
Figure 2.23: Percentage of measured eight-hour average CO concentrations within air quality categories in Dunedin, 2002 28
Figure 2.24: Percentage of measured one-hour and eight-hour average CO concentrations within air quality categories in Nelson 29
Figure 2.25: Percentage of measured one-hour and eight-hour average CO concentrations within air quality categories at the Victory site in Nelson 29
Figure 3.1: Percentage of measured one-hour and 24-hour average NO2 concentrations within air quality categories at Dominion Road, Khyber Pass Road, One Tree Hill and Penrose (ACI site) in Auckland 33
Figure 3.2: Percentage of measured one-hour and 24-hour average NO2 concentrations within air quality categories at Penrose, Mt Eden and Musick Point in Auckland 34
Figure 3.3: Percentage of measured one-hour and 24-hour average NO2 concentrations within air quality categories in the Wellington region 36
Figure 3.4: Percentage of measured one-hour and 24-hour average NO2 concentrations within air quality categories in Hamilton 37
Figure 3.5: Concentrations of NO2 measured in Taranaki 38 Figure 3.6: Percentage of measured one-hour and 24-hour average NO2 concentrations
within air quality categories in Napier and Hastings, 1998 39 Figure 3.7: Percentage of measured one-hour and 24-hour average NO2 concentrations
within air quality categories at Packe Street and Coles Place, Christchurch 41 Figure 3.8: Percentage of measured one-hour and 24-hour average NO2 concentrations
within air quality categories at the hospital and fire station sites in Nelson, 2001 43
Figure 3.9: The percentage of measured one-hour and 24-hour average NO2 concentrations within air quality categories at the Victory School site in Nelson, 2002 43
Figure 4.1: Percentage of measured one-hour and 24-hour average SO2 concentrations within air quality categories at Penrose, Auckland 46
Figure 4.2: Percentage of measured one-hour and 24-hour average SO2 concentrations within air quality categories in Hastings, 1998 47
Figure 4.3: Percentage of measured one-hour and 24-hour average SO2 concentrations within air quality categories at Packe Street and Coles Place in central Christchurch 50
Figure 4.4: Percentage of measured one-hour and 24-hour average SO2 concentrations within air quality categories in Hornby and Opawa, Christchurch 51
Figure 4.5: Percentage of measured one-hour and 24-hour average SO2 concentrations within air quality categories in Timaru 52
Figure 4.6: Percentage of measured one-hour and 24-hour average SO2 concentrations within air quality categories in Ashburton, Rangiora and Kaiapoi 53
Figure 4.7: Percentage of measured one-hour and 24-hour average SO2 concentrations within air quality categories in Greymouth, 2001 54
Figure 4.8: Maximum monthly one-hour average SO2 (µg/m3) concentrations recorded at the Takahiwai monitoring site 56
Figure 5.1: Percentage of measured one-hour and eight-hour average O3 concentrations within air quality categories in Pukekohe and Musick Point, Auckland 58
Technical document – this is not Government policy.
x Monitoring of CO, NO2, SO2, ozone, benzene and benzo(a)pyrene in New Zealand
Figure 5.2: Percentage of measured one-hour and eight-hour average O3 concentrations within air quality categories at the Skytower, Mangere and Whangaparoa, Auckland 59
Figure 5.3: Percentage of measured one-hour and eight-hour average O3 concentrations within air quality categories at Lincoln and Kainga in Canterbury 60
Figure 6.1: Benzene concentrations measured in Auckland, Christchurch, Dunedin and Hamilton from 1996 to 1999 61
Figure 6.2: Concentrations of benzene measured in Auckland during 2002 62 Figure 6.3: Annual average concentrations of benzene in Christchurch 63 Figure 6.4: Three-month average benzene concentrations measured in Christchurch 63 Figure 6.5: Concentrations of benzene measured on the West Coast in 2001 and 2002 64 Figure 6.6: Concentrations of benzene measured in Bay of Plenty in 2000 and 2001 65 Figure 7.1: Concentrations of BaP measured in Auckland in 1997 and 1998 66 Figure 7.2: Concentrations of BaP measured in 1999 at Coles Place and Packe Street,
Christchurch 67 Figure 8.1: Median CO and NO2 concentrations measured in Auckland and Christchurch
from 1992 to 2001 68
Technical report – this is not Government policy.
Monitoring of CO, NO2, SO2, ozone, benzene and benzo(a)pyrene in New Zealand xi
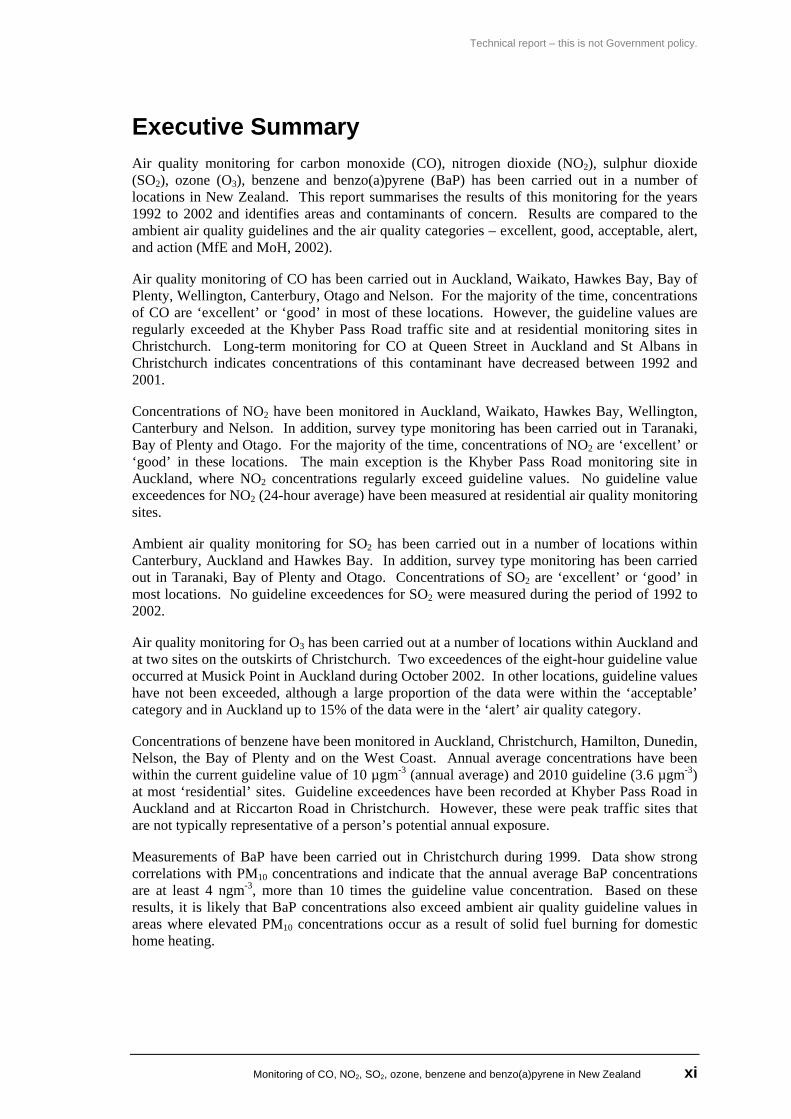
Executive Summary Air quality monitoring for carbon monoxide (CO), nitrogen dioxide (NO2), sulphur dioxide (SO2), ozone (O3), benzene and benzo(a)pyrene (BaP) has been carried out in a number of locations in New Zealand. This report summarises the results of this monitoring for the years 1992 to 2002 and identifies areas and contaminants of concern. Results are compared to the ambient air quality guidelines and the air quality categories – excellent, good, acceptable, alert, and action (MfE and MoH, 2002).
Air quality monitoring of CO has been carried out in Auckland, Waikato, Hawkes Bay, Bay of Plenty, Wellington, Canterbury, Otago and Nelson. For the majority of the time, concentrations of CO are ‘excellent’ or ‘good’ in most of these locations. However, the guideline values are regularly exceeded at the Khyber Pass Road traffic site and at residential monitoring sites in Christchurch. Long-term monitoring for CO at Queen Street in Auckland and St Albans in Christchurch indicates concentrations of this contaminant have decreased between 1992 and 2001.
Concentrations of NO2 have been monitored in Auckland, Waikato, Hawkes Bay, Wellington, Canterbury and Nelson. In addition, survey type monitoring has been carried out in Taranaki, Bay of Plenty and Otago. For the majority of the time, concentrations of NO2 are ‘excellent’ or ‘good’ in these locations. The main exception is the Khyber Pass Road monitoring site in Auckland, where NO2 concentrations regularly exceed guideline values. No guideline value exceedences for NO2 (24-hour average) have been measured at residential air quality monitoring sites.
Ambient air quality monitoring for SO2 has been carried out in a number of locations within Canterbury, Auckland and Hawkes Bay. In addition, survey type monitoring has been carried out in Taranaki, Bay of Plenty and Otago. Concentrations of SO2 are ‘excellent’ or ‘good’ in most locations. No guideline exceedences for SO2 were measured during the period of 1992 to 2002.
Air quality monitoring for O3 has been carried out at a number of locations within Auckland and at two sites on the outskirts of Christchurch. Two exceedences of the eight-hour guideline value occurred at Musick Point in Auckland during October 2002. In other locations, guideline values have not been exceeded, although a large proportion of the data were within the ‘acceptable’ category and in Auckland up to 15% of the data were in the ‘alert’ air quality category.
Concentrations of benzene have been monitored in Auckland, Christchurch, Hamilton, Dunedin, Nelson, the Bay of Plenty and on the West Coast. Annual average concentrations have been within the current guideline value of 10 µgm-3 (annual average) and 2010 guideline (3.6 µgm-3) at most ‘residential’ sites. Guideline exceedences have been recorded at Khyber Pass Road in Auckland and at Riccarton Road in Christchurch. However, these were peak traffic sites that are not typically representative of a person’s potential annual exposure.
Measurements of BaP have been carried out in Christchurch during 1999. Data show strong correlations with PM10 concentrations and indicate that the annual average BaP concentrations are at least 4 ngm-3, more than 10 times the guideline value concentration. Based on these results, it is likely that BaP concentrations also exceed ambient air quality guideline values in areas where elevated PM10 concentrations occur as a result of solid fuel burning for domestic home heating.

Technical report – this is not Government policy.
Monitoring of CO, NO2, SO2, ozone, benzene and benzo(a)pyrene in New Zealand 1
1 Introduction This report provides a summary of the results of air quality monitoring of carbon monoxide (CO), nitrogen dioxide (NO2), sulphur dioxide (SO2), ozone (O3), benzene and benzo(a)pyrene in New Zealand from 1992 to 2002.
Prior to the introduction of the Resource Management Act (RMA) in 1991, air quality monitoring in New Zealand was the responsibility of the then Department of Health. Monitoring at that time was mainly conducted in the larger urban centres of Christchurch and Auckland, although some smoke monitoring was carried out in the smaller towns. Air quality monitoring in Auckland and Christchurch prior to 1991 included CO, NOx, SO2, lead and particles. Concentrations were typically compared to international guidelines such as those set by the World Health Organisation (WHO).
With the RMA came a shift in the responsibility for air quality to regional councils. Specific requirements under Sections 35 and 30 of the RMA include air quality monitoring and management. As a result, air quality monitoring networks were established and expanded throughout the country during the 1990s.
In 1994, the Ministry for the Environment developed a set of ambient air quality guidelines for key air contaminants in New Zealand (MfE, 1994). These included health related guideline values for CO, PM10, SO2, NO2, O3, hydrogen sulphide (H2S), and lead. A review of these guideline values and their application was carried out during the late 1990s and a discussion document on this review was released in December 2000 (MfE, 2000). In May 2002, the final updated ambient air quality guideline values were released (MfE and MoH, 2002). This document includes revised guideline values of the contaminants in the 1994 document as well as guideline values for new contaminants including benzene, 1,3 butadiene, formaldehyde, acetaldehyde, benzo(a)pyrene, mercury, chromium and arsenic. The guideline values for contaminants that are discussed in this report are shown in Table 1.2.
The Ministry for the Environment has also established an Environmental Performance Indicators programme to collate and report air quality data. The programme aims to improve the quality, quantity and reporting of air quality monitoring. Through the signing of partnership agreements, councils have agreed to undertake specific monitoring and to provide the data for reporting over a national website. As part of the obligations under the agreements, councils will have the opportunity to comment on this report prior to its release.
The monitoring procedures used by regional councils mostly follow the recommendations outlined in the Ministry’s Good Practice Guide for Air Quality Monitoring and Data Management. This document includes a description of monitoring methods and data collection and processing protocols for New Zealand. One of the recommended reporting methods for presenting air quality data is the use of air quality categories based on a proportion of the guideline value (Table 1.1). These categories are used to present air quality data. These are generally presented based on air quality monitoring results for each year of monitoring. However, in locations where monitoring was limited to shorter time periods, results have been presented on a monthly basis.
Technical document – this is not Government policy.
2 Monitoring of CO, NO2, SO2, ozone, benzene and benzo(a)pyrene in New Zealand
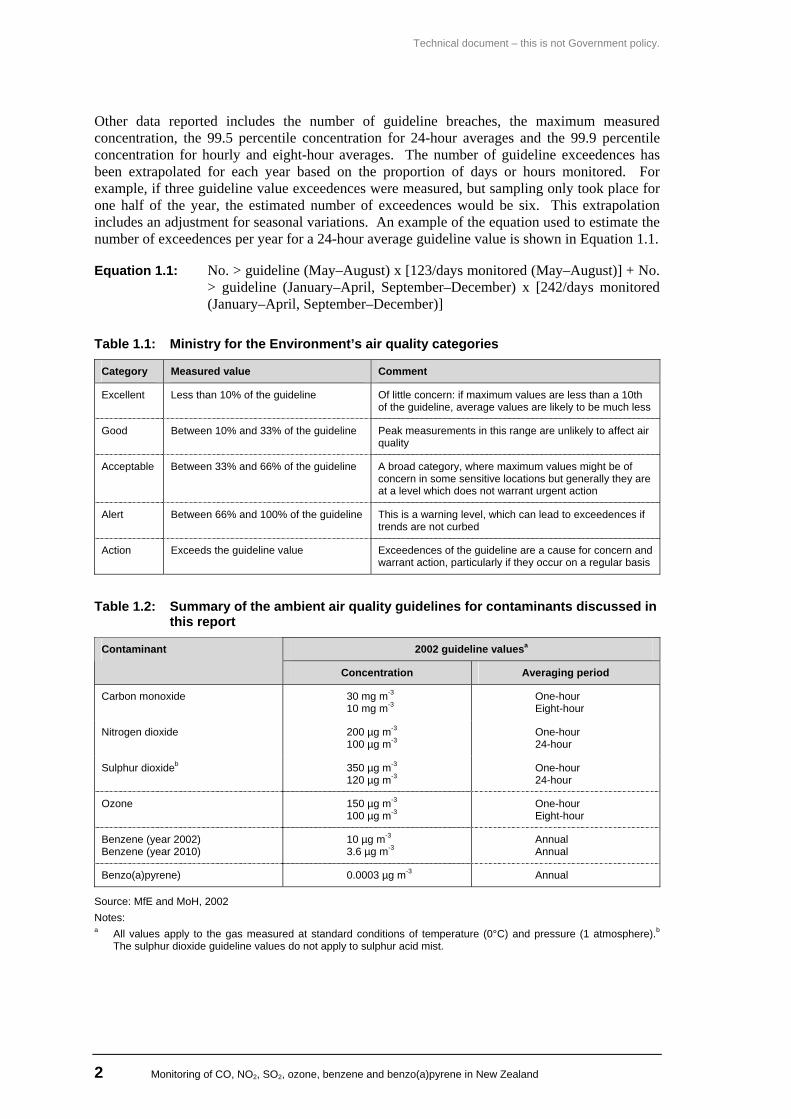
Other data reported includes the number of guideline breaches, the maximum measured concentration, the 99.5 percentile concentration for 24-hour averages and the 99.9 percentile concentration for hourly and eight-hour averages. The number of guideline exceedences has been extrapolated for each year based on the proportion of days or hours monitored. For example, if three guideline value exceedences were measured, but sampling only took place for one half of the year, the estimated number of exceedences would be six. This extrapolation includes an adjustment for seasonal variations. An example of the equation used to estimate the number of exceedences per year for a 24-hour average guideline value is shown in Equation 1.1.
Equation 1.1: No. > guideline (May–August) x [123/days monitored (May–August)] + No. > guideline (January–April, September–December) x [242/days monitored (January–April, September–December)]
Table 1.1: Ministry for the Environment’s air quality categories
Category Measured value Comment
Excellent Less than 10% of the guideline Of little concern: if maximum values are less than a 10th of the guideline, average values are likely to be much less
Good Between 10% and 33% of the guideline Peak measurements in this range are unlikely to affect air quality
Acceptable Between 33% and 66% of the guideline A broad category, where maximum values might be of concern in some sensitive locations but generally they are at a level which does not warrant urgent action
Alert Between 66% and 100% of the guideline This is a warning level, which can lead to exceedences if trends are not curbed
Action Exceeds the guideline value Exceedences of the guideline are a cause for concern and warrant action, particularly if they occur on a regular basis
Table 1.2: Summary of the ambient air quality guidelines for contaminants discussed in this report
2002 guideline valuesa Contaminant
Concentration Averaging period
Carbon monoxide 30 mg m-3 10 mg m-3
One-hour Eight-hour
Nitrogen dioxide 200 µg m-3 100 µg m-3
One-hour 24-hour
Sulphur dioxideb 350 µg m-3 120 µg m-3
One-hour 24-hour
Ozone 150 µg m-3 100 µg m-3
One-hour Eight-hour
Benzene (year 2002) Benzene (year 2010)
10 µg m-3 3.6 µg m-3
Annual Annual
Benzo(a)pyrene) 0.0003 µg m-3 Annual
Source: MfE and MoH, 2002 Notes: a All values apply to the gas measured at standard conditions of temperature (0°C) and pressure (1 atmosphere).b
The sulphur dioxide guideline values do not apply to sulphur acid mist.
Technical report – this is not Government policy.
Monitoring of CO, NO2, SO2, ozone, benzene and benzo(a)pyrene in New Zealand 3
Each section in this report provides a brief description of the recommended monitoring methods for that contaminant, followed by sections outlining the state or concentrations in each region where monitoring is carried out.
1.1 Air quality monitoring in New Zealand The number of air quality monitoring sites and the range of contaminants monitored in New Zealand has expanded over the last decade. While suspended particulate (PM10) is the priority contaminant for air quality monitoring in most regions, measurements of other contaminants such as CO and NO2 are also common. In Auckland, extensive monitoring has also been carried out for O3 and in Christchurch, concentrations of SO2 are also routinely measured. Concentrations of benzene and benzo(a)pyrene have been measured in some locations in recent years, although this monitoring tends to be for a shorter term, rather than continuous sampling. A summary of the air quality monitoring sites within New Zealand and the contaminants that have been measured is provided in Appendix One.
Technical document – this is not Government policy.
4 Monitoring of CO, NO2, SO2, ozone, benzene and benzo(a)pyrene in New Zealand
2 Carbon monoxide (CO) Concentrations of carbon monoxide have been measured in a number of urban centres in New Zealand. Results of this monitoring are compared to the following ambient air quality guideline values for New Zealand: • 30 mgm-3 (one-hour average) • 10 mgm-3 (eight-hour average).
The recommended monitoring method for carbon monoxide in New Zealand is AS3580.7.1 – 1992. This method specifies infra-red absorption. Unless stated otherwise, all data presented in this section are based on monitoring methods that comply with AS3580.7.1 – 1992. This method is the recommended in both the Good Practice Guide for Air Quality Monitoring and Data Management (MfE, 2000) and the Ambient Air Quality Guidelines (MfE and MoH, 2002).
2.1 Auckland region
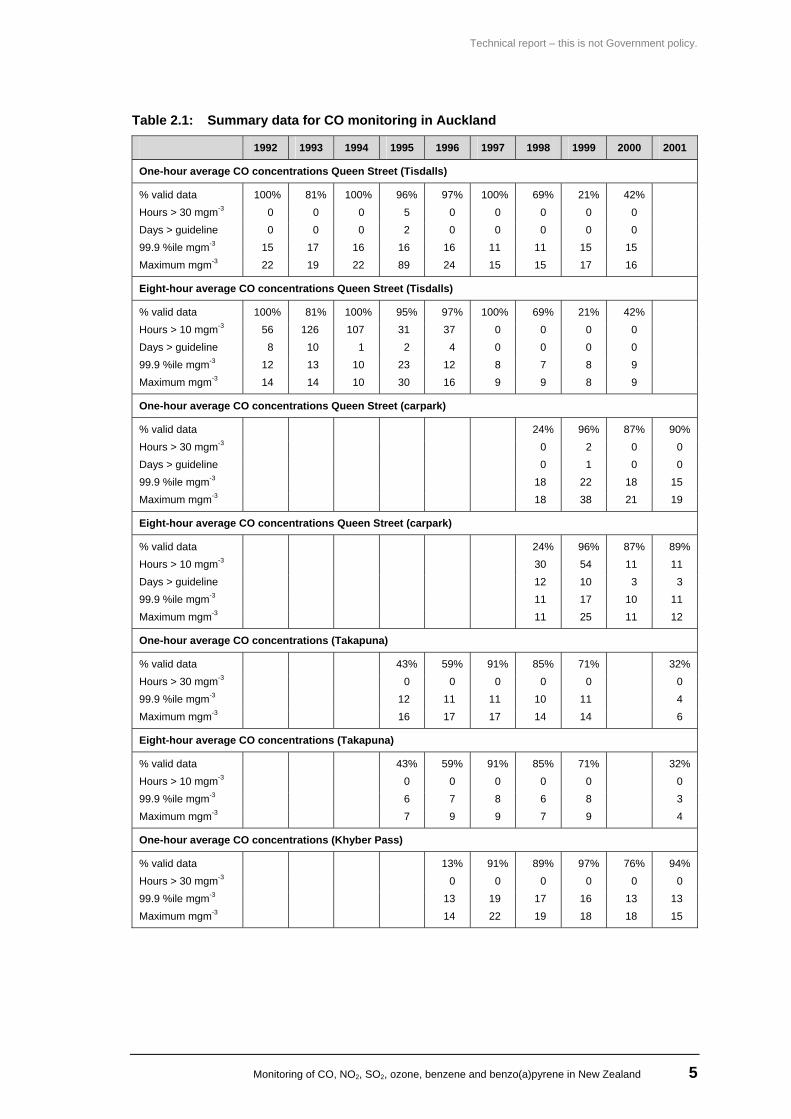
Carbon monoxide concentrations have been measured at nine sites in the Auckland region since 1992. The longest record of data is for Queen Street, for which data are available from 1992 to 2000 (Tisdalls site) and from 1998 to 2001 (carpark site). The summary data for CO monitoring in Auckland is shown in Table 2.1. The percentage of measured one-hour and eight-hour average CO concentrations within air quality categories at each site is shown in the graphs in Sections 2.1.1 to 2.1.7. Site classifications for the different areas are as follows: • Queen Street Traffic peak • Takapuna Residential peak • Khyber Pass Traffic peak • Hobson Street Traffic peak • Henderson Residential peak • Dominion Road Traffic peak • Pakuranga Residential peak • Manurewa Residential neighbourhood
Descriptions of the site classifications are on page 32 of the Good Practice Guide to Air Quality Monitoring and Data Management (Ministry for the Environment, 2000). In general, the first descriptor relates to the most likely sources of pollution and the second refers to the spatial area covered by the monitoring site. The latter is described in the Australian Standard – Ambient air – Guide for the siting of air sampling units (AS 2922, 1987).
Technical report – this is not Government policy.
Monitoring of CO, NO2, SO2, ozone, benzene and benzo(a)pyrene in New Zealand 5
Table 2.1: Summary data for CO monitoring in Auckland
1992 1993 1994 1995 1996 1997 1998 1999 2000 2001
One-hour average CO concentrations Queen Street (Tisdalls)
% valid data 100% 81% 100% 96% 97% 100% 69% 21% 42% Hours > 30 mgm-3 0 0 0 5 0 0 0 0 0 Days > guideline 0 0 0 2 0 0 0 0 0 99.9 %ile mgm-3 15 17 16 16 16 11 11 15 15 Maximum mgm-3 22 19 22 89 24 15 15 17 16
Eight-hour average CO concentrations Queen Street (Tisdalls)
% valid data 100% 81% 100% 95% 97% 100% 69% 21% 42% Hours > 10 mgm-3 56 126 107 31 37 0 0 0 0 Days > guideline 8 10 1 2 4 0 0 0 0 99.9 %ile mgm-3 12 13 10 23 12 8 7 8 9 Maximum mgm-3 14 14 10 30 16 9 9 8 9
One-hour average CO concentrations Queen Street (carpark)
% valid data 24% 96% 87% 90% Hours > 30 mgm-3 0 2 0 0 Days > guideline 0 1 0 0 99.9 %ile mgm-3 18 22 18 15 Maximum mgm-3 18 38 21 19
Eight-hour average CO concentrations Queen Street (carpark)
% valid data 24% 96% 87% 89% Hours > 10 mgm-3 30 54 11 11 Days > guideline 12 10 3 3 99.9 %ile mgm-3 11 17 10 11 Maximum mgm-3 11 25 11 12
One-hour average CO concentrations (Takapuna)
% valid data 43% 59% 91% 85% 71% 32% Hours > 30 mgm-3 0 0 0 0 0 0 99.9 %ile mgm-3 12 11 11 10 11 4 Maximum mgm-3 16 17 17 14 14 6
Eight-hour average CO concentrations (Takapuna)
% valid data 43% 59% 91% 85% 71% 32% Hours > 10 mgm-3 0 0 0 0 0 0 99.9 %ile mgm-3 6 7 8 6 8 3 Maximum mgm-3 7 9 9 7 9 4
One-hour average CO concentrations (Khyber Pass)
% valid data 13% 91% 89% 97% 76% 94% Hours > 30 mgm-3 0 0 0 0 0 0 99.9 %ile mgm-3 13 19 17 16 13 13 Maximum mgm-3 14 22 19 18 18 15
Technical document – this is not Government policy.
6 Monitoring of CO, NO2, SO2, ozone, benzene and benzo(a)pyrene in New Zealand
1992 1993 1994 1995 1996 1997 1998 1999 2000 2001
Eight-hour average CO concentrations (Khyber Pass)
% valid data 13% 91% 89% 97% 75% 94% Hours > 10 mgm-3 15 188 110 57 0 0 Days > guideline 8 51 31 21 0 0 99.9 %ile mgm-3 10 13 12 11 9 8 Maximum mgm-3 11 14 14 11 10 9
One-hour average CO concentrations (Hobson)
% valid data 31% 100% 77% 99% 25% Hours > 30 mgm-3 0 0 0 0 0 99.9 %ile mgm-3 7 13 13 13 8 Maximum mgm-3 9 19 19 19 8
Eight-hour average CO concentrations (Hobson)
% valid data 31% 100% 77% 100% 25% Hours > 10 mgm-3 0 0 0 3 0 Days > guideline 0 0 0 2 0 99.9 %ile mgm-3 5 8 9 9 5 Maximum mgm-3 5 9 10 11 5
One-hour average CO concentrations (Dominion Road, 1995 and 1996, and Henderson)
% valid data 96% 11% 55% 99% 100% 99% Hours > 30 mgm-3 11 0 0 0 0 0 Days > guideline 1 0 0 0 0 0 99.9 %ile mgm-3 15 5 7 7 5 5 Maximum mgm-3 73 6 8 11 8 20
Eight-hour average CO concentrations (Dominion Road, 1995 and 1996, and Henderson)
% valid data 95% 11% 55% 99% 100% 99% Hours > 10 mgm-3 3 0 0 0 0 0 Days > guideline 1 0 0 0 0 0 99.9 %ile mgm-3 7 3 4 4 3 3 Maximum mgm-3 14 3 4 4 3 5
One-hour average CO concentrations (Manurewa, 1996 and 1997, and Pakuranga)
% valid data 78% 20% 44% 86% 69% 99% Hours > 30 mgm-3 0 0 0 0 0 0 99.9 %ile mgm-3 11 6 10 11 5 11 Maximum mgm-3 14 8 13 12 6 22
Eight-hour average CO concentrations (Manurewa, 1996 and 1997, and Pakuranga)
% valid data 78% 20% 44% 86% 69% 99% Hours > 10 mgm-3 0 0 0 0 0 0 99.9 %ile mgm-3 6 3 8 8 4 7 Maximum mgm-3 8 3 8 10 4 9
Technical report – this is not Government policy.
Monitoring of CO, NO2, SO2, ozone, benzene and benzo(a)pyrene in New Zealand 7
2000 2001 2002
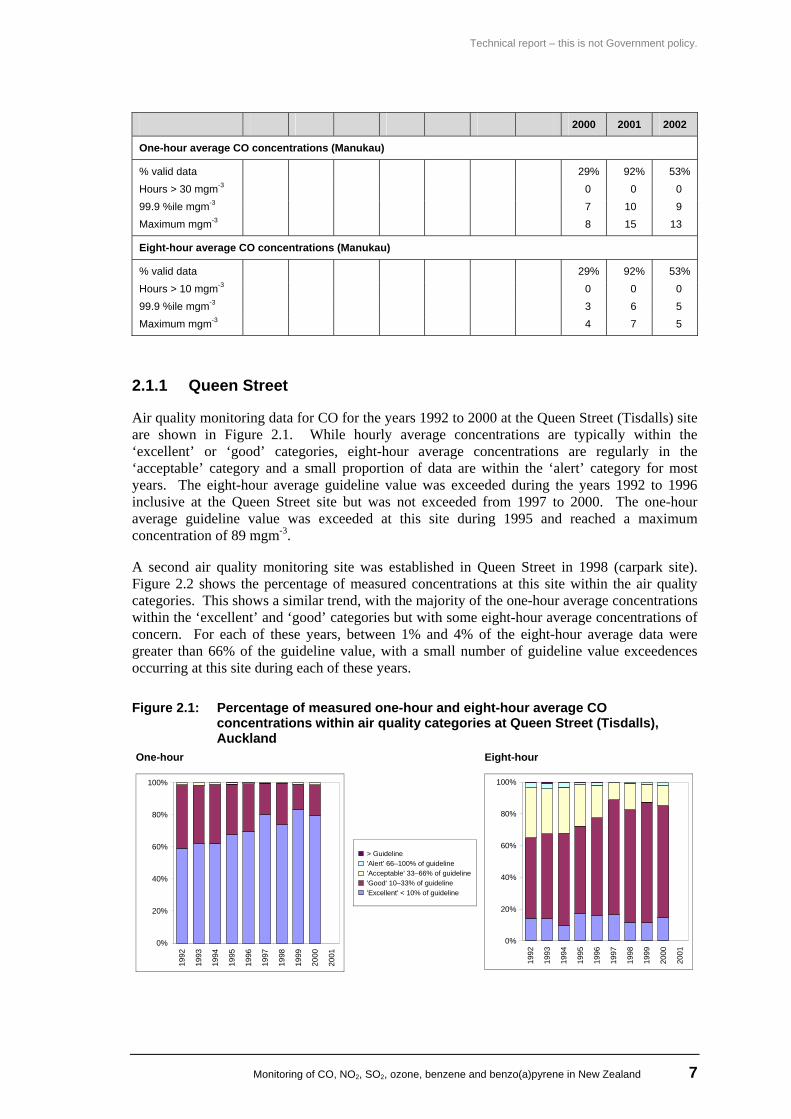
One-hour average CO concentrations (Manukau)
% valid data 29% 92% 53% Hours > 30 mgm-3 0 0 0 99.9 %ile mgm-3 7 10 9 Maximum mgm-3 8 15 13
Eight-hour average CO concentrations (Manukau)
% valid data 29% 92% 53% Hours > 10 mgm-3 0 0 0 99.9 %ile mgm-3 3 6 5 Maximum mgm-3 4 7 5
2.1.1 Queen Street
Air quality monitoring data for CO for the years 1992 to 2000 at the Queen Street (Tisdalls) site are shown in Figure 2.1. While hourly average concentrations are typically within the ‘excellent’ or ‘good’ categories, eight-hour average concentrations are regularly in the ‘acceptable’ category and a small proportion of data are within the ‘alert’ category for most years. The eight-hour average guideline value was exceeded during the years 1992 to 1996 inclusive at the Queen Street site but was not exceeded from 1997 to 2000. The one-hour average guideline value was exceeded at this site during 1995 and reached a maximum concentration of 89 mgm-3.
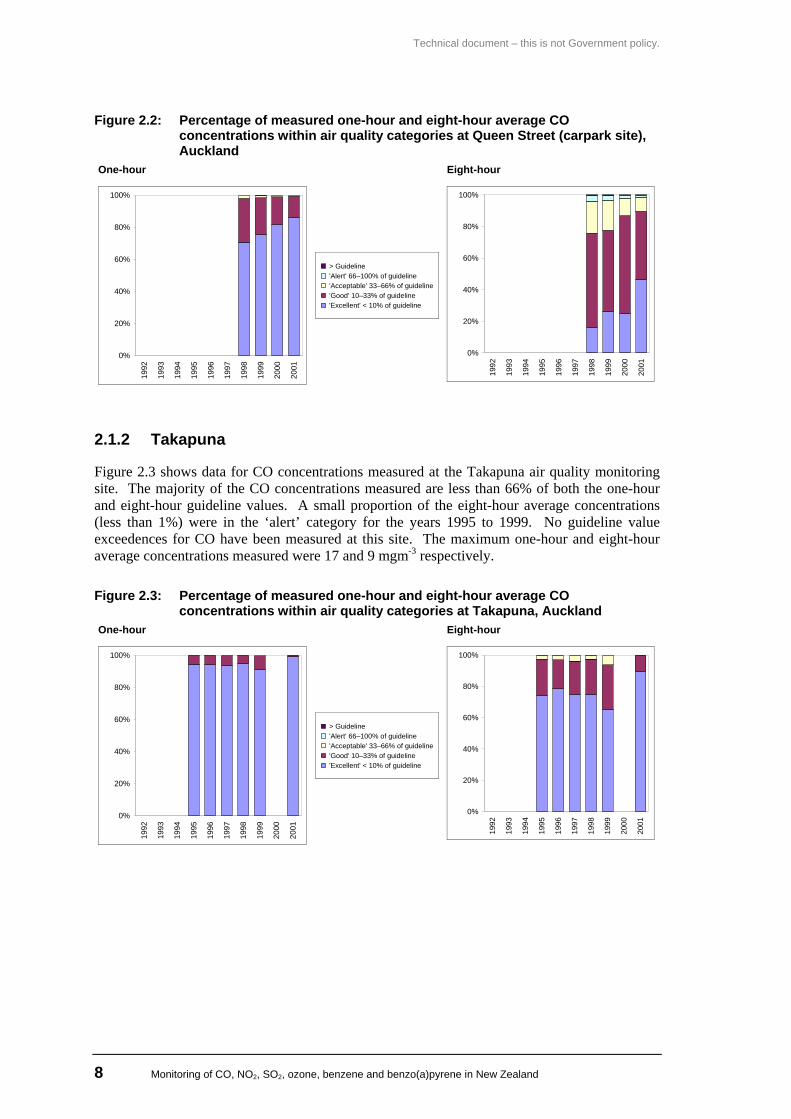
A second air quality monitoring site was established in Queen Street in 1998 (carpark site). Figure 2.2 shows the percentage of measured concentrations at this site within the air quality categories. This shows a similar trend, with the majority of the one-hour average concentrations within the ‘excellent’ and ‘good’ categories but with some eight-hour average concentrations of concern. For each of these years, between 1% and 4% of the eight-hour average data were greater than 66% of the guideline value, with a small number of guideline value exceedences occurring at this site during each of these years.
Figure 2.1: Percentage of measured one-hour and eight-hour average CO concentrations within air quality categories at Queen Street (Tisdalls), Auckland
One-hour Eight-hour
0%
20%
40%
60%
80%
100%
1992
1993
1994
1995
1996
1997
1998
1999
2000
2001
> Guideline 'Alert' 66–100% of guideline 'Acceptable' 33–66% of guideline 'Good' 10–33% of guideline 'Excellent' < 10% of guideline
0%
20%
40%
60%
80%
100%
1992
1993
1994
1995
1996
1997
1998
1999
2000
2001
Technical document – this is not Government policy.
8 Monitoring of CO, NO2, SO2, ozone, benzene and benzo(a)pyrene in New Zealand
Figure 2.2: Percentage of measured one-hour and eight-hour average CO concentrations within air quality categories at Queen Street (carpark site), Auckland
One-hour Eight-hour
0%
20%
40%
60%
80%
100%
1992
1993
1994
1995
1996
1997
1998
1999
2000
2001
> Guideline 'Alert' 66–100% of guideline 'Acceptable' 33–66% of guideline 'Good' 10–33% of guideline 'Excellent' < 10% of guideline
0%
20%
40%
60%
80%
100%
1992
1993
1994
1995
1996
1997
1998
1999
2000
2001
2.1.2 Takapuna
Figure 2.3 shows data for CO concentrations measured at the Takapuna air quality monitoring site. The majority of the CO concentrations measured are less than 66% of both the one-hour and eight-hour guideline values. A small proportion of the eight-hour average concentrations (less than 1%) were in the ‘alert’ category for the years 1995 to 1999. No guideline value exceedences for CO have been measured at this site. The maximum one-hour and eight-hour average concentrations measured were 17 and 9 mgm-3 respectively.
Figure 2.3: Percentage of measured one-hour and eight-hour average CO concentrations within air quality categories at Takapuna, Auckland
One-hour Eight-hour
0%
20%
40%
60%
80%
100%
1992
1993
1994
1995
1996
1997
1998
1999
2000
2001
> Guideline 'Alert' 66–100% of guideline 'Acceptable' 33–66% of guideline 'Good' 10–33% of guideline 'Excellent' < 10% of guideline
0%
20%
40%
60%
80%
100%
1992
1993
1994
1995
1996
1997
1998
1999
2000
2001
Technical report – this is not Government policy.
Monitoring of CO, NO2, SO2, ozone, benzene and benzo(a)pyrene in New Zealand 9
2.1.3 Khyber Pass
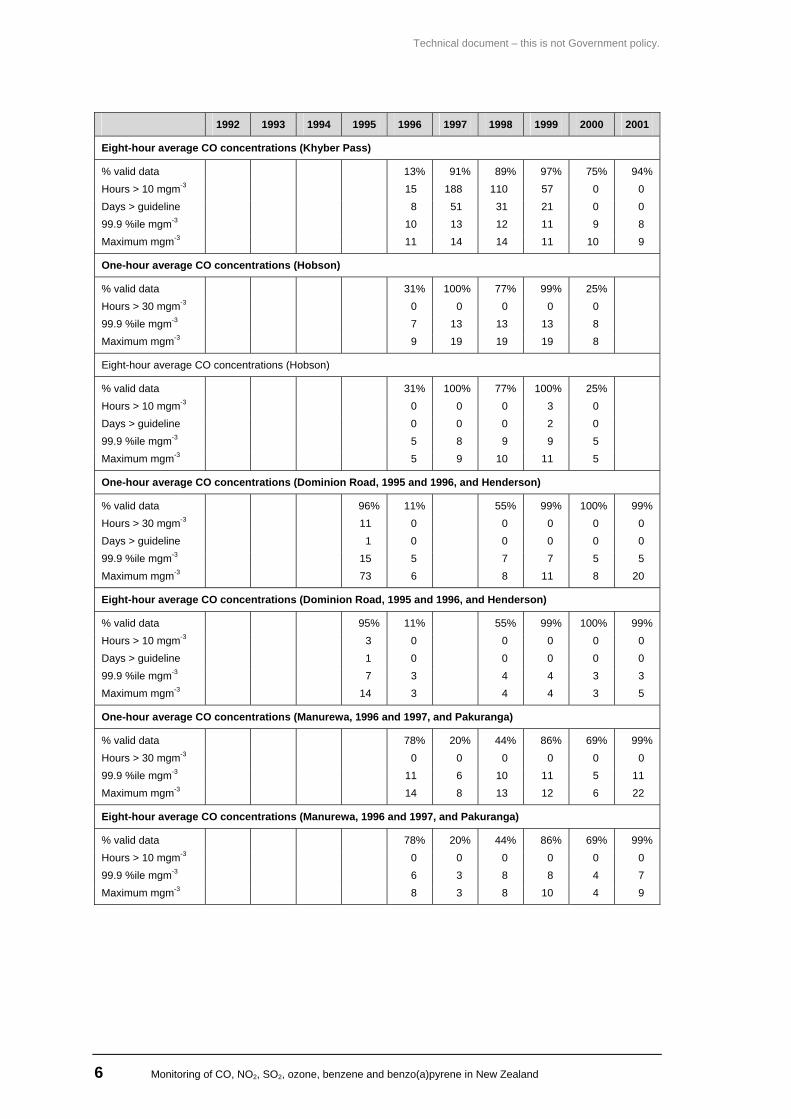
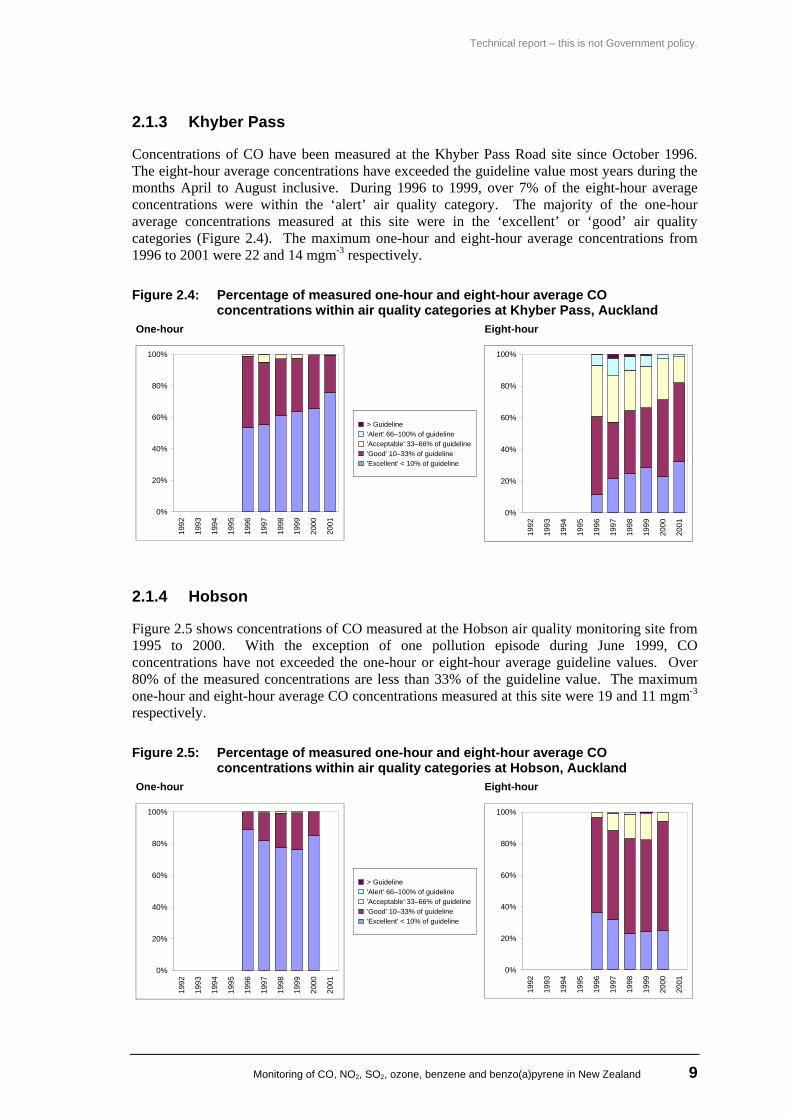
Concentrations of CO have been measured at the Khyber Pass Road site since October 1996. The eight-hour average concentrations have exceeded the guideline value most years during the months April to August inclusive. During 1996 to 1999, over 7% of the eight-hour average concentrations were within the ‘alert’ air quality category. The majority of the one-hour average concentrations measured at this site were in the ‘excellent’ or ‘good’ air quality categories (Figure 2.4). The maximum one-hour and eight-hour average concentrations from 1996 to 2001 were 22 and 14 mgm-3 respectively.
Figure 2.4: Percentage of measured one-hour and eight-hour average CO concentrations within air quality categories at Khyber Pass, Auckland
One-hour Eight-hour
0%
20%
40%
60%
80%
100%
1992
1993
1994
1995
1996
1997
1998
1999
2000
2001
> Guideline 'Alert' 66–100% of guideline 'Acceptable' 33–66% of guideline 'Good' 10–33% of guideline 'Excellent' < 10% of guideline
0%
20%
40%
60%
80%
100%
1992
1993
1994
1995
1996
1997
1998
1999
2000
2001
2.1.4 Hobson
Figure 2.5 shows concentrations of CO measured at the Hobson air quality monitoring site from 1995 to 2000. With the exception of one pollution episode during June 1999, CO concentrations have not exceeded the one-hour or eight-hour average guideline values. Over 80% of the measured concentrations are less than 33% of the guideline value. The maximum one-hour and eight-hour average CO concentrations measured at this site were 19 and 11 mgm-3 respectively.
Figure 2.5: Percentage of measured one-hour and eight-hour average CO concentrations within air quality categories at Hobson, Auckland
One-hour Eight-hour
0%
20%
40%
60%
80%
100%
1992
1993
1994
1995
1996
1997
1998
1999
2000
2001
> Guideline 'Alert' 66–100% of guideline 'Acceptable' 33–66% of guideline 'Good' 10–33% of guideline 'Excellent' < 10% of guideline
0%
20%
40%
60%
80%
100%
1992
1993
1994
1995
1996
1997
1998
1999
2000
2001
Technical document – this is not Government policy.
10 Monitoring of CO, NO2, SO2, ozone, benzene and benzo(a)pyrene in New Zealand
2.1.5 Henderson and Dominion Road
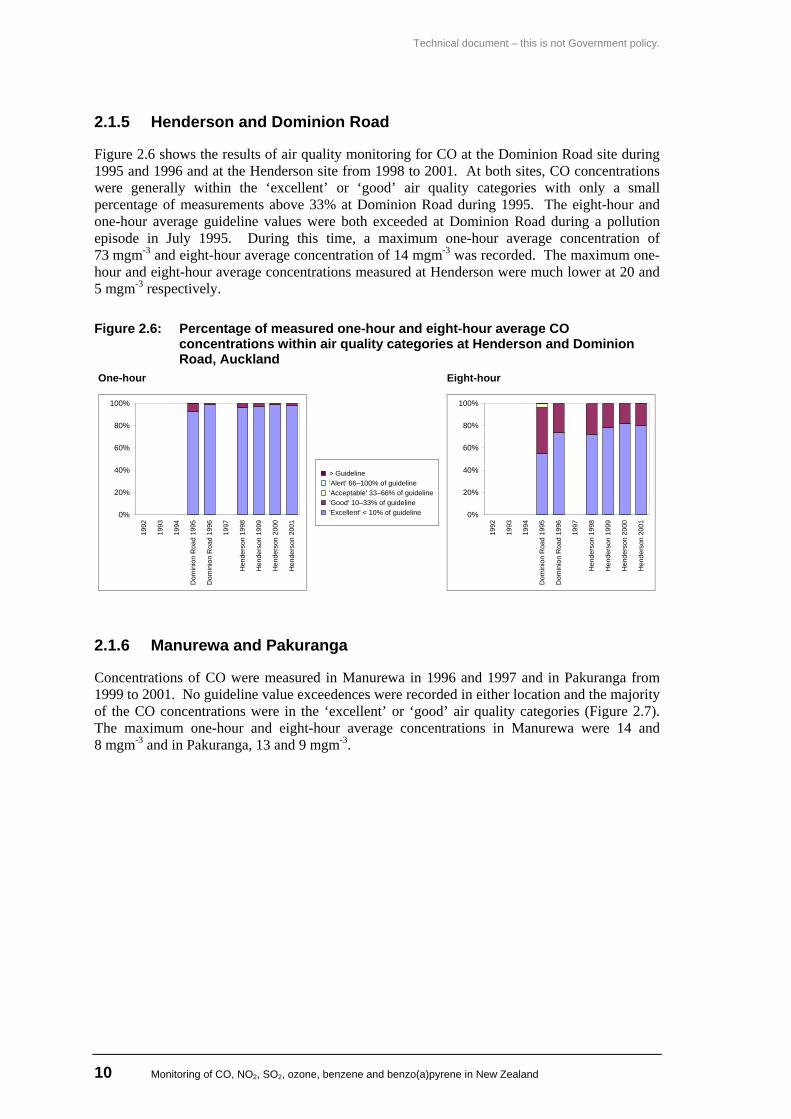
Figure 2.6 shows the results of air quality monitoring for CO at the Dominion Road site during 1995 and 1996 and at the Henderson site from 1998 to 2001. At both sites, CO concentrations were generally within the ‘excellent’ or ‘good’ air quality categories with only a small percentage of measurements above 33% at Dominion Road during 1995. The eight-hour and one-hour average guideline values were both exceeded at Dominion Road during a pollution episode in July 1995. During this time, a maximum one-hour average concentration of 73 mgm-3 and eight-hour average concentration of 14 mgm-3 was recorded. The maximum one-hour and eight-hour average concentrations measured at Henderson were much lower at 20 and 5 mgm-3 respectively.
Figure 2.6: Percentage of measured one-hour and eight-hour average CO concentrations within air quality categories at Henderson and Dominion Road, Auckland
One-hour Eight-hour
0%
20%
40%
60%
80%
100%
1992
1993
1994
Dom
inio
n R
oad
1995
Dom
inio
n R
oad
1996
1997
Hen
ders
on 1
998
Hen
ders
on 1
999
Hen
ders
on 2
000
Hen
ders
on 2
001
> Guideline 'Alert' 66–100% of guideline 'Acceptable' 33–66% of guideline 'Good' 10–33% of guideline 'Excellent' < 10% of guideline 0%
20%
40%
60%
80%
100%
1992
1993
1994
Dom
inio
n R
oad
1995
Dom
inio
n R
oad
1996
1997
Hen
ders
on 1
998
Hen
ders
on 1
999
Hen
ders
on 2
000
Hen
ders
on 2
001
2.1.6 Manurewa and Pakuranga
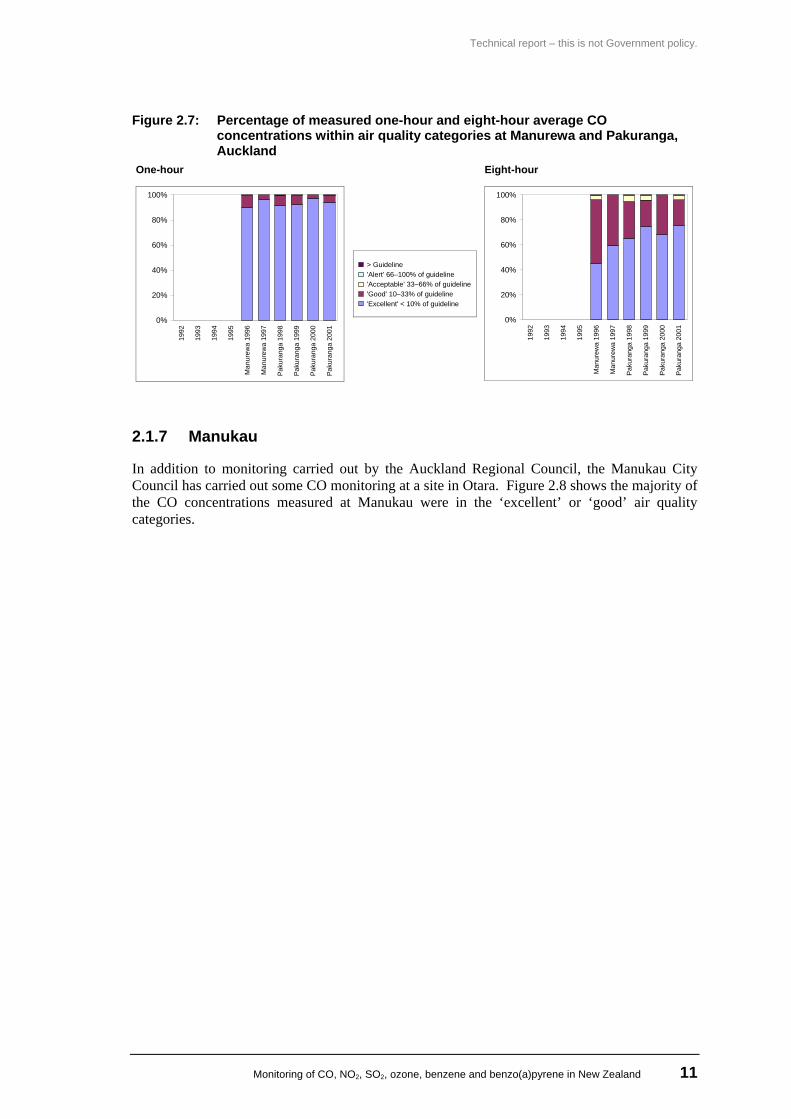
Concentrations of CO were measured in Manurewa in 1996 and 1997 and in Pakuranga from 1999 to 2001. No guideline value exceedences were recorded in either location and the majority of the CO concentrations were in the ‘excellent’ or ‘good’ air quality categories (Figure 2.7). The maximum one-hour and eight-hour average concentrations in Manurewa were 14 and 8 mgm-3 and in Pakuranga, 13 and 9 mgm-3.
Technical report – this is not Government policy.
Monitoring of CO, NO2, SO2, ozone, benzene and benzo(a)pyrene in New Zealand 11
Figure 2.7: Percentage of measured one-hour and eight-hour average CO concentrations within air quality categories at Manurewa and Pakuranga, Auckland
One-hour Eight-hour
0%
20%
40%
60%
80%
100%
1992
1993
1994
1995
Man
urew
a 19
96
Man
urew
a 19
97
Paku
rang
a 19
98
Paku
rang
a 19
99
Paku
rang
a 20
00
Paku
rang
a 20
01
> Guideline 'Alert' 66–100% of guideline 'Acceptable' 33–66% of guideline 'Good' 10–33% of guideline 'Excellent' < 10% of guideline
0%
20%
40%
60%
80%
100%
1992
1993
1994
1995
Man
urew
a 19
96
Man
urew
a 19
97
Pak
uran
ga 1
998
Pak
uran
ga 1
999
Pak
uran
ga 2
000
Pak
uran
ga 2
001
2.1.7 Manukau
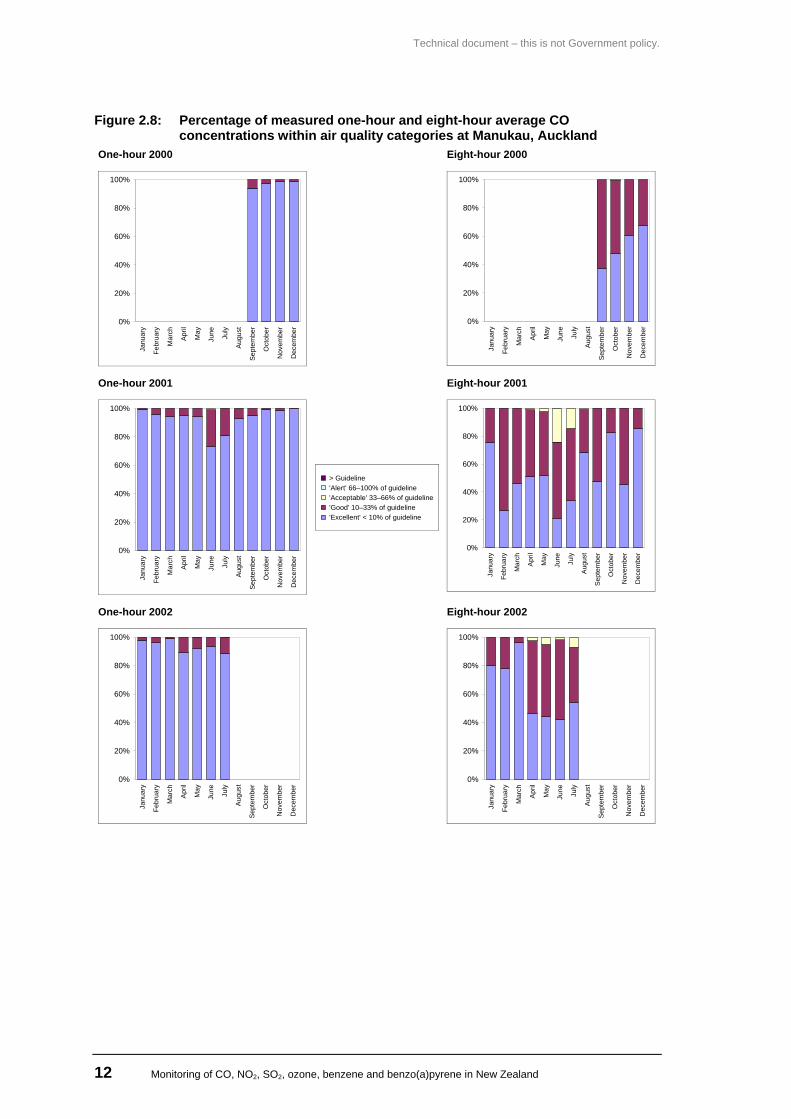
In addition to monitoring carried out by the Auckland Regional Council, the Manukau City Council has carried out some CO monitoring at a site in Otara. Figure 2.8 shows the majority of the CO concentrations measured at Manukau were in the ‘excellent’ or ‘good’ air quality categories.
Technical document – this is not Government policy.
12 Monitoring of CO, NO2, SO2, ozone, benzene and benzo(a)pyrene in New Zealand
Figure 2.8: Percentage of measured one-hour and eight-hour average CO concentrations within air quality categories at Manukau, Auckland
One-hour 2000 Eight-hour 2000
0%
20%
40%
60%
80%
100%
Janu
ary
Febr
uary
Mar
ch
Apr
il
May
June
July
Aug
ust
Sept
embe
r
Oct
ober
Nov
embe
r
Dec
embe
r
0%
20%
40%
60%
80%
100%
Janu
ary
Febr
uary
Mar
ch
Apr
il
May
June July
Augu
st
Sept
embe
r
Oct
ober
Nov
embe
r
Dec
embe
r
One-hour 2001 Eight-hour 2001
0%
20%
40%
60%
80%
100%
Janu
ary
Febr
uary
Mar
ch
Apr
il
May
June
July
Aug
ust
Sept
embe
r
Oct
ober
Nov
embe
r
Dec
embe
r
> Guideline 'Alert' 66–100% of guideline 'Acceptable' 33–66% of guideline 'Good' 10–33% of guideline 'Excellent' < 10% of guideline
0%
20%
40%
60%
80%
100%
Janu
ary
Febr
uary
Mar
ch
Apr
il
May
June July
Aug
ust
Sept
embe
r
Oct
ober
Nov
embe
r
Dec
embe
r
One-hour 2002 Eight-hour 2002
0%
20%
40%
60%
80%
100%
Janu
ary
Febr
uary
Mar
ch
Apr
il
May
June
July
Aug
ust
Sept
embe
r
Oct
ober
Nov
embe
r
Dec
embe
r
0%
20%
40%
60%
80%
100%
Janu
ary
Febr
uary
Mar
ch
Apr
il
May
June
July
Aug
ust
Sept
embe
r
Oct
ober
Nov
embe
r
Dec
embe
r
Technical report – this is not Government policy.
Monitoring of CO, NO2, SO2, ozone, benzene and benzo(a)pyrene in New Zealand 13
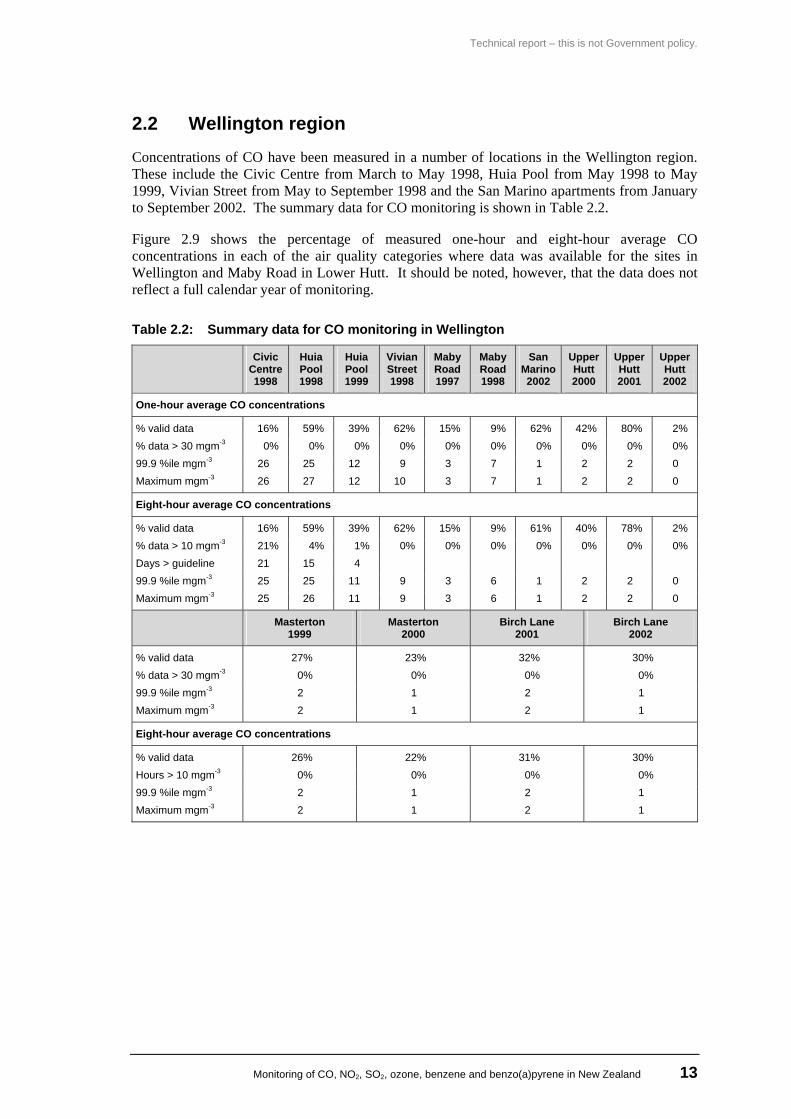
2.2 Wellington region Concentrations of CO have been measured in a number of locations in the Wellington region. These include the Civic Centre from March to May 1998, Huia Pool from May 1998 to May 1999, Vivian Street from May to September 1998 and the San Marino apartments from January to September 2002. The summary data for CO monitoring is shown in Table 2.2.
Figure 2.9 shows the percentage of measured one-hour and eight-hour average CO concentrations in each of the air quality categories where data was available for the sites in Wellington and Maby Road in Lower Hutt. It should be noted, however, that the data does not reflect a full calendar year of monitoring.
Table 2.2: Summary data for CO monitoring in Wellington
Civic Centre 1998
Huia Pool 1998
Huia Pool1999
Vivian Street1998
Maby Road1997
Maby Road1998
San Marino2002
Upper Hutt 2000
Upper Hutt 2001
Upper Hutt 2002
One-hour average CO concentrations
% valid data 16% 59% 39% 62% 15% 9% 62% 42% 80% 2% % data > 30 mgm-3 0% 0% 0% 0% 0% 0% 0% 0% 0% 0% 99.9 %ile mgm-3 26 25 12 9 3 7 1 2 2 0 Maximum mgm-3 26 27 12 10 3 7 1 2 2 0
Eight-hour average CO concentrations
% valid data 16% 59% 39% 62% 15% 9% 61% 40% 78% 2% % data > 10 mgm-3 21% 4% 1% 0% 0% 0% 0% 0% 0% 0% Days > guideline 21 15 4 99.9 %ile mgm-3 25 25 11 9 3 6 1 2 2 0 Maximum mgm-3 25 26 11 9 3 6 1 2 2 0
Masterton 1999
Masterton 2000
Birch Lane 2001
Birch Lane 2002
% valid data 27% 23% 32% 30% % data > 30 mgm-3 0% 0% 0% 0% 99.9 %ile mgm-3 2 1 2 1 Maximum mgm-3 2 1 2 1
Eight-hour average CO concentrations
% valid data 26% 22% 31% 30% Hours > 10 mgm-3 0% 0% 0% 0% 99.9 %ile mgm-3 2 1 2 1 Maximum mgm-3 2 1 2 1
Technical document – this is not Government policy.
14 Monitoring of CO, NO2, SO2, ozone, benzene and benzo(a)pyrene in New Zealand
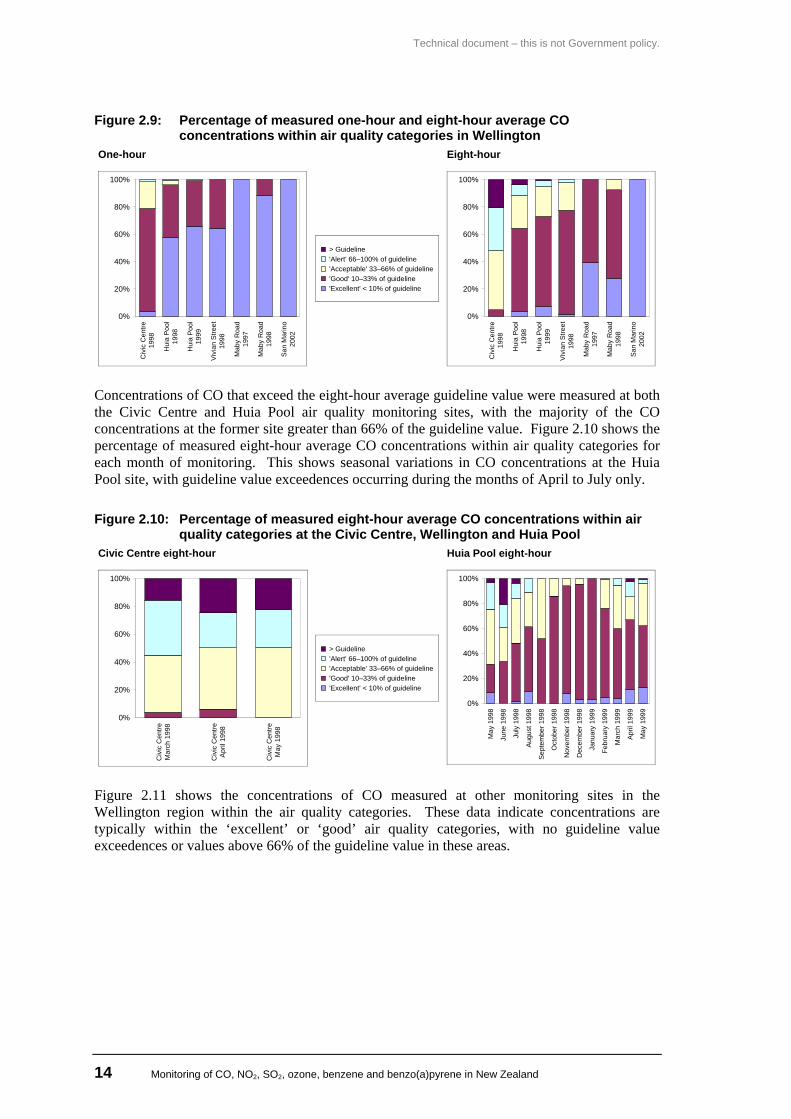
Figure 2.9: Percentage of measured one-hour and eight-hour average CO concentrations within air quality categories in Wellington
One-hour Eight-hour
0%
20%
40%
60%
80%
100%
Civ
ic C
entre
1998
Hui
a P
ool
1998
Hui
a P
ool
1999
Vivi
an S
treet
1998
Mab
y R
oad
1997
Mab
y R
oad
1998
San
Mar
ino
2002
> Guideline 'Alert' 66–100% of guideline 'Acceptable' 33–66% of guideline 'Good' 10–33% of guideline 'Excellent' < 10% of guideline
0%
20%
40%
60%
80%
100%
Civ
ic C
entre
1998
Hui
a P
ool
1998
Hui
a P
ool
1999
Vivi
an S
treet
1998
Mab
y R
oad
1997
Mab
y R
oad
1998
San
Mar
ino
2002
Concentrations of CO that exceed the eight-hour average guideline value were measured at both the Civic Centre and Huia Pool air quality monitoring sites, with the majority of the CO concentrations at the former site greater than 66% of the guideline value. Figure 2.10 shows the percentage of measured eight-hour average CO concentrations within air quality categories for each month of monitoring. This shows seasonal variations in CO concentrations at the Huia Pool site, with guideline value exceedences occurring during the months of April to July only.
Figure 2.10: Percentage of measured eight-hour average CO concentrations within air quality categories at the Civic Centre, Wellington and Huia Pool
Civic Centre eight-hour Huia Pool eight-hour
0%
20%
40%
60%
80%
100%
Civ
ic C
entre
Mar
ch 1
998
Civ
ic C
entre
April
199
8
Civ
ic C
entre
May
199
8
> Guideline 'Alert' 66–100% of guideline 'Acceptable' 33–66% of guideline 'Good' 10–33% of guideline 'Excellent' < 10% of guideline
0%
20%
40%
60%
80%
100%
May
199
8
June
199
8
July
199
8
Augu
st 1
998
Sept
embe
r 199
8
Oct
ober
199
8
Nov
embe
r 199
8
Dec
embe
r 199
8
Janu
ary
1999
Febr
uary
199
9
Mar
ch 1
999
April
199
9
May
199
9
Figure 2.11 shows the concentrations of CO measured at other monitoring sites in the Wellington region within the air quality categories. These data indicate concentrations are typically within the ‘excellent’ or ‘good’ air quality categories, with no guideline value exceedences or values above 66% of the guideline value in these areas.
Technical report – this is not Government policy.
Monitoring of CO, NO2, SO2, ozone, benzene and benzo(a)pyrene in New Zealand 15
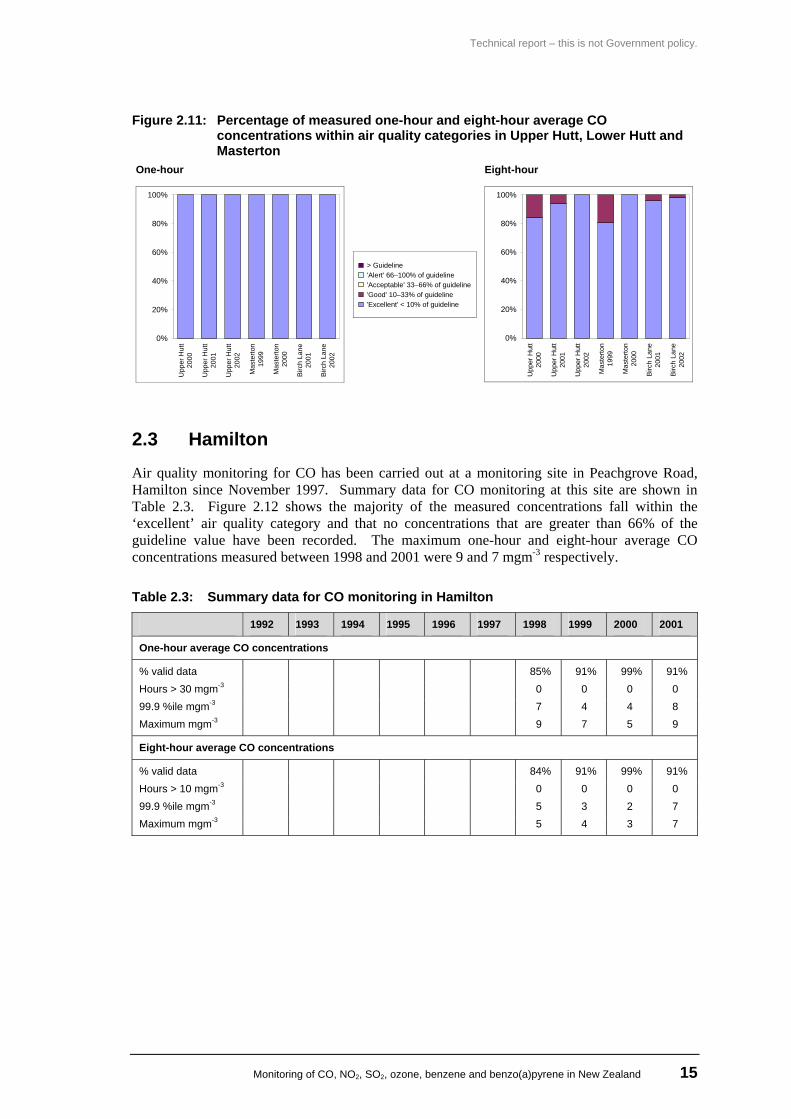
Figure 2.11: Percentage of measured one-hour and eight-hour average CO concentrations within air quality categories in Upper Hutt, Lower Hutt and Masterton
One-hour Eight-hour
0%
20%
40%
60%
80%
100%
Upp
er H
utt
2000
Upp
er H
utt
2001
Upp
er H
utt
2002
Mas
terto
n19
99
Mas
terto
n20
00
Birc
h La
ne20
01
Birc
h La
ne20
02
> Guideline 'Alert' 66–100% of guideline 'Acceptable' 33–66% of guideline 'Good' 10–33% of guideline 'Excellent' < 10% of guideline
0%
20%
40%
60%
80%
100%
Upp
er H
utt
2000
Upp
er H
utt
2001
Upp
er H
utt
2002
Mas
terto
n19
99
Mas
terto
n20
00
Birc
h La
ne20
01
Birc
h La
ne20
02
2.3 Hamilton Air quality monitoring for CO has been carried out at a monitoring site in Peachgrove Road, Hamilton since November 1997. Summary data for CO monitoring at this site are shown in Table 2.3. Figure 2.12 shows the majority of the measured concentrations fall within the ‘excellent’ air quality category and that no concentrations that are greater than 66% of the guideline value have been recorded. The maximum one-hour and eight-hour average CO concentrations measured between 1998 and 2001 were 9 and 7 mgm-3 respectively.
Table 2.3: Summary data for CO monitoring in Hamilton
1992 1993 1994 1995 1996 1997 1998 1999 2000 2001
One-hour average CO concentrations
% valid data 85% 91% 99% 91% Hours > 30 mgm-3 0 0 0 0 99.9 %ile mgm-3 7 4 4 8 Maximum mgm-3 9 7 5 9
Eight-hour average CO concentrations
% valid data 84% 91% 99% 91% Hours > 10 mgm-3 0 0 0 0 99.9 %ile mgm-3 5 3 2 7 Maximum mgm-3 5 4 3 7
Technical document – this is not Government policy.
16 Monitoring of CO, NO2, SO2, ozone, benzene and benzo(a)pyrene in New Zealand
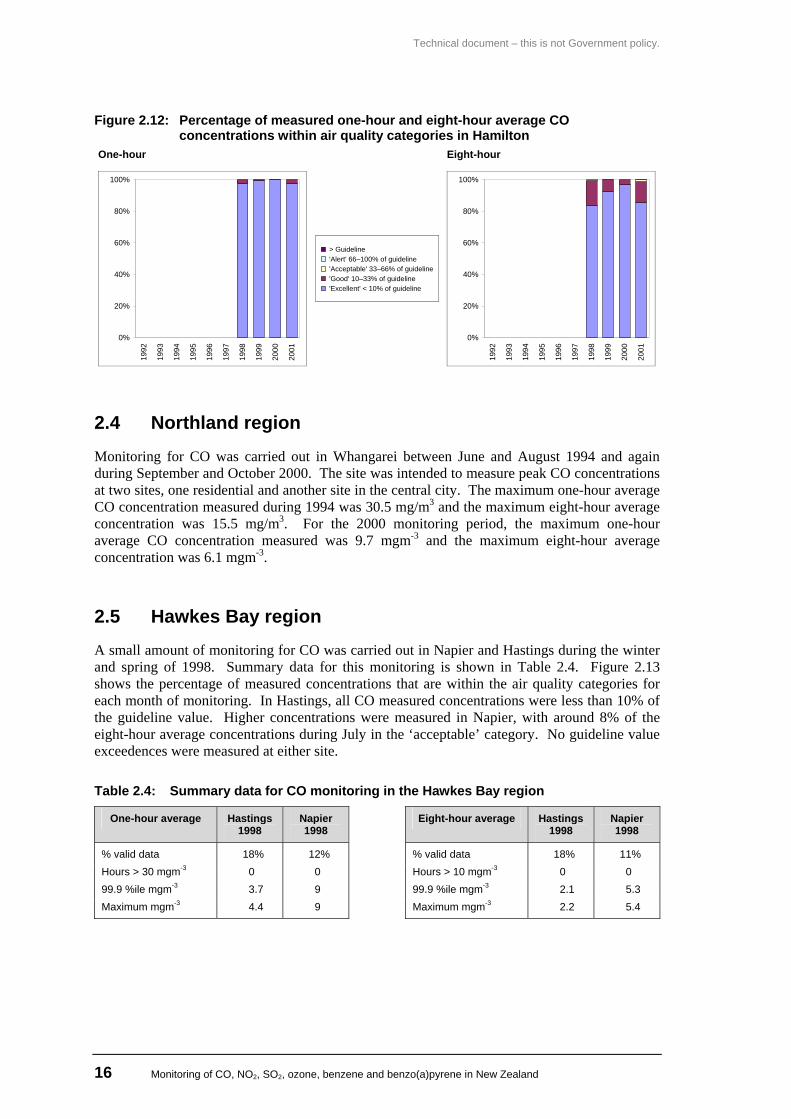
Figure 2.12: Percentage of measured one-hour and eight-hour average CO concentrations within air quality categories in Hamilton
One-hour Eight-hour
0%
20%
40%
60%
80%
100%
1992
1993
1994
1995
1996
1997
1998
1999
2000
2001
> Guideline 'Alert' 66–100% of guideline 'Acceptable' 33–66% of guideline 'Good' 10–33% of guideline 'Excellent' < 10% of guideline
0%
20%
40%
60%
80%
100%
1992
1993
1994
1995
1996
1997
1998
1999
2000
2001
2.4 Northland region
Monitoring for CO was carried out in Whangarei between June and August 1994 and again during September and October 2000. The site was intended to measure peak CO concentrations at two sites, one residential and another site in the central city. The maximum one-hour average CO concentration measured during 1994 was 30.5 mg/m3 and the maximum eight-hour average concentration was 15.5 mg/m3. For the 2000 monitoring period, the maximum one-hour average CO concentration measured was 9.7 mgm-3 and the maximum eight-hour average concentration was 6.1 mgm-3.
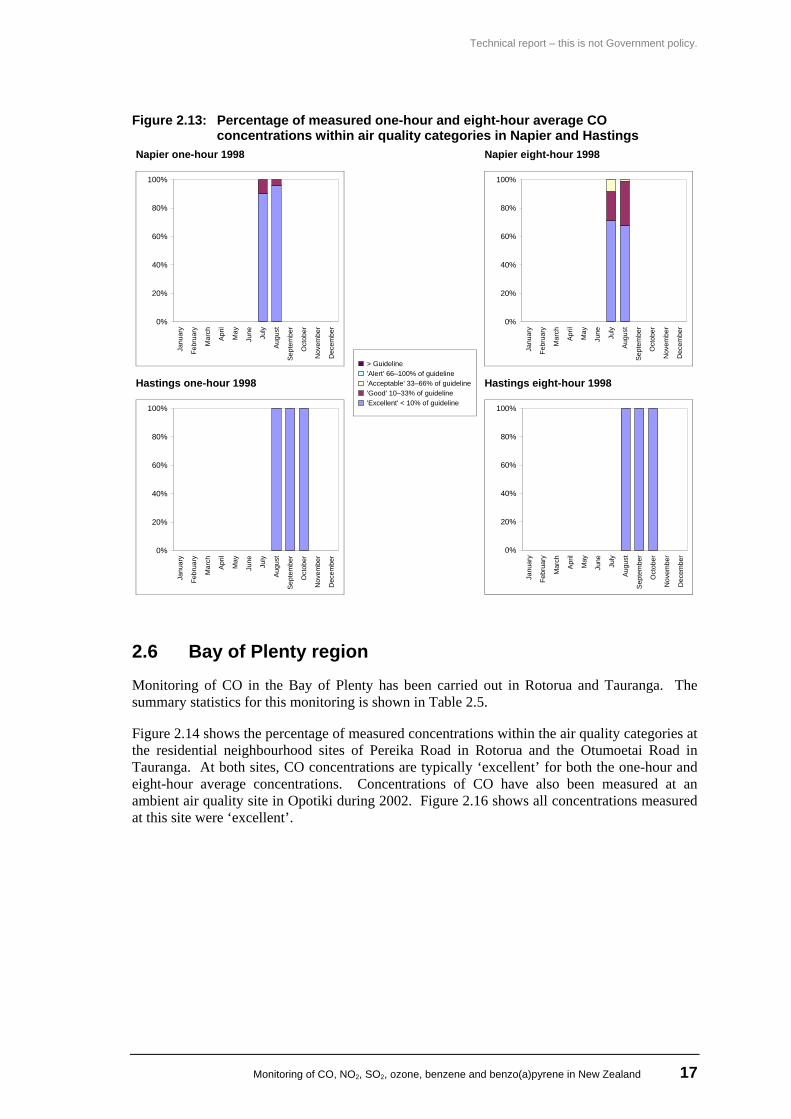
2.5 Hawkes Bay region A small amount of monitoring for CO was carried out in Napier and Hastings during the winter and spring of 1998. Summary data for this monitoring is shown in Table 2.4. Figure 2.13 shows the percentage of measured concentrations that are within the air quality categories for each month of monitoring. In Hastings, all CO measured concentrations were less than 10% of the guideline value. Higher concentrations were measured in Napier, with around 8% of the eight-hour average concentrations during July in the ‘acceptable’ category. No guideline value exceedences were measured at either site.
Table 2.4: Summary data for CO monitoring in the Hawkes Bay region
One-hour average Hastings 1998
Napier 1998
Eight-hour average Hastings 1998
Napier 1998
% valid data 18% 12% % valid data 18% 11% Hours > 30 mgm-3 0 0 Hours > 10 mgm-3 0 0 99.9 %ile mgm-3 3.7 9 99.9 %ile mgm-3 2.1 5.3 Maximum mgm-3 4.4 9 Maximum mgm-3 2.2 5.4
Technical report – this is not Government policy.
Monitoring of CO, NO2, SO2, ozone, benzene and benzo(a)pyrene in New Zealand 17
Figure 2.13: Percentage of measured one-hour and eight-hour average CO concentrations within air quality categories in Napier and Hastings
Napier one-hour 1998 Napier eight-hour 1998
0%
20%
40%
60%
80%
100%Ja
nuar
y
Febr
uary
Mar
ch
Apr
il
May
June
July
Aug
ust
Sept
embe
r
Oct
ober
Nov
embe
r
Dec
embe
r0%
20%
40%
60%
80%
100%
Janu
ary
Febr
uary
Mar
ch
Apr
il
May
June
July
Aug
ust
Sept
embe
r
Oct
ober
Nov
embe
r
Dec
embe
r
Hastings one-hour 1998 Hastings eight-hour 1998
0%
20%
40%
60%
80%
100%
Janu
ary
Febr
uary
Mar
ch
Apr
il
May
June
July
Aug
ust
Sept
embe
r
Oct
ober
Nov
embe
r
Dec
embe
r
> Guideline 'Alert' 66–100% of guideline 'Acceptable' 33–66% of guideline 'Good' 10–33% of guideline 'Excellent' < 10% of guideline
0%
20%
40%
60%
80%
100%
Janu
ary
Febr
uary
Mar
ch
Apr
il
May
June July
Aug
ust
Sep
tem
ber
Oct
ober
Nov
embe
r
Dec
embe
r
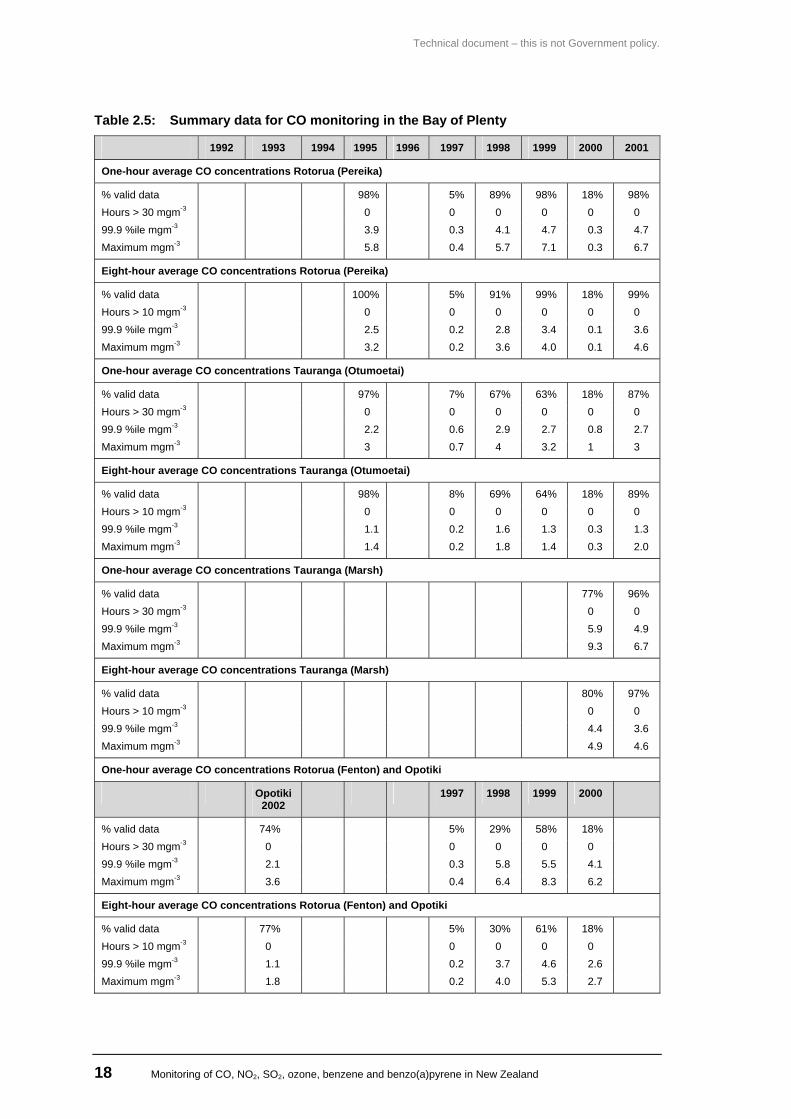
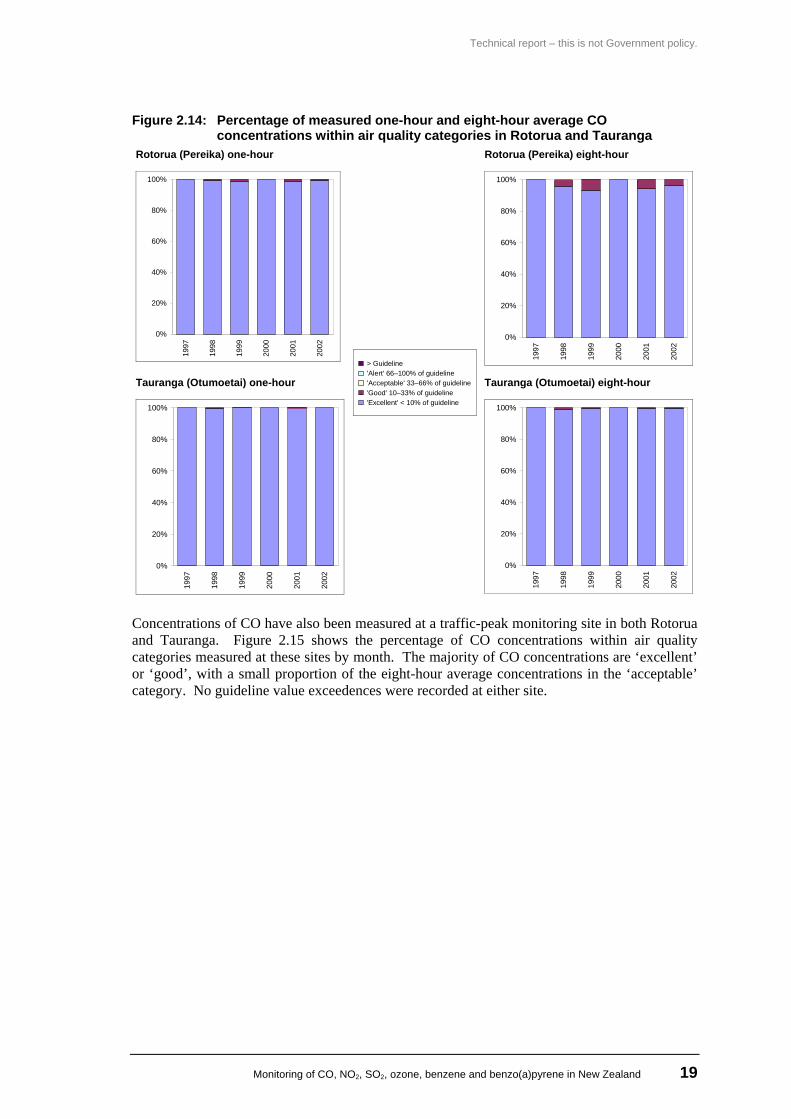
2.6 Bay of Plenty region Monitoring of CO in the Bay of Plenty has been carried out in Rotorua and Tauranga. The summary statistics for this monitoring is shown in Table 2.5.
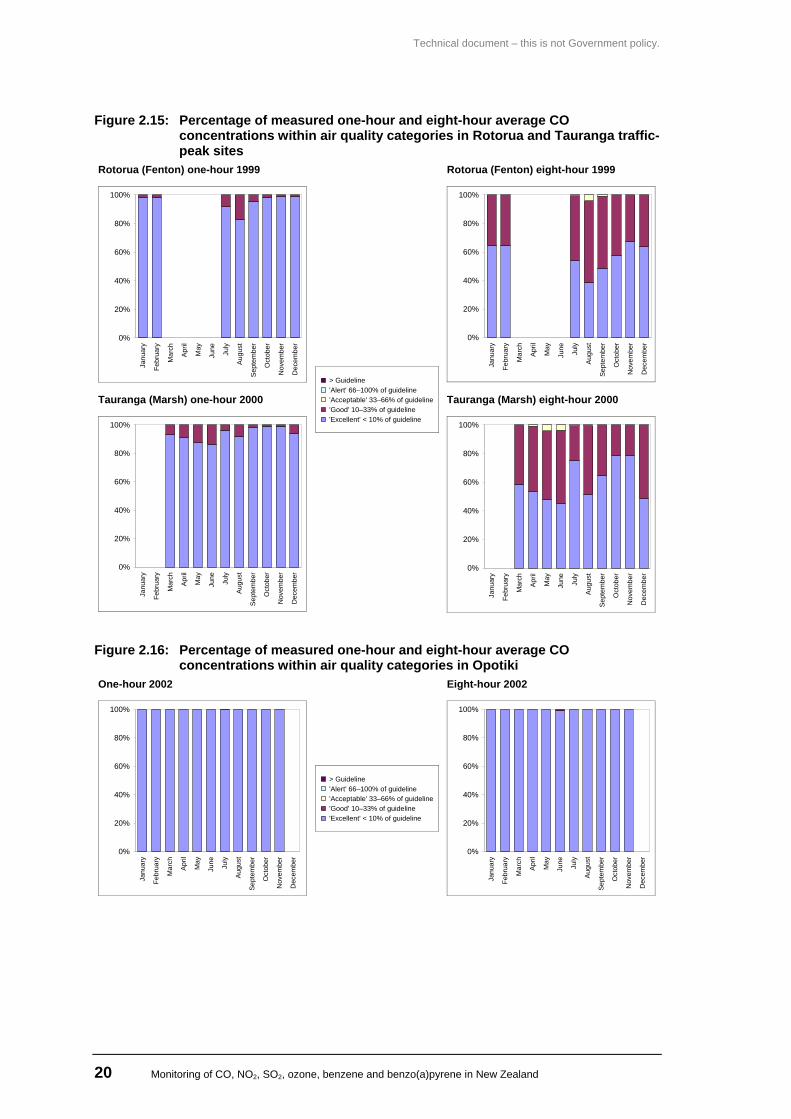
Figure 2.14 shows the percentage of measured concentrations within the air quality categories at the residential neighbourhood sites of Pereika Road in Rotorua and the Otumoetai Road in Tauranga. At both sites, CO concentrations are typically ‘excellent’ for both the one-hour and eight-hour average concentrations. Concentrations of CO have also been measured at an ambient air quality site in Opotiki during 2002. Figure 2.16 shows all concentrations measured at this site were ‘excellent’.
Technical document – this is not Government policy.
18 Monitoring of CO, NO2, SO2, ozone, benzene and benzo(a)pyrene in New Zealand
Table 2.5: Summary data for CO monitoring in the Bay of Plenty
1992 1993 1994 1995 1996 1997 1998 1999 2000 2001
One-hour average CO concentrations Rotorua (Pereika)
% valid data 98% 5% 89% 98% 18% 98% Hours > 30 mgm-3 0 0 0 0 0 0 99.9 %ile mgm-3 3.9 0.3 4.1 4.7 0.3 4.7 Maximum mgm-3 5.8 0.4 5.7 7.1 0.3 6.7
Eight-hour average CO concentrations Rotorua (Pereika)
% valid data 100% 5% 91% 99% 18% 99% Hours > 10 mgm-3 0 0 0 0 0 0 99.9 %ile mgm-3 2.5 0.2 2.8 3.4 0.1 3.6 Maximum mgm-3 3.2 0.2 3.6 4.0 0.1 4.6
One-hour average CO concentrations Tauranga (Otumoetai)
% valid data 97% 7% 67% 63% 18% 87% Hours > 30 mgm-3 0 0 0 0 0 0 99.9 %ile mgm-3 2.2 0.6 2.9 2.7 0.8 2.7 Maximum mgm-3 3 0.7 4 3.2 1 3
Eight-hour average CO concentrations Tauranga (Otumoetai)
% valid data 98% 8% 69% 64% 18% 89% Hours > 10 mgm-3 0 0 0 0 0 0 99.9 %ile mgm-3 1.1 0.2 1.6 1.3 0.3 1.3 Maximum mgm-3 1.4 0.2 1.8 1.4 0.3 2.0
One-hour average CO concentrations Tauranga (Marsh)
% valid data 77% 96% Hours > 30 mgm-3 0 0 99.9 %ile mgm-3 5.9 4.9 Maximum mgm-3 9.3 6.7
Eight-hour average CO concentrations Tauranga (Marsh)
% valid data 80% 97% Hours > 10 mgm-3 0 0 99.9 %ile mgm-3 4.4 3.6 Maximum mgm-3 4.9 4.6
One-hour average CO concentrations Rotorua (Fenton) and Opotiki
Opotiki 2002
1997 1998 1999 2000
% valid data 74% 5% 29% 58% 18% Hours > 30 mgm-3 0 0 0 0 0 99.9 %ile mgm-3 2.1 0.3 5.8 5.5 4.1 Maximum mgm-3 3.6 0.4 6.4 8.3 6.2
Eight-hour average CO concentrations Rotorua (Fenton) and Opotiki
% valid data 77% 5% 30% 61% 18% Hours > 10 mgm-3 0 0 0 0 0 99.9 %ile mgm-3 1.1 0.2 3.7 4.6 2.6 Maximum mgm-3 1.8 0.2 4.0 5.3 2.7
Technical report – this is not Government policy.
Monitoring of CO, NO2, SO2, ozone, benzene and benzo(a)pyrene in New Zealand 19
Figure 2.14: Percentage of measured one-hour and eight-hour average CO concentrations within air quality categories in Rotorua and Tauranga
Rotorua (Pereika) one-hour Rotorua (Pereika) eight-hour
0%
20%
40%
60%
80%
100%19
97
1998
1999
2000
2001
2002
0%
20%
40%
60%
80%
100%
1997
1998
1999
2000
2001
2002
Tauranga (Otumoetai) one-hour Tauranga (Otumoetai) eight-hour
0%
20%
40%
60%
80%
100%
1997
1998
1999
2000
2001
2002
> Guideline 'Alert' 66–100% of guideline 'Acceptable' 33–66% of guideline 'Good' 10–33% of guideline 'Excellent' < 10% of guideline
0%
20%
40%
60%
80%
100%
1997
1998
1999
2000
2001
2002
Concentrations of CO have also been measured at a traffic-peak monitoring site in both Rotorua and Tauranga. Figure 2.15 shows the percentage of CO concentrations within air quality categories measured at these sites by month. The majority of CO concentrations are ‘excellent’ or ‘good’, with a small proportion of the eight-hour average concentrations in the ‘acceptable’ category. No guideline value exceedences were recorded at either site.
Technical document – this is not Government policy.
20 Monitoring of CO, NO2, SO2, ozone, benzene and benzo(a)pyrene in New Zealand
Figure 2.15: Percentage of measured one-hour and eight-hour average CO concentrations within air quality categories in Rotorua and Tauranga traffic-peak sites
Rotorua (Fenton) one-hour 1999 Rotorua (Fenton) eight-hour 1999
0%
20%
40%
60%
80%
100%
Janu
ary
Febr
uary
Mar
ch
Apr
il
May
June
July
Augu
st
Sept
embe
r
Oct
ober
Nov
embe
r
Dec
embe
r
0%
20%
40%
60%
80%
100%
Janu
ary
Febr
uary
Mar
ch
Apr
il
May
June
July
Aug
ust
Sep
tem
ber
Oct
ober
Nov
embe
r
Dec
embe
r
Tauranga (Marsh) one-hour 2000 Tauranga (Marsh) eight-hour 2000
0%
20%
40%
60%
80%
100%
Janu
ary
Febr
uary
Mar
ch
Apr
il
May
June
July
Aug
ust
Sept
embe
r
Oct
ober
Nov
embe
r
Dec
embe
r
> Guideline 'Alert' 66–100% of guideline 'Acceptable' 33–66% of guideline 'Good' 10–33% of guideline 'Excellent' < 10% of guideline
0%
20%
40%
60%
80%
100%
Janu
ary
Febr
uary
Mar
ch
Apr
il
May
June
July
Aug
ust
Sep
tem
ber
Oct
ober
Nov
embe
r
Dec
embe
rFigure 2.16: Percentage of measured one-hour and eight-hour average CO
concentrations within air quality categories in Opotiki One-hour 2002 Eight-hour 2002
0%
20%
40%
60%
80%
100%
Janu
ary
Febr
uary
Mar
ch
Apr
il
May
June
July
Aug
ust
Sept
embe
r
Oct
ober
Nov
embe
r
Dec
embe
r
> Guideline 'Alert' 66–100% of guideline 'Acceptable' 33–66% of guideline 'Good' 10–33% of guideline 'Excellent' < 10% of guideline
0%
20%
40%
60%
80%
100%
Janu
ary
Febr
uary
Mar
ch
Apr
il
May
June
July
Aug
ust
Sept
embe
r
Oct
ober
Nov
embe
r
Dec
embe
r
Technical report – this is not Government policy.
Monitoring of CO, NO2, SO2, ozone, benzene and benzo(a)pyrene in New Zealand 21
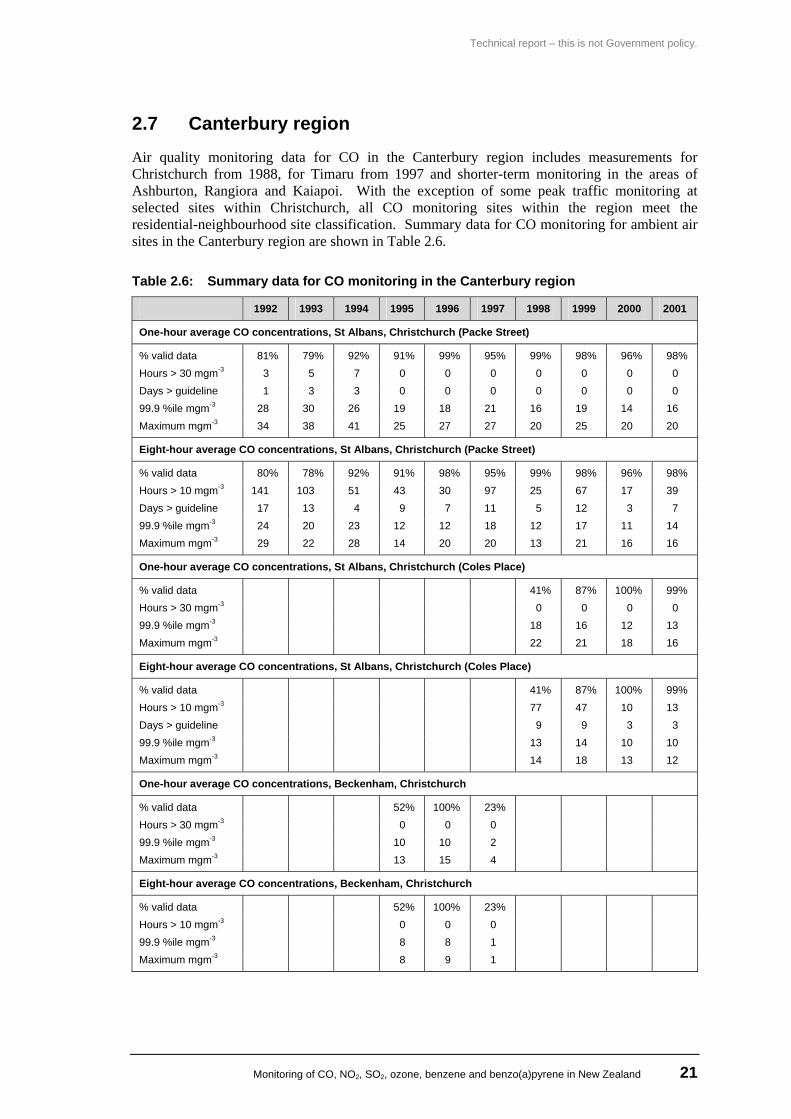
2.7 Canterbury region Air quality monitoring data for CO in the Canterbury region includes measurements for Christchurch from 1988, for Timaru from 1997 and shorter-term monitoring in the areas of Ashburton, Rangiora and Kaiapoi. With the exception of some peak traffic monitoring at selected sites within Christchurch, all CO monitoring sites within the region meet the residential-neighbourhood site classification. Summary data for CO monitoring for ambient air sites in the Canterbury region are shown in Table 2.6.
Table 2.6: Summary data for CO monitoring in the Canterbury region
1992 1993 1994 1995 1996 1997 1998 1999 2000 2001
One-hour average CO concentrations, St Albans, Christchurch (Packe Street)
% valid data 81% 79% 92% 91% 99% 95% 99% 98% 96% 98% Hours > 30 mgm-3 3 5 7 0 0 0 0 0 0 0 Days > guideline 1 3 3 0 0 0 0 0 0 0 99.9 %ile mgm-3 28 30 26 19 18 21 16 19 14 16 Maximum mgm-3 34 38 41 25 27 27 20 25 20 20
Eight-hour average CO concentrations, St Albans, Christchurch (Packe Street)
% valid data 80% 78% 92% 91% 98% 95% 99% 98% 96% 98% Hours > 10 mgm-3 141 103 51 43 30 97 25 67 17 39 Days > guideline 17 13 4 9 7 11 5 12 3 7 99.9 %ile mgm-3 24 20 23 12 12 18 12 17 11 14 Maximum mgm-3 29 22 28 14 20 20 13 21 16 16
One-hour average CO concentrations, St Albans, Christchurch (Coles Place)
% valid data 41% 87% 100% 99% Hours > 30 mgm-3 0 0 0 0 99.9 %ile mgm-3 18 16 12 13 Maximum mgm-3 22 21 18 16
Eight-hour average CO concentrations, St Albans, Christchurch (Coles Place)
% valid data 41% 87% 100% 99% Hours > 10 mgm-3 77 47 10 13 Days > guideline 9 9 3 3 99.9 %ile mgm-3 13 14 10 10 Maximum mgm-3 14 18 13 12
One-hour average CO concentrations, Beckenham, Christchurch
% valid data 52% 100% 23% Hours > 30 mgm-3 0 0 0 99.9 %ile mgm-3 10 10 2 Maximum mgm-3 13 15 4
Eight-hour average CO concentrations, Beckenham, Christchurch
% valid data 52% 100% 23% Hours > 10 mgm-3 0 0 0 99.9 %ile mgm-3 8 8 1 Maximum mgm-3 8 9 1
Technical document – this is not Government policy.
22 Monitoring of CO, NO2, SO2, ozone, benzene and benzo(a)pyrene in New Zealand
1992 1993 1994 1995 1996 1997 1998 1999 2000 2001
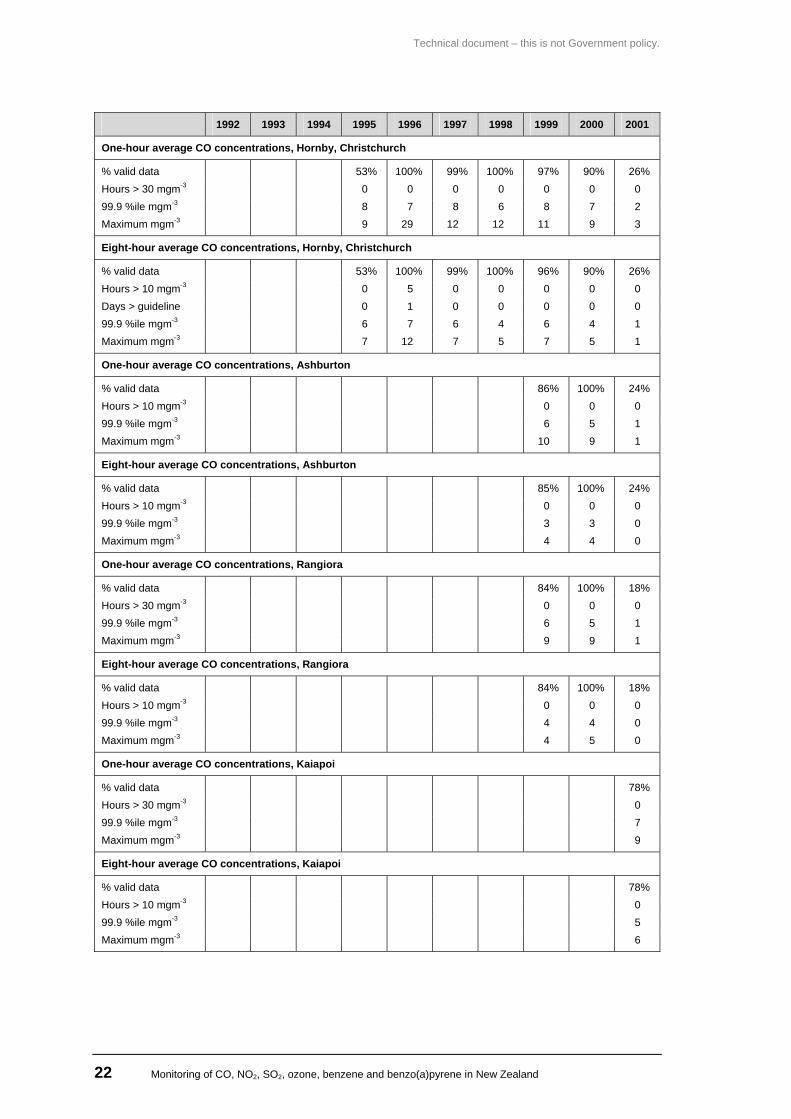
One-hour average CO concentrations, Hornby, Christchurch
% valid data 53% 100% 99% 100% 97% 90% 26% Hours > 30 mgm-3 0 0 0 0 0 0 0 99.9 %ile mgm-3 8 7 8 6 8 7 2 Maximum mgm-3 9 29 12 12 11 9 3
Eight-hour average CO concentrations, Hornby, Christchurch
% valid data 53% 100% 99% 100% 96% 90% 26% Hours > 10 mgm-3 0 5 0 0 0 0 0 Days > guideline 0 1 0 0 0 0 0 99.9 %ile mgm-3 6 7 6 4 6 4 1 Maximum mgm-3 7 12 7 5 7 5 1
One-hour average CO concentrations, Ashburton
% valid data 86% 100% 24% Hours > 10 mgm-3 0 0 0 99.9 %ile mgm-3 6 5 1 Maximum mgm-3 10 9 1
Eight-hour average CO concentrations, Ashburton
% valid data 85% 100% 24% Hours > 10 mgm-3 0 0 0 99.9 %ile mgm-3 3 3 0 Maximum mgm-3 4 4 0
One-hour average CO concentrations, Rangiora
% valid data 84% 100% 18% Hours > 30 mgm-3 0 0 0 99.9 %ile mgm-3 6 5 1 Maximum mgm-3 9 9 1
Eight-hour average CO concentrations, Rangiora
% valid data 84% 100% 18% Hours > 10 mgm-3 0 0 0 99.9 %ile mgm-3 4 4 0 Maximum mgm-3 4 5 0
One-hour average CO concentrations, Kaiapoi
% valid data 78% Hours > 30 mgm-3 0 99.9 %ile mgm-3 7 Maximum mgm-3 9
Eight-hour average CO concentrations, Kaiapoi
% valid data 78% Hours > 10 mgm-3 0 99.9 %ile mgm-3 5 Maximum mgm-3 6
Technical report – this is not Government policy.
Monitoring of CO, NO2, SO2, ozone, benzene and benzo(a)pyrene in New Zealand 23
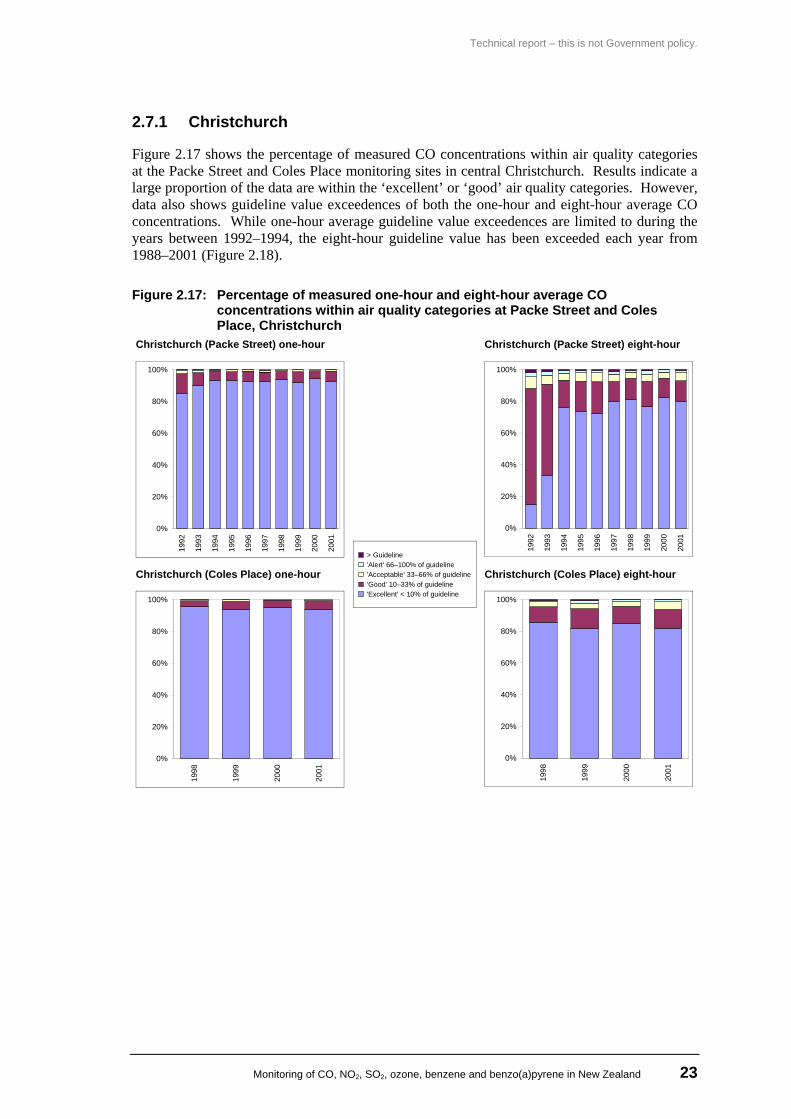
2.7.1 Christchurch
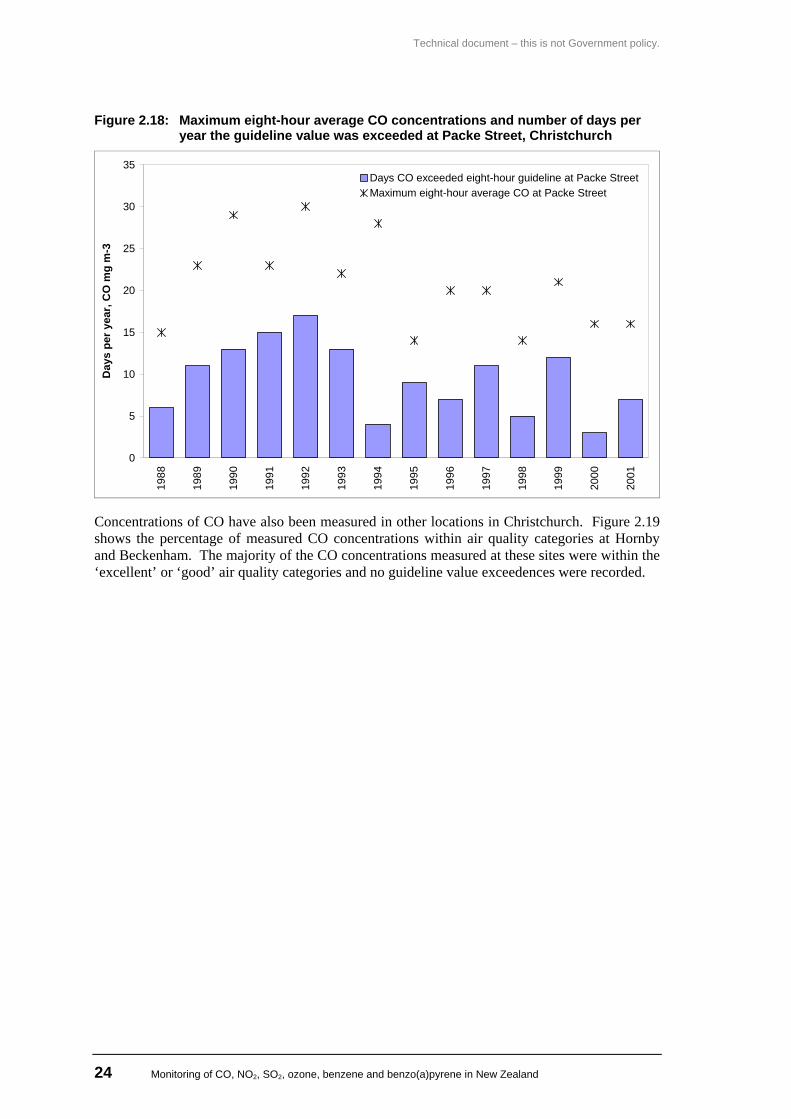
Figure 2.17 shows the percentage of measured CO concentrations within air quality categories at the Packe Street and Coles Place monitoring sites in central Christchurch. Results indicate a large proportion of the data are within the ‘excellent’ or ‘good’ air quality categories. However, data also shows guideline value exceedences of both the one-hour and eight-hour average CO concentrations. While one-hour average guideline value exceedences are limited to during the years between 1992–1994, the eight-hour guideline value has been exceeded each year from 1988–2001 (Figure 2.18).
Figure 2.17: Percentage of measured one-hour and eight-hour average CO concentrations within air quality categories at Packe Street and Coles Place, Christchurch
Christchurch (Packe Street) one-hour Christchurch (Packe Street) eight-hour
0%
20%
40%
60%
80%
100%
1992
1993
1994
1995
1996
1997
1998
1999
2000
2001
0%
20%
40%
60%
80%
100%
1992
1993
1994
1995
1996
1997
1998
1999
2000
2001
Christchurch (Coles Place) one-hour Christchurch (Coles Place) eight-hour
0%
20%
40%
60%
80%
100%
1998
1999
2000
2001
> Guideline 'Alert' 66–100% of guideline 'Acceptable' 33–66% of guideline 'Good' 10–33% of guideline 'Excellent' < 10% of guideline
0%
20%
40%
60%
80%
100%
1998
1999
2000
2001
Technical document – this is not Government policy.
24 Monitoring of CO, NO2, SO2, ozone, benzene and benzo(a)pyrene in New Zealand
Figure 2.18: Maximum eight-hour average CO concentrations and number of days per year the guideline value was exceeded at Packe Street, Christchurch
0
5
10
15
20
25
30
3519
88
1989
1990
1991
1992
1993
1994
1995
1996
1997
1998
1999
2000
2001
Day
s pe
r yea
r, C
O m
g m
-3
Days CO exceeded eight-hour guideline at Packe StreetMaximum eight-hour average CO at Packe Street
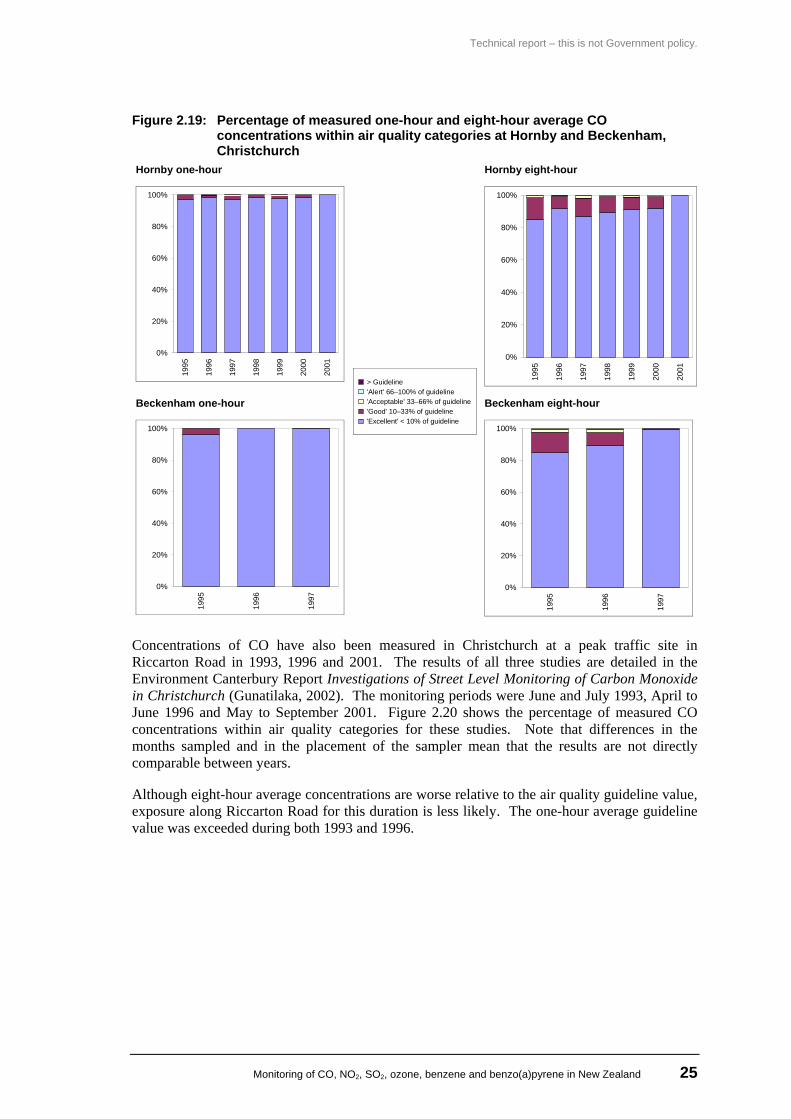
Concentrations of CO have also been measured in other locations in Christchurch. Figure 2.19 shows the percentage of measured CO concentrations within air quality categories at Hornby and Beckenham. The majority of the CO concentrations measured at these sites were within the ‘excellent’ or ‘good’ air quality categories and no guideline value exceedences were recorded.
Technical report – this is not Government policy.
Monitoring of CO, NO2, SO2, ozone, benzene and benzo(a)pyrene in New Zealand 25
Figure 2.19: Percentage of measured one-hour and eight-hour average CO concentrations within air quality categories at Hornby and Beckenham, Christchurch
Hornby one-hour Hornby eight-hour
0%
20%
40%
60%
80%
100%19
95
1996
1997
1998
1999
2000
2001
0%
20%
40%
60%
80%
100%
1995
1996
1997
1998
1999
2000
2001
Beckenham one-hour Beckenham eight-hour
0%
20%
40%
60%
80%
100%
1995
1996
1997
> Guideline 'Alert' 66–100% of guideline 'Acceptable' 33–66% of guideline 'Good' 10–33% of guideline 'Excellent' < 10% of guideline
0%
20%
40%
60%
80%
100%
1995
1996
1997
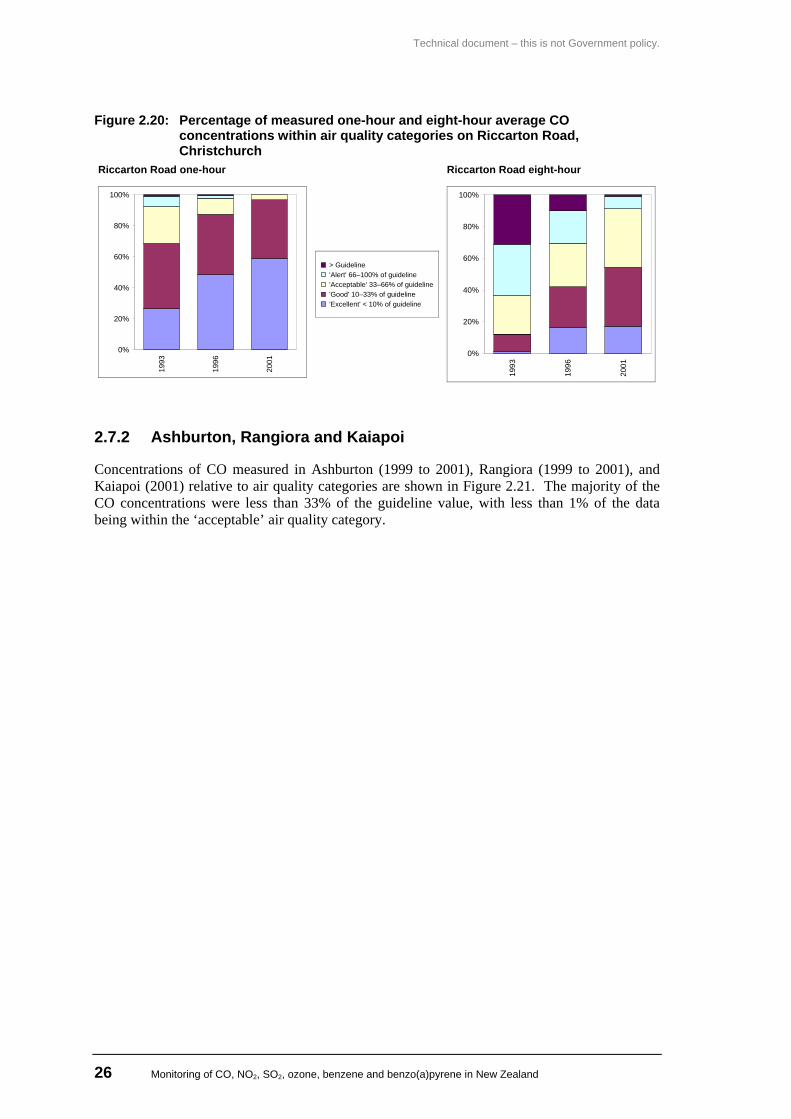
Concentrations of CO have also been measured in Christchurch at a peak traffic site in Riccarton Road in 1993, 1996 and 2001. The results of all three studies are detailed in the Environment Canterbury Report Investigations of Street Level Monitoring of Carbon Monoxide in Christchurch (Gunatilaka, 2002). The monitoring periods were June and July 1993, April to June 1996 and May to September 2001. Figure 2.20 shows the percentage of measured CO concentrations within air quality categories for these studies. Note that differences in the months sampled and in the placement of the sampler mean that the results are not directly comparable between years.
Although eight-hour average concentrations are worse relative to the air quality guideline value, exposure along Riccarton Road for this duration is less likely. The one-hour average guideline value was exceeded during both 1993 and 1996.
Technical document – this is not Government policy.
26 Monitoring of CO, NO2, SO2, ozone, benzene and benzo(a)pyrene in New Zealand
Figure 2.20: Percentage of measured one-hour and eight-hour average CO concentrations within air quality categories on Riccarton Road, Christchurch
Riccarton Road one-hour Riccarton Road eight-hour
0%
20%
40%
60%
80%
100%
1993
1996
2001
> Guideline 'Alert' 66–100% of guideline 'Acceptable' 33–66% of guideline 'Good' 10–33% of guideline 'Excellent' < 10% of guideline
0%
20%
40%
60%
80%
100%
1993
1996
2001
2.7.2 Ashburton, Rangiora and Kaiapoi
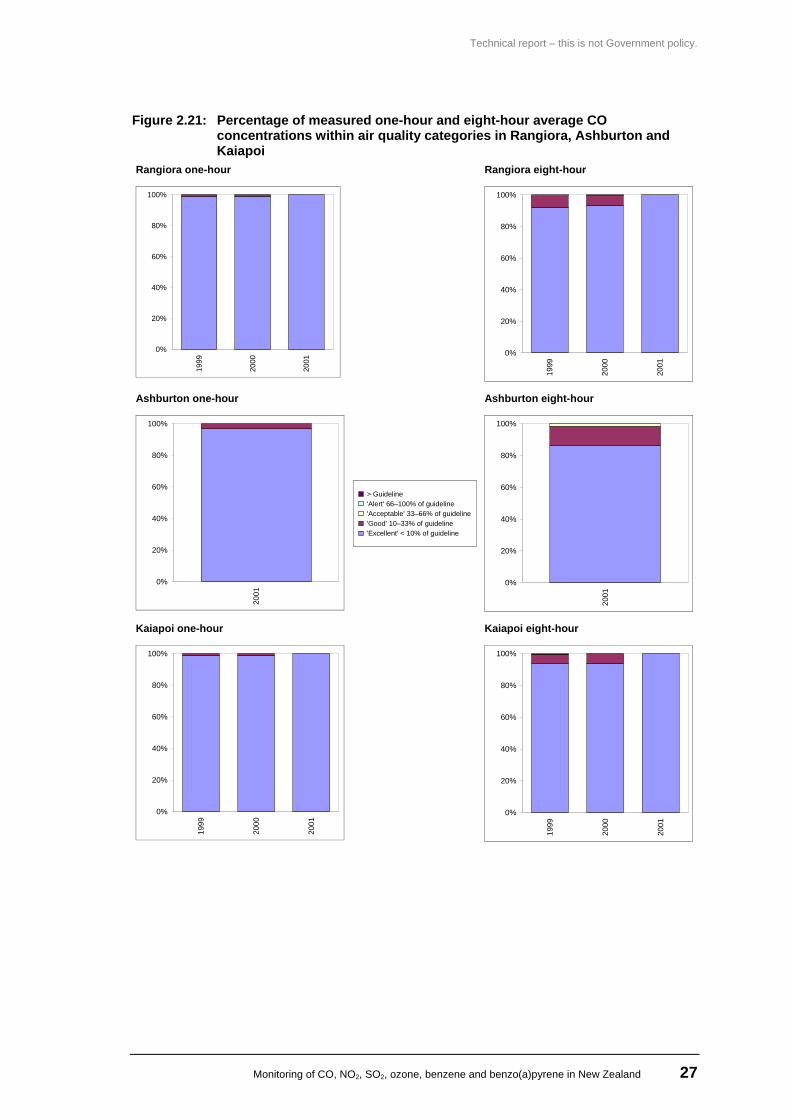
Concentrations of CO measured in Ashburton (1999 to 2001), Rangiora (1999 to 2001), and Kaiapoi (2001) relative to air quality categories are shown in Figure 2.21. The majority of the CO concentrations were less than 33% of the guideline value, with less than 1% of the data being within the ‘acceptable’ air quality category.
Technical report – this is not Government policy.
Monitoring of CO, NO2, SO2, ozone, benzene and benzo(a)pyrene in New Zealand 27
Figure 2.21: Percentage of measured one-hour and eight-hour average CO concentrations within air quality categories in Rangiora, Ashburton and Kaiapoi
Rangiora one-hour Rangiora eight-hour
0%
20%
40%
60%
80%
100%19
99
2000
2001
0%
20%
40%
60%
80%
100%
1999
2000
2001
Ashburton one-hour Ashburton eight-hour
0%
20%
40%
60%
80%
100%
2001
> Guideline 'Alert' 66–100% of guideline 'Acceptable' 33–66% of guideline 'Good' 10–33% of guideline 'Excellent' < 10% of guideline
0%
20%
40%
60%
80%
100%
2001
Kaiapoi one-hour Kaiapoi eight-hour
0%
20%
40%
60%
80%
100%
1999
2000
2001
0%
20%
40%
60%
80%
100%
1999
2000
2001
Technical document – this is not Government policy.
28 Monitoring of CO, NO2, SO2, ozone, benzene and benzo(a)pyrene in New Zealand
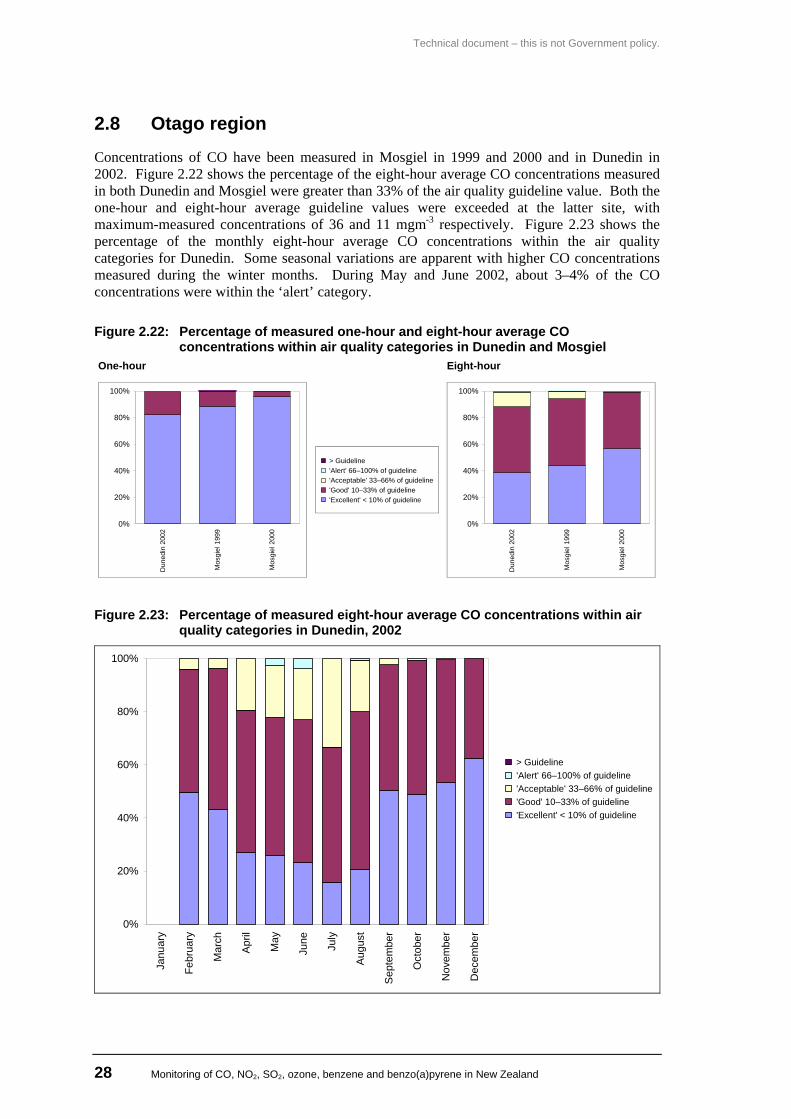
2.8 Otago region Concentrations of CO have been measured in Mosgiel in 1999 and 2000 and in Dunedin in 2002. Figure 2.22 shows the percentage of the eight-hour average CO concentrations measured in both Dunedin and Mosgiel were greater than 33% of the air quality guideline value. Both the one-hour and eight-hour average guideline values were exceeded at the latter site, with maximum-measured concentrations of 36 and 11 mgm-3 respectively. Figure 2.23 shows the percentage of the monthly eight-hour average CO concentrations within the air quality categories for Dunedin. Some seasonal variations are apparent with higher CO concentrations measured during the winter months. During May and June 2002, about 3–4% of the CO concentrations were within the ‘alert’ category.
Figure 2.22: Percentage of measured one-hour and eight-hour average CO concentrations within air quality categories in Dunedin and Mosgiel
One-hour Eight-hour
0%
20%
40%
60%
80%
100%
Dun
edin
200
2
Mos
giel
199
9
Mos
giel
200
0
> Guideline 'Alert' 66–100% of guideline 'Acceptable' 33–66% of guideline 'Good' 10–33% of guideline 'Excellent' < 10% of guideline
0%
20%
40%
60%
80%
100%
Dun
edin
200
2
Mos
giel
199
9
Mos
giel
200
0Figure 2.23: Percentage of measured eight-hour average CO concentrations within air
quality categories in Dunedin, 2002
0%
20%
40%
60%
80%
100%
Janu
ary
Febr
uary
Mar
ch
Apr
il
May
June July
Aug
ust
Sep
tem
ber
Oct
ober
Nov
embe
r
Dec
embe
r
> Guideline 'Alert' 66–100% of guideline 'Acceptable' 33–66% of guideline 'Good' 10–33% of guideline 'Excellent' < 10% of guideline
Technical report – this is not Government policy.
Monitoring of CO, NO2, SO2, ozone, benzene and benzo(a)pyrene in New Zealand 29
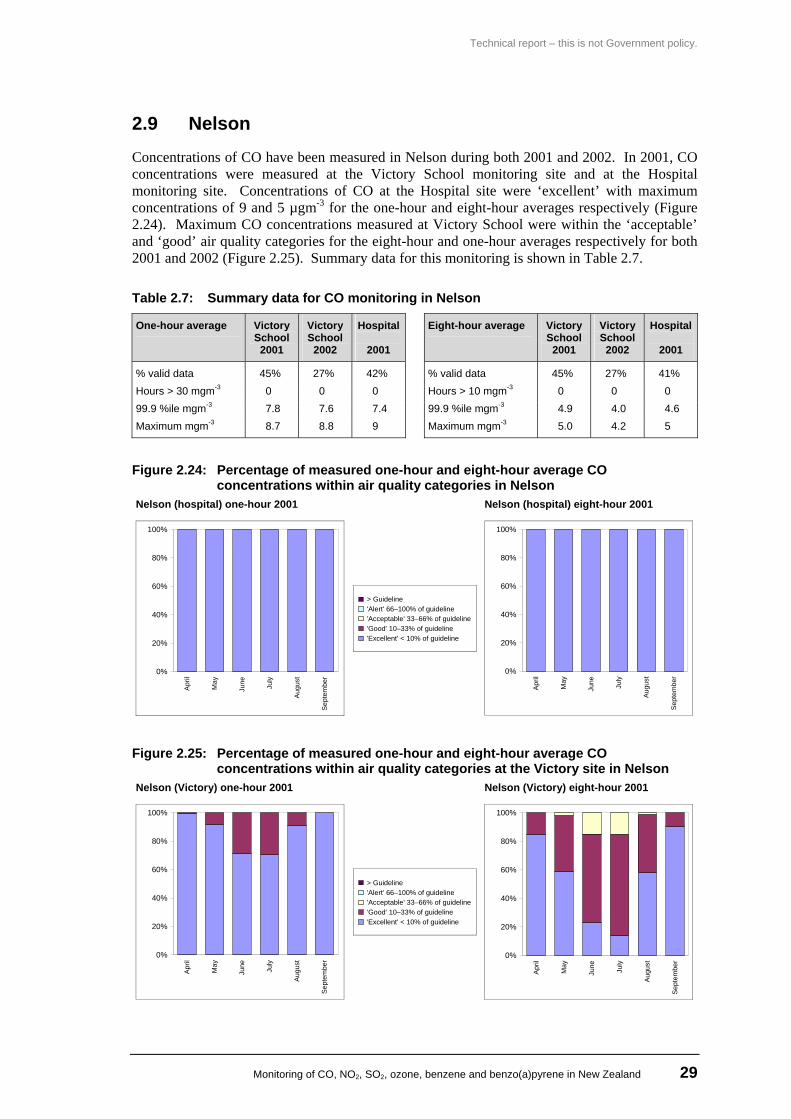
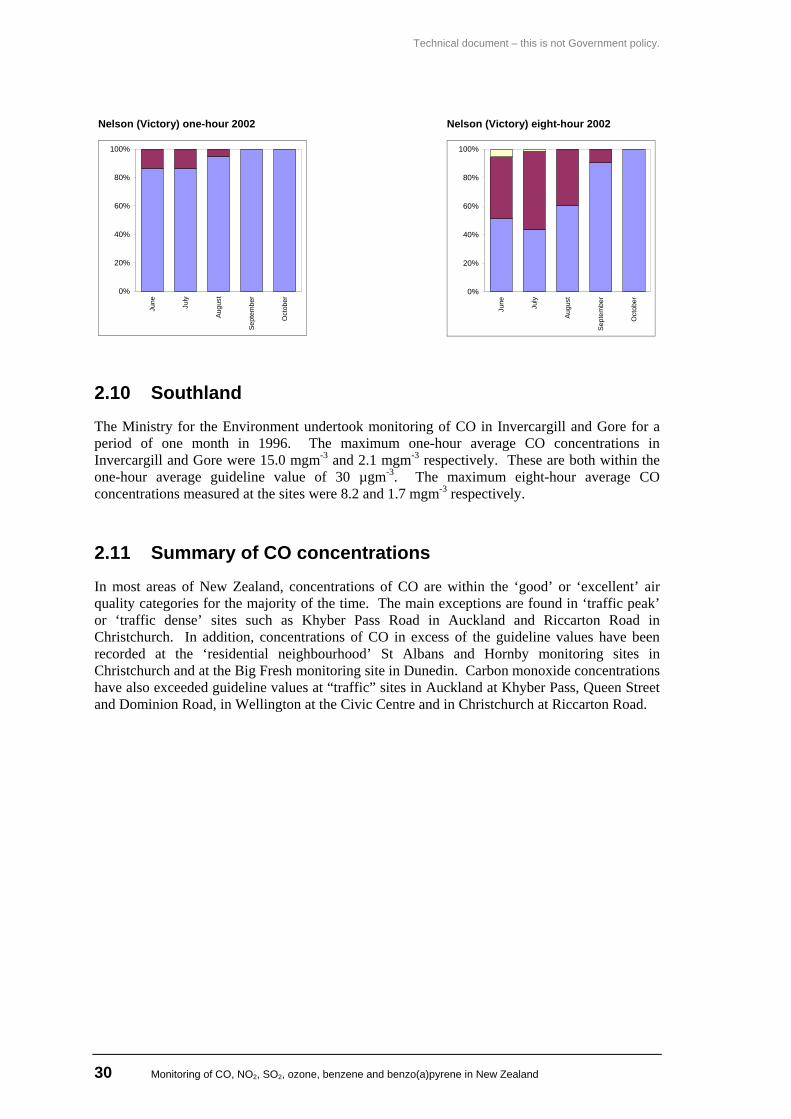
2.9 Nelson Concentrations of CO have been measured in Nelson during both 2001 and 2002. In 2001, CO concentrations were measured at the Victory School monitoring site and at the Hospital monitoring site. Concentrations of CO at the Hospital site were ‘excellent’ with maximum concentrations of 9 and 5 µgm-3 for the one-hour and eight-hour averages respectively (Figure 2.24). Maximum CO concentrations measured at Victory School were within the ‘acceptable’ and ‘good’ air quality categories for the eight-hour and one-hour averages respectively for both 2001 and 2002 (Figure 2.25). Summary data for this monitoring is shown in Table 2.7.
Table 2.7: Summary data for CO monitoring in Nelson
One-hour average Victory School
2001
Victory School
2002
Hospital
2001
Eight-hour average Victory School
2001
Victory School
2002
Hospital
2001
% valid data 45% 27% 42% % valid data 45% 27% 41% Hours > 30 mgm-3 0 0 0 Hours > 10 mgm-3 0 0 0 99.9 %ile mgm-3 7.8 7.6 7.4 99.9 %ile mgm-3 4.9 4.0 4.6 Maximum mgm-3 8.7 8.8 9 Maximum mgm-3 5.0 4.2 5
Figure 2.24: Percentage of measured one-hour and eight-hour average CO concentrations within air quality categories in Nelson
Nelson (hospital) one-hour 2001 Nelson (hospital) eight-hour 2001
0%
20%
40%
60%
80%
100%
Apr
il
May
June
July
Aug
ust
Sept
embe
r
> Guideline 'Alert' 66–100% of guideline 'Acceptable' 33–66% of guideline 'Good' 10–33% of guideline 'Excellent' < 10% of guideline
0%
20%
40%
60%
80%
100%A
pril
May
June July
Aug
ust
Sep
tem
ber
Figure 2.25: Percentage of measured one-hour and eight-hour average CO concentrations within air quality categories at the Victory site in Nelson
Nelson (Victory) one-hour 2001 Nelson (Victory) eight-hour 2001
0%
20%
40%
60%
80%
100%
Apr
il
May
June
July
Aug
ust
Sept
embe
r
> Guideline 'Alert' 66–100% of guideline 'Acceptable' 33–66% of guideline 'Good' 10–33% of guideline 'Excellent' < 10% of guideline
0%
20%
40%
60%
80%
100%
Apr
il
May
June
July
Aug
ust
Sep
tem
ber
Technical document – this is not Government policy.
30 Monitoring of CO, NO2, SO2, ozone, benzene and benzo(a)pyrene in New Zealand
Nelson (Victory) one-hour 2002 Nelson (Victory) eight-hour 2002
0%
20%
40%
60%
80%
100%Ju
ne
July
Aug
ust
Sept
embe
r
Oct
ober
0%
20%
40%
60%
80%
100%
June
July
Aug
ust
Sep
tem
ber
Oct
ober
2.10 Southland The Ministry for the Environment undertook monitoring of CO in Invercargill and Gore for a period of one month in 1996. The maximum one-hour average CO concentrations in Invercargill and Gore were 15.0 mgm-3 and 2.1 mgm-3 respectively. These are both within the one-hour average guideline value of 30 µgm-3. The maximum eight-hour average CO concentrations measured at the sites were 8.2 and 1.7 mgm-3 respectively.
2.11 Summary of CO concentrations
In most areas of New Zealand, concentrations of CO are within the ‘good’ or ‘excellent’ air quality categories for the majority of the time. The main exceptions are found in ‘traffic peak’ or ‘traffic dense’ sites such as Khyber Pass Road in Auckland and Riccarton Road in Christchurch. In addition, concentrations of CO in excess of the guideline values have been recorded at the ‘residential neighbourhood’ St Albans and Hornby monitoring sites in Christchurch and at the Big Fresh monitoring site in Dunedin. Carbon monoxide concentrations have also exceeded guideline values at “traffic” sites in Auckland at Khyber Pass, Queen Street and Dominion Road, in Wellington at the Civic Centre and in Christchurch at Riccarton Road.
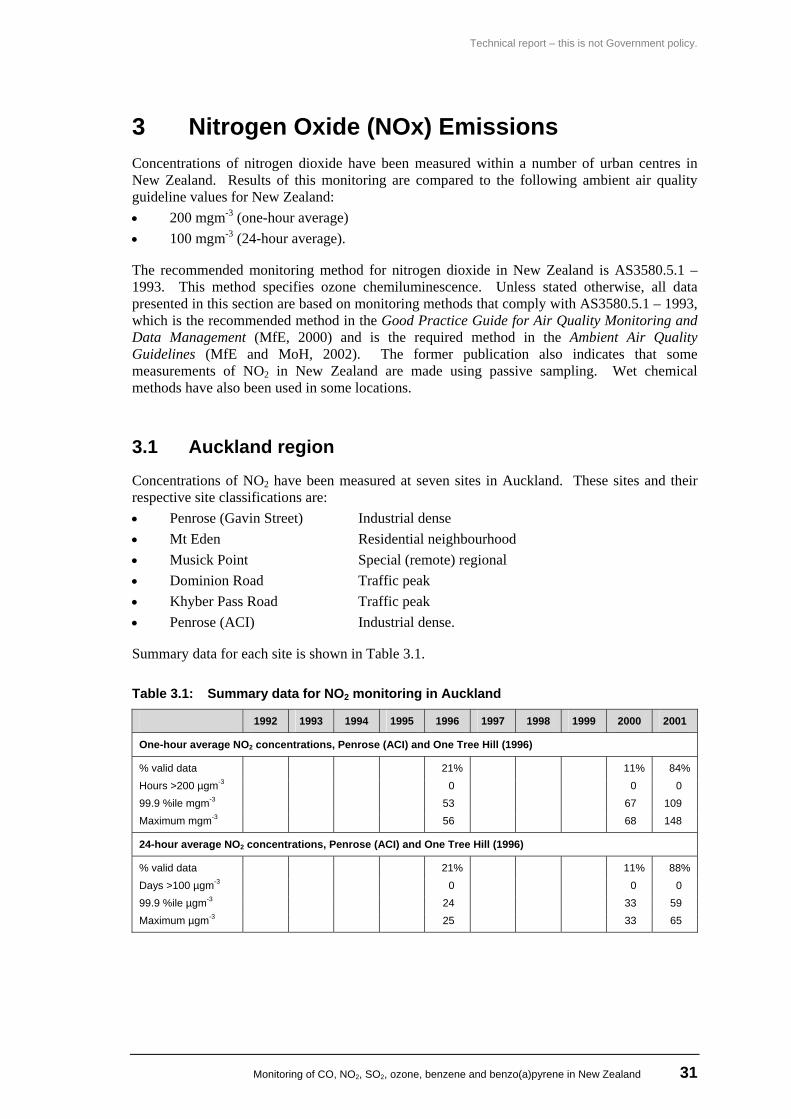
Technical report – this is not Government policy.
Monitoring of CO, NO2, SO2, ozone, benzene and benzo(a)pyrene in New Zealand 31
3 Nitrogen Oxide (NOx) Emissions Concentrations of nitrogen dioxide have been measured within a number of urban centres in New Zealand. Results of this monitoring are compared to the following ambient air quality guideline values for New Zealand: • 200 mgm-3 (one-hour average) • 100 mgm-3 (24-hour average).
The recommended monitoring method for nitrogen dioxide in New Zealand is AS3580.5.1 – 1993. This method specifies ozone chemiluminescence. Unless stated otherwise, all data presented in this section are based on monitoring methods that comply with AS3580.5.1 – 1993, which is the recommended method in the Good Practice Guide for Air Quality Monitoring and Data Management (MfE, 2000) and is the required method in the Ambient Air Quality Guidelines (MfE and MoH, 2002). The former publication also indicates that some measurements of NO2 in New Zealand are made using passive sampling. Wet chemical methods have also been used in some locations.
3.1 Auckland region Concentrations of NO2 have been measured at seven sites in Auckland. These sites and their respective site classifications are: • Penrose (Gavin Street) Industrial dense • Mt Eden Residential neighbourhood • Musick Point Special (remote) regional • Dominion Road Traffic peak • Khyber Pass Road Traffic peak • Penrose (ACI) Industrial dense.
Summary data for each site is shown in Table 3.1.
Table 3.1: Summary data for NO2 monitoring in Auckland
1992 1993 1994 1995 1996 1997 1998 1999 2000 2001
One-hour average NO2 concentrations, Penrose (ACI) and One Tree Hill (1996)
% valid data 21% 11% 84% Hours >200 µgm-3 0 0 0 99.9 %ile mgm-3 53 67 109 Maximum mgm-3 56 68 148
24-hour average NO2 concentrations, Penrose (ACI) and One Tree Hill (1996)
% valid data 21% 11% 88% Days >100 µgm-3 0 0 0 99.9 %ile µgm-3 24 33 59 Maximum µgm-3 25 33 65
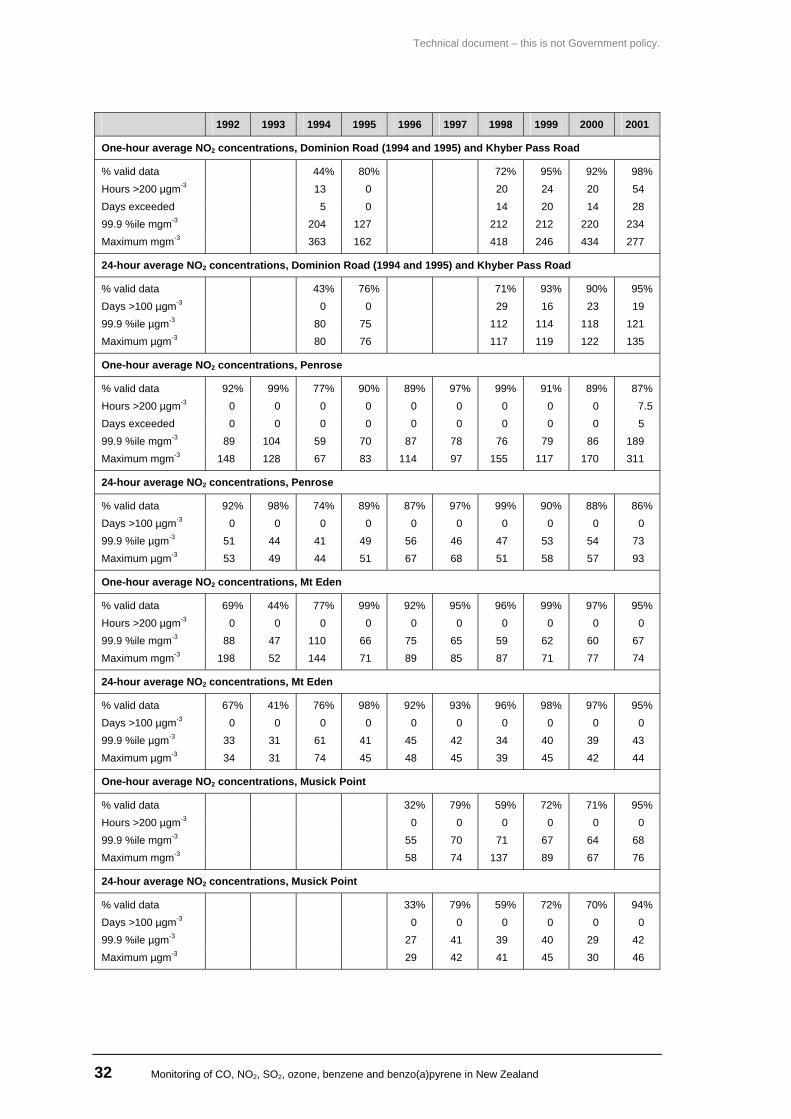
Technical document – this is not Government policy.
32 Monitoring of CO, NO2, SO2, ozone, benzene and benzo(a)pyrene in New Zealand
1992 1993 1994 1995 1996 1997 1998 1999 2000 2001
One-hour average NO2 concentrations, Dominion Road (1994 and 1995) and Khyber Pass Road
% valid data 44% 80% 72% 95% 92% 98% Hours >200 µgm-3 13 0 20 24 20 54 Days exceeded 5 0 14 20 14 28 99.9 %ile mgm-3 204 127 212 212 220 234 Maximum mgm-3 363 162 418 246 434 277
24-hour average NO2 concentrations, Dominion Road (1994 and 1995) and Khyber Pass Road
% valid data 43% 76% 71% 93% 90% 95% Days >100 µgm-3 0 0 29 16 23 19 99.9 %ile µgm-3 80 75 112 114 118 121 Maximum µgm-3 80 76 117 119 122 135
One-hour average NO2 concentrations, Penrose
% valid data 92% 99% 77% 90% 89% 97% 99% 91% 89% 87% Hours >200 µgm-3 0 0 0 0 0 0 0 0 0 7.5 Days exceeded 0 0 0 0 0 0 0 0 0 5 99.9 %ile mgm-3 89 104 59 70 87 78 76 79 86 189 Maximum mgm-3 148 128 67 83 114 97 155 117 170 311
24-hour average NO2 concentrations, Penrose
% valid data 92% 98% 74% 89% 87% 97% 99% 90% 88% 86% Days >100 µgm-3 0 0 0 0 0 0 0 0 0 0 99.9 %ile µgm-3 51 44 41 49 56 46 47 53 54 73 Maximum µgm-3 53 49 44 51 67 68 51 58 57 93
One-hour average NO2 concentrations, Mt Eden
% valid data 69% 44% 77% 99% 92% 95% 96% 99% 97% 95% Hours >200 µgm-3 0 0 0 0 0 0 0 0 0 0 99.9 %ile mgm-3 88 47 110 66 75 65 59 62 60 67 Maximum mgm-3 198 52 144 71 89 85 87 71 77 74
24-hour average NO2 concentrations, Mt Eden
% valid data 67% 41% 76% 98% 92% 93% 96% 98% 97% 95% Days >100 µgm-3 0 0 0 0 0 0 0 0 0 0 99.9 %ile µgm-3 33 31 61 41 45 42 34 40 39 43 Maximum µgm-3 34 31 74 45 48 45 39 45 42 44
One-hour average NO2 concentrations, Musick Point
% valid data 32% 79% 59% 72% 71% 95% Hours >200 µgm-3 0 0 0 0 0 0 99.9 %ile mgm-3 55 70 71 67 64 68 Maximum mgm-3 58 74 137 89 67 76
24-hour average NO2 concentrations, Musick Point
% valid data 33% 79% 59% 72% 70% 94% Days >100 µgm-3 0 0 0 0 0 0 99.9 %ile µgm-3 27 41 39 40 29 42 Maximum µgm-3 29 42 41 45 30 46
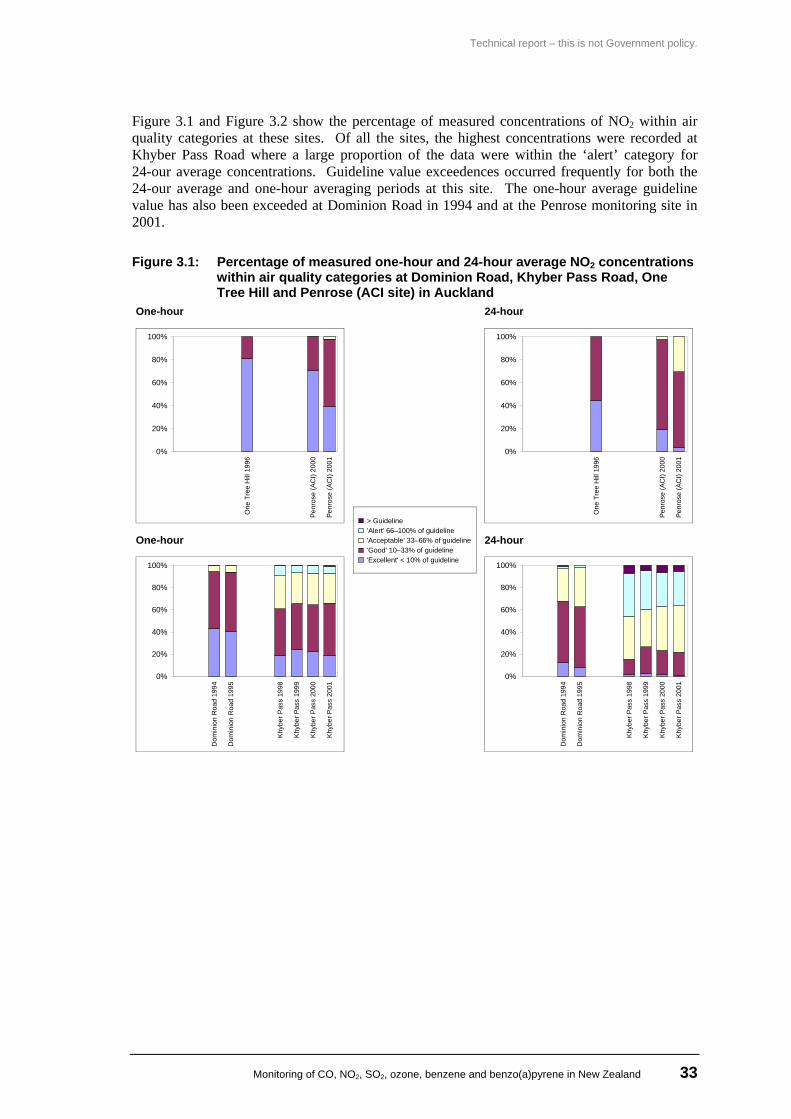
Technical report – this is not Government policy.
Monitoring of CO, NO2, SO2, ozone, benzene and benzo(a)pyrene in New Zealand 33
Figure 3.1 and Figure 3.2 show the percentage of measured concentrations of NO2 within air quality categories at these sites. Of all the sites, the highest concentrations were recorded at Khyber Pass Road where a large proportion of the data were within the ‘alert’ category for 24-our average concentrations. Guideline value exceedences occurred frequently for both the 24-our average and one-hour averaging periods at this site. The one-hour average guideline value has also been exceeded at Dominion Road in 1994 and at the Penrose monitoring site in 2001.
Figure 3.1: Percentage of measured one-hour and 24-hour average NO2 concentrations within air quality categories at Dominion Road, Khyber Pass Road, One Tree Hill and Penrose (ACI site) in Auckland
One-hour 24-hour
0%
20%
40%
60%
80%
100%
One
Tre
e H
ill 1
996
Penr
ose
(AC
I) 20
00
Penr
ose
(AC
I) 20
01
0%
20%
40%
60%
80%
100%
One
Tre
e H
ill 1
996
Penr
ose
(AC
I) 20
00
Penr
ose
(AC
I) 20
01
One-hour 24-hour
0%
20%
40%
60%
80%
100%
Dom
inio
n R
oad
1994
Dom
inio
n R
oad
1995
Khy
ber P
ass
1998
Khy
ber P
ass
1999
Khy
ber P
ass
2000
Khy
ber P
ass
2001
> Guideline 'Alert' 66–100% of guideline 'Acceptable' 33–66% of guideline 'Good' 10–33% of guideline 'Excellent' < 10% of guideline
0%
20%
40%
60%
80%
100%D
omin
ion
Roa
d 19
94
Dom
inio
n R
oad
1995
Khy
ber P
ass
1998
Khy
ber P
ass
1999
Khy
ber P
ass
2000
Khy
ber P
ass
2001
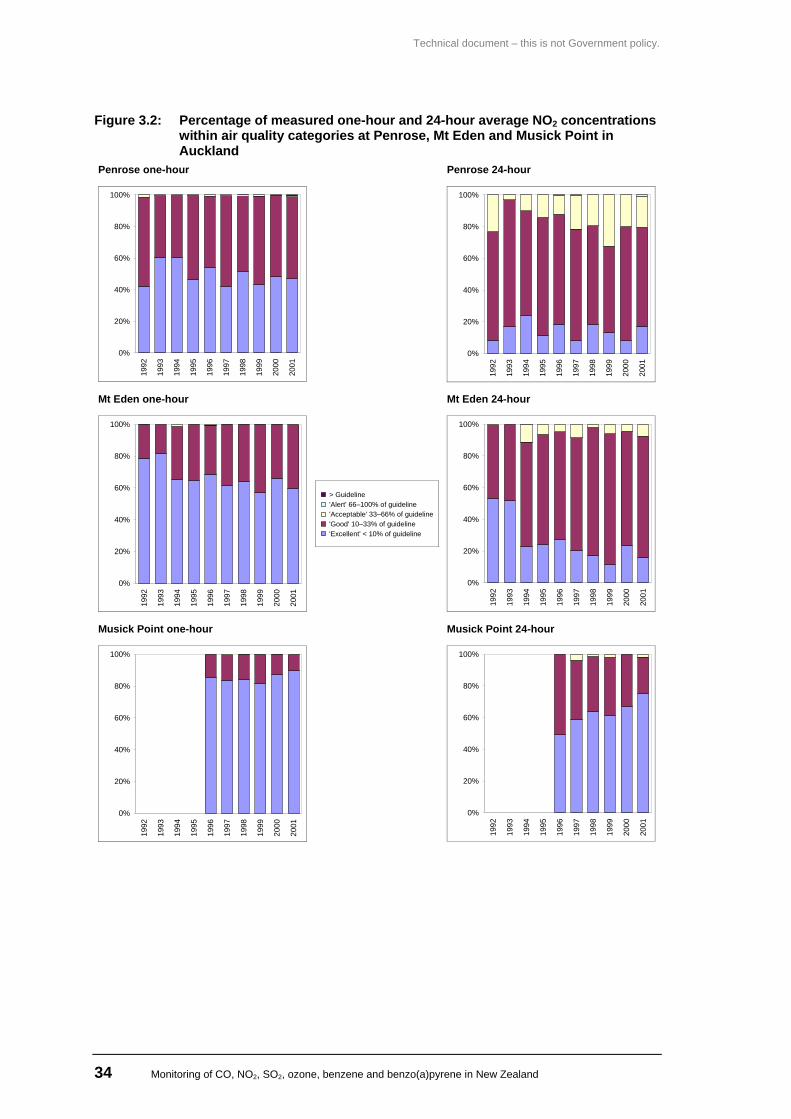
Technical document – this is not Government policy.
34 Monitoring of CO, NO2, SO2, ozone, benzene and benzo(a)pyrene in New Zealand
Figure 3.2: Percentage of measured one-hour and 24-hour average NO2 concentrations within air quality categories at Penrose, Mt Eden and Musick Point in Auckland
Penrose one-hour Penrose 24-hour
0%
20%
40%
60%
80%
100%
1992
1993
1994
1995
1996
1997
1998
1999
2000
2001
0%
20%
40%
60%
80%
100%
1992
1993
1994
1995
1996
1997
1998
1999
2000
2001
Mt Eden one-hour Mt Eden 24-hour
0%
20%
40%
60%
80%
100%
1992
1993
1994
1995
1996
1997
1998
1999
2000
2001
> Guideline 'Alert' 66–100% of guideline 'Acceptable' 33–66% of guideline 'Good' 10–33% of guideline 'Excellent' < 10% of guideline
0%
20%
40%
60%
80%
100%
1992
1993
1994
1995
1996
1997
1998
1999
2000
2001
Musick Point one-hour Musick Point 24-hour
0%
20%
40%
60%
80%
100%
1992
1993
1994
1995
1996
1997
1998
1999
2000
2001
0%
20%
40%
60%
80%
100%
1992
1993
1994
1995
1996
1997
1998
1999
2000
2001
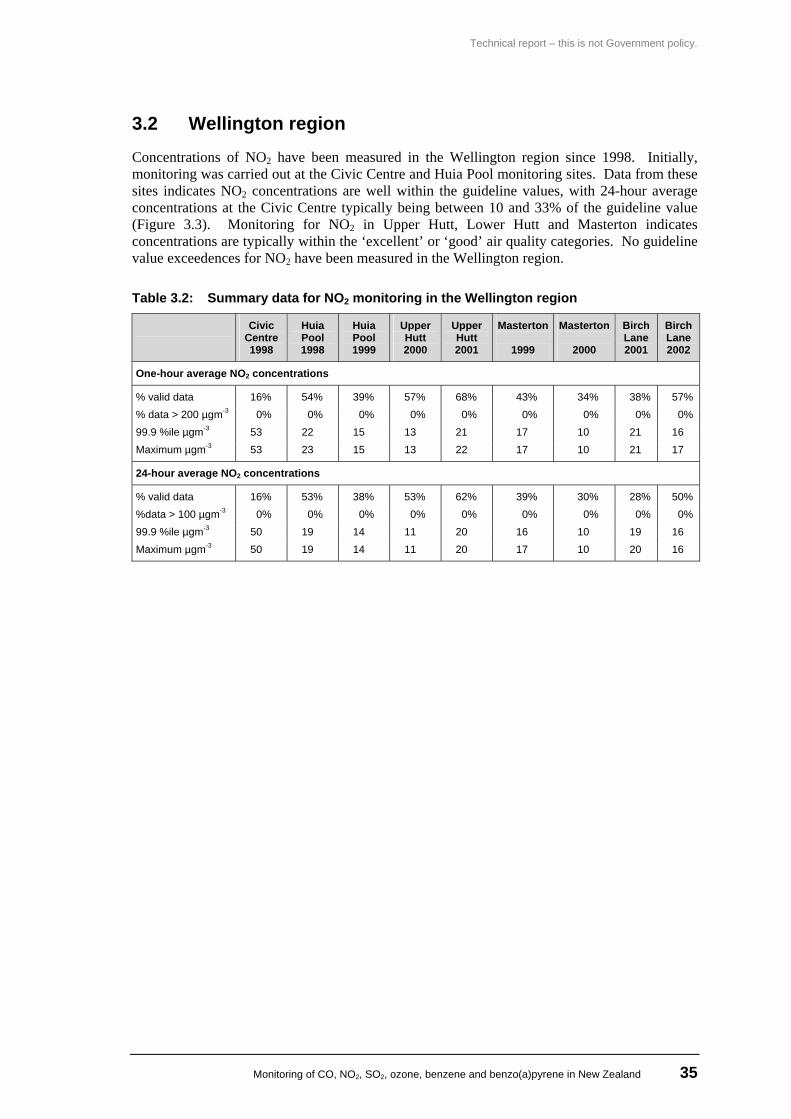
Technical report – this is not Government policy.
Monitoring of CO, NO2, SO2, ozone, benzene and benzo(a)pyrene in New Zealand 35
3.2 Wellington region Concentrations of NO2 have been measured in the Wellington region since 1998. Initially, monitoring was carried out at the Civic Centre and Huia Pool monitoring sites. Data from these sites indicates NO2 concentrations are well within the guideline values, with 24-hour average concentrations at the Civic Centre typically being between 10 and 33% of the guideline value (Figure 3.3). Monitoring for NO2 in Upper Hutt, Lower Hutt and Masterton indicates concentrations are typically within the ‘excellent’ or ‘good’ air quality categories. No guideline value exceedences for NO2 have been measured in the Wellington region.
Table 3.2: Summary data for NO2 monitoring in the Wellington region
Civic Centre 1998
Huia Pool 1998
Huia Pool 1999
Upper Hutt 2000
Upper Hutt 2001
Masterton
1999
Masterton
2000
Birch Lane 2001
Birch Lane 2002
One-hour average NO2 concentrations
% valid data 16% 54% 39% 57% 68% 43% 34% 38% 57% % data > 200 µgm-3 0% 0% 0% 0% 0% 0% 0% 0% 0% 99.9 %ile µgm-3 53 22 15 13 21 17 10 21 16 Maximum µgm-3 53 23 15 13 22 17 10 21 17
24-hour average NO2 concentrations
% valid data 16% 53% 38% 53% 62% 39% 30% 28% 50% %data > 100 µgm-3 0% 0% 0% 0% 0% 0% 0% 0% 0% 99.9 %ile µgm-3 50 19 14 11 20 16 10 19 16 Maximum µgm-3 50 19 14 11 20 17 10 20 16
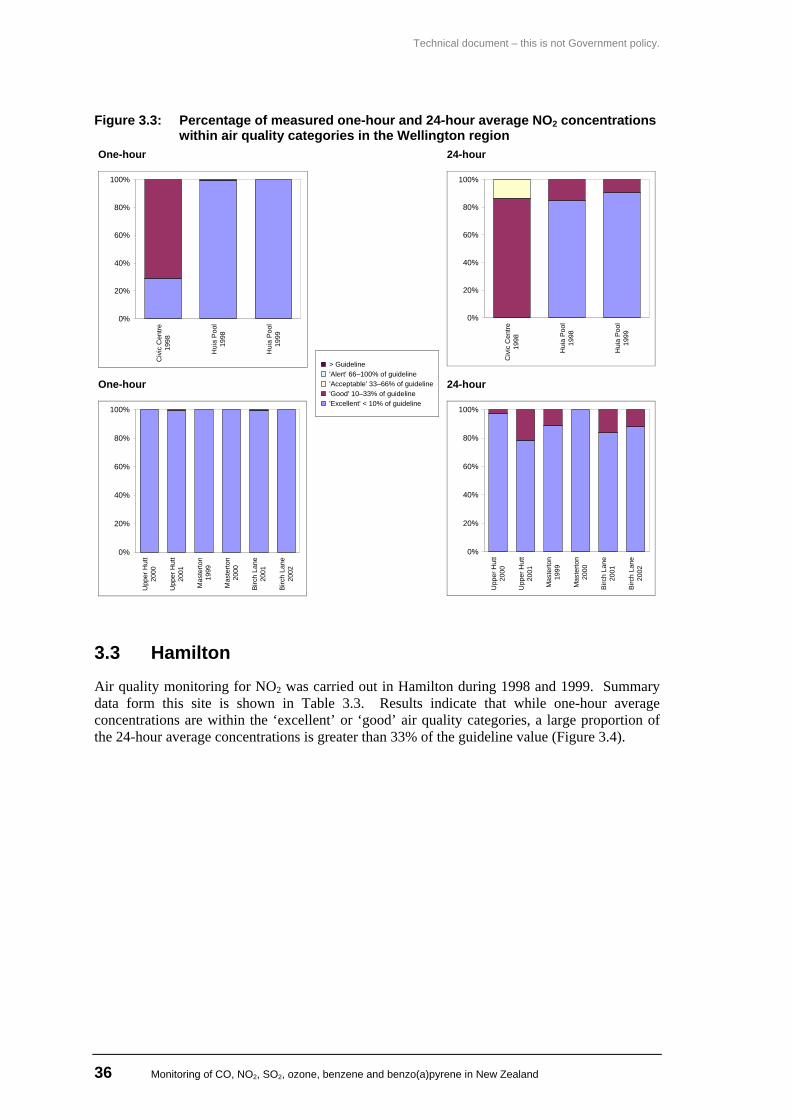
Technical document – this is not Government policy.
36 Monitoring of CO, NO2, SO2, ozone, benzene and benzo(a)pyrene in New Zealand
Figure 3.3: Percentage of measured one-hour and 24-hour average NO2 concentrations within air quality categories in the Wellington region
One-hour 24-hour
0%
20%
40%
60%
80%
100%
Civ
ic C
entre
1998
Hui
a P
ool
1998
Hui
a P
ool
1999
0%
20%
40%
60%
80%
100%
Civ
ic C
entre
1998
Hui
a P
ool
1998
Hui
a P
ool
1999
One-hour 24-hour
0%
20%
40%
60%
80%
100%
Upp
er H
utt
2000
Upp
er H
utt
2001
Mas
terto
n19
99
Mas
terto
n20
00
Birc
h La
ne20
01
Birc
h La
ne20
02
> Guideline 'Alert' 66–100% of guideline 'Acceptable' 33–66% of guideline 'Good' 10–33% of guideline 'Excellent' < 10% of guideline
0%
20%
40%
60%
80%
100%
Upp
er H
utt
2000
Upp
er H
utt
2001
Mas
terto
n19
99
Mas
terto
n20
00
Birc
h La
ne20
01
Birc
h La
ne20
02
3.3 Hamilton Air quality monitoring for NO2 was carried out in Hamilton during 1998 and 1999. Summary data form this site is shown in Table 3.3. Results indicate that while one-hour average concentrations are within the ‘excellent’ or ‘good’ air quality categories, a large proportion of the 24-hour average concentrations is greater than 33% of the guideline value (Figure 3.4).
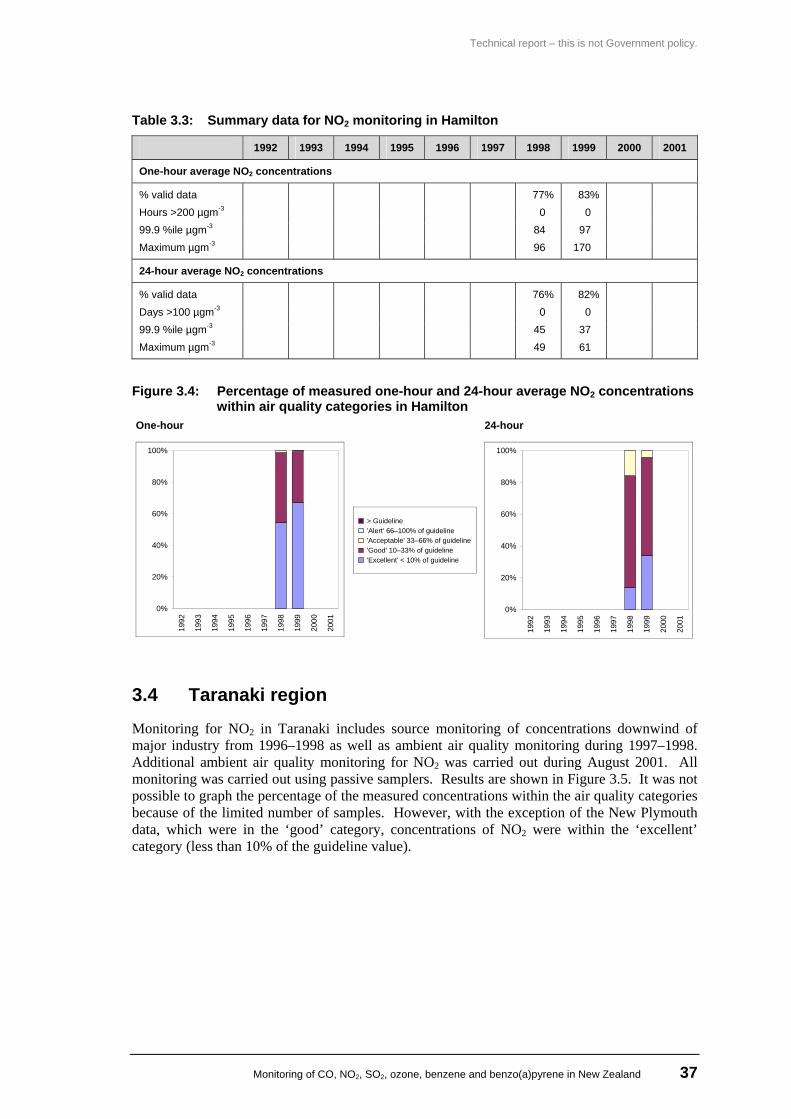
Technical report – this is not Government policy.
Monitoring of CO, NO2, SO2, ozone, benzene and benzo(a)pyrene in New Zealand 37
Table 3.3: Summary data for NO2 monitoring in Hamilton
1992 1993 1994 1995 1996 1997 1998 1999 2000 2001
One-hour average NO2 concentrations
% valid data 77% 83% Hours >200 µgm-3 0 0 99.9 %ile µgm-3 84 97 Maximum µgm-3 96 170
24-hour average NO2 concentrations
% valid data 76% 82% Days >100 µgm-3 0 0 99.9 %ile µgm-3 45 37 Maximum µgm-3 49 61
Figure 3.4: Percentage of measured one-hour and 24-hour average NO2 concentrations within air quality categories in Hamilton
One-hour 24-hour
0%
20%
40%
60%
80%
100%
1992
1993
1994
1995
1996
1997
1998
1999
2000
2001
> Guideline 'Alert' 66–100% of guideline 'Acceptable' 33–66% of guideline 'Good' 10–33% of guideline 'Excellent' < 10% of guideline
0%
20%
40%
60%
80%
100%
1992
1993
1994
1995
1996
1997
1998
1999
2000
2001
3.4 Taranaki region
Monitoring for NO2 in Taranaki includes source monitoring of concentrations downwind of major industry from 1996–1998 as well as ambient air quality monitoring during 1997–1998. Additional ambient air quality monitoring for NO2 was carried out during August 2001. All monitoring was carried out using passive samplers. Results are shown in Figure 3.5. It was not possible to graph the percentage of the measured concentrations within the air quality categories because of the limited number of samples. However, with the exception of the New Plymouth data, which were in the ‘good’ category, concentrations of NO2 were within the ‘excellent’ category (less than 10% of the guideline value).
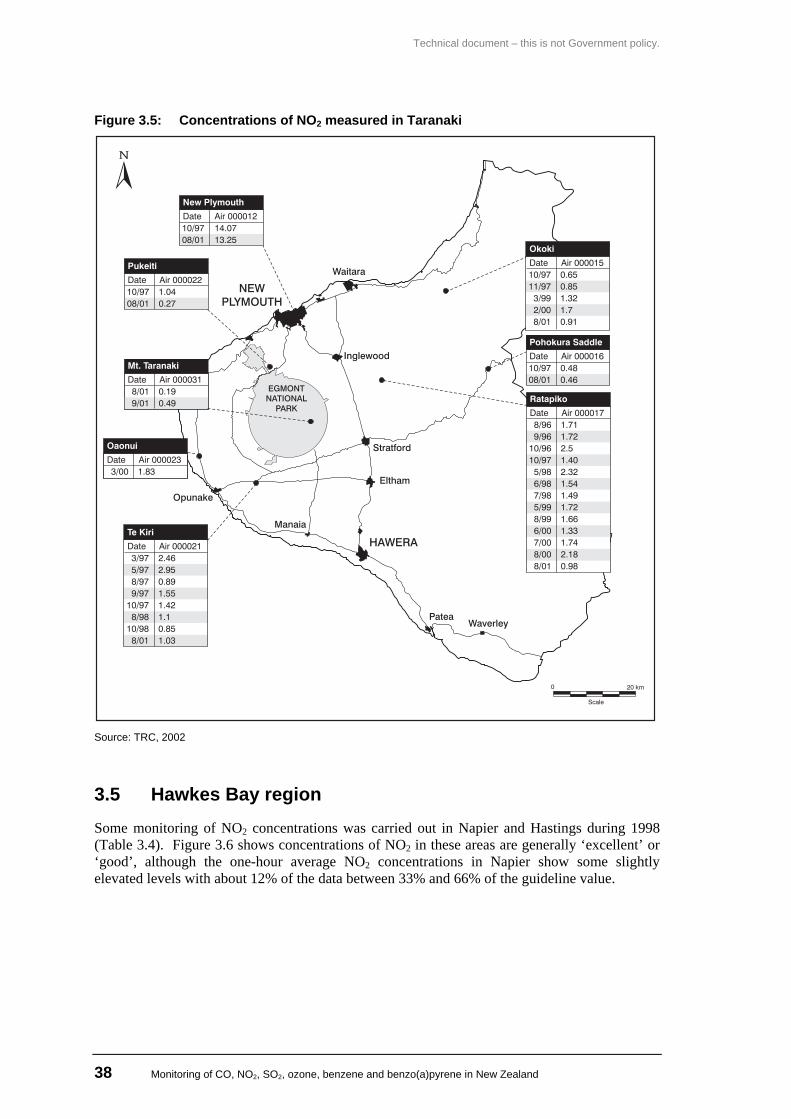
Technical document – this is not Government policy.
38 Monitoring of CO, NO2, SO2, ozone, benzene and benzo(a)pyrene in New Zealand
Figure 3.5: Concentrations of NO2 measured in Taranaki
Source: TRC, 2002
3.5 Hawkes Bay region Some monitoring of NO2 concentrations was carried out in Napier and Hastings during 1998 (Table 3.4). Figure 3.6 shows concentrations of NO2 in these areas are generally ‘excellent’ or ‘good’, although the one-hour average NO2 concentrations in Napier show some slightly elevated levels with about 12% of the data between 33% and 66% of the guideline value.
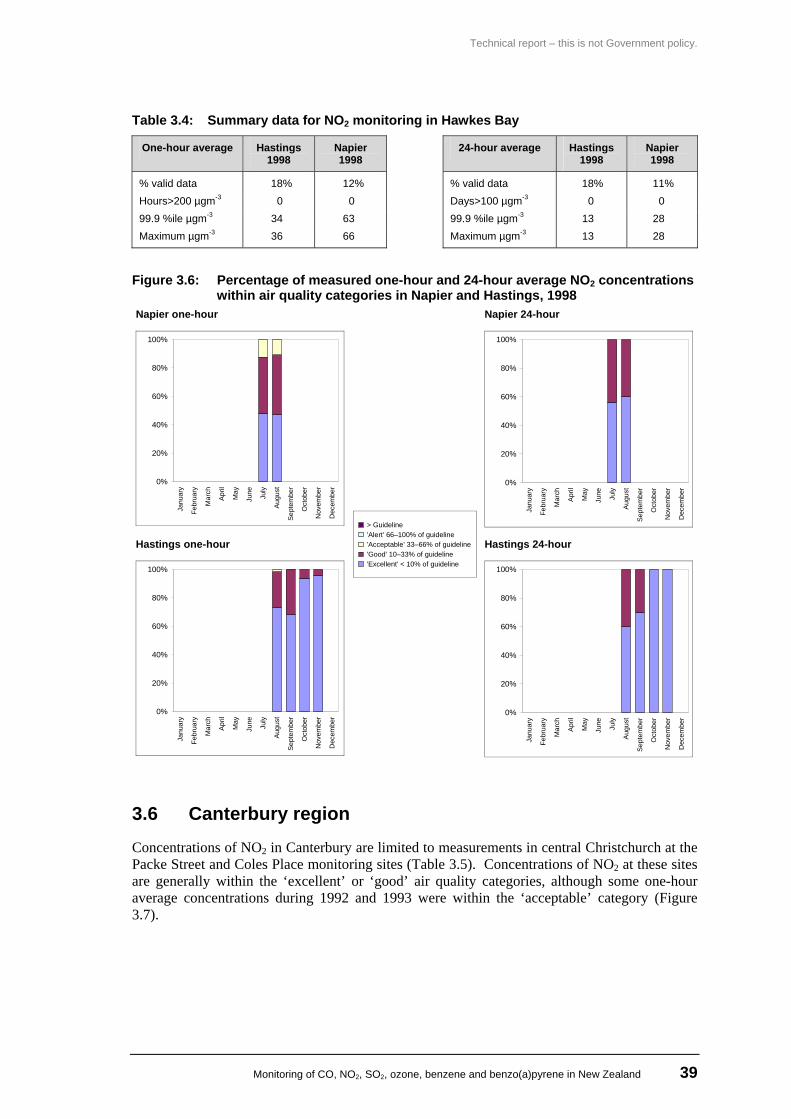
Technical report – this is not Government policy.
Monitoring of CO, NO2, SO2, ozone, benzene and benzo(a)pyrene in New Zealand 39
Table 3.4: Summary data for NO2 monitoring in Hawkes Bay
One-hour average Hastings 1998
Napier 1998
24-hour average Hastings 1998
Napier 1998
% valid data 18% 12% % valid data 18% 11% Hours>200 µgm-3 0 0 Days>100 µgm-3 0 0 99.9 %ile µgm-3 34 63 99.9 %ile µgm-3 13 28 Maximum µgm-3 36 66 Maximum µgm-3 13 28
Figure 3.6: Percentage of measured one-hour and 24-hour average NO2 concentrations within air quality categories in Napier and Hastings, 1998
Napier one-hour Napier 24-hour
0%
20%
40%
60%
80%
100%
Janu
ary
Febr
uary
Mar
ch
Apr
il
May
June
July
Aug
ust
Sept
embe
r
Oct
ober
Nov
embe
r
Dec
embe
r 0%
20%
40%
60%
80%
100%
Janu
ary
Febr
uary
Mar
ch
Apr
il
May
June
July
Aug
ust
Sep
tem
ber
Oct
ober
Nov
embe
r
Dec
embe
r
Hastings one-hour Hastings 24-hour
0%
20%
40%
60%
80%
100%
Janu
ary
Febr
uary
Mar
ch
Apr
il
May
June
July
Augu
st
Sept
embe
r
Oct
ober
Nov
embe
r
Dec
embe
r
> Guideline 'Alert' 66–100% of guideline 'Acceptable' 33–66% of guideline 'Good' 10–33% of guideline 'Excellent' < 10% of guideline
0%
20%
40%
60%
80%
100%
Janu
ary
Febr
uary
Mar
ch
Apr
il
May
June
July
Aug
ust
Sep
tem
ber
Oct
ober
Nov
embe
r
Dec
embe
r
3.6 Canterbury region
Concentrations of NO2 in Canterbury are limited to measurements in central Christchurch at the Packe Street and Coles Place monitoring sites (Table 3.5). Concentrations of NO2 at these sites are generally within the ‘excellent’ or ‘good’ air quality categories, although some one-hour average concentrations during 1992 and 1993 were within the ‘acceptable’ category (Figure 3.7).
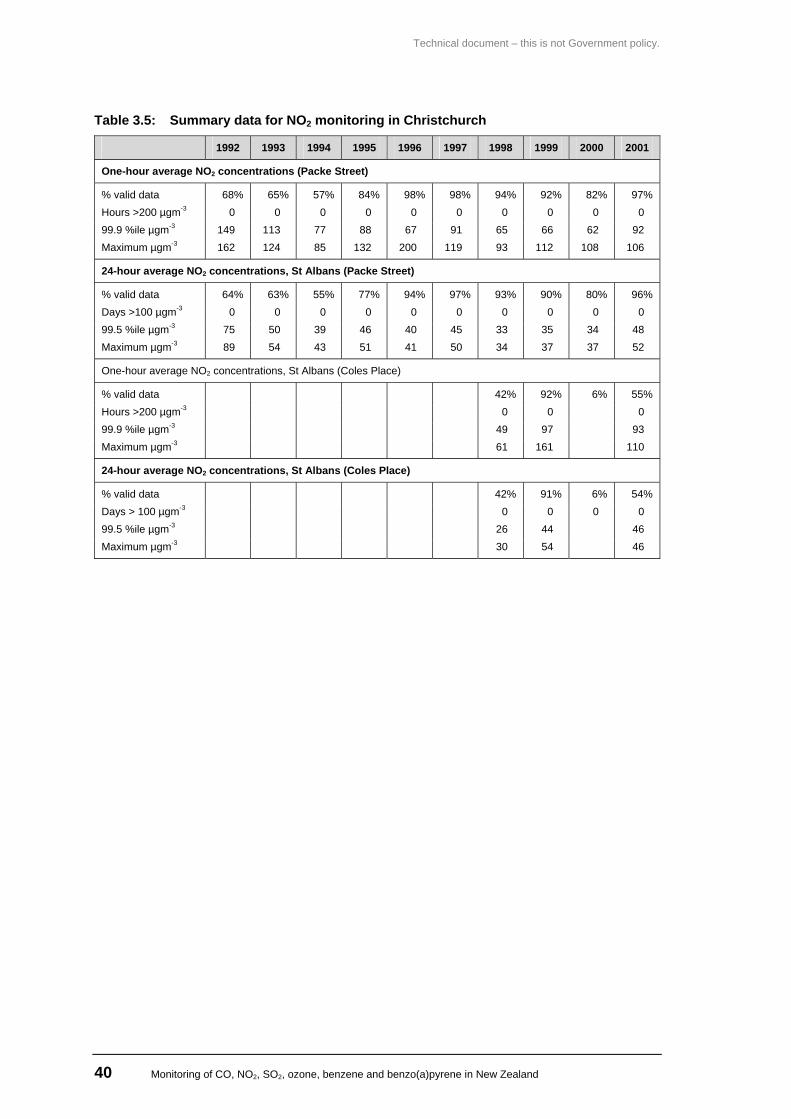
Technical document – this is not Government policy.
40 Monitoring of CO, NO2, SO2, ozone, benzene and benzo(a)pyrene in New Zealand
Table 3.5: Summary data for NO2 monitoring in Christchurch
1992 1993 1994 1995 1996 1997 1998 1999 2000 2001
One-hour average NO2 concentrations (Packe Street)
% valid data 68% 65% 57% 84% 98% 98% 94% 92% 82% 97% Hours >200 µgm-3 0 0 0 0 0 0 0 0 0 0 99.9 %ile µgm-3 149 113 77 88 67 91 65 66 62 92 Maximum µgm-3 162 124 85 132 200 119 93 112 108 106
24-hour average NO2 concentrations, St Albans (Packe Street)
% valid data 64% 63% 55% 77% 94% 97% 93% 90% 80% 96% Days >100 µgm-3 0 0 0 0 0 0 0 0 0 0 99.5 %ile µgm-3 75 50 39 46 40 45 33 35 34 48 Maximum µgm-3 89 54 43 51 41 50 34 37 37 52
One-hour average NO2 concentrations, St Albans (Coles Place)
% valid data 42% 92% 6% 55% Hours >200 µgm-3 0 0 0 99.9 %ile µgm-3 49 97 93 Maximum µgm-3 61 161 110
24-hour average NO2 concentrations, St Albans (Coles Place)
% valid data 42% 91% 6% 54% Days > 100 µgm-3 0 0 0 0 99.5 %ile µgm-3 26 44 46 Maximum µgm-3 30 54 46
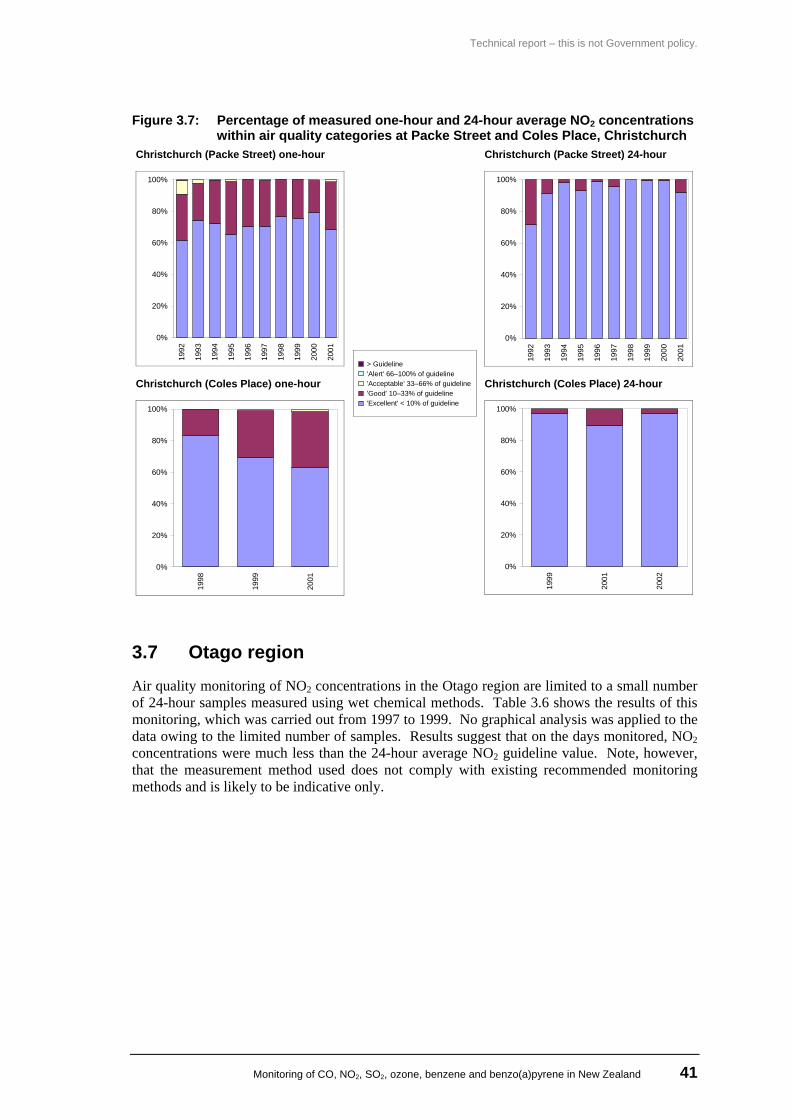
Technical report – this is not Government policy.
Monitoring of CO, NO2, SO2, ozone, benzene and benzo(a)pyrene in New Zealand 41
Figure 3.7: Percentage of measured one-hour and 24-hour average NO2 concentrations within air quality categories at Packe Street and Coles Place, Christchurch
Christchurch (Packe Street) one-hour Christchurch (Packe Street) 24-hour
0%
20%
40%
60%
80%
100%19
92
1993
1994
1995
1996
1997
1998
1999
2000
2001
0%
20%
40%
60%
80%
100%
1992
1993
1994
1995
1996
1997
1998
1999
2000
2001
Christchurch (Coles Place) one-hour Christchurch (Coles Place) 24-hour
0%
20%
40%
60%
80%
100%
1998
1999
2001
> Guideline 'Alert' 66–100% of guideline 'Acceptable' 33–66% of guideline 'Good' 10–33% of guideline 'Excellent' < 10% of guideline
0%
20%
40%
60%
80%
100%
1999
2001
2002
3.7 Otago region Air quality monitoring of NO2 concentrations in the Otago region are limited to a small number of 24-hour samples measured using wet chemical methods. Table 3.6 shows the results of this monitoring, which was carried out from 1997 to 1999. No graphical analysis was applied to the data owing to the limited number of samples. Results suggest that on the days monitored, NO2 concentrations were much less than the 24-hour average NO2 guideline value. Note, however, that the measurement method used does not comply with existing recommended monitoring methods and is likely to be indicative only.
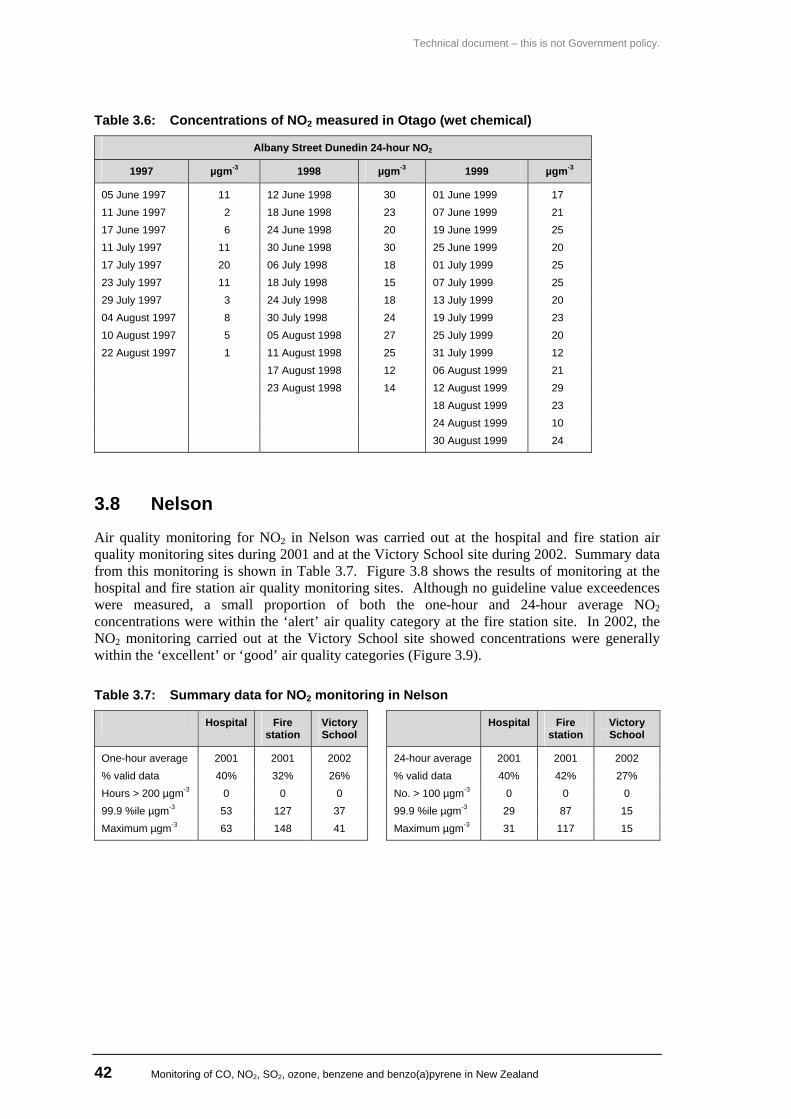
Technical document – this is not Government policy.
42 Monitoring of CO, NO2, SO2, ozone, benzene and benzo(a)pyrene in New Zealand
Table 3.6: Concentrations of NO2 measured in Otago (wet chemical)
Albany Street Dunedin 24-hour NO2
1997 µgm-3 1998 µgm-3 1999 µgm-3
05 June 1997 11 12 June 1998 30 01 June 1999 17 11 June 1997 2 18 June 1998 23 07 June 1999 21 17 June 1997 6 24 June 1998 20 19 June 1999 25 11 July 1997 11 30 June 1998 30 25 June 1999 20 17 July 1997 20 06 July 1998 18 01 July 1999 25 23 July 1997 11 18 July 1998 15 07 July 1999 25 29 July 1997 3 24 July 1998 18 13 July 1999 20 04 August 1997 8 30 July 1998 24 19 July 1999 23 10 August 1997 5 05 August 1998 27 25 July 1999 20 22 August 1997 1 11 August 1998 25 31 July 1999 12 17 August 1998 12 06 August 1999 21 23 August 1998 14 12 August 1999 29 18 August 1999 23 24 August 1999 10 30 August 1999 24
3.8 Nelson
Air quality monitoring for NO2 in Nelson was carried out at the hospital and fire station air quality monitoring sites during 2001 and at the Victory School site during 2002. Summary data from this monitoring is shown in Table 3.7. Figure 3.8 shows the results of monitoring at the hospital and fire station air quality monitoring sites. Although no guideline value exceedences were measured, a small proportion of both the one-hour and 24-hour average NO2 concentrations were within the ‘alert’ air quality category at the fire station site. In 2002, the NO2 monitoring carried out at the Victory School site showed concentrations were generally within the ‘excellent’ or ‘good’ air quality categories (Figure 3.9).
Table 3.7: Summary data for NO2 monitoring in Nelson
Hospital Fire station
Victory School
Hospital Fire station
Victory School
One-hour average 2001 2001 2002 24-hour average 2001 2001 2002 % valid data 40% 32% 26% % valid data 40% 42% 27% Hours > 200 µgm-3 0 0 0 No. > 100 µgm-3 0 0 0 99.9 %ile µgm-3 53 127 37 99.9 %ile µgm-3 29 87 15 Maximum µgm-3 63 148 41 Maximum µgm-3 31 117 15
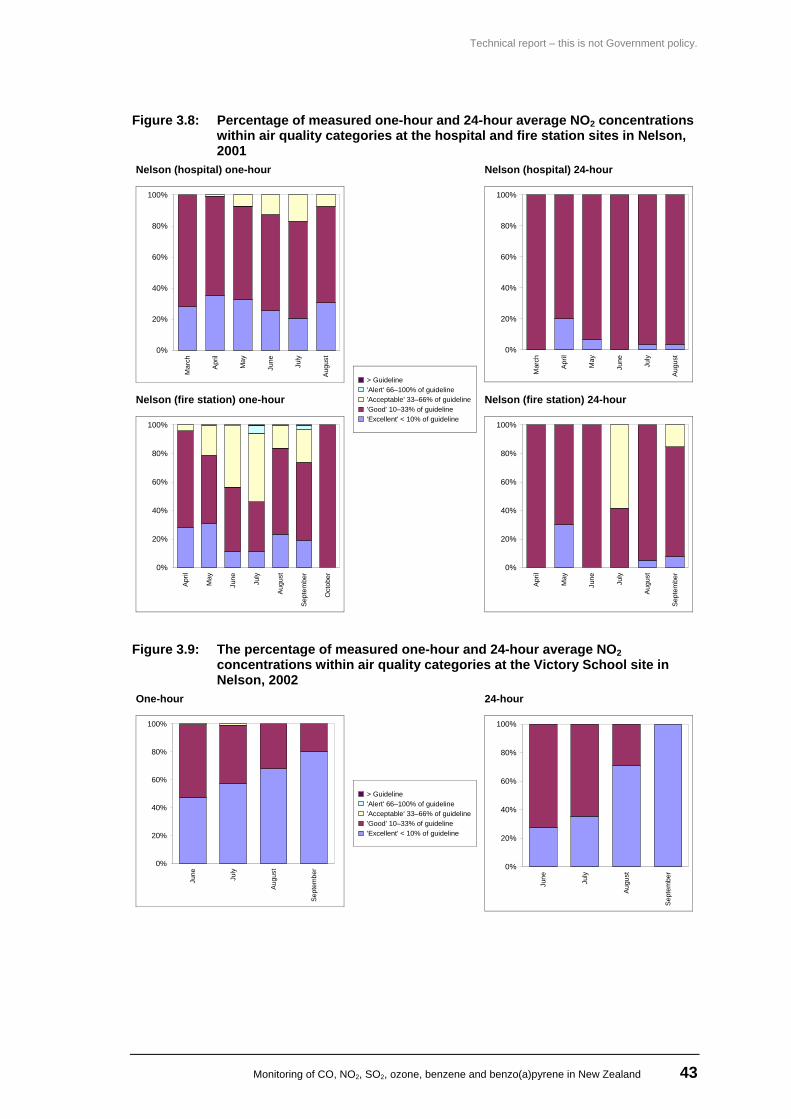
Technical report – this is not Government policy.
Monitoring of CO, NO2, SO2, ozone, benzene and benzo(a)pyrene in New Zealand 43
Figure 3.8: Percentage of measured one-hour and 24-hour average NO2 concentrations within air quality categories at the hospital and fire station sites in Nelson, 2001
Nelson (hospital) one-hour Nelson (hospital) 24-hour
0%
20%
40%
60%
80%
100%M
arch
Apr
il
May
June
July
Augu
st
0%
20%
40%
60%
80%
100%
Mar
ch
Apr
il
May
June July
Augu
st
Nelson (fire station) one-hour Nelson (fire station) 24-hour
0%
20%
40%
60%
80%
100%
Apr
il
May
June
July
Aug
ust
Sep
tem
ber
Oct
ober
> Guideline 'Alert' 66–100% of guideline 'Acceptable' 33–66% of guideline 'Good' 10–33% of guideline 'Excellent' < 10% of guideline
0%
20%
40%
60%
80%
100%
Apr
il
May
June
July
Aug
ust
Sep
tem
ber
Figure 3.9: The percentage of measured one-hour and 24-hour average NO2 concentrations within air quality categories at the Victory School site in Nelson, 2002
One-hour 24-hour
0%
20%
40%
60%
80%
100%
June July
Aug
ust
Sept
embe
r
> Guideline 'Alert' 66–100% of guideline 'Acceptable' 33–66% of guideline 'Good' 10–33% of guideline 'Excellent' < 10% of guideline
0%
20%
40%
60%
80%
100%
June
July
Aug
ust
Sep
tem
ber
Technical document – this is not Government policy.
44 Monitoring of CO, NO2, SO2, ozone, benzene and benzo(a)pyrene in New Zealand
3.9 Summary of NO2 concentrations Concentrations of NO2 are typically ‘excellent’ or ‘good’ the majority of the time at most air quality monitoring sites in New Zealand. Several guideline value exceedences of the one-hour and 24-hour guideline values have occurred each year at the Khyber Pass Road site. This site is classified as ‘traffic peak’.
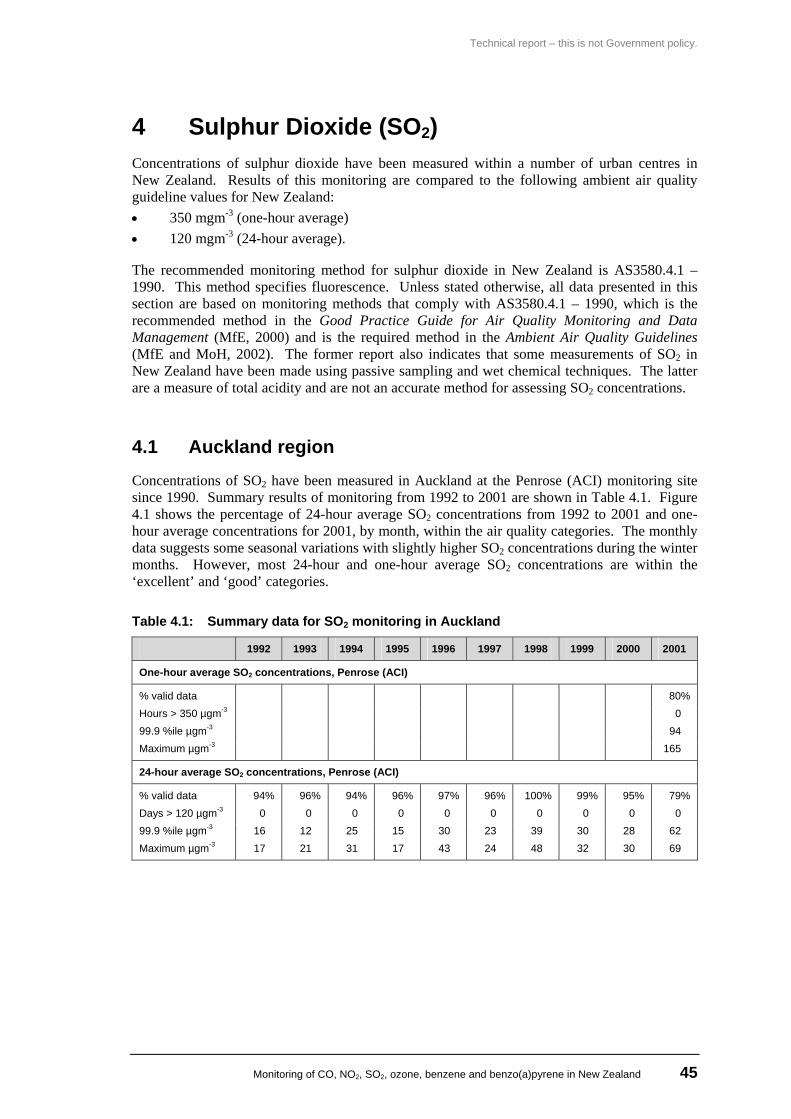
Technical report – this is not Government policy.
Monitoring of CO, NO2, SO2, ozone, benzene and benzo(a)pyrene in New Zealand 45
4 Sulphur Dioxide (SO2) Concentrations of sulphur dioxide have been measured within a number of urban centres in New Zealand. Results of this monitoring are compared to the following ambient air quality guideline values for New Zealand: • 350 mgm-3 (one-hour average) • 120 mgm-3 (24-hour average).
The recommended monitoring method for sulphur dioxide in New Zealand is AS3580.4.1 – 1990. This method specifies fluorescence. Unless stated otherwise, all data presented in this section are based on monitoring methods that comply with AS3580.4.1 – 1990, which is the recommended method in the Good Practice Guide for Air Quality Monitoring and Data Management (MfE, 2000) and is the required method in the Ambient Air Quality Guidelines (MfE and MoH, 2002). The former report also indicates that some measurements of SO2 in New Zealand have been made using passive sampling and wet chemical techniques. The latter are a measure of total acidity and are not an accurate method for assessing SO2 concentrations.
4.1 Auckland region Concentrations of SO2 have been measured in Auckland at the Penrose (ACI) monitoring site since 1990. Summary results of monitoring from 1992 to 2001 are shown in Table 4.1. Figure 4.1 shows the percentage of 24-hour average SO2 concentrations from 1992 to 2001 and one-hour average concentrations for 2001, by month, within the air quality categories. The monthly data suggests some seasonal variations with slightly higher SO2 concentrations during the winter months. However, most 24-hour and one-hour average SO2 concentrations are within the ‘excellent’ and ‘good’ categories.
Table 4.1: Summary data for SO2 monitoring in Auckland
1992 1993 1994 1995 1996 1997 1998 1999 2000 2001
One-hour average SO2 concentrations, Penrose (ACI)
% valid data 80% Hours > 350 µgm-3 0 99.9 %ile µgm-3 94 Maximum µgm-3 165
24-hour average SO2 concentrations, Penrose (ACI)
% valid data 94% 96% 94% 96% 97% 96% 100% 99% 95% 79% Days > 120 µgm-3 0 0 0 0 0 0 0 0 0 0 99.9 %ile µgm-3 16 12 25 15 30 23 39 30 28 62 Maximum µgm-3 17 21 31 17 43 24 48 32 30 69
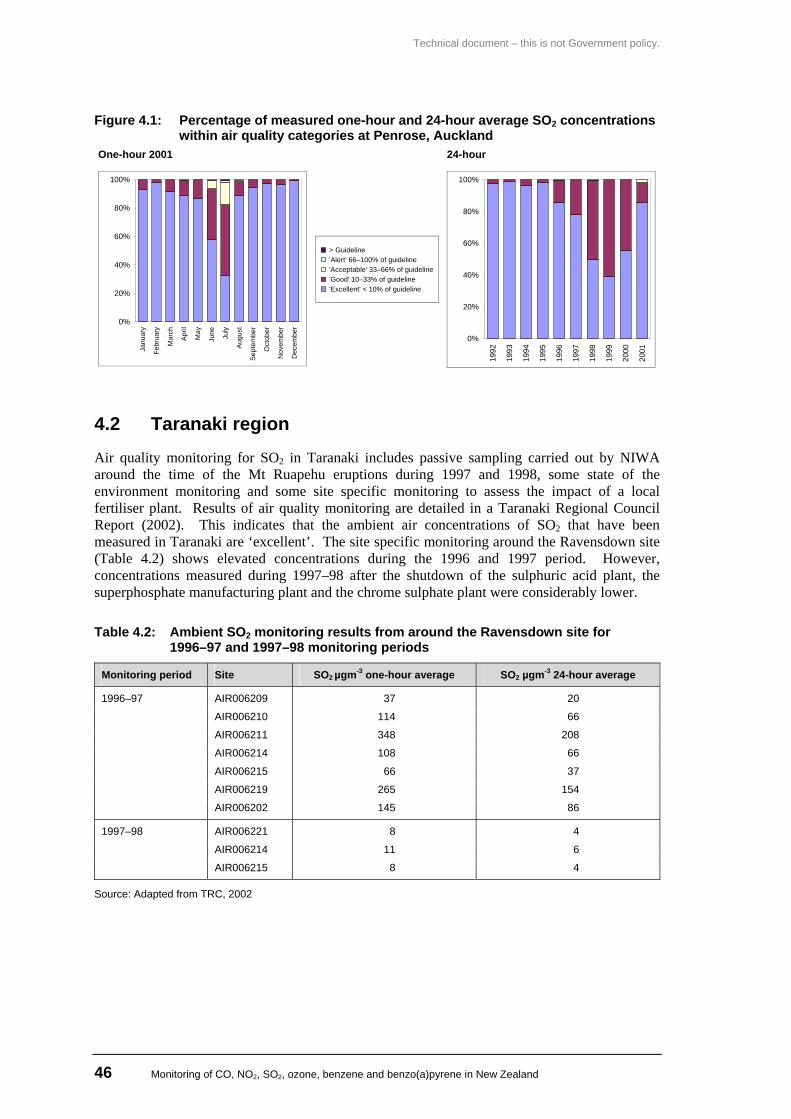
Technical document – this is not Government policy.
46 Monitoring of CO, NO2, SO2, ozone, benzene and benzo(a)pyrene in New Zealand
Figure 4.1: Percentage of measured one-hour and 24-hour average SO2 concentrations within air quality categories at Penrose, Auckland
One-hour 2001 24-hour
0%
20%
40%
60%
80%
100%
Janu
ary
Febr
uary
Mar
ch
Apr
il
May
June
July
Aug
ust
Sept
embe
r
Oct
ober
Nov
embe
r
Dec
embe
r
> Guideline 'Alert' 66–100% of guideline 'Acceptable' 33–66% of guideline 'Good' 10–33% of guideline 'Excellent' < 10% of guideline
0%
20%
40%
60%
80%
100%
1992
1993
1994
1995
1996
1997
1998
1999
2000
2001
4.2 Taranaki region
Air quality monitoring for SO2 in Taranaki includes passive sampling carried out by NIWA around the time of the Mt Ruapehu eruptions during 1997 and 1998, some state of the environment monitoring and some site specific monitoring to assess the impact of a local fertiliser plant. Results of air quality monitoring are detailed in a Taranaki Regional Council Report (2002). This indicates that the ambient air concentrations of SO2 that have been measured in Taranaki are ‘excellent’. The site specific monitoring around the Ravensdown site (Table 4.2) shows elevated concentrations during the 1996 and 1997 period. However, concentrations measured during 1997–98 after the shutdown of the sulphuric acid plant, the superphosphate manufacturing plant and the chrome sulphate plant were considerably lower.
Table 4.2: Ambient SO2 monitoring results from around the Ravensdown site for 1996–97 and 1997–98 monitoring periods
Monitoring period Site SO2 µgm-3 one-hour average SO2 µgm-3 24-hour average
AIR006209 37 20
AIR006210 114 66
AIR006211 348 208
AIR006214 108 66
AIR006215 66 37
AIR006219 265 154
1996–97
AIR006202 145 86
AIR006221 8 4
AIR006214 11 6
1997–98
AIR006215 8 4
Source: Adapted from TRC, 2002
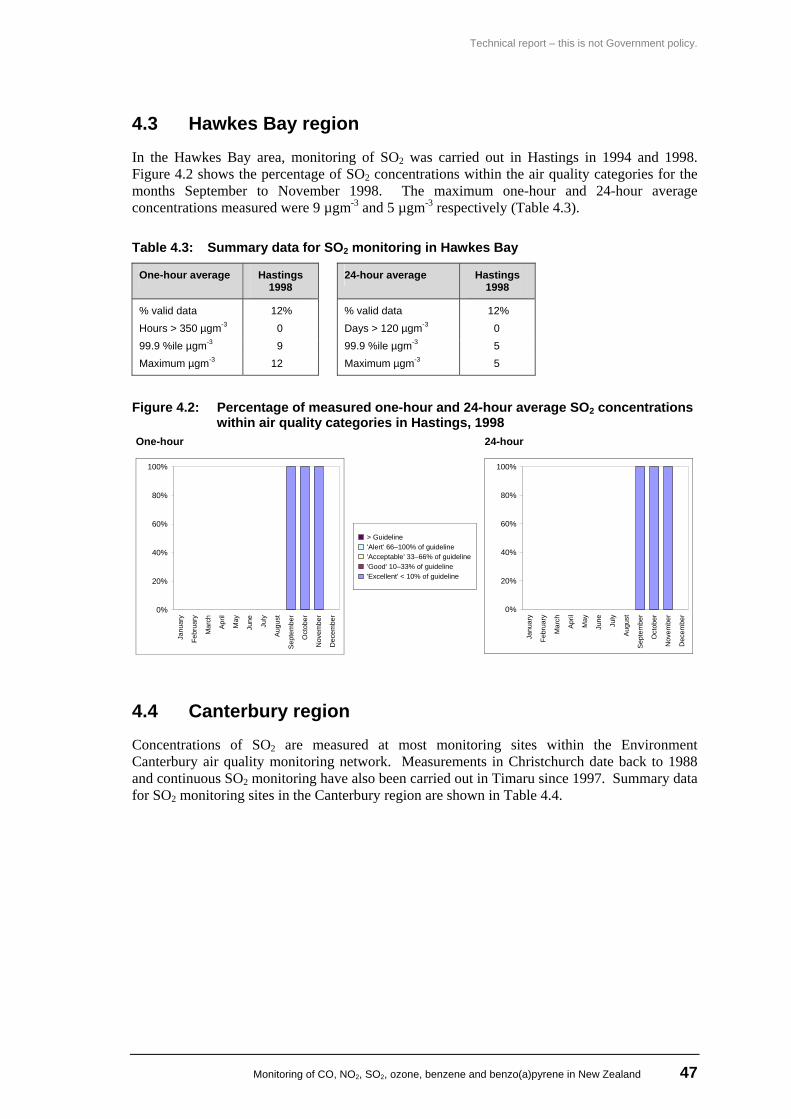
Technical report – this is not Government policy.
Monitoring of CO, NO2, SO2, ozone, benzene and benzo(a)pyrene in New Zealand 47
4.3 Hawkes Bay region In the Hawkes Bay area, monitoring of SO2 was carried out in Hastings in 1994 and 1998. Figure 4.2 shows the percentage of SO2 concentrations within the air quality categories for the months September to November 1998. The maximum one-hour and 24-hour average concentrations measured were 9 µgm-3 and 5 µgm-3 respectively (Table 4.3).
Table 4.3: Summary data for SO2 monitoring in Hawkes Bay
One-hour average Hastings 1998
24-hour average Hastings 1998
% valid data 12% % valid data 12% Hours > 350 µgm-3 0 Days > 120 µgm-3 0 99.9 %ile µgm-3 9 99.9 %ile µgm-3 5 Maximum µgm-3 12 Maximum µgm-3 5
Figure 4.2: Percentage of measured one-hour and 24-hour average SO2 concentrations within air quality categories in Hastings, 1998
One-hour 24-hour
0%
20%
40%
60%
80%
100%
Janu
ary
Febr
uary
Mar
ch
Apr
il
May
June
July
Aug
ust
Sep
tem
ber
Oct
ober
Nov
embe
r
Dec
embe
r
> Guideline 'Alert' 66–100% of guideline 'Acceptable' 33–66% of guideline 'Good' 10–33% of guideline 'Excellent' < 10% of guideline
0%
20%
40%
60%
80%
100%
Janu
ary
Febr
uary
Mar
ch
Apr
il
May
June
July
Augu
st
Sept
embe
r
Oct
ober
Nov
embe
r
Dec
embe
r
4.4 Canterbury region Concentrations of SO2 are measured at most monitoring sites within the Environment Canterbury air quality monitoring network. Measurements in Christchurch date back to 1988 and continuous SO2 monitoring have also been carried out in Timaru since 1997. Summary data for SO2 monitoring sites in the Canterbury region are shown in Table 4.4.
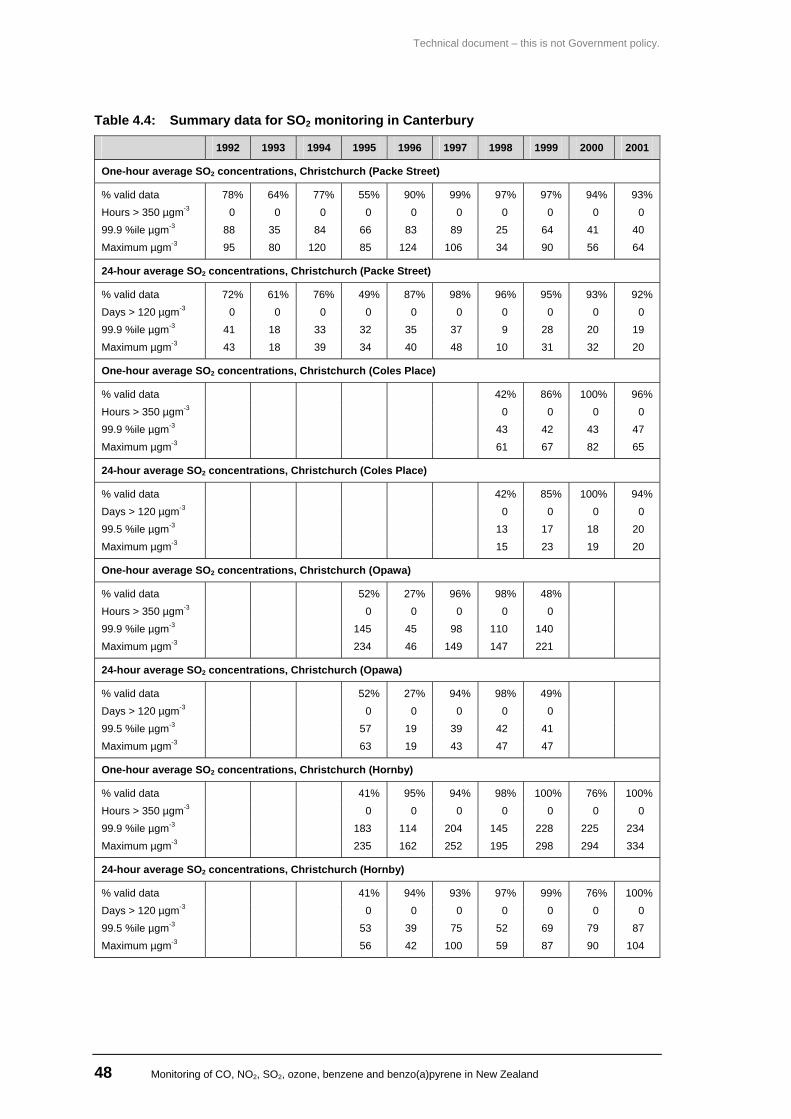
Technical document – this is not Government policy.
48 Monitoring of CO, NO2, SO2, ozone, benzene and benzo(a)pyrene in New Zealand
Table 4.4: Summary data for SO2 monitoring in Canterbury
1992 1993 1994 1995 1996 1997 1998 1999 2000 2001
One-hour average SO2 concentrations, Christchurch (Packe Street)
% valid data 78% 64% 77% 55% 90% 99% 97% 97% 94% 93% Hours > 350 µgm-3 0 0 0 0 0 0 0 0 0 0 99.9 %ile µgm-3 88 35 84 66 83 89 25 64 41 40 Maximum µgm-3 95 80 120 85 124 106 34 90 56 64
24-hour average SO2 concentrations, Christchurch (Packe Street)
% valid data 72% 61% 76% 49% 87% 98% 96% 95% 93% 92% Days > 120 µgm-3 0 0 0 0 0 0 0 0 0 0 99.9 %ile µgm-3 41 18 33 32 35 37 9 28 20 19 Maximum µgm-3 43 18 39 34 40 48 10 31 32 20
One-hour average SO2 concentrations, Christchurch (Coles Place)
% valid data 42% 86% 100% 96% Hours > 350 µgm-3 0 0 0 0 99.9 %ile µgm-3 43 42 43 47 Maximum µgm-3 61 67 82 65
24-hour average SO2 concentrations, Christchurch (Coles Place)
% valid data 42% 85% 100% 94% Days > 120 µgm-3 0 0 0 0 99.5 %ile µgm-3 13 17 18 20 Maximum µgm-3 15 23 19 20
One-hour average SO2 concentrations, Christchurch (Opawa)
% valid data 52% 27% 96% 98% 48% Hours > 350 µgm-3 0 0 0 0 0 99.9 %ile µgm-3 145 45 98 110 140 Maximum µgm-3 234 46 149 147 221
24-hour average SO2 concentrations, Christchurch (Opawa)
% valid data 52% 27% 94% 98% 49% Days > 120 µgm-3 0 0 0 0 0 99.5 %ile µgm-3 57 19 39 42 41 Maximum µgm-3 63 19 43 47 47
One-hour average SO2 concentrations, Christchurch (Hornby)
% valid data 41% 95% 94% 98% 100% 76% 100% Hours > 350 µgm-3 0 0 0 0 0 0 0 99.9 %ile µgm-3 183 114 204 145 228 225 234 Maximum µgm-3 235 162 252 195 298 294 334
24-hour average SO2 concentrations, Christchurch (Hornby)
% valid data 41% 94% 93% 97% 99% 76% 100% Days > 120 µgm-3 0 0 0 0 0 0 0 99.5 %ile µgm-3 53 39 75 52 69 79 87 Maximum µgm-3 56 42 100 59 87 90 104
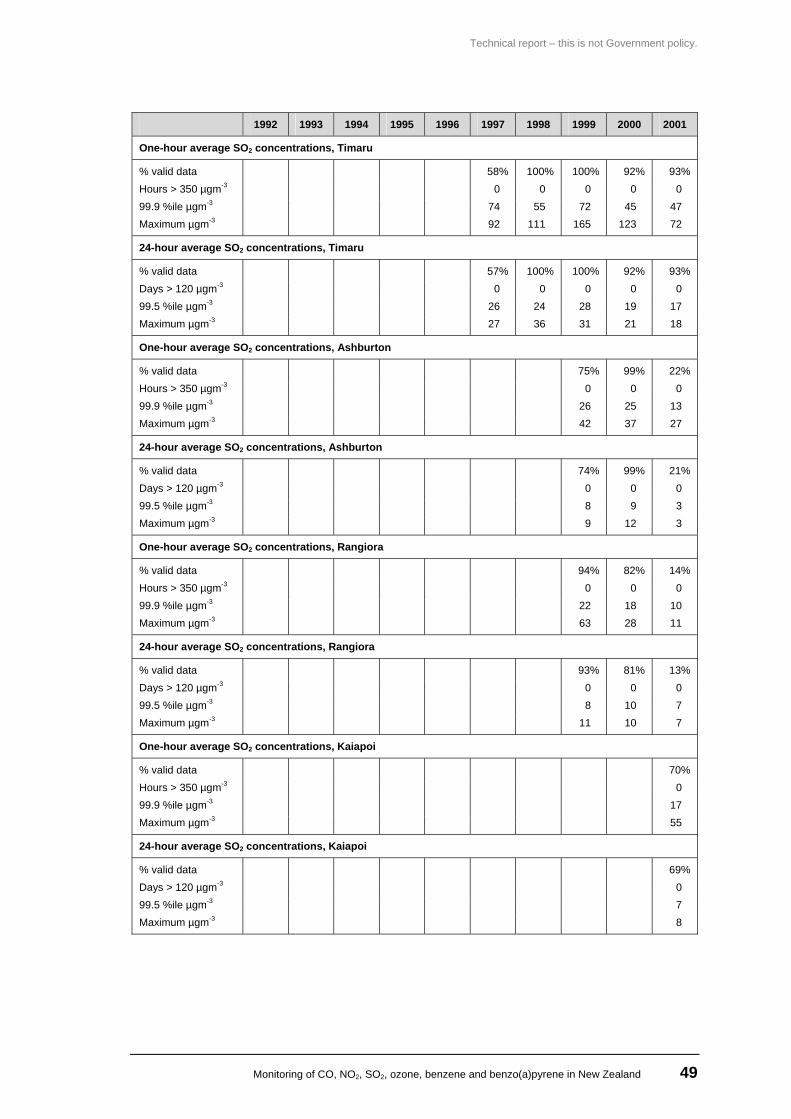
Technical report – this is not Government policy.
Monitoring of CO, NO2, SO2, ozone, benzene and benzo(a)pyrene in New Zealand 49
1992 1993 1994 1995 1996 1997 1998 1999 2000 2001
One-hour average SO2 concentrations, Timaru
% valid data 58% 100% 100% 92% 93% Hours > 350 µgm-3 0 0 0 0 0 99.9 %ile µgm-3 74 55 72 45 47 Maximum µgm-3 92 111 165 123 72
24-hour average SO2 concentrations, Timaru
% valid data 57% 100% 100% 92% 93% Days > 120 µgm-3 0 0 0 0 0 99.5 %ile µgm-3 26 24 28 19 17 Maximum µgm-3 27 36 31 21 18
One-hour average SO2 concentrations, Ashburton
% valid data 75% 99% 22% Hours > 350 µgm-3 0 0 0 99.9 %ile µgm-3 26 25 13 Maximum µgm-3 42 37 27
24-hour average SO2 concentrations, Ashburton
% valid data 74% 99% 21% Days > 120 µgm-3 0 0 0 99.5 %ile µgm-3 8 9 3 Maximum µgm-3 9 12 3
One-hour average SO2 concentrations, Rangiora
% valid data 94% 82% 14% Hours > 350 µgm-3 0 0 0 99.9 %ile µgm-3 22 18 10 Maximum µgm-3 63 28 11
24-hour average SO2 concentrations, Rangiora
% valid data 93% 81% 13% Days > 120 µgm-3 0 0 0 99.5 %ile µgm-3 8 10 7 Maximum µgm-3 11 10 7
One-hour average SO2 concentrations, Kaiapoi
% valid data 70% Hours > 350 µgm-3 0 99.9 %ile µgm-3 17 Maximum µgm-3 55
24-hour average SO2 concentrations, Kaiapoi
% valid data 69% Days > 120 µgm-3 0 99.5 %ile µgm-3 7 Maximum µgm-3 8
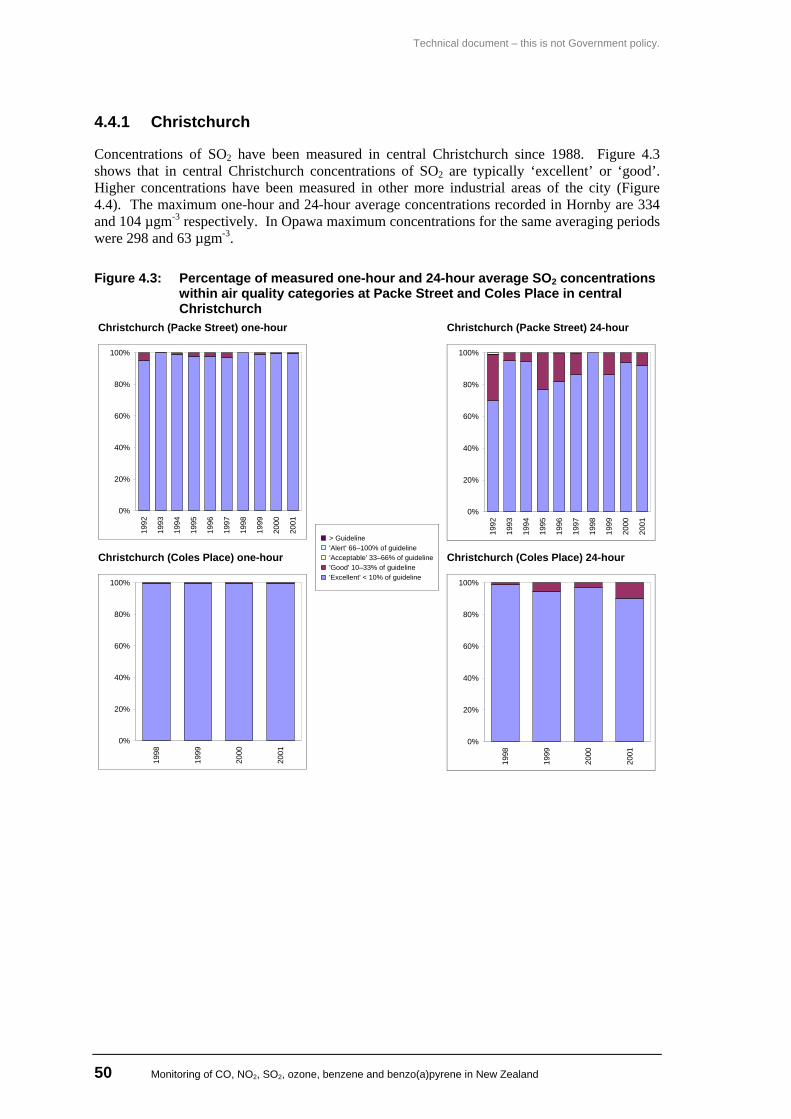
Technical document – this is not Government policy.
50 Monitoring of CO, NO2, SO2, ozone, benzene and benzo(a)pyrene in New Zealand
4.4.1 Christchurch
Concentrations of SO2 have been measured in central Christchurch since 1988. Figure 4.3 shows that in central Christchurch concentrations of SO2 are typically ‘excellent’ or ‘good’. Higher concentrations have been measured in other more industrial areas of the city (Figure 4.4). The maximum one-hour and 24-hour average concentrations recorded in Hornby are 334 and 104 µgm-3 respectively. In Opawa maximum concentrations for the same averaging periods were 298 and 63 µgm-3.
Figure 4.3: Percentage of measured one-hour and 24-hour average SO2 concentrations within air quality categories at Packe Street and Coles Place in central Christchurch
Christchurch (Packe Street) one-hour Christchurch (Packe Street) 24-hour
0%
20%
40%
60%
80%
100%
1992
1993
1994
1995
1996
1997
1998
1999
2000
2001
0%
20%
40%
60%
80%
100%
1992
1993
1994
1995
1996
1997
1998
1999
2000
2001
Christchurch (Coles Place) one-hour Christchurch (Coles Place) 24-hour
0%
20%
40%
60%
80%
100%
1998
1999
2000
2001
> Guideline 'Alert' 66–100% of guideline 'Acceptable' 33–66% of guideline 'Good' 10–33% of guideline 'Excellent' < 10% of guideline
0%
20%
40%
60%
80%
100%
1998
1999
2000
2001
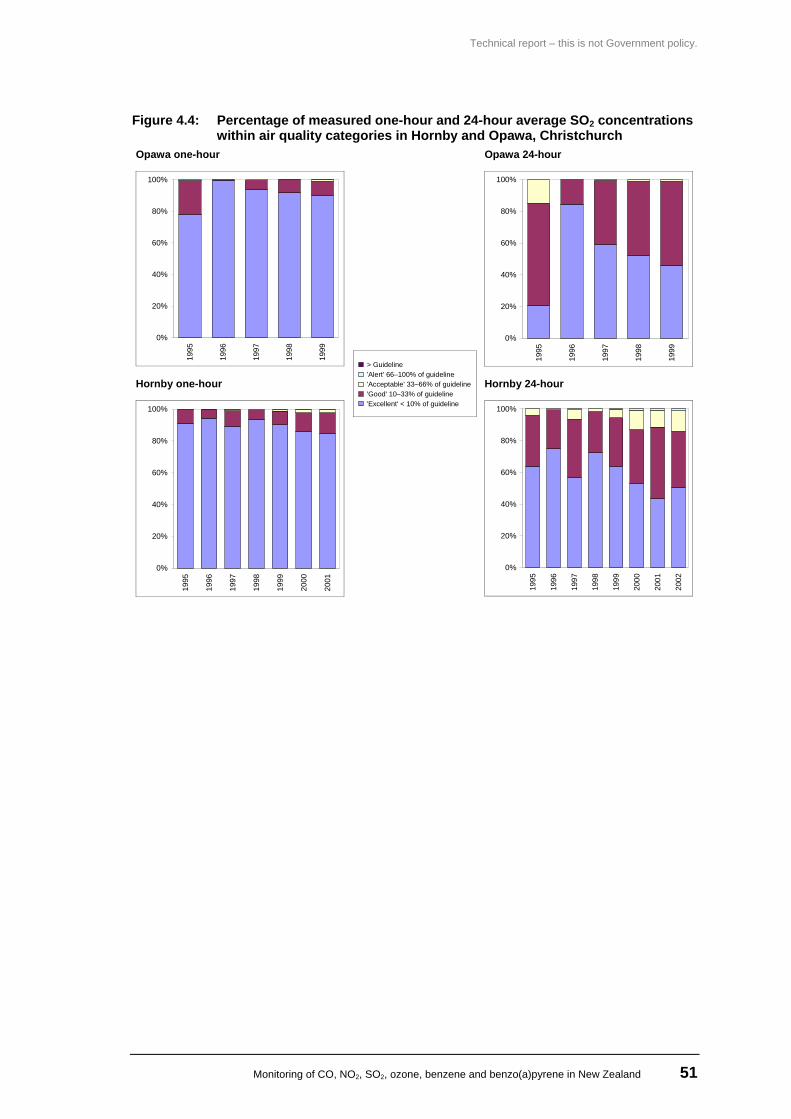
Technical report – this is not Government policy.
Monitoring of CO, NO2, SO2, ozone, benzene and benzo(a)pyrene in New Zealand 51
Figure 4.4: Percentage of measured one-hour and 24-hour average SO2 concentrations within air quality categories in Hornby and Opawa, Christchurch
Opawa one-hour Opawa 24-hour
0%
20%
40%
60%
80%
100%19
95
1996
1997
1998
1999
0%
20%
40%
60%
80%
100%
1995
1996
1997
1998
1999
Hornby one-hour Hornby 24-hour
0%
20%
40%
60%
80%
100%
1995
1996
1997
1998
1999
2000
2001
> Guideline 'Alert' 66–100% of guideline 'Acceptable' 33–66% of guideline 'Good' 10–33% of guideline 'Excellent' < 10% of guideline
0%
20%
40%
60%
80%
100%
1995
1996
1997
1998
1999
2000
2001
2002
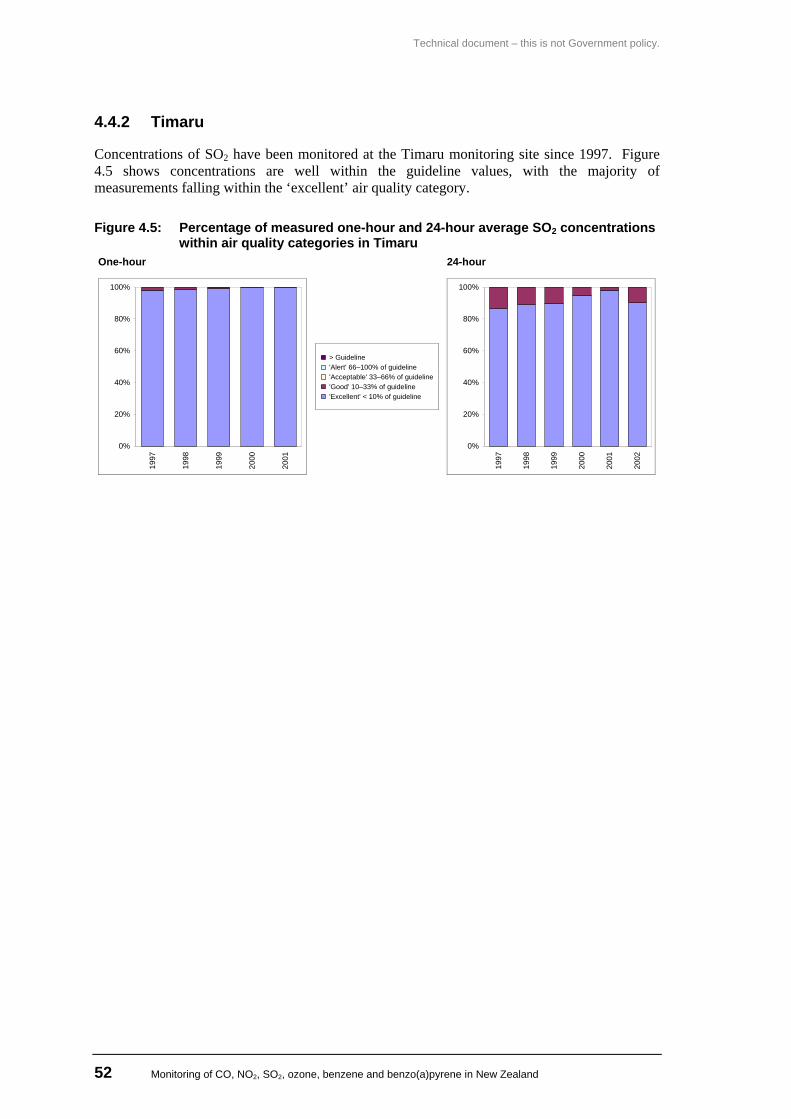
Technical document – this is not Government policy.
52 Monitoring of CO, NO2, SO2, ozone, benzene and benzo(a)pyrene in New Zealand
4.4.2 Timaru
Concentrations of SO2 have been monitored at the Timaru monitoring site since 1997. Figure 4.5 shows concentrations are well within the guideline values, with the majority of measurements falling within the ‘excellent’ air quality category.
Figure 4.5: Percentage of measured one-hour and 24-hour average SO2 concentrations within air quality categories in Timaru
One-hour 24-hour
0%
20%
40%
60%
80%
100%
1997
1998
1999
2000
2001
> Guideline 'Alert' 66–100% of guideline 'Acceptable' 33–66% of guideline 'Good' 10–33% of guideline 'Excellent' < 10% of guideline
0%
20%
40%
60%
80%
100%
1997
1998
1999
2000
2001
2002
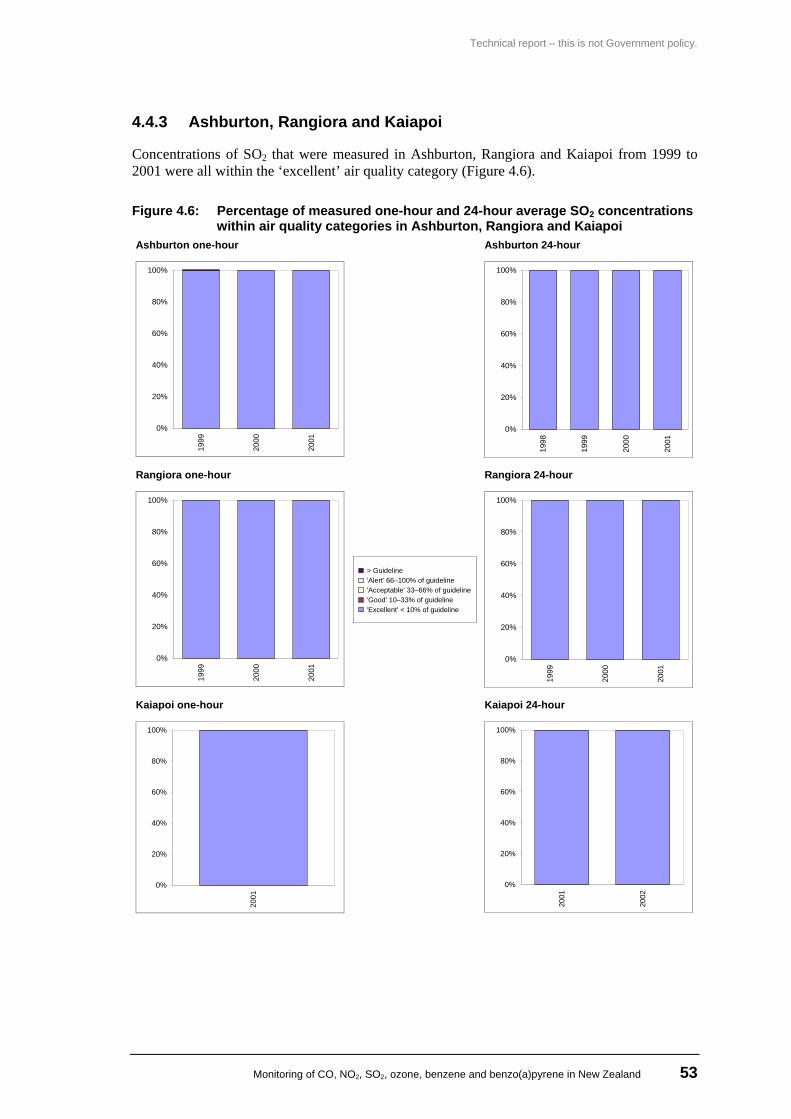
Technical report – this is not Government policy.
Monitoring of CO, NO2, SO2, ozone, benzene and benzo(a)pyrene in New Zealand 53
4.4.3 Ashburton, Rangiora and Kaiapoi
Concentrations of SO2 that were measured in Ashburton, Rangiora and Kaiapoi from 1999 to 2001 were all within the ‘excellent’ air quality category (Figure 4.6).
Figure 4.6: Percentage of measured one-hour and 24-hour average SO2 concentrations within air quality categories in Ashburton, Rangiora and Kaiapoi
Ashburton one-hour Ashburton 24-hour
0%
20%
40%
60%
80%
100%
1999
2000
2001
0%
20%
40%
60%
80%
100%
1998
1999
2000
2001
Rangiora one-hour Rangiora 24-hour
0%
20%
40%
60%
80%
100%
1999
2000
2001
> Guideline 'Alert' 66–100% of guideline 'Acceptable' 33–66% of guideline 'Good' 10–33% of guideline 'Excellent' < 10% of guideline
0%
20%
40%
60%
80%
100%
1999
2000
2001
Kaiapoi one-hour Kaiapoi 24-hour
0%
20%
40%
60%
80%
100%
2001
0%
20%
40%
60%
80%
100%
2001
2002
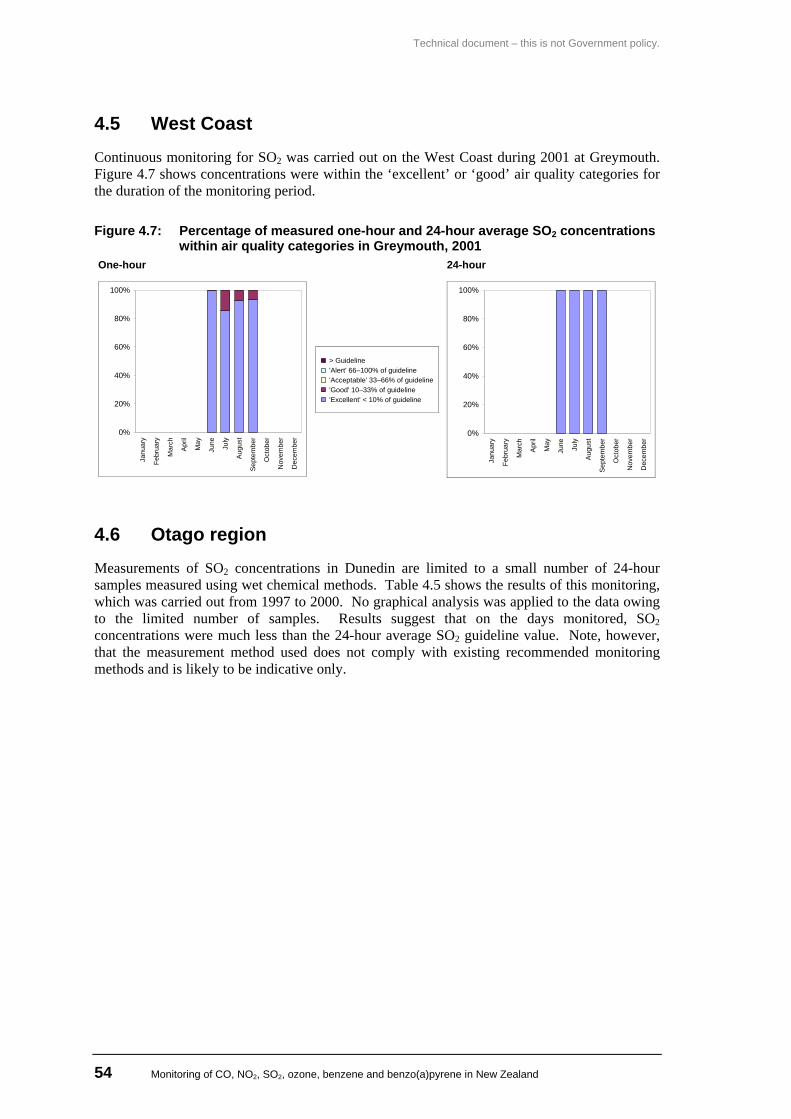
Technical document – this is not Government policy.
54 Monitoring of CO, NO2, SO2, ozone, benzene and benzo(a)pyrene in New Zealand
4.5 West Coast Continuous monitoring for SO2 was carried out on the West Coast during 2001 at Greymouth. Figure 4.7 shows concentrations were within the ‘excellent’ or ‘good’ air quality categories for the duration of the monitoring period.
Figure 4.7: Percentage of measured one-hour and 24-hour average SO2 concentrations within air quality categories in Greymouth, 2001
One-hour 24-hour
0%
20%
40%
60%
80%
100%
Janu
ary
Febr
uary
Mar
ch
Apr
il
May
June
July
Aug
ust
Sept
embe
r
Oct
ober
Nov
embe
r
Dec
embe
r
> Guideline 'Alert' 66–100% of guideline 'Acceptable' 33–66% of guideline 'Good' 10–33% of guideline 'Excellent' < 10% of guideline
0%
20%
40%
60%
80%
100%
Janu
ary
Febr
uary
Mar
ch
Apr
il
May
June
July
Aug
ust
Sep
tem
ber
Oct
ober
Nov
embe
r
Dec
embe
r
4.6 Otago region Measurements of SO2 concentrations in Dunedin are limited to a small number of 24-hour samples measured using wet chemical methods. Table 4.5 shows the results of this monitoring, which was carried out from 1997 to 2000. No graphical analysis was applied to the data owing to the limited number of samples. Results suggest that on the days monitored, SO2 concentrations were much less than the 24-hour average SO2 guideline value. Note, however, that the measurement method used does not comply with existing recommended monitoring methods and is likely to be indicative only.
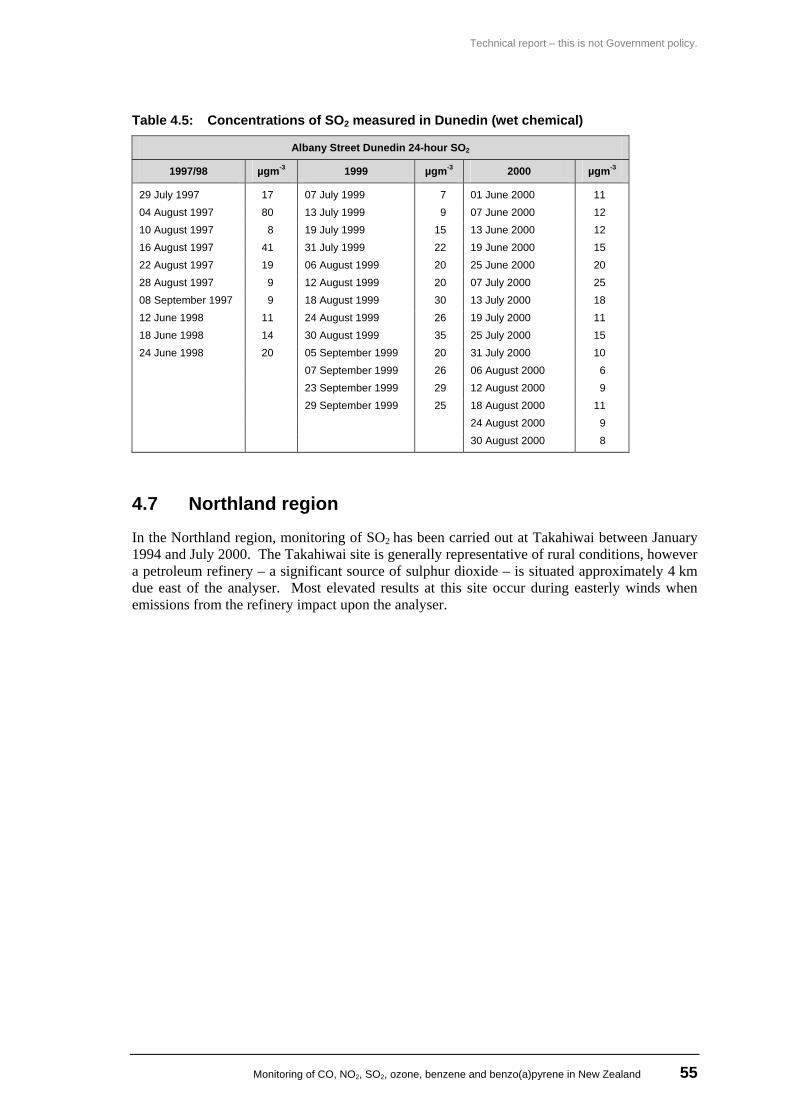
Technical report – this is not Government policy.
Monitoring of CO, NO2, SO2, ozone, benzene and benzo(a)pyrene in New Zealand 55
Table 4.5: Concentrations of SO2 measured in Dunedin (wet chemical)
Albany Street Dunedin 24-hour SO2
1997/98 µgm-3 1999 µgm-3 2000 µgm-3
29 July 1997 17 07 July 1999 7 01 June 2000 11 04 August 1997 80 13 July 1999 9 07 June 2000 12 10 August 1997 8 19 July 1999 15 13 June 2000 12 16 August 1997 41 31 July 1999 22 19 June 2000 15 22 August 1997 19 06 August 1999 20 25 June 2000 20 28 August 1997 9 12 August 1999 20 07 July 2000 25 08 September 1997 9 18 August 1999 30 13 July 2000 18 12 June 1998 11 24 August 1999 26 19 July 2000 11 18 June 1998 14 30 August 1999 35 25 July 2000 15 24 June 1998 20 05 September 1999 20 31 July 2000 10 07 September 1999 26 06 August 2000 6 23 September 1999 29 12 August 2000 9 29 September 1999 25 18 August 2000 11 24 August 2000 9 30 August 2000 8
4.7 Northland region
In the Northland region, monitoring of SO2 has been carried out at Takahiwai between January 1994 and July 2000. The Takahiwai site is generally representative of rural conditions, however a petroleum refinery – a significant source of sulphur dioxide – is situated approximately 4 km due east of the analyser. Most elevated results at this site occur during easterly winds when emissions from the refinery impact upon the analyser.
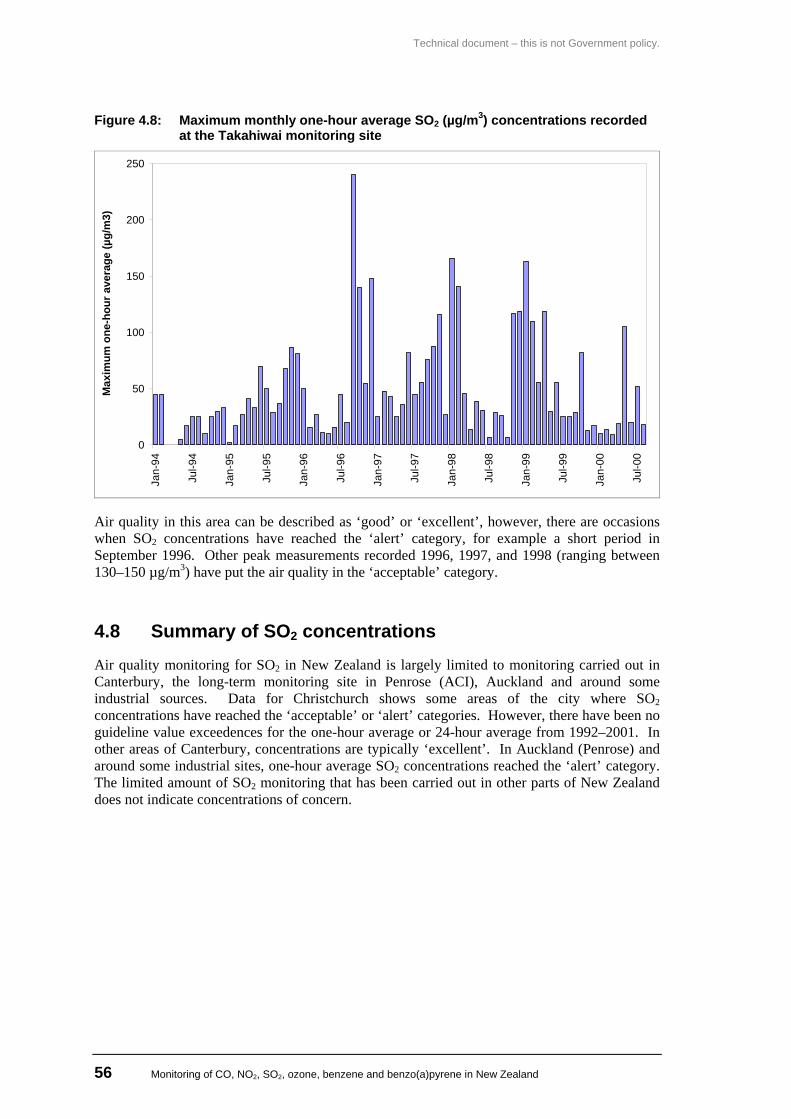
Technical document – this is not Government policy.
56 Monitoring of CO, NO2, SO2, ozone, benzene and benzo(a)pyrene in New Zealand
Figure 4.8: Maximum monthly one-hour average SO2 (µg/m3) concentrations recorded at the Takahiwai monitoring site
0
50
100
150
200
250Ja
n-94
Jul-9
4
Jan-
95
Jul-9
5
Jan-
96
Jul-9
6
Jan-
97
Jul-9
7
Jan-
98
Jul-9
8
Jan-
99
Jul-9
9
Jan-
00
Jul-0
0
Max
imum
one
-hou
r ave
rage
(µg/
m3)
Air quality in this area can be described as ‘good’ or ‘excellent’, however, there are occasions when SO2 concentrations have reached the ‘alert’ category, for example a short period in September 1996. Other peak measurements recorded 1996, 1997, and 1998 (ranging between 130–150 µg/m3) have put the air quality in the ‘acceptable’ category.
4.8 Summary of SO2 concentrations Air quality monitoring for SO2 in New Zealand is largely limited to monitoring carried out in Canterbury, the long-term monitoring site in Penrose (ACI), Auckland and around some industrial sources. Data for Christchurch shows some areas of the city where SO2 concentrations have reached the ‘acceptable’ or ‘alert’ categories. However, there have been no guideline value exceedences for the one-hour average or 24-hour average from 1992–2001. In other areas of Canterbury, concentrations are typically ‘excellent’. In Auckland (Penrose) and around some industrial sites, one-hour average SO2 concentrations reached the ‘alert’ category. The limited amount of SO2 monitoring that has been carried out in other parts of New Zealand does not indicate concentrations of concern.
Technical report – this is not Government policy.
Monitoring of CO, NO2, SO2, ozone, benzene and benzo(a)pyrene in New Zealand 57
5 Ozone Concentrations of ozone in New Zealand have been measured in Auckland and on the outskirts of Christchurch. Results of this monitoring are compared to the following ambient air quality guideline values for New Zealand: • 150 mgm-3 (one-hour average) • 100 mgm-3 (eight-hour average).
The recommended monitoring method for ozone in New Zealand is AS3580.6.1 – 1990. This method specifies UV absorption. All data presented in this section are based on monitoring methods that comply with AS3580.6.1 – 1990, which is the recommended method in the Good Practice Guide for Air Quality Monitoring and Data Management (MfE, 2000) and is the required method in the Ambient Air Quality Guidelines (MfE and MoH, 2002).
5.1 Auckland
Concentrations of ozone have been measured in a number of locations in Auckland. Figure 5.1 shows the percentage of O3 concentrations measured in Pukekohe and Musick Point from 1997 to 2001. Results are within the air quality categories, however, more recent monitoring at Musick Point in 2002 (not shown on the graph) has recorded 2 exceedences of the eight-hour guideline value. The majority of the measured concentrations in these locations are between 10% and 66% of the guideline values, with less than 20% of the data within the ‘alert’ category. At Pukekohe the maximum eight-hour average concentration was 96 µgm-3.
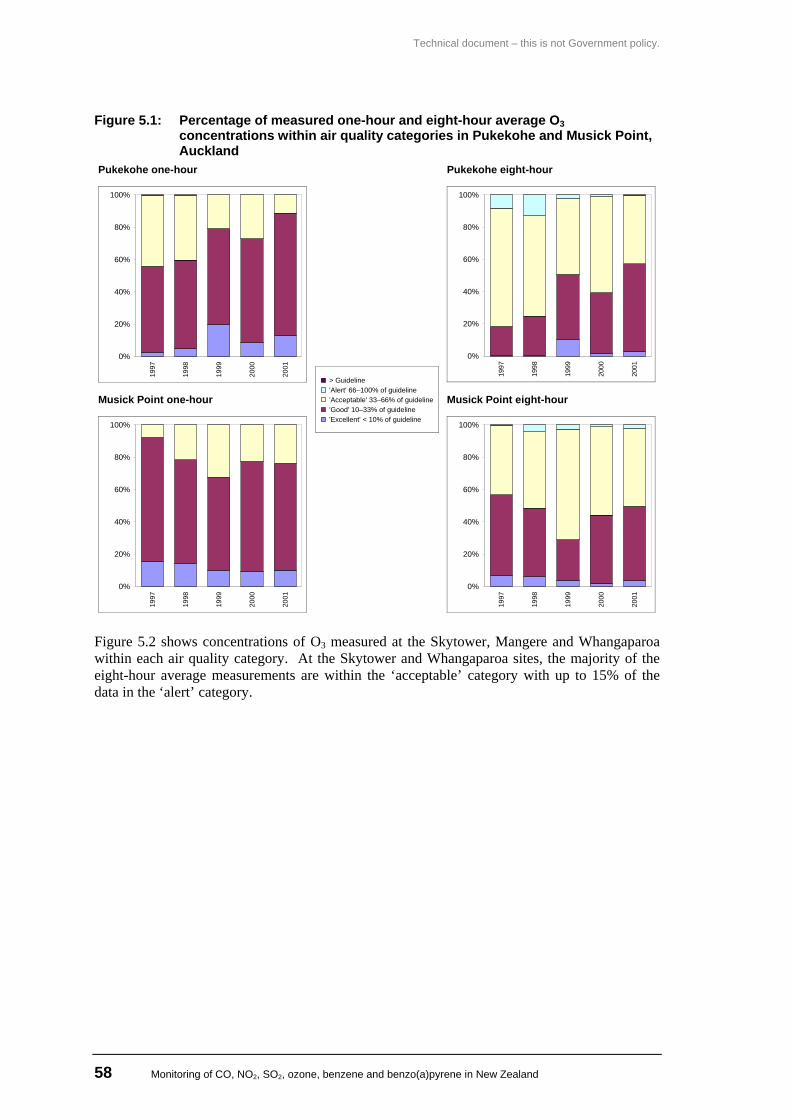
Technical document – this is not Government policy.
58 Monitoring of CO, NO2, SO2, ozone, benzene and benzo(a)pyrene in New Zealand
Figure 5.1: Percentage of measured one-hour and eight-hour average O3 concentrations within air quality categories in Pukekohe and Musick Point, Auckland
Pukekohe one-hour Pukekohe eight-hour
0%
20%
40%
60%
80%
100%
1997
1998
1999
2000
2001
0%
20%
40%
60%
80%
100%
1997
1998
1999
2000
2001
Musick Point one-hour Musick Point eight-hour
0%
20%
40%
60%
80%
100%
1997
1998
1999
2000
2001
> Guideline 'Alert' 66–100% of guideline 'Acceptable' 33–66% of guideline 'Good' 10–33% of guideline 'Excellent' < 10% of guideline
0%
20%
40%
60%
80%
100%
1997
1998
1999
2000
2001
Figure 5.2 shows concentrations of O3 measured at the Skytower, Mangere and Whangaparoa within each air quality category. At the Skytower and Whangaparoa sites, the majority of the eight-hour average measurements are within the ‘acceptable’ category with up to 15% of the data in the ‘alert’ category.
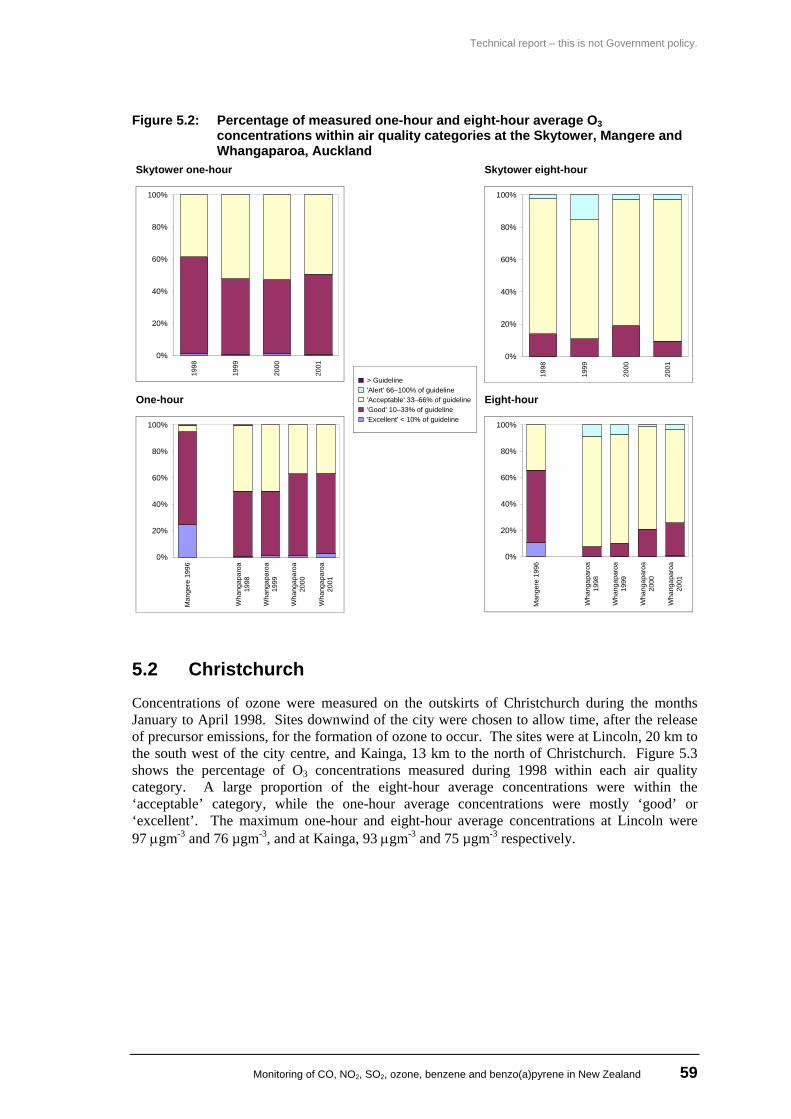
Technical report – this is not Government policy.
Monitoring of CO, NO2, SO2, ozone, benzene and benzo(a)pyrene in New Zealand 59
Figure 5.2: Percentage of measured one-hour and eight-hour average O3 concentrations within air quality categories at the Skytower, Mangere and Whangaparoa, Auckland
Skytower one-hour Skytower eight-hour
0%
20%
40%
60%
80%
100%19
98
1999
2000
2001
0%
20%
40%
60%
80%
100%
1998
1999
2000
2001
One-hour Eight-hour
0%
20%
40%
60%
80%
100%
Man
gere
199
6
Wha
ngap
aroa
1998
Wha
ngap
aroa
1999
Wha
ngap
aroa
2000
Wha
ngap
aroa
2001
> Guideline 'Alert' 66–100% of guideline 'Acceptable' 33–66% of guideline 'Good' 10–33% of guideline 'Excellent' < 10% of guideline
0%
20%
40%
60%
80%
100%
Man
gere
199
6
Wha
ngap
aroa
1998
Wha
ngap
aroa
1999
Wha
ngap
aroa
2000
Wha
ngap
aroa
2001
5.2 Christchurch Concentrations of ozone were measured on the outskirts of Christchurch during the months January to April 1998. Sites downwind of the city were chosen to allow time, after the release of precursor emissions, for the formation of ozone to occur. The sites were at Lincoln, 20 km to the south west of the city centre, and Kainga, 13 km to the north of Christchurch. Figure 5.3 shows the percentage of O3 concentrations measured during 1998 within each air quality category. A large proportion of the eight-hour average concentrations were within the ‘acceptable’ category, while the one-hour average concentrations were mostly ‘good’ or ‘excellent’. The maximum one-hour and eight-hour average concentrations at Lincoln were 97 µgm-3 and 76 µgm-3, and at Kainga, 93 µgm-3 and 75 µgm-3 respectively.
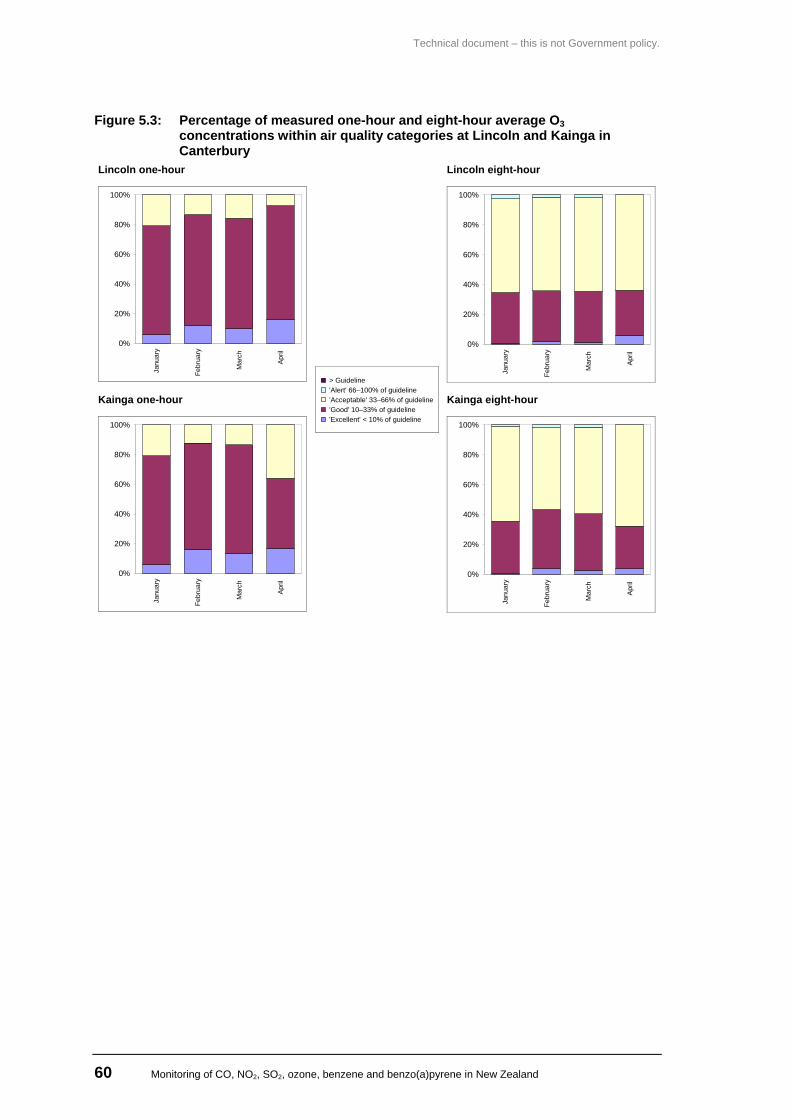
Technical document – this is not Government policy.
60 Monitoring of CO, NO2, SO2, ozone, benzene and benzo(a)pyrene in New Zealand
Figure 5.3: Percentage of measured one-hour and eight-hour average O3 concentrations within air quality categories at Lincoln and Kainga in Canterbury
Lincoln one-hour Lincoln eight-hour
0%
20%
40%
60%
80%
100%
Janu
ary
Febr
uary
Mar
ch
April
0%
20%
40%
60%
80%
100%
Janu
ary
Febr
uary
Mar
ch
Apr
il
Kainga one-hour Kainga eight-hour
0%
20%
40%
60%
80%
100%
Janu
ary
Febr
uary
Mar
ch
April
> Guideline 'Alert' 66–100% of guideline 'Acceptable' 33–66% of guideline 'Good' 10–33% of guideline 'Excellent' < 10% of guideline
0%
20%
40%
60%
80%
100%
Janu
ary
Febr
uary
Mar
ch
Apr
il
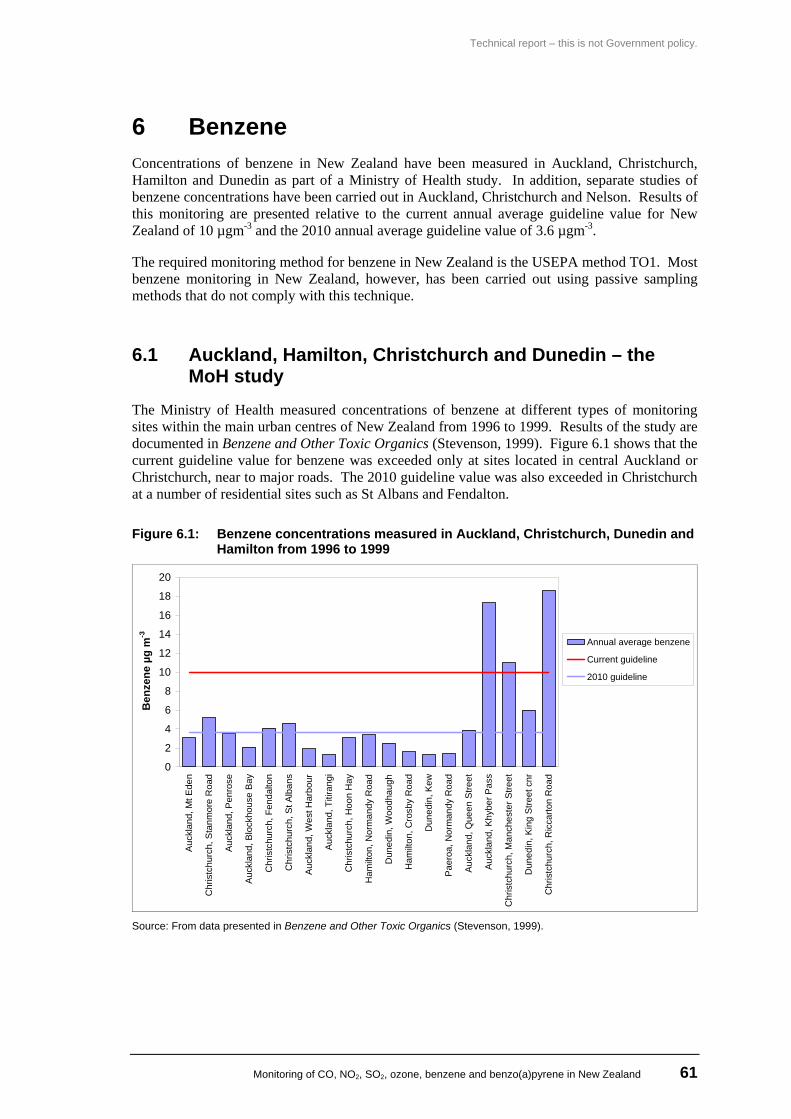
Technical report – this is not Government policy.
Monitoring of CO, NO2, SO2, ozone, benzene and benzo(a)pyrene in New Zealand 61
6 Benzene Concentrations of benzene in New Zealand have been measured in Auckland, Christchurch, Hamilton and Dunedin as part of a Ministry of Health study. In addition, separate studies of benzene concentrations have been carried out in Auckland, Christchurch and Nelson. Results of this monitoring are presented relative to the current annual average guideline value for New Zealand of 10 µgm-3 and the 2010 annual average guideline value of 3.6 µgm-3.
The required monitoring method for benzene in New Zealand is the USEPA method TO1. Most benzene monitoring in New Zealand, however, has been carried out using passive sampling methods that do not comply with this technique.
6.1 Auckland, Hamilton, Christchurch and Dunedin – the MoH study
The Ministry of Health measured concentrations of benzene at different types of monitoring sites within the main urban centres of New Zealand from 1996 to 1999. Results of the study are documented in Benzene and Other Toxic Organics (Stevenson, 1999). Figure 6.1 shows that the current guideline value for benzene was exceeded only at sites located in central Auckland or Christchurch, near to major roads. The 2010 guideline value was also exceeded in Christchurch at a number of residential sites such as St Albans and Fendalton.
Figure 6.1: Benzene concentrations measured in Auckland, Christchurch, Dunedin and Hamilton from 1996 to 1999
0
2
4
6
8
10
12
14
16
18
20
Auc
klan
d, M
t Ede
n
Chr
istc
hurc
h, S
tanm
ore
Roa
d
Auc
klan
d, P
enro
se
Auck
land
, Blo
ckho
use
Bay
Chr
istc
hurc
h, F
enda
lton
Chr
istc
hurc
h, S
t Alb
ans
Auc
klan
d, W
est H
arbo
ur
Auc
klan
d, T
itira
ngi
Chr
istc
hurc
h, H
oon
Hay
Ham
ilton
, Nor
man
dy R
oad
Dun
edin
, Woo
dhau
gh
Ham
ilton
, Cro
sby
Roa
d
Dun
edin
, Kew
Pae
roa,
Nor
man
dy R
oad
Auck
land
, Que
en S
treet
Auck
land
, Khy
ber P
ass
Chr
istc
hurc
h, M
anch
este
r Stre
et
Dun
edin
, Kin
g St
reet
cnr
Chr
istc
hurc
h, R
icca
rton
Roa
d
Ben
zene
µg
m-3
Annual average benzene
Current guideline
2010 guideline
Source: From data presented in Benzene and Other Toxic Organics (Stevenson, 1999).
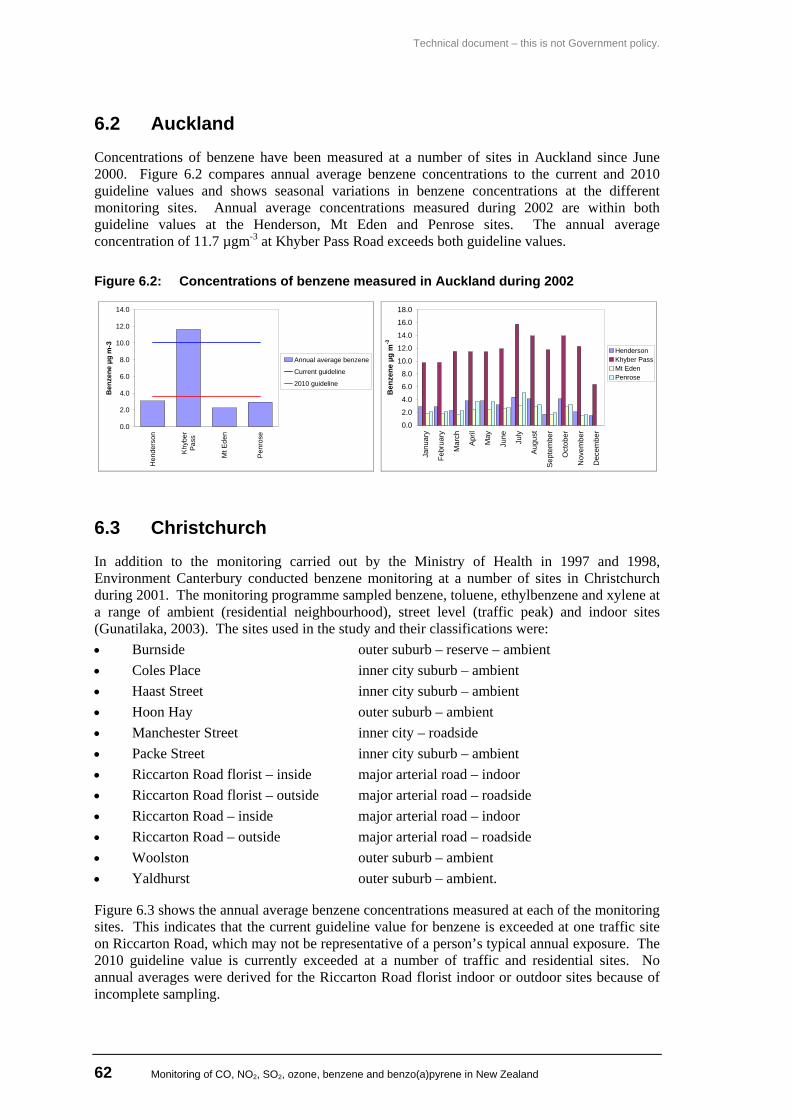
Technical document – this is not Government policy.
62 Monitoring of CO, NO2, SO2, ozone, benzene and benzo(a)pyrene in New Zealand
6.2 Auckland Concentrations of benzene have been measured at a number of sites in Auckland since June 2000. Figure 6.2 compares annual average benzene concentrations to the current and 2010 guideline values and shows seasonal variations in benzene concentrations at the different monitoring sites. Annual average concentrations measured during 2002 are within both guideline values at the Henderson, Mt Eden and Penrose sites. The annual average concentration of 11.7 µgm-3 at Khyber Pass Road exceeds both guideline values.
Figure 6.2: Concentrations of benzene measured in Auckland during 2002
0.0
2.0
4.0
6.0
8.0
10.0
12.0
14.0
Hen
ders
on
Khy
ber
Pass
Mt E
den
Pen
rose
Ben
zene
µg
m-3
Annual average benzene
Current guideline
2010 guideline
0.0
2.0
4.0
6.0
8.0
10.0
12.0
14.0
16.0
18.0
Janu
ary
Febr
uary
Mar
ch
April
May
June July
Aug
ust
Sep
tem
ber
Oct
ober
Nov
embe
r
Dec
embe
r
Ben
zene
µg
m-3
HendersonKhyber PassMt EdenPenrose
6.3 Christchurch In addition to the monitoring carried out by the Ministry of Health in 1997 and 1998, Environment Canterbury conducted benzene monitoring at a number of sites in Christchurch during 2001. The monitoring programme sampled benzene, toluene, ethylbenzene and xylene at a range of ambient (residential neighbourhood), street level (traffic peak) and indoor sites (Gunatilaka, 2003). The sites used in the study and their classifications were: • Burnside outer suburb – reserve – ambient • Coles Place inner city suburb – ambient • Haast Street inner city suburb – ambient • Hoon Hay outer suburb – ambient • Manchester Street inner city – roadside • Packe Street inner city suburb – ambient • Riccarton Road florist – inside major arterial road – indoor • Riccarton Road florist – outside major arterial road – roadside • Riccarton Road – inside major arterial road – indoor • Riccarton Road – outside major arterial road – roadside • Woolston outer suburb – ambient • Yaldhurst outer suburb – ambient.
Figure 6.3 shows the annual average benzene concentrations measured at each of the monitoring sites. This indicates that the current guideline value for benzene is exceeded at one traffic site on Riccarton Road, which may not be representative of a person’s typical annual exposure. The 2010 guideline value is currently exceeded at a number of traffic and residential sites. No annual averages were derived for the Riccarton Road florist indoor or outdoor sites because of incomplete sampling.
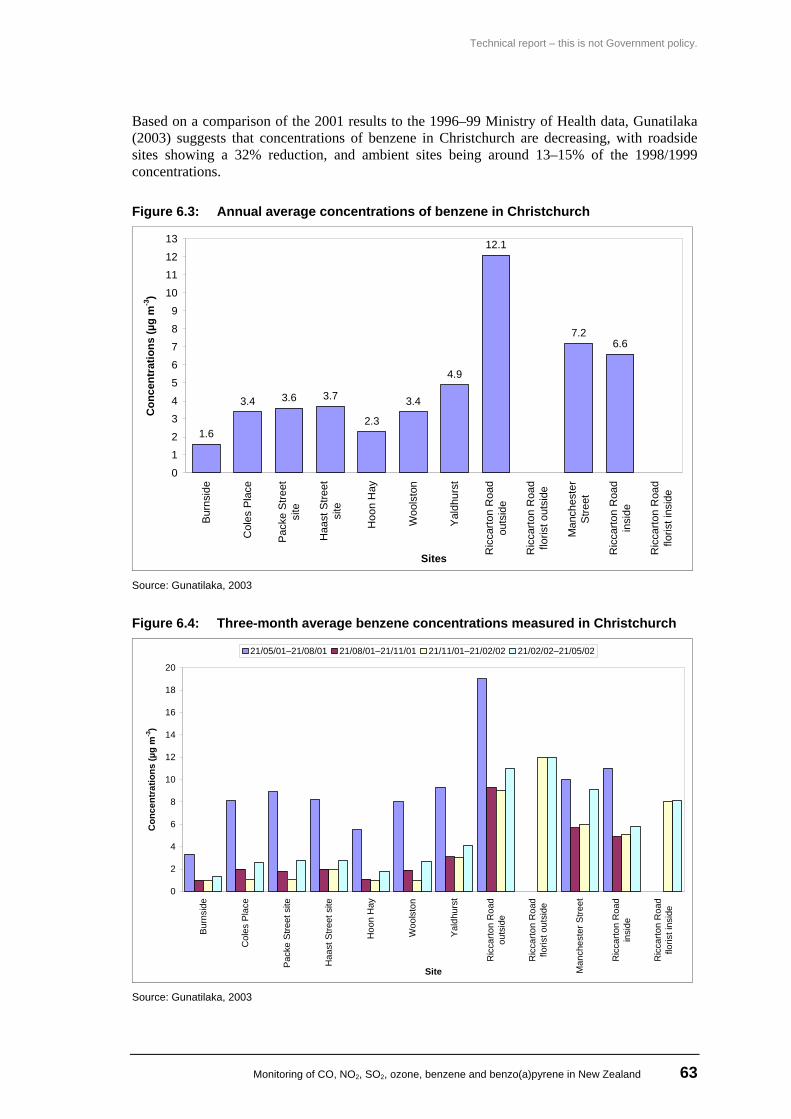
Technical report – this is not Government policy.
Monitoring of CO, NO2, SO2, ozone, benzene and benzo(a)pyrene in New Zealand 63
Based on a comparison of the 2001 results to the 1996–99 Ministry of Health data, Gunatilaka (2003) suggests that concentrations of benzene in Christchurch are decreasing, with roadside sites showing a 32% reduction, and ambient sites being around 13–15% of the 1998/1999 concentrations.
Figure 6.3: Annual average concentrations of benzene in Christchurch
1.6
3.4 3.6 3.7
2.3
3.4
4.9
12.1
7.26.6
0
1
2
3
4
5
6
7
8
9
10
11
12
13
Bur
nsid
e
Col
es P
lace
Pack
e S
treet
site
Haa
st S
treet
site
Hoo
n H
ay
Woo
lsto
n
Yal
dhur
st
Ric
carto
n R
oad
outs
ide
Ric
carto
n R
oad
floris
t out
side
Man
ches
ter
Stre
et
Ric
carto
n R
oad
insi
de
Ric
carto
n R
oad
floris
t ins
ide
Sites
Con
cent
ratio
ns (µ
g m
-3)
Source: Gunatilaka, 2003
Figure 6.4: Three-month average benzene concentrations measured in Christchurch
0
2
4
6
8
10
12
14
16
18
20
Bur
nsid
e
Col
es P
lace
Pac
ke S
treet
site
Haa
st S
treet
site
Hoo
n H
ay
Woo
lsto
n
Yal
dhur
st
Ric
carto
n R
oad
outs
ide
Ric
carto
n R
oad
floris
t out
side
Man
ches
ter S
treet
Ric
carto
n R
oad
insi
de
Ric
carto
n R
oad
floris
t ins
ide
Site
Con
cent
ratio
ns (µ
g m
-3)
21/05/01–21/08/01 21/08/01–21/11/01 21/11/01–21/02/02 21/02/02–21/05/02
Source: Gunatilaka, 2003
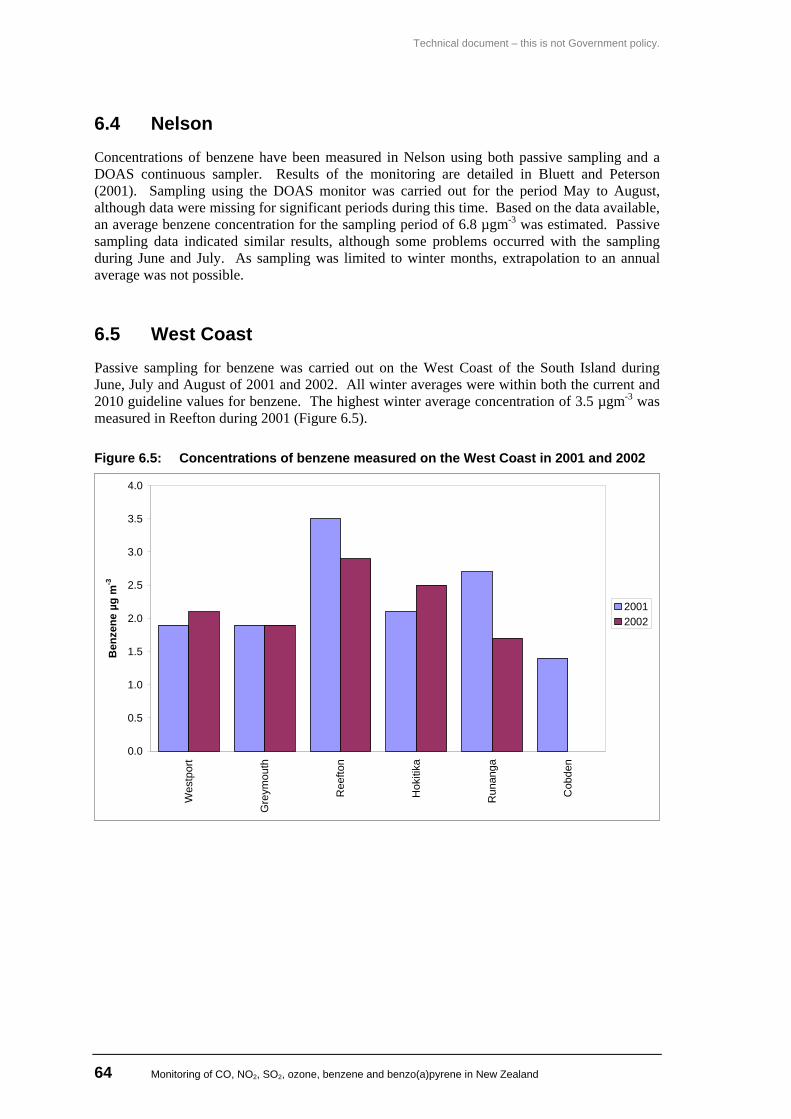
Technical document – this is not Government policy.
64 Monitoring of CO, NO2, SO2, ozone, benzene and benzo(a)pyrene in New Zealand
6.4 Nelson Concentrations of benzene have been measured in Nelson using both passive sampling and a DOAS continuous sampler. Results of the monitoring are detailed in Bluett and Peterson (2001). Sampling using the DOAS monitor was carried out for the period May to August, although data were missing for significant periods during this time. Based on the data available, an average benzene concentration for the sampling period of 6.8 µgm-3 was estimated. Passive sampling data indicated similar results, although some problems occurred with the sampling during June and July. As sampling was limited to winter months, extrapolation to an annual average was not possible.
6.5 West Coast Passive sampling for benzene was carried out on the West Coast of the South Island during June, July and August of 2001 and 2002. All winter averages were within both the current and 2010 guideline values for benzene. The highest winter average concentration of 3.5 µgm-3 was measured in Reefton during 2001 (Figure 6.5).
Figure 6.5: Concentrations of benzene measured on the West Coast in 2001 and 2002
0.0
0.5
1.0
1.5
2.0
2.5
3.0
3.5
4.0
Wes
tpor
t
Gre
ymou
th
Ree
fton
Hok
itika
Run
anga
Cob
den
Ben
zene
µg
m-3
20012002
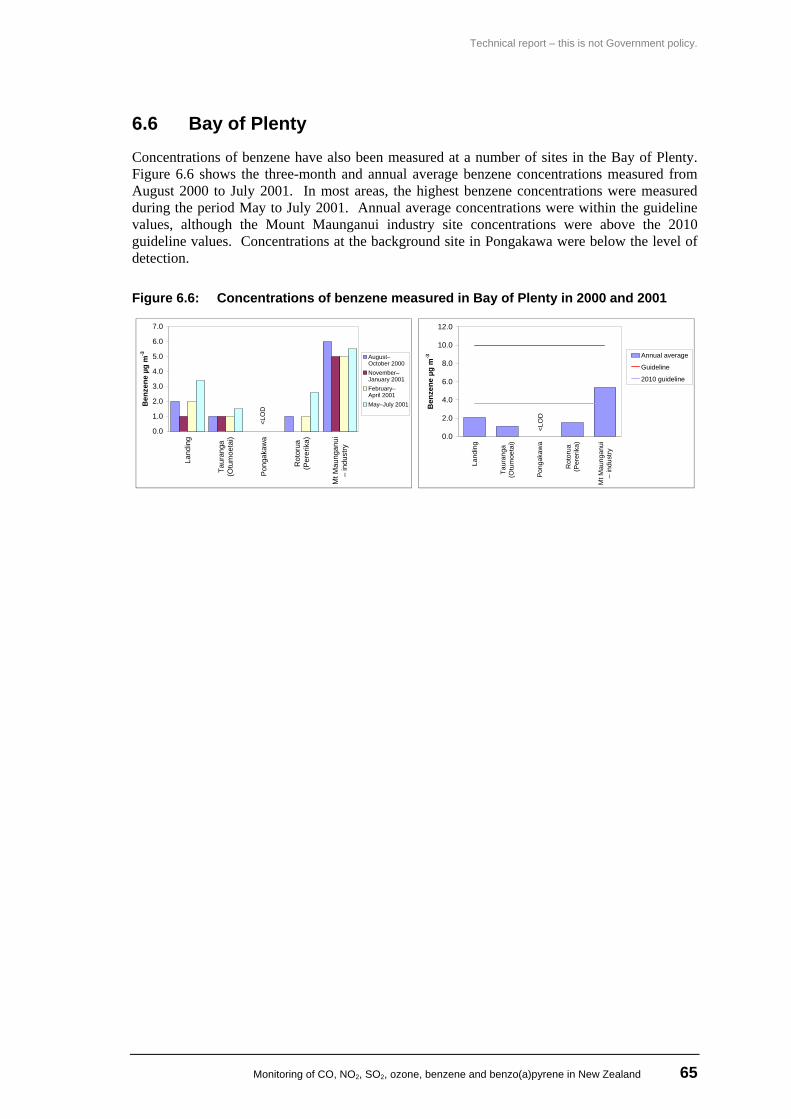
Technical report – this is not Government policy.
Monitoring of CO, NO2, SO2, ozone, benzene and benzo(a)pyrene in New Zealand 65
6.6 Bay of Plenty Concentrations of benzene have also been measured at a number of sites in the Bay of Plenty. Figure 6.6 shows the three-month and annual average benzene concentrations measured from August 2000 to July 2001. In most areas, the highest benzene concentrations were measured during the period May to July 2001. Annual average concentrations were within the guideline values, although the Mount Maunganui industry site concentrations were above the 2010 guideline values. Concentrations at the background site in Pongakawa were below the level of detection.
Figure 6.6: Concentrations of benzene measured in Bay of Plenty in 2000 and 2001
0.0
1.0
2.0
3.0
4.0
5.0
6.0
7.0
Land
ing
Taur
anga
(Otu
moe
tai)
Pon
gaka
wa
Rot
orua
(Per
erik
a)
Mt M
aung
anui
– in
dust
ry
Ben
zene
µg
m-3 August–
October 2000November–January 2001February–April 2001May–July 2001
<LO
D
0.0
2.0
4.0
6.0
8.0
10.0
12.0
Land
ing
Taur
anga
(Otu
moe
tai)
Pong
akaw
a
Rot
orua
(Per
erik
a)
Mt M
aung
anui
– in
dust
ry
Ben
zene
µg
m-3 Annual average
Guideline
2010 guideline
<LO
D
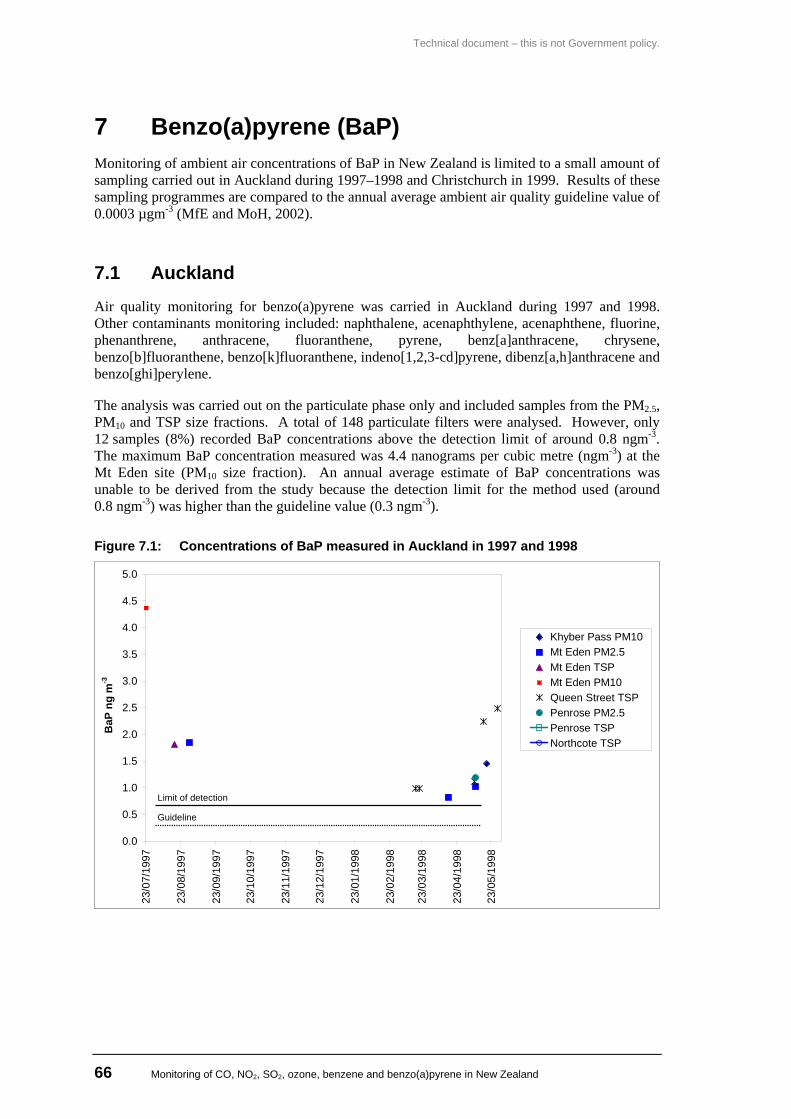
Technical document – this is not Government policy.
66 Monitoring of CO, NO2, SO2, ozone, benzene and benzo(a)pyrene in New Zealand
7 Benzo(a)pyrene (BaP) Monitoring of ambient air concentrations of BaP in New Zealand is limited to a small amount of sampling carried out in Auckland during 1997–1998 and Christchurch in 1999. Results of these sampling programmes are compared to the annual average ambient air quality guideline value of 0.0003 µgm-3 (MfE and MoH, 2002).
7.1 Auckland Air quality monitoring for benzo(a)pyrene was carried in Auckland during 1997 and 1998. Other contaminants monitoring included: naphthalene, acenaphthylene, acenaphthene, fluorine, phenanthrene, anthracene, fluoranthene, pyrene, benz[a]anthracene, chrysene, benzo[b]fluoranthene, benzo[k]fluoranthene, indeno[1,2,3-cd]pyrene, dibenz[a,h]anthracene and benzo[ghi]perylene.
The analysis was carried out on the particulate phase only and included samples from the PM2.5, PM10 and TSP size fractions. A total of 148 particulate filters were analysed. However, only 12 samples (8%) recorded BaP concentrations above the detection limit of around 0.8 ngm-3. The maximum BaP concentration measured was 4.4 nanograms per cubic metre (ngm-3) at the Mt Eden site (PM10 size fraction). An annual average estimate of BaP concentrations was unable to be derived from the study because the detection limit for the method used (around 0.8 ngm-3) was higher than the guideline value (0.3 ngm-3).
Figure 7.1: Concentrations of BaP measured in Auckland in 1997 and 1998
0.0
0.5
1.0
1.5
2.0
2.5
3.0
3.5
4.0
4.5
5.0
23/0
7/19
97
23/0
8/19
97
23/0
9/19
97
23/1
0/19
97
23/1
1/19
97
23/1
2/19
97
23/0
1/19
98
23/0
2/19
98
23/0
3/19
98
23/0
4/19
98
23/0
5/19
98
BaP
ng
m-3
Khyber Pass PM10Mt Eden PM2.5Mt Eden TSPMt Eden PM10Queen Street TSPPenrose PM2.5Penrose TSP Northcote TSP
Limit of detection
Guideline
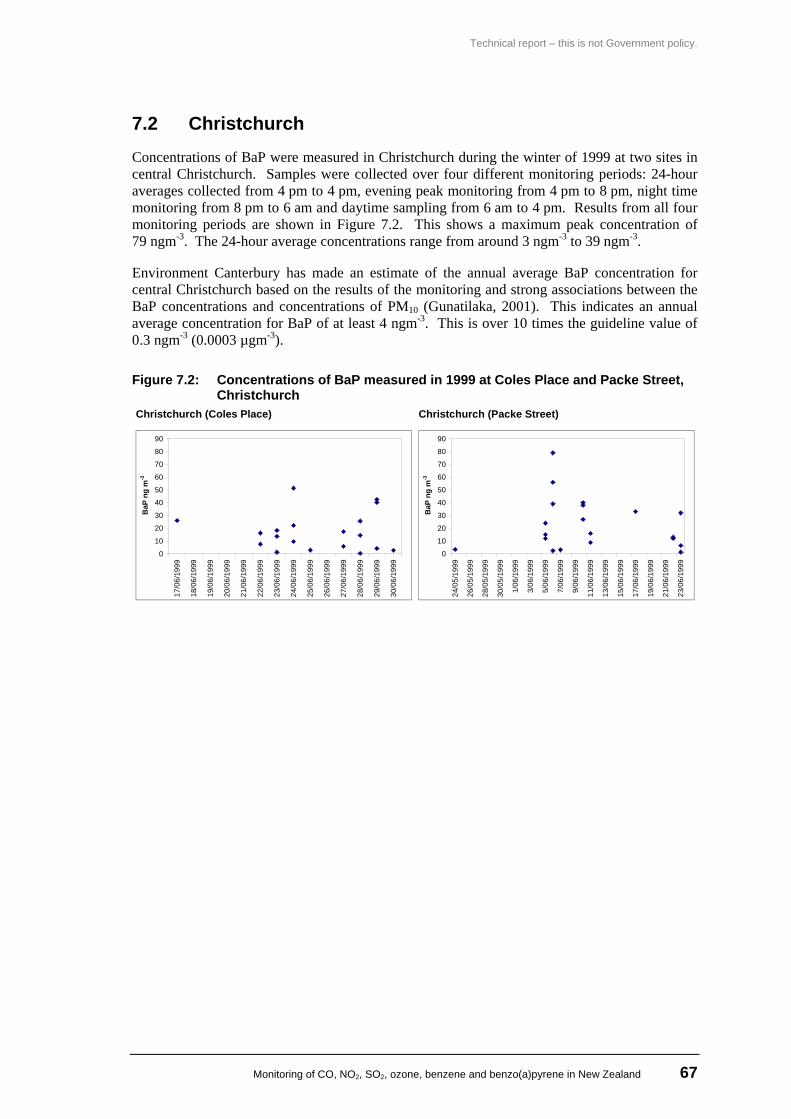
Technical report – this is not Government policy.
Monitoring of CO, NO2, SO2, ozone, benzene and benzo(a)pyrene in New Zealand 67
7.2 Christchurch Concentrations of BaP were measured in Christchurch during the winter of 1999 at two sites in central Christchurch. Samples were collected over four different monitoring periods: 24-hour averages collected from 4 pm to 4 pm, evening peak monitoring from 4 pm to 8 pm, night time monitoring from 8 pm to 6 am and daytime sampling from 6 am to 4 pm. Results from all four monitoring periods are shown in Figure 7.2. This shows a maximum peak concentration of 79 ngm-3. The 24-hour average concentrations range from around 3 ngm-3 to 39 ngm-3.
Environment Canterbury has made an estimate of the annual average BaP concentration for central Christchurch based on the results of the monitoring and strong associations between the BaP concentrations and concentrations of PM10 (Gunatilaka, 2001). This indicates an annual average concentration for BaP of at least 4 ngm-3. This is over 10 times the guideline value of 0.3 ngm-3 (0.0003 µgm-3).
Figure 7.2: Concentrations of BaP measured in 1999 at Coles Place and Packe Street, Christchurch
Christchurch (Coles Place) Christchurch (Packe Street)
0
10
20
30
40
50
60
70
80
90
17/0
6/19
99
18/0
6/19
99
19/0
6/19
99
20/0
6/19
99
21/0
6/19
99
22/0
6/19
99
23/0
6/19
99
24/0
6/19
99
25/0
6/19
99
26/0
6/19
99
27/0
6/19
99
28/0
6/19
99
29/0
6/19
99
30/0
6/19
99
BaP
ng
m-3
0
10
20
30
40
50
60
70
80
90
24/0
5/19
99
26/0
5/19
99
28/0
5/19
99
30/0
5/19
99
1/06
/199
9
3/06
/199
9
5/06
/199
9
7/06
/199
9
9/06
/199
9
11/0
6/19
99
13/0
6/19
99
15/0
6/19
99
17/0
6/19
99
19/0
6/19
99
21/0
6/19
99
23/0
6/19
99
BaP
ng
m-3
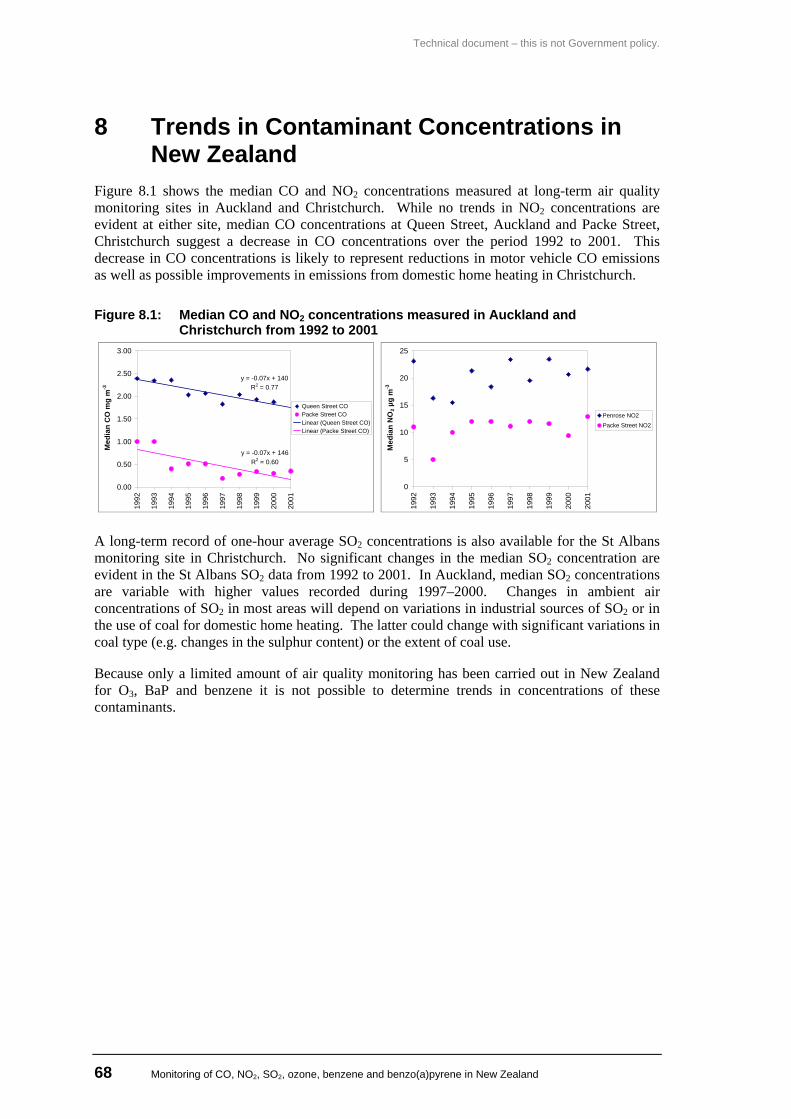
Technical document – this is not Government policy.
68 Monitoring of CO, NO2, SO2, ozone, benzene and benzo(a)pyrene in New Zealand
8 Trends in Contaminant Concentrations in New Zealand
Figure 8.1 shows the median CO and NO2 concentrations measured at long-term air quality monitoring sites in Auckland and Christchurch. While no trends in NO2 concentrations are evident at either site, median CO concentrations at Queen Street, Auckland and Packe Street, Christchurch suggest a decrease in CO concentrations over the period 1992 to 2001. This decrease in CO concentrations is likely to represent reductions in motor vehicle CO emissions as well as possible improvements in emissions from domestic home heating in Christchurch.
Figure 8.1: Median CO and NO2 concentrations measured in Auckland and Christchurch from 1992 to 2001
y = -0.07x + 140R2 = 0.77
y = -0.07x + 146R2 = 0.60
0.00
0.50
1.00
1.50
2.00
2.50
3.00
1992
1993
1994
1995
1996
1997
1998
1999
2000
2001
Med
ian
CO
mg
m-3
Queen Street COPacke Street COLinear (Queen Street CO)Linear (Packe Street CO)
0
5
10
15
20
25
1992
1993
1994
1995
1996
1997
1998
1999
2000
2001
Med
ian
NO
2 µg
m-3
Penrose NO2Packe Street NO2
A long-term record of one-hour average SO2 concentrations is also available for the St Albans monitoring site in Christchurch. No significant changes in the median SO2 concentration are evident in the St Albans SO2 data from 1992 to 2001. In Auckland, median SO2 concentrations are variable with higher values recorded during 1997–2000. Changes in ambient air concentrations of SO2 in most areas will depend on variations in industrial sources of SO2 or in the use of coal for domestic home heating. The latter could change with significant variations in coal type (e.g. changes in the sulphur content) or the extent of coal use.
Because only a limited amount of air quality monitoring has been carried out in New Zealand for O3, BaP and benzene it is not possible to determine trends in concentrations of these contaminants.
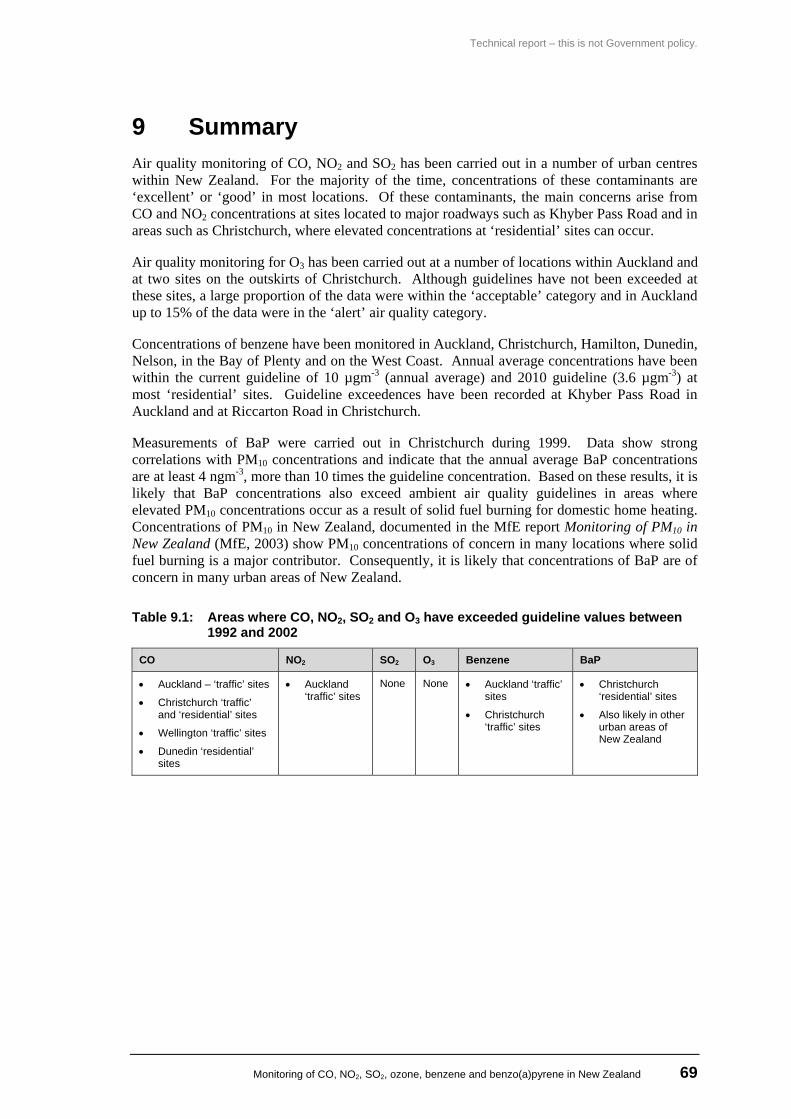
Technical report – this is not Government policy.
Monitoring of CO, NO2, SO2, ozone, benzene and benzo(a)pyrene in New Zealand 69
9 Summary Air quality monitoring of CO, NO2 and SO2 has been carried out in a number of urban centres within New Zealand. For the majority of the time, concentrations of these contaminants are ‘excellent’ or ‘good’ in most locations. Of these contaminants, the main concerns arise from CO and NO2 concentrations at sites located to major roadways such as Khyber Pass Road and in areas such as Christchurch, where elevated concentrations at ‘residential’ sites can occur.
Air quality monitoring for O3 has been carried out at a number of locations within Auckland and at two sites on the outskirts of Christchurch. Although guidelines have not been exceeded at these sites, a large proportion of the data were within the ‘acceptable’ category and in Auckland up to 15% of the data were in the ‘alert’ air quality category.
Concentrations of benzene have been monitored in Auckland, Christchurch, Hamilton, Dunedin, Nelson, in the Bay of Plenty and on the West Coast. Annual average concentrations have been within the current guideline of 10 µgm-3 (annual average) and 2010 guideline (3.6 µgm-3) at most ‘residential’ sites. Guideline exceedences have been recorded at Khyber Pass Road in Auckland and at Riccarton Road in Christchurch.
Measurements of BaP were carried out in Christchurch during 1999. Data show strong correlations with PM10 concentrations and indicate that the annual average BaP concentrations are at least 4 ngm-3, more than 10 times the guideline concentration. Based on these results, it is likely that BaP concentrations also exceed ambient air quality guidelines in areas where elevated PM10 concentrations occur as a result of solid fuel burning for domestic home heating. Concentrations of PM10 in New Zealand, documented in the MfE report Monitoring of PM10 in New Zealand (MfE, 2003) show PM10 concentrations of concern in many locations where solid fuel burning is a major contributor. Consequently, it is likely that concentrations of BaP are of concern in many urban areas of New Zealand.
Table 9.1: Areas where CO, NO2, SO2 and O3 have exceeded guideline values between 1992 and 2002
CO NO2 SO2 O3 Benzene BaP
• Auckland – ‘traffic’ sites
• Christchurch ‘traffic’ and ‘residential’ sites
• Wellington ‘traffic’ sites
• Dunedin ‘residential’ sites
• Auckland ‘traffic’ sites
None None • Auckland ‘traffic’ sites
• Christchurch ‘traffic’ sites
• Christchurch ‘residential’ sites
• Also likely in other urban areas of New Zealand
Technical document – this is not Government policy.
70 Monitoring of CO, NO2, SO2, ozone, benzene and benzo(a)pyrene in New Zealand
References Bluett J, Peterson J. 2001. Ambient Air Monitoring, Nelson City, Autumn–Winter 2001. NIWA report AK01182.
Gunatilaka M. 2002. Hazardous Air Pollutant Monitoring in Christchurch. Environment Canterbury Report No. R01/31.
Gunatilaka M. 2002. Investigations of Street Level Monitoring of Carbon Monoxide in Christchurch. Environment Canterbury Report No. U02/66.
Gunatilaka M. 2003. Hazardous Air Pollutants Concentrations of BTEX (Benzene, Toluene, Ethylbenzene and Xylene) in Christchurch (2001/2002). Environment Canterbury Report No. R03/9.
Ministry for the Environment (MfE) and Ministry of Health (MoH). 2002. Ambient Air Quality Guidelines. Ministry for the Environment, Wellington.
Ministry for the Environment (MfE). 1994. Ambient Air Quality Guidelines. Ministry for the Environment, Wellington.
Ministry for the Environment (MfE). 1999. Good Practice Guideline for Air Quality Monitoring and Data Management. Ministry for the Environment, Wellington.
Ministry for the Environment (MfE). 2000. Proposals for Revised and New Ambient Air Quality Guidelines – Discussion document. Ministry for the Environment, Wellington.
Stevenson C. 1999. Benzene and Other Toxic Organics. Report prepared for the Ministry of Health.
Taranaki Regional Council. 2002. Monitoring of Nitrogen Oxides, Sulphur Oxide and Ammonia Levels in Taranaki, 1993–2002. Internal report. Taranaki Regional Council, Stratford.
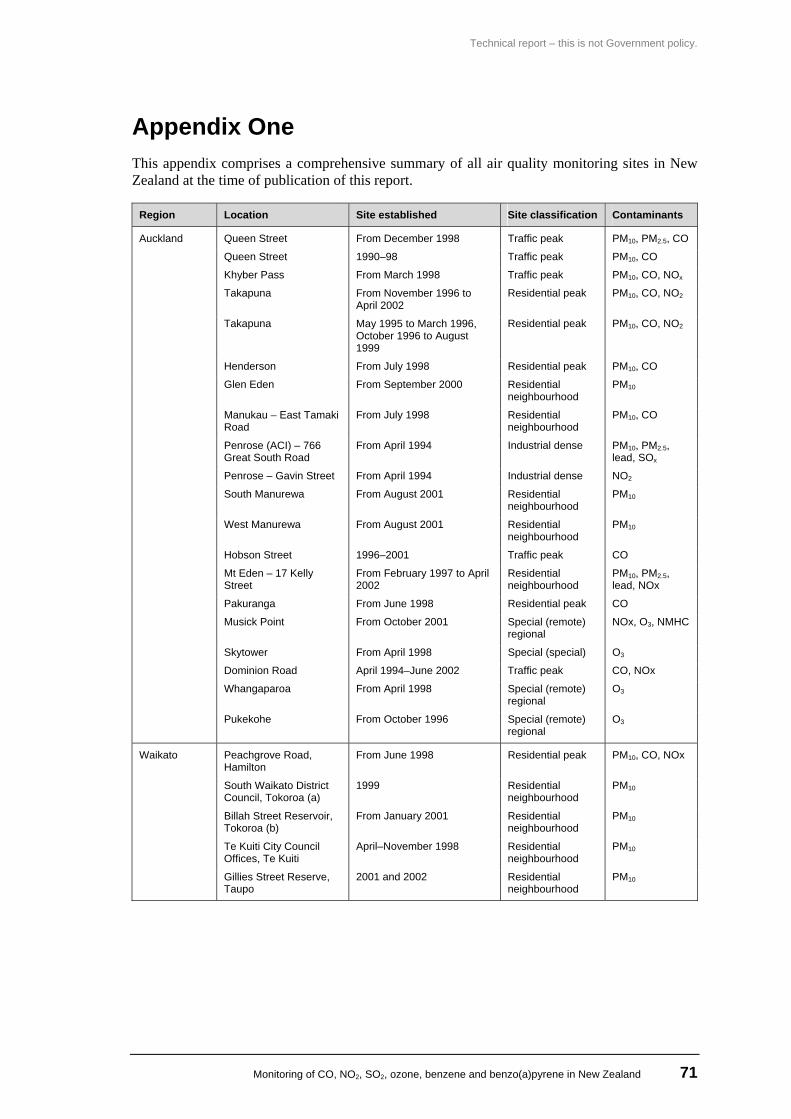
Technical report – this is not Government policy.
Monitoring of CO, NO2, SO2, ozone, benzene and benzo(a)pyrene in New Zealand 71
Appendix One This appendix comprises a comprehensive summary of all air quality monitoring sites in New Zealand at the time of publication of this report.
Region Location Site established Site classification Contaminants
Queen Street From December 1998 Traffic peak PM10, PM2.5, CO
Queen Street 1990–98 Traffic peak PM10, CO
Khyber Pass From March 1998 Traffic peak PM10, CO, NOx
Takapuna From November 1996 to April 2002
Residential peak PM10, CO, NO2
Takapuna May 1995 to March 1996, October 1996 to August 1999
Residential peak PM10, CO, NO2
Henderson From July 1998 Residential peak PM10, CO
Glen Eden From September 2000 Residential neighbourhood
PM10
Manukau – East Tamaki Road
From July 1998 Residential neighbourhood
PM10, CO
Penrose (ACI) – 766 Great South Road
From April 1994 Industrial dense PM10, PM2.5, lead, SOx
Penrose – Gavin Street From April 1994 Industrial dense NO2
South Manurewa From August 2001 Residential neighbourhood
PM10
West Manurewa From August 2001 Residential neighbourhood
PM10
Hobson Street 1996–2001 Traffic peak CO
Mt Eden – 17 Kelly Street
From February 1997 to April 2002
Residential neighbourhood
PM10, PM2.5, lead, NOx
Pakuranga From June 1998 Residential peak CO
Musick Point From October 2001 Special (remote) regional
NOx, O3, NMHC
Skytower From April 1998 Special (special) O3
Dominion Road April 1994–June 2002 Traffic peak CO, NOx
Whangaparoa From April 1998 Special (remote) regional
O3
Auckland
Pukekohe From October 1996 Special (remote) regional
O3
Peachgrove Road, Hamilton
From June 1998 Residential peak PM10, CO, NOx
South Waikato District Council, Tokoroa (a)
1999 Residential neighbourhood
PM10
Billah Street Reservoir, Tokoroa (b)
From January 2001 Residential neighbourhood
PM10
Te Kuiti City Council Offices, Te Kuiti
April–November 1998 Residential neighbourhood
PM10
Waikato
Gillies Street Reserve, Taupo
2001 and 2002 Residential neighbourhood
PM10
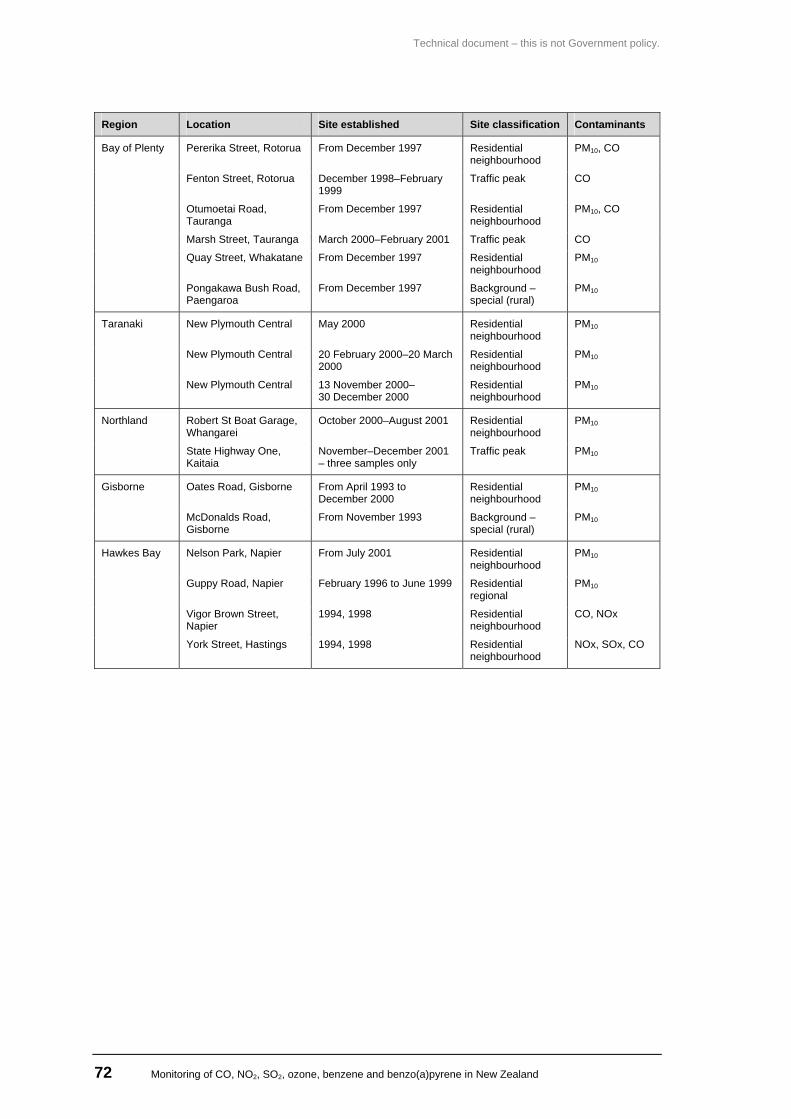
Technical document – this is not Government policy.
72 Monitoring of CO, NO2, SO2, ozone, benzene and benzo(a)pyrene in New Zealand
Region Location Site established Site classification Contaminants
Pererika Street, Rotorua From December 1997 Residential neighbourhood
PM10, CO
Fenton Street, Rotorua December 1998–February 1999
Traffic peak CO
Otumoetai Road, Tauranga
From December 1997 Residential neighbourhood
PM10, CO
Marsh Street, Tauranga March 2000–February 2001 Traffic peak CO
Quay Street, Whakatane From December 1997 Residential neighbourhood
PM10
Bay of Plenty
Pongakawa Bush Road, Paengaroa
From December 1997 Background – special (rural)
PM10
New Plymouth Central May 2000 Residential neighbourhood
PM10
New Plymouth Central 20 February 2000–20 March 2000
Residential neighbourhood
PM10
Taranaki
New Plymouth Central 13 November 2000–30 December 2000
Residential neighbourhood
PM10
Robert St Boat Garage, Whangarei
October 2000–August 2001 Residential neighbourhood
PM10 Northland
State Highway One, Kaitaia
November–December 2001 – three samples only
Traffic peak PM10
Oates Road, Gisborne From April 1993 to December 2000
Residential neighbourhood
PM10 Gisborne
McDonalds Road, Gisborne
From November 1993 Background – special (rural)
PM10
Nelson Park, Napier From July 2001 Residential neighbourhood
PM10
Guppy Road, Napier February 1996 to June 1999 Residential regional
PM10
Vigor Brown Street, Napier
1994, 1998 Residential neighbourhood
CO, NOx
Hawkes Bay
York Street, Hastings 1994, 1998 Residential neighbourhood
NOx, SOx, CO
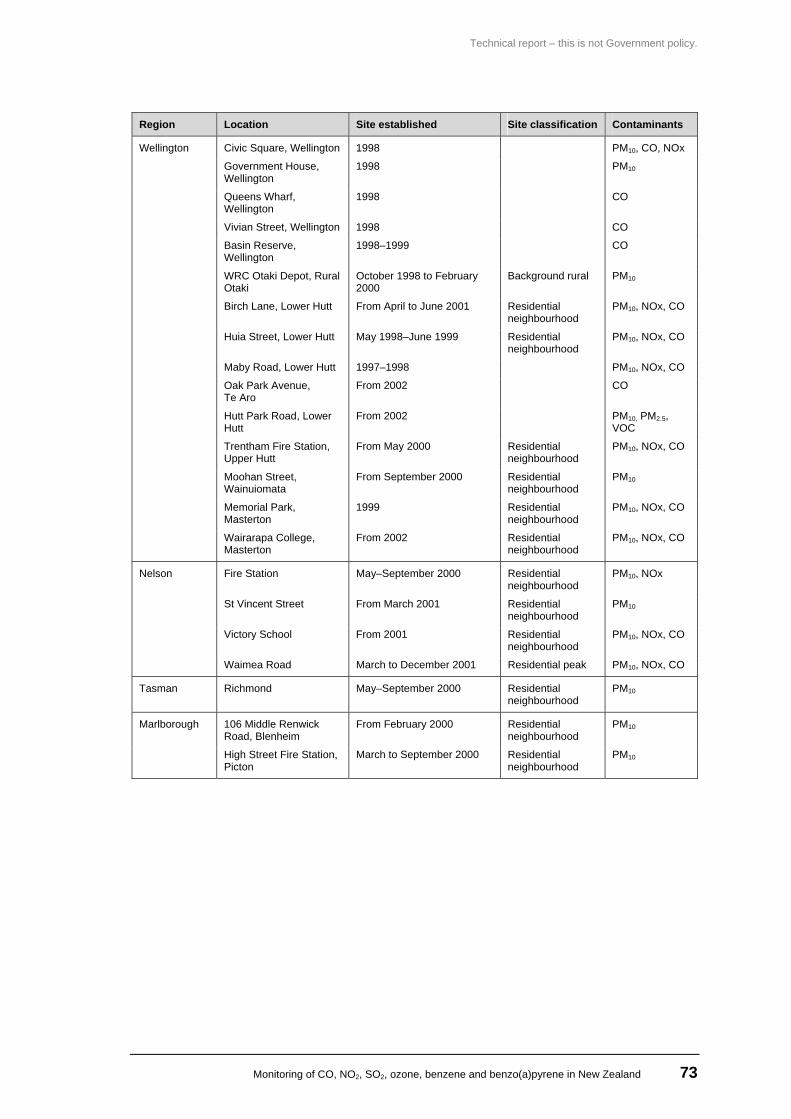
Technical report – this is not Government policy.
Monitoring of CO, NO2, SO2, ozone, benzene and benzo(a)pyrene in New Zealand 73
Region Location Site established Site classification Contaminants
Civic Square, Wellington 1998 PM10, CO, NOx
Government House, Wellington
1998 PM10
Queens Wharf, Wellington
1998 CO
Vivian Street, Wellington 1998 CO
Basin Reserve, Wellington
1998–1999 CO
WRC Otaki Depot, Rural Otaki
October 1998 to February 2000
Background rural PM10
Birch Lane, Lower Hutt From April to June 2001 Residential neighbourhood
PM10, NOx, CO
Huia Street, Lower Hutt May 1998–June 1999 Residential neighbourhood
PM10, NOx, CO
Maby Road, Lower Hutt 1997–1998 PM10, NOx, CO
Oak Park Avenue, Te Aro
From 2002 CO
Hutt Park Road, Lower Hutt
From 2002 PM10, PM2.5, VOC
Trentham Fire Station, Upper Hutt
From May 2000 Residential neighbourhood
PM10, NOx, CO
Moohan Street, Wainuiomata
From September 2000 Residential neighbourhood
PM10
Memorial Park, Masterton
1999 Residential neighbourhood
PM10, NOx, CO
Wellington
Wairarapa College, Masterton
From 2002 Residential neighbourhood
PM10, NOx, CO
Fire Station May–September 2000 Residential neighbourhood
PM10, NOx
St Vincent Street From March 2001 Residential neighbourhood
PM10
Victory School From 2001 Residential neighbourhood
PM10, NOx, CO
Nelson
Waimea Road March to December 2001 Residential peak PM10, NOx, CO
Tasman Richmond May–September 2000 Residential neighbourhood
PM10
106 Middle Renwick Road, Blenheim
From February 2000 Residential neighbourhood
PM10 Marlborough
High Street Fire Station, Picton
March to September 2000 Residential neighbourhood
PM10
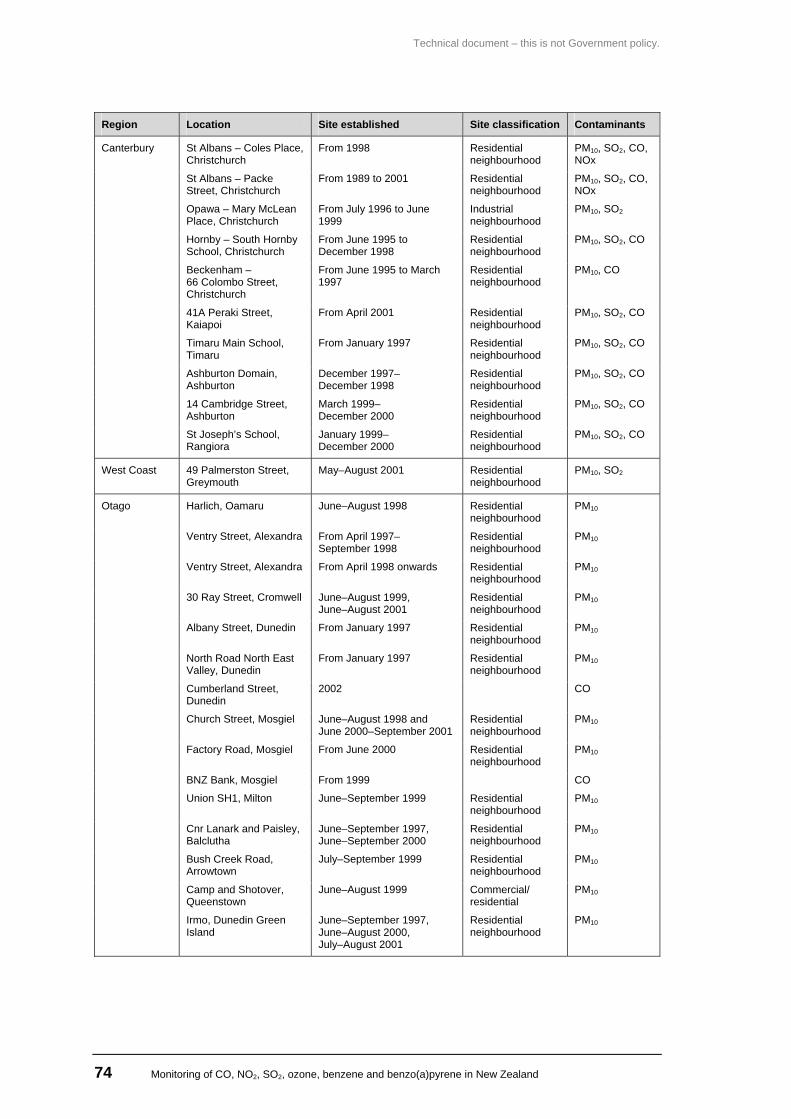
Technical document – this is not Government policy.
74 Monitoring of CO, NO2, SO2, ozone, benzene and benzo(a)pyrene in New Zealand
Region Location Site established Site classification Contaminants
St Albans – Coles Place, Christchurch
From 1998 Residential neighbourhood
PM10, SO2, CO, NOx
St Albans – Packe Street, Christchurch
From 1989 to 2001 Residential neighbourhood
PM10, SO2, CO, NOx
Opawa – Mary McLean Place, Christchurch
From July 1996 to June 1999
Industrial neighbourhood
PM10, SO2
Hornby – South Hornby School, Christchurch
From June 1995 to December 1998
Residential neighbourhood
PM10, SO2, CO
Beckenham – 66 Colombo Street, Christchurch
From June 1995 to March 1997
Residential neighbourhood
PM10, CO
41A Peraki Street, Kaiapoi
From April 2001 Residential neighbourhood
PM10, SO2, CO
Timaru Main School, Timaru
From January 1997 Residential neighbourhood
PM10, SO2, CO
Ashburton Domain, Ashburton
December 1997–December 1998
Residential neighbourhood
PM10, SO2, CO
14 Cambridge Street, Ashburton
March 1999–December 2000
Residential neighbourhood
PM10, SO2, CO
Canterbury
St Joseph’s School, Rangiora
January 1999–December 2000
Residential neighbourhood
PM10, SO2, CO
West Coast 49 Palmerston Street, Greymouth
May–August 2001 Residential neighbourhood
PM10, SO2
Harlich, Oamaru June–August 1998 Residential neighbourhood
PM10
Ventry Street, Alexandra From April 1997–September 1998
Residential neighbourhood
PM10
Ventry Street, Alexandra From April 1998 onwards Residential neighbourhood
PM10
30 Ray Street, Cromwell June–August 1999, June–August 2001
Residential neighbourhood
PM10
Albany Street, Dunedin From January 1997 Residential neighbourhood
PM10
North Road North East Valley, Dunedin
From January 1997 Residential neighbourhood
PM10
Cumberland Street, Dunedin
2002 CO
Church Street, Mosgiel June–August 1998 and June 2000–September 2001
Residential neighbourhood
PM10
Factory Road, Mosgiel From June 2000 Residential neighbourhood
PM10
BNZ Bank, Mosgiel From 1999 CO
Union SH1, Milton June–September 1999 Residential neighbourhood
PM10
Cnr Lanark and Paisley, Balclutha
June–September 1997, June–September 2000
Residential neighbourhood
PM10
Bush Creek Road, Arrowtown
July–September 1999 Residential neighbourhood
PM10
Camp and Shotover, Queenstown
June–August 1999 Commercial/ residential
PM10
Otago
Irmo, Dunedin Green Island
June–September 1997, June–August 2000, July–August 2001
Residential neighbourhood
PM10
Technical report – this is not Government policy.
Monitoring of CO, NO2, SO2, ozone, benzene and benzo(a)pyrene in New Zealand 75
About the Ministry for the Environment The Ministry for the Environment works with others to identify New Zealand’s environmental problems and get action on solutions. Our focus is on the effects people’s everyday activities have on the environment, so our work programmes cover both the natural world and the places where people live and work.
We advise the Government on New Zealand’s environmental laws, policies, standards and guidelines, monitor how they are working in practice, and take any action needed to improve them. Through reporting on the state of our environment, we help raise community awareness and provide the information needed by decision makers. We also play our part in international action on global environmental issues.
On behalf of the Minister for the Environment, who has duties under various laws, we report on local government performance on environmental matters and on the work of the Environmental Risk Management Authority and the Energy Efficiency and Conservation Authority.
Besides the Environment Act 1986 under which it was set up, the Ministry is responsible for administering the Soil Conservation and Rivers Control Act 1941, the Resource Management Act 1991, the Ozone Layer Protection Act 1996, and the Hazardous Substances and New Organisms Act 1996.
Head Office Grand Annexe Building 84 Boulcott Street PO Box 10-362 Wellington, New Zealand Phone (04) 917 7400, fax (04) 917 7523 Internet www.mfe.govt.nz
Northern Regions Office 8–10 Whitaker Place PO Box 8270 Auckland Phone (09) 913 1640, fax (09) 913 1649
South Island Office Level 4 Price Waterhouse Centre 119 Armagh Street PO Box 1345 Christchurch Phone (03) 963 0940, fax (03) 963 2050
![Welcome [blog.arcelormittal.com] · 2017-10-13 · SSS Process To Date 2008 •ArcelorMittal Dofasco applies for SSS for TSP, TRS, Benzene and Benzo(a)pyrene. •Public meetings held](https://img.pdfslide.us/doc/110x75/5f6bea83c8f62457b50fd5d5/welcome-blog-2017-10-13-sss-process-to-date-2008-aarcelormittal-dofasco.jpg)

![LCGC · 2020-07-31 · 13. N5-Methylchrysene 14. Benzo[b]fluoranthene 15. Benzo[k]fluoranthene 16. Benzo[j]fluoranthene 17. Benzo[a]pyrene 18. Indeno[1,2,3-cd]pyrene 19. Dibenz[a,h]anthracene](https://img.pdfslide.us/doc/110x75/5f8e55bf4049226cd779db4d/lcgc-2020-07-31-13-n5-methylchrysene-14-benzobfluoranthene-15-benzokfluoranthene.jpg)
![SYNTHESIS OF SOME SUBSTITUTED INDOLE ANALOGUES … · Indole or benzo[b]pyrrole 1 is a planar heteroaromatic molecule in which the benzene ring is fused at position 2 and 3 of the](https://img.pdfslide.us/doc/110x75/5eadaa0c3052c3210c3e6002/synthesis-of-some-substituted-indole-analogues-indole-or-benzobpyrrole-1-is-a.jpg)
![BENZO[a]PYRENE · Benzo[a]pyrene May 2011 BENZO[a]PYRENE . This is a compilation of abstracts of articles identified during the preliminary toxicological evaluation of evidence on](https://img.pdfslide.us/doc/110x75/5be5a25109d3f2857c8c999a/benzoapyrene-benzoapyrene-may-2011-benzoapyrene-this-is-a-compilation.jpg)


![Benzo[a]pyrene in River Sediment](https://img.pdfslide.us/doc/110x75/613d64f9736caf36b75cd07b/benzoapyrene-in-river-sediment.jpg)

![Benzo[a]pyrene (BaP)](https://img.pdfslide.us/doc/110x75/56815173550346895dbfa88c/benzoapyrene-bap-56a2c44d6ca0b.jpg)


![Biotransformation of benzo[a]pyrene - Analysis, metabolism](https://img.pdfslide.us/doc/110x75/61a84ea8bf373a5a8e635299/biotransformation-of-benzoapyrene-analysis-metabolism-.jpg)