PUBLIC TRANSPORTATION RIDERSHIP REPORT
American Public Transportation Association1300 Eye Street NW, Suite 1200 EWashington, DC 20005
Fourth Quarter 2015
Contact: Matthew DickensPolicy Analyst
ESTIMATED UNITED STATES UNLINKED TRANSIT PASSENGER TRIPS
Period 2015 2014
OCTOBERNOVEMBERDECEMBER
CALENDAR COMPARISON
OCTOBER NOVEMBER DECEMBER
2014 2013 2014 2013 2014 2013
WeekdaysSaturdaysSundaysHolidaysFourth Quarter
ESTIMATED UNLINKED TRANSIT PASSENGER TRIPS
CURRENT YEAR (a)(b) PRECEDING YEAR (a)(b) % CHANGE (b)
21541
22441
19 2245
4412
55
18
2
22441
Percent Change
2014-2015
(202) 496-4817
02-Mar-16
964,636855,987862,156
2,682,779
1,000,965851,813874,812
2,727,590
-3.63%
-1.64%
0.49%-1.45%
*
MODE OCT '15 NOV '15 DEC '15OCT '15-DEC '15 OCT '14 NOV '14 DEC '14
OCT '14-DEC '14
FourthQuarter
Year-to-Date
(000's) (000's) (000's) (000's) (000's) (000's) (000's) (000's)
JAN '15-DEC '15
(000's)
JAN '14-DEC '14
(000's)(000's) (000's)
Note: Data may differ from that included in Federal Transit Administration reports due to differences in data calculation procedures and in periods of time covered.
(a) Transit agencies assigned by urbanized areas or urban places of less than 50,000 population outside urbanized areas based on 2010 U.S. Census Population.(b) Year-to-date ridership adjusted for data received after closing dates of previous issues.(c) Includes aerial tramway, automated guideway, cable car, ferryboat, inclined plane, monorail, and vanpool.
Bus Population Group
Bus Total -2.79%412,086 404,971 5,112,264 496,419 416,250 5,258,993 -3.47%468,456 1,285,513 1,331,702419,033
United States Total -1.26%855,987 862,156 10,601,335 1,000,965 851,813 10,736,169 -1.64%964,636 2,682,779 2,727,590874,812
* Preliminary information based on data from reporting systems.
Heavy Rail 0.23%321,090 330,870 3,948,233 363,592 315,094 330,339 3,939,259 0.17%358,733 1,010,693 1,009,026
Light Rail 0.37%42,430 43,236 530,414 49,811 41,756 42,288 528,479 0.38%48,692 134,358 133,854
Commuter Rail 0.00%39,672 41,285 490,430 44,150 38,998 41,605 490,409 -0.51%43,159 124,116 124,753
Trolleybus -7.38%6,816 6,928 86,706 8,601 7,166 7,206 93,614 -6.88%7,649 21,393 22,973
-2.85%282,839 281,861 3,532,655 336,142 285,579 291,304 3,636,167 -3.28%318,376 883,077 913,0252,000,000+
-2.37%77,119 76,341 958,070 93,092 77,547 78,337 981,363 -3.06%87,907 241,367 248,976500,000 to 1,999,999
-3.85%37,006 33,384 445,019 47,718 38,256 35,268 462,845 -6.13%43,421 113,811 121,242100,000 to 499,999
-1.17%15,121 13,385 176,520 19,468 14,867 14,124 178,617 -2.48%18,751 47,258 48,459Below 100,000
Demand Response 1.18%18,929 19,534 235,972 21,440 18,195 19,204 233,223 0.91%20,911 59,375 58,838
Other (c) 2.67%14,964 15,331 197,317 16,952 14,354 15,139 192,190 1.91%17,037 47,332 46,445
Canada -0.95%125,483 116,129 2,144,022 131,194 126,403 115,550 2,164,595 -0.86%128,322 369,935 373,146

American Public Transportation Association1300 Eye Street NW, Suite 1200 EWashington, DC 20005
Contact: Matthew DickensPolicy Analyst
PRECEDING YEAR (a)(b) % CHANGE (b)
(202) 496-4817
CURRENT YEAR (a)(b)
2
PUBLIC TRANSPORTATION RIDERSHIP REPORTFourth Quarter 2015
ESTIMATED UNLINKED TRANSIT PASSENGER TRIPS
HEAVY RAIL
02-Mar-16
OCT '15 NOV '15 DEC '15 DEC '15 NOV '14 DEC '14JAN '14-
DEC '144th Qtr
ChngYTD
Chng(000's) (000's) (000's) (000's) (000's) (000's) (000's)
JAN '15-
(000's)OCT '14Transit Agency
State andPrimary City
AVGWKDY(000's)
DEC '15OCT '15-
(000's)DEC '14
OCT '14-
(000's)
Los Angeles Los Angeles County MTA 4,013.8 3,770.6 3,932.9 4,291.2 3,938.6 4,136.146,491.6 48,724.7 -5.25% -4.58%CA 144.8 11,717.3 12,365.9
San Francisco San Francisco Bay Area RTD 12,212.0 10,727.9 10,923.5 12,556.4 10,338.5 10,688.0135,044.5 132,175.6 0.84% 2.17%CA 452.6 33,863.4 33,582.9
Washington Washington Metro Area TA 22,471.1 19,008.2 19,316.7 24,698.9 20,160.8 20,565.1261,435.2 271,160.0 -7.08% -3.59%DC 836.8 60,796.0 65,424.8
Miami Miami-Dade Transit Agency 1,930.4 1,761.8 1,813.5 1,976.1 1,706.4 1,810.821,923.0 21,722.1 0.23% 0.92%FL 75.3 5,505.7 5,493.3
Atlanta Metro Atlanta Rapid Tr Auth 6,619.0 5,797.4 5,820.2 6,752.7 5,548.0 5,846.572,030.5 71,504.6 0.49% 0.74%GA 231.7 18,236.6 18,147.2
Chicago Chicago Transit Authority 22,664.0 19,470.6 18,501.3 22,443.5 18,760.5 18,365.8241,676.0 238,100.2 1.79% 1.50%IL 772.9 60,635.9 59,569.8
Boston Massachusetts Bay Tr Auth 15,892.2 13,796.2 13,753.1 16,576.5 14,029.0 13,869.0173,850.0 174,820.2 -2.32% -0.56%MA 569.2 43,441.5 44,474.5
Baltimore Maryland Transit Admin 1,138.9 1,041.2 1,046.9 1,366.0 1,099.1 1,152.112,948.4 14,555.1 -10.79% -11.04%MD 42.7 3,227.0 3,617.2
Jersey City Port Authority of NY & NJ 6,880.0 6,197.4 6,383.7 6,734.8 5,639.2 6,079.576,388.2 73,649.0 5.46% 3.72%NJ 261.9 19,461.1 18,453.5
Lindenwold Port Authority Transit Corp 915.0 824.4 872.1 920.9 773.9 814.610,169.5 10,007.3 4.07% 1.62%NJ 36.1 2,611.5 2,509.4
New York MTA New York City Transit 252,993.8 228,292.2 237,783.6 253,204.6 223,055.6 236,759.72,772,647.2 2,758,485.0 0.85% 0.51%NY 9,144.7 719,069.6 713,019.9
New York MTA Staten Island Railway 828.5 715.3 755.1 808.8 668.6 702.68,559.4 8,301.9 5.45% 3.10%NY 32.9 2,298.9 2,180.0
Cleveland Greater Cleveland Reg TA 620.2 552.6 543.8 597.1 524.9 529.16,437.6 6,203.2 3.97% 3.78%OH NA 1,716.6 1,651.1
Philadelphia Southeastern Penn TA 8,734.7 8,440.2 8,771.1 9,752.5 8,169.3 8,389.3100,093.8 99,763.0 -1.39% 0.33%PA 343.8 25,946.0 26,311.1
San Juan Puerto Rico DOT 819.2 694.0 652.7 912.0 682.0 631.08,538.2 10,087.5 -2.66% -15.36%PR 32.8 2,165.9 2,225.0
3,939,259.41,009,025.61,010,693.0REPORTED TOTAL 321,090.0 330,870.2 3,948,233.1 363,592.0 315,094.4 0.17% 0.23%
PROJECTED TOTAL
330,339.2358,732.812,978.2
Note: Data may differ from that included in Federal Transit Administration reports due to differences in data calculation procedures and in periods of time covered.(a) Transit agencies assigned by urbanized areas or urban places of less than 50,000 population outside urbanized areas based on 2000 U.S. Census Population.(b) Year-to-date ridership adjusted for data received after closing dates of previous issues.
* Preliminary information based on data from reporting systems.
1,009,025.63,948,233.11,010,693.0 0.23%321,090.0 330,870.2 363,592.0 315,094.4 330,339.2 3,939,259.4 0.17%358,732.8

American Public Transportation Association1300 Eye Street NW, Suite 1200 EWashington, DC 20005
Contact: Matthew DickensPolicy Analyst
PRECEDING YEAR (a)(b) % CHANGE (b)
(202) 496-4817
CURRENT YEAR (a)(b)
3
PUBLIC TRANSPORTATION RIDERSHIP REPORTFourth Quarter 2015
ESTIMATED UNLINKED TRANSIT PASSENGER TRIPS
LIGHT RAIL
02-Mar-16
OCT '15 NOV '15 DEC '15 DEC '15 NOV '14 DEC '14JAN '14-
DEC '144th Qtr
ChngYTD
Chng(000's) (000's) (000's) (000's) (000's) (000's) (000's)
JAN '15-
(000's)OCT '14Transit Agency
State andPrimary City
AVGWKDY(000's)
DEC '15OCT '15-
(000's)DEC '14
OCT '14-
(000's)
Valley Metro Rail, Inc. 1,438.6 1,291.2 1,193.8 1,326.4 1,201.8 1,112.714,754.6 14,263.7 7.76% 3.44%AZ 47.9Phoenix 3,923.6 3,640.9
Los Angeles County MTA 5,159.4 4,852.8 5,028.3 5,637.4 5,134.0 5,412.360,572.2 63,890.0 -7.06% -5.19%CA 189.7Los Angeles 15,040.5 16,183.7
North County Transit District 257.5 216.8 200.7 274.9 222.3 202.32,739.9 2,688.5 -3.50% 1.91%CA 8.9Oceanside 675.0 699.5
Sacramento Reg Tr Dist 1,186.1 1,055.2 1,039.7 1,230.9 1,057.5 1,019.112,732.1 13,399.0 -0.80% -4.98%CA 45.3Sacramento 3,281.0 3,307.5
San Diego Metrop Transit Sy 3,604.5 3,192.9 3,252.7 3,716.4 3,089.5 3,088.540,742.3 39,731.9 1.57% 2.54%CA 123.3San Diego 10,050.1 9,894.4
San Francisco Muni Rwy 4,537.2 3,789.2 3,916.2 4,580.6 3,805.8 3,847.452,122.6 54,135.0 0.07% -3.72%CA 156.0San Francisco 12,242.6 12,233.8
Santa Clara Valley Trp Auth 1,040.8 872.3 850.3 1,095.8 942.9 876.711,030.4 11,363.7 -5.21% -2.93%CA 33.4San Jose 2,763.4 2,915.4
Regional Trp District 2,233.2 1,958.5 1,863.2 2,561.8 2,190.5 2,042.125,518.6 26,362.9 -10.88% -3.20%CO 76.6Denver 6,054.9 6,794.4
Hillsborough Area Reg TA 23.5 19.3 26.5 23.9 21.6 26.1285.9 273.5 -3.21% 4.53%FL 0.6Tampa 69.3 71.6
Regional Transit Auth 737.8 615.8 650.0 731.2 642.4 628.37,285.0 7,457.2 0.08% -2.31%LA 22.9New Orleans 2,003.6 2,001.9
Massachusetts Bay Tr Auth 5,515.0 4,801.2 4,844.2 6,540.6 5,677.6 5,322.966,344.1 69,378.4 -13.57% -4.37%MA 186.2Boston 15,160.4 17,541.1
Maryland Transit Admin 579.1 570.9 691.2 847.7 670.5 674.96,888.5 8,092.3 -16.05% -14.88%MD 22.8Baltimore 1,841.2 2,193.1
Metro Transit 2,235.4 1,926.8 1,887.1 1,943.3 1,758.7 1,660.123,003.4 16,000.1 12.82% 43.77%MN 71.4Minneapolis 6,049.3 5,362.1
Bi-State Dev Agency 1,389.3 1,205.1 1,221.2 1,562.3 1,201.5 1,244.916,081.5 17,182.1 -4.82% -6.41%MO 47.6Saint Louis 3,815.6 4,008.7
Charlotte Area Transit 458.7 420.0 425.9 474.7 386.2 398.75,072.3 5,130.4 3.57% -1.13%NC 16.7Charlotte 1,304.6 1,259.6
New Jersey Transit Corp 2,087.1 1,887.2 2,037.3 2,063.0 1,691.8 1,880.823,014.8 22,456.7 6.67% 2.49%NJ NANewark 6,011.6 5,635.6
Niagara Frontier Trp Auth 465.8 418.6 414.2 430.2 346.7 402.35,218.7 4,300.5 10.13% 21.35%NY 17.1Buffalo 1,298.6 1,179.2
Greater Cleveland Reg TA 243.7 218.2 247.3 277.4 198.2 255.62,608.1 2,778.6 -3.01% -6.14%OH NACleveland 709.2 731.2
Tri-County Metro Trp Dist 3,571.4 3,146.8 3,227.6 3,366.3 2,792.9 3,007.438,494.5 38,164.6 8.50% 0.86%OR 122.9Portland 9,945.8 9,166.6
Southeastern Penn TA 2,923.5 2,725.6 2,866.5 2,721.9 2,177.4 2,246.826,742.5 25,405.1 19.16% 5.26%PA 111.6Philadelphia 8,515.6 7,146.1
Port Auth of Allegheny Co 713.5 663.5 665.4 757.9 625.6 641.48,132.9 8,166.1 0.86% -0.41%PA NAPittsburgh 2,042.4 2,024.9
Memphis Area Transit Auth 0.0 0.0 0.0 0.0 0.0 0.00.0 485.1 NA -100%TN 0.0Memphis 0.0 0.0
Dallas Area Rapid Transit 3,437.1 2,373.3 2,357.9 3,335.1 2,222.1 2,369.230,116.6 29,884.2 3.05% 0.78%TX 104.8Dallas 8,168.3 7,926.4
Metro Tr Auth of Harris Co 1,652.9 1,465.6 1,430.2 1,223.6 1,024.1 1,052.116,500.4 13,300.7 37.85% 24.06%TX 60.6Houston 4,548.7 3,299.8
Utah Transit Authority 1,886.4 1,623.1 1,725.8 1,848.2 1,609.1 1,738.319,704.3 19,868.7 0.76% -0.83%UT 67.3Salt Lake City 5,235.3 5,195.6

OCT '15 NOV '15 DEC '15 DEC '15 NOV '14 DEC '14JAN '14-
DEC '144th Qtr
ChngYTD
Chng(000's) (000's) (000's) (000's) (000's) (000's) (000's)
JAN '15-
(000's)OCT '14Transit Agency
State andPrimary City
AVGWKDY(000's)
DEC '15OCT '15-
(000's)DEC '14
OCT '14-
(000's)
Hampton Roads Transit 117.1 74.4 102.0 167.5 123.4 124.21,397.9 1,695.9 -29.29% -17.57%VA 3.7Hampton 293.5 415.1
King County Dept of Trp 47.6 41.5 43.0 58.9 50.3 53.8622.0 707.7 -18.96% -12.11%WA 1.8Seattle 132.1 163.0
Sound Transit 1,149.6 1,003.8 1,028.0 1,013.4 891.2 958.612,688.3 11,915.9 11.11% 6.48%WA 41.0Seattle 3,181.4 2,863.2
REPORTED TOTAL 42,429.6 43,236.2 530,414.4 49,811.3 41,755.6 528,478.5 0.38% 0.37%
PROJECTED TOTAL (c)
42,287.548,691.81,580.1 134,357.6 133,854.4
Note: Data may differ from that included in Federal Transit Administration reports due to differences in data calculation procedures and in periods of time covered.(a) Transit agencies assigned by urbanized areas or urban places of less than 50,000 population outside urbanized areas based on 2000 U.S. Census Population.(b) Year-to-date ridership adjusted for data received after closing dates of previous issues.
(c) Includes missing agencies (Central Arkansas TA and Kenosha Transit).
* Preliminary information based on data from reporting systems.
0.37%42,429.6 43,236.2 530,414.4 49,811.3 41,755.6 42,287.5 528,478.5 0.38%48,691.8 134,357.6 133,854.4

American Public Transportation Association1300 Eye Street NW, Suite 1200 EWashington, DC 20005
Contact: Matthew DickensPolicy Analyst
(202) 496-4817
PRECEDING YEAR (a)(b) % CHANGE (b)CURRENT YEAR (a)(b)
5
PUBLIC TRANSPORTATION RIDERSHIP REPORTFourth Quarter 2015
ESTIMATED UNLINKED TRANSIT PASSENGER TRIPS
COMMUTER RAIL
02-Mar-16
OCT '15 NOV '15 DEC '15 DEC '15 NOV '14 DEC '14JAN '14-
DEC '144th Qtr
ChngYTD
Chng(000's) (000's) (000's) (000's) (000's) (000's) (000's)
JAN '15-
(000's)OCT '14Transit Agency
State andPrimary City
AVGWKDY(000's)
DEC '15OCT '15-
(000's)DEC '14
OCT '14-
(000's)
Alaska Railroad Corporation 0.7 0.6 1.1 0.8 0.7 1.0178.0 164.7 -4.00% 8.08%AK 0.2Anchorage 2.4 2.5
Southern California RRA 1,003.9 878.3 867.1 1,053.3 848.3 881.011,395.0 11,489.7 -1.20% -0.82%CA 40.5Los Angeles 2,749.3 2,782.6
Capitol Corridor Joint Power 134.2 130.0 120.6 131.7 124.5 116.31,499.7 1,436.0 3.30% 4.44%CA 4.9Oakland 384.8 372.5
North County Transit District 118.2 112.1 109.4 131.4 114.5 114.31,600.4 1,673.3 -5.69% -4.36%CA 4.8Oceanside 339.7 360.2
Caltrain 1,659.9 1,477.4 1,408.8 1,699.1 1,418.8 1,401.518,821.7 17,920.1 0.59% 5.03%CA 56.9San Carlos 4,546.1 4,519.4
San Joaquin Reg Rail Comm 122.3 102.5 91.4 116.5 87.0 81.71,255.7 1,179.4 10.87% 6.47%CA 5.0Stockton 316.2 285.2
Connecticut DOT 52.5 49.1 48.9 58.9 50.2 49.9610.0 658.3 -5.35% -7.34%CT 2.0New Haven 150.5 159.0
SunRail 61.2 70.5 80.6 74.1 60.5 79.8958.8 612.0 -0.98% 56.67%FL NAOrlando 212.3 214.4
South Florida RTA (Tri-Rail) 374.7 347.9 356.4 390.7 348.1 357.04,240.6 4,389.6 -1.53% -3.39%FL 14.2Pompano Beach 1,079.0 1,095.8
Metra 6,209.4 5,905.2 5,747.3 6,455.5 6,004.8 6,022.873,071.1 74,381.9 -3.36% -1.76%IL 292.0Chicago 17,861.9 18,483.1
Northern IN Commuter TD 305.4 272.7 303.9 314.2 274.4 308.83,615.7 3,614.2 -1.72% 0.04%IN 11.7Chesterton 882.0 897.4
Massachusetts Bay Tr Auth 3,020.0 2,646.1 2,789.4 3,211.4 2,695.1 3,010.132,592.5 36,087.6 -5.17% -9.69%MA 122.1Boston 8,455.5 8,916.6
Maryland Transit Admin 811.0 691.4 710.1 860.8 659.3 723.69,149.9 9,364.8 -1.39% -2.29%MD 33.8Baltimore 2,212.5 2,243.7
Northern NE Passenger RA 41.9 39.6 38.0 41.6 35.2 36.6426.7 494.9 5.38% -13.78%ME 1.3Portland 119.5 113.4
Metro Transit 61.1 51.1 55.9 57.8 57.0 50.3722.6 721.2 1.82% 0.19%MN 2.5Minneapolis 168.1 165.1
New Jersey Transit Corp 7,731.6 7,563.5 7,669.7 7,630.8 7,336.5 7,649.888,621.5 86,383.8 1.54% 2.59%NJ NANewark 22,964.8 22,617.1
New Mexico Dept of Trp 84.2 64.4 68.2 93.2 72.3 79.1930.0 1,062.7 -11.37% -12.49%NM 2.9Albuquerque 216.8 244.6
MTA Long Island Rail Road 8,480.5 7,880.3 8,442.1 8,760.0 7,770.9 8,536.498,699.4 98,393.7 -1.05% 0.31%NY 333.6New York 24,802.9 25,067.3
MTA Metro-North Railroad 7,642.5 6,978.5 7,615.6 7,634.1 6,668.8 7,485.985,747.6 84,468.8 2.06% 1.51%NY 304.8New York 22,236.6 21,788.8
Tri-County Metro Trp Dist 41.0 34.4 35.0 46.5 34.2 36.9461.0 501.1 -6.12% -8.00%OR 1.7Portland 110.4 117.6
Penn DOT (Keystone) 124.5 123.2 123.2 121.6 114.7 119.21,374.8 1,340.6 4.33% 2.55%PA 4.6Harris-Phil 370.9 355.5
Southeastern Penn TA 3,476.7 2,947.4 3,251.6 3,671.3 2,972.9 3,137.537,804.6 37,876.0 -1.08% -0.19%PA 134.3Philadelphia 9,675.7 9,781.7
Regional Transp Auth 26.4 22.7 21.6 26.9 18.9 20.6273.7 256.7 6.48% 6.62%TN NANashville 70.7 66.4
Capital Metropolitan Trp Aut 85.2 57.4 49.3 81.9 61.7 49.9839.6 782.1 -0.83% 7.35%TX 2.8Austin 191.9 193.5
Trinity Railway Express 241.4 161.3 168.9 245.2 164.6 171.22,164.3 2,293.5 -1.62% -5.63%TX 8.1Dallas-Ft Worth 571.6 581.0

OCT '15 NOV '15 DEC '15 DEC '15 NOV '14 DEC '14JAN '14-
DEC '144th Qtr
ChngYTD
Chng(000's) (000's) (000's) (000's) (000's) (000's) (000's)
JAN '15-
(000's)OCT '14Transit Agency
State andPrimary City
AVGWKDY(000's)
DEC '15OCT '15-
(000's)DEC '14
OCT '14-
(000's)
Denton County Transportatio 65.4 45.8 38.7 59.2 43.4 39.4557.7 570.1 5.56% -2.18%TX 1.9Lewisville 149.9 142.0
Utah Transit Authority 443.3 373.7 421.9 420.9 360.6 401.04,645.3 4,416.1 4.77% 5.19%UT 17.6Salt Lake City 1,238.9 1,182.5
Virginia Railway Express 377.2 325.0 338.2 415.6 317.6 358.24,374.0 4,513.5 -4.67% -3.09%VA NAAlexandria 1,040.4 1,091.4
Sound Transit 362.2 320.0 312.5 345.3 282.6 285.03,797.6 3,362.8 8.96% 12.93%WA 15.0Seattle 994.7 912.9
REPORTED TOTAL 39,672.1 41,285.4 490,429.5 44,150.3 38,998.1 490,409.2 -0.51% 0.00%
PROJECTED TOTAL
41,604.843,158.51,419.2 124,116.0 124,753.2
Note: Data may differ from that included in Federal Transit Administration reports due to differences in data calculation procedures and in periods of time covered.(a) Transit agencies assigned by urbanized areas or urban places of less than 50,000 population outside urbanized areas based on 2000 U.S. Census Population.(b) Year-to-date ridership adjusted for data received after closing dates of previous issues.
* Preliminary information based on data from reporting systems.
0.00%39,672.1 41,285.4 490,429.5 44,150.3 38,998.1 41,604.8 490,409.2 -0.51%43,158.5 124,116.0 124,753.2

American Public Transportation Association1300 Eye Street NW, Suite 1200 EWashington, DC 20005
Contact: Matthew DickensPolicy Analyst
PRECEDING YEAR (a)(b) % CHANGE (b)
(202) 496-4817
CURRENT YEAR (a)(b)
7
PUBLIC TRANSPORTATION RIDERSHIP REPORTFourth Quarter 2015
ESTIMATED UNLINKED TRANSIT PASSENGER TRIPS
TROLLEY BUS
02-Mar-16
OCT '15 NOV '15 DEC '15 DEC '15 NOV '14 DEC '14JAN '14-
DEC '144th Qtr
ChngYTD
Chng(000's) (000's) (000's) (000's) (000's) (000's) (000's)
JAN '15-
(000's)OCT '14Transit Agency
State andPrimary City
AVGWKDY(000's)
DEC '15OCT '15-
(000's)DEC '14
OCT '14-
(000's)
San Francisco Muni Rwy 5,095.5 4,491.5 4,565.8 5,762.7 4,851.8 4,783.857,481.6 63,380.8 -8.09% -9.31%CA 170.4San Francisco 14,152.8 15,398.3
Massachusetts Bay Tr Auth 115.3 106.9 109.7 115.9 96.0 113.41,314.3 1,380.4 2.03% -4.79%MA 4.4Boston 331.9 325.3
Greater Dayton Regional TA 246.4 218.4 215.2 262.7 223.3 225.92,693.4 2,699.4 -4.48% -0.22%OH 8.7Dayton 680.0 711.9
Southeastern Penn TA 576.6 532.5 578.7 649.0 553.2 574.16,449.4 6,689.3 -4.98% -3.59%PA 22.4Philadelphia 1,687.8 1,776.3
King County Dept of Trp 1,615.1 1,467.1 1,458.2 1,810.5 1,442.1 1,508.318,766.9 19,464.4 -4.63% -3.58%WA 69.7Seattle 4,540.4 4,760.9
REPORTED TOTAL 6,816.4 6,927.6 86,705.6 8,600.8 7,166.4 93,614.3 -6.88% -7.38%
PROJECTED TOTAL (c)
7,205.57,648.9275.5 21,392.9 22,972.7
Note: Data may differ from that included in Federal Transit Administration reports due to differences in data calculation procedures and in periods of time covered.(a) Transit agencies assigned by urbanized areas or urban places of less than 50,000 population outside urbanized areas based on 2000 U.S. Census Population.(b) Year-to-date ridership adjusted for data received after closing dates of previous issues.
* Preliminary information based on data from reporting systems.
-7.38%6,816.4 6,927.6 86,705.6 8,600.8 7,166.4 7,205.5 93,614.3 -6.88%7,648.9 21,392.9 22,972.7

American Public Transportation Association1300 Eye Street NW, Suite 1200 EWashington, DC 20005
Contact: Matthew DickensPolicy Analyst
PRECEDING YEAR (a)(b) % CHANGE (b)
(202) 496-4817
CURRENT YEAR (a)(b)
8
PUBLIC TRANSPORTATION RIDERSHIP REPORT
Fourth Quarter 2015ESTIMATED UNLINKED TRANSIT PASSENGER TRIPS
LARGEST BUS AGENCIES
02-Mar-16
(Transit Agencies in Urbanized Areas of 1,000,000 or more population that operate 300 or more peak-hour buses, plus a selection of other large bus operators)
OCT '15 NOV '15 DEC '15 DEC '15 NOV '14 DEC '14JAN '14-
DEC '144TH Qtr
ChngYTD
Chng(000's) (000's) (000's) (000's) (000's) (000's) (000's)
JAN '15-
(000's)OCT '14Transit Agency
State andPrimary City
AVGWKDY(000's)
DEC '15OCT '15-
(000's)DEC '14
OCT '14-
(000's)
City of Phoenix PTD 3,366.6 2,990.2 2,937.7 3,655.3 3,169.9 3,195.737,370.3 38,930.4 -7.25% -4.01%AZ 126.7Phoenix 9,294.5 10,020.9
Long Beach Transit 2,389.6 2,137.3 2,063.6 2,580.4 2,301.0 2,259.127,135.6 28,579.4 -7.70% -5.05%CA 84.7Long Beach 6,590.5 7,140.5
Los Angeles County MTA 29,259.5 25,970.0 25,793.7 31,070.1 27,574.0 27,461.1333,971.1 352,059.0 -5.90% -5.14%CA 1,017.8Los Angeles 81,023.2 86,105.2
Alameda-Contra Costa TD 4,927.0 4,271.9 4,062.3 5,174.6 4,348.6 4,224.254,674.0 55,169.0 -3.54% -0.90%CA 171.8Oakland 13,261.2 13,747.4
Orange County Transp Auth 4,053.6 3,527.8 3,376.3 4,416.2 3,725.2 3,632.445,467.1 48,124.6 -6.93% -5.52%CA 140.7Orange 10,957.7 11,773.8
San Diego Metrop Transit Sy 5,029.3 4,281.2 4,085.9 5,102.0 4,216.4 4,108.454,044.0 52,795.1 -0.23% 2.37%CA 178.7San Diego 13,396.4 13,426.8
San Francisco Muni Rwy 8,986.8 7,931.8 7,970.1 8,454.4 7,626.2 7,531.997,432.1 97,269.2 5.40% 0.17%CA 314.4San Francisco 24,888.7 23,612.5
Santa Clara Valley Trp Auth 3,165.8 2,730.6 2,530.9 3,033.7 2,565.0 2,469.933,685.3 32,757.8 4.45% 2.83%CA 109.1San Jose 8,427.3 8,068.6
Santa Monica's Big Blue Bus 1,388.3 1,253.5 1,421.4 1,758.6 1,438.3 1,621.817,402.1 18,370.6 -15.68% -5.27%CA 63.1Santa Monica 4,063.2 4,818.7
Regional Trp District 6,769.3 5,825.8 5,874.1 7,134.3 5,850.3 6,111.275,686.4 76,894.3 -3.28% -1.57%CO 243.2Denver 18,469.2 19,095.8
Washington Metro Area TA 11,494.9 10,219.0 10,223.1 12,198.8 10,199.3 10,536.6130,807.3 134,313.4 -3.03% -2.61%DC 424.9Washington 31,937.0 32,934.7
Broward County Transit 3,296.6 2,959.7 3,013.8 3,741.0 3,233.4 3,405.138,546.2 40,789.4 -10.69% -5.50%FL 121.4Fort Lauderdale 9,270.1 10,379.5
Central Florida RTA 2,286.2 2,074.8 2,137.0 2,690.3 2,293.7 2,424.627,262.3 28,858.8 -12.29% -5.53%FL 81.1Orlando 6,498.0 7,408.6
Metro Atlanta Rapid Tr Auth 5,472.4 5,225.5 4,777.2 5,867.2 4,889.7 5,085.162,021.7 61,963.2 -2.32% 0.09%GA 199.0Atlanta 15,475.1 15,842.0
PACE Suburban Bus 2,798.5 2,404.5 2,377.1 2,935.6 2,405.1 2,471.630,115.6 31,647.0 -2.97% -4.84%IL 103.8Arlington Heights 7,580.1 7,812.3
Chicago Transit Authority 25,047.9 21,655.5 21,343.4 25,638.5 21,484.7 21,945.3274,288.0 276,117.1 -1.48% -0.66%IL 868.4Chicago 68,046.8 69,068.5
Massachusetts Bay Tr Auth 11,292.9 9,145.9 8,939.6 10,350.5 8,924.0 9,131.9112,665.8 114,970.3 3.42% -2.00%MA 383.7Boston 29,378.4 28,406.4
Maryland Transit Admin 7,213.7 6,770.4 6,663.9 8,021.9 6,540.4 6,927.981,029.1 81,676.3 -3.92% -0.79%MD 274.4Baltimore 20,648.0 21,490.2
Montgomery County Ride-On 2,265.5 1,996.7 2,036.9 2,464.8 2,069.3 2,122.225,293.7 26,328.3 -5.37% -3.93%MD 82.1Rockville 6,299.1 6,656.3
City of Detroit Dept of Trp 2,589.1 2,234.6 2,210.4 2,429.1 1,955.2 1,995.224,911.0 24,434.0 10.26% 1.95%MI 91.7Detroit 7,034.1 6,379.5
Metro Transit 5,457.7 4,824.8 4,824.4 6,018.4 5,095.7 5,145.062,106.1 67,814.4 -7.09% -8.42%MN 202.8Minneapolis 15,106.9 16,259.1
Bi-State Dev Agency 2,594.4 2,245.1 2,253.3 2,837.7 2,290.0 2,357.228,554.5 30,182.4 -5.24% -5.39%MO 90.5Saint Louis 7,092.8 7,484.9
New Jersey Transit Corp 14,393.4 12,880.8 13,223.2 15,100.6 12,729.5 13,502.1160,851.3 162,234.9 -2.02% -0.85%NJ NANewark 40,497.4 41,332.2
RTC of Southern Nevada 6,065.2 5,293.3 5,275.7 5,751.3 4,988.7 4,997.966,256.4 61,720.1 5.70% 7.35%NV 196.3Las Vegas 16,634.2 15,737.9
MTA New York City Transit 70,177.3 63,751.6 64,314.4 73,977.2 63,429.3 64,886.1774,879.3 794,734.4 -2.00% -2.50%NY 2,524.6New York 198,243.3 202,292.6

OCT '15 NOV '15 DEC '15 DEC '15 NOV '14 DEC '14JAN '14-
DEC '144TH Qtr
ChngYTD
Chng(000's) (000's) (000's) (000's) (000's) (000's) (000's)
JAN '15-
(000's)OCT '14Transit Agency
State andPrimary City
AVGWKDY(000's)
DEC '15OCT '15-
(000's)DEC '14
OCT '14-
(000's)
Southwest Ohio RTA 1,520.3 1,301.0 1,289.6 1,615.7 1,282.1 1,333.215,964.1 16,421.0 -2.84% -2.78%OH 59.5Cincinnati 4,110.9 4,231.0
Greater Cleveland Reg TA 3,451.3 3,023.2 2,985.6 3,881.5 3,199.2 3,303.337,271.3 39,510.9 -8.90% -5.67%OH NACleveland 9,460.1 10,384.0
Central Ohio Transit Auth 1,784.0 1,584.6 1,531.8 1,844.3 1,520.6 1,527.118,899.0 19,020.9 0.17% -0.64%OH 64.5Columbus 4,900.4 4,892.0
Tri-County Metro Trp Dist 5,336.6 4,758.2 4,681.8 5,723.3 4,792.9 4,990.261,627.8 62,032.6 -4.71% -0.65%OR 191.0Portland 14,776.6 15,506.4
Southeastern Penn TA 13,903.9 12,705.1 12,600.4 16,575.9 13,809.0 14,346.7162,984.4 173,766.2 -12.35% -6.20%PA 533.6Philadelphia 39,209.4 44,731.6
Port Auth of Allegheny Co 4,942.6 4,266.0 4,059.4 4,998.6 4,167.2 4,055.153,508.5 52,287.2 0.36% 2.34%PA NAPittsburgh 13,268.0 13,220.9
Dallas Area Rapid Transit 3,251.2 2,764.2 2,823.1 3,664.3 2,996.7 2,956.735,714.9 37,868.8 -8.10% -5.69%TX 120.0Dallas 8,838.5 9,617.7
Metro Tr Auth of Harris Co 6,178.8 5,460.8 5,499.2 6,453.4 5,242.7 5,368.366,356.7 68,116.2 0.44% -2.58%TX 231.0Houston 17,138.8 17,064.4
VIA Metropolitan Transit 3,598.8 3,178.0 3,241.9 4,028.0 3,267.7 3,409.140,424.5 42,827.5 -6.41% -5.61%TX 128.4San Antonio 10,018.7 10,704.8
Hampton Roads Transit 1,167.5 1,039.4 1,075.6 1,374.9 1,108.9 1,154.013,562.5 14,938.4 -9.77% -9.21%VA 43.6Hampton 3,282.5 3,637.8
King County Dept of Trp 9,327.6 8,305.7 8,046.3 9,260.3 7,980.4 7,901.6102,332.1 100,644.5 2.14% 1.68%WA 330.3Seattle 25,679.6 25,142.3
Milwaukee County Tr Sys 3,228.1 2,769.2 3,164.2 3,469.4 3,114.0 3,047.834,473.8 40,028.6 -4.88% -13.88%WI 111.7Milwaukee 9,161.5 9,631.2
REPORTED TOTAL 265,757.7 264,728.3 3,319,575.9 315,292.1 267,824.3 3,406,196.2 -3.05% -2.54%272,942.6299,472.29,908.7 829,958.2 856,059.0
Note: Data may differ from that included in Federal Transit Administration reports due to differences in data calculation procedures and in periods of time covered.(a) Transit agencies assigned by urbanized areas or urban places of less than 50,000 population outside urbanized areas based on 2000 U.S. Census Population.(b) Year-to-date ridership adjusted for data received after closing dates of previous issues.
* Preliminary information based on data from reporting systems.
APTA PUBLIC TRANSPORTATION RIDERSHIP REPORT
State and Primary City
Transit Agency Mode
Average
Weekday Oct '15
Trips for Trips for
Nov '15
Trips for
Dec '15
Trips Thru
Dec '15
Trips for
Oct '14
Trips for
Nov '14
Trips for
Dec '14
Trips Thru
Dec '14 Quarterly
Change
Year-
Change
Fourth Quarter, 2015
(000's) (000's) (000's) (000's) (000's) (000's) (000's) (000's)(000's)
to-Date
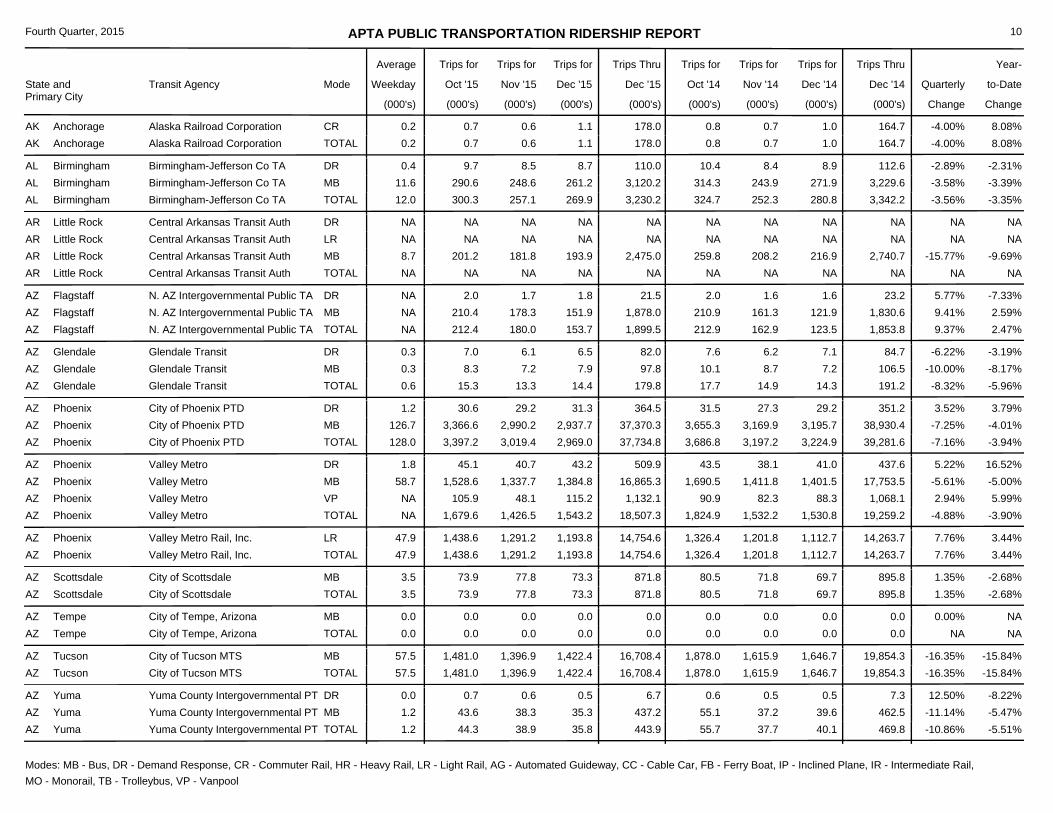
10
0.80.6 1.1 0.7 1.00.2 -4.00%178.0 164.7 8.08%0.7AK Anchorage Alaska Railroad Corporation TOTAL0.80.7 0.6 1.10.2CR 0.7 1.0 -4.00%178.0 164.7 8.08%Alaska Railroad CorporationAK Anchorage
324.7257.1 269.9 252.3 280.812.0 -3.56%3,230.2 3,342.2 -3.35%300.3AL Birmingham Birmingham-Jefferson Co TA TOTAL
10.49.7 8.5 8.70.4DR 8.4 8.9 -2.89%110.0 112.6 -2.31%Birmingham-Jefferson Co TAAL Birmingham314.3290.6 248.6 261.211.6MB 243.9 271.9 -3.58%3,120.2 3,229.6 -3.39%Birmingham-Jefferson Co TAAL Birmingham
NANA NA NA NANA NANA NA NANAAR Little Rock Central Arkansas Transit Auth TOTAL
NANA NA NANADR NA NA NANA NA NACentral Arkansas Transit AuthAR Little RockNANA NA NANALR NA NA NANA NA NACentral Arkansas Transit AuthAR Little Rock
259.8201.2 181.8 193.98.7MB 208.2 216.9 -15.77%2,475.0 2,740.7 -9.69%Central Arkansas Transit AuthAR Little Rock
212.9180.0 153.7 162.9 123.5NA 9.37%1,899.5 1,853.8 2.47%212.4AZ Flagstaff N. AZ Intergovernmental Public TA TOTAL
2.02.0 1.7 1.8NADR 1.6 1.6 5.77%21.5 23.2 -7.33%N. AZ Intergovernmental Public TAAZ Flagstaff210.9210.4 178.3 151.9NAMB 161.3 121.9 9.41%1,878.0 1,830.6 2.59%N. AZ Intergovernmental Public TAAZ Flagstaff
17.713.3 14.4 14.9 14.30.6 -8.32%179.8 191.2 -5.96%15.3AZ Glendale Glendale Transit TOTAL
7.67.0 6.1 6.50.3DR 6.2 7.1 -6.22%82.0 84.7 -3.19%Glendale TransitAZ Glendale10.18.3 7.2 7.90.3MB 8.7 7.2 -10.00%97.8 106.5 -8.17%Glendale TransitAZ Glendale
3,686.83,019.4 2,969.0 3,197.2 3,224.9128.0 -7.16%37,734.8 39,281.6 -3.94%3,397.2AZ Phoenix City of Phoenix PTD TOTAL
31.530.6 29.2 31.31.2DR 27.3 29.2 3.52%364.5 351.2 3.79%City of Phoenix PTDAZ Phoenix3,655.33,366.6 2,990.2 2,937.7126.7MB 3,169.9 3,195.7 -7.25%37,370.3 38,930.4 -4.01%City of Phoenix PTDAZ Phoenix
1,824.91,426.5 1,543.2 1,532.2 1,530.8NA -4.88%18,507.3 19,259.2 -3.90%1,679.6AZ Phoenix Valley Metro TOTAL
43.545.1 40.7 43.21.8DR 38.1 41.0 5.22%509.9 437.6 16.52%Valley MetroAZ Phoenix1,690.51,528.6 1,337.7 1,384.858.7MB 1,411.8 1,401.5 -5.61%16,865.3 17,753.5 -5.00%Valley MetroAZ Phoenix
90.9105.9 48.1 115.2NAVP 82.3 88.3 2.94%1,132.1 1,068.1 5.99%Valley MetroAZ Phoenix
1,326.41,291.2 1,193.8 1,201.8 1,112.747.9 7.76%14,754.6 14,263.7 3.44%1,438.6AZ Phoenix Valley Metro Rail, Inc. TOTAL1,326.41,438.6 1,291.2 1,193.847.9LR 1,201.8 1,112.7 7.76%14,754.6 14,263.7 3.44%Valley Metro Rail, Inc.AZ Phoenix
80.577.8 73.3 71.8 69.73.5 1.35%871.8 895.8 -2.68%73.9AZ Scottsdale City of Scottsdale TOTAL80.573.9 77.8 73.33.5MB 71.8 69.7 1.35%871.8 895.8 -2.68%City of ScottsdaleAZ Scottsdale
0.00.0 0.0 0.0 0.00.0 NA0.0 0.0 NA0.0AZ Tempe City of Tempe, Arizona TOTAL0.00.0 0.0 0.00.0MB 0.0 0.0 0.00%0.0 0.0 NACity of Tempe, ArizonaAZ Tempe
1,878.01,396.9 1,422.4 1,615.9 1,646.757.5 -16.35%16,708.4 19,854.3 -15.84%1,481.0AZ Tucson City of Tucson MTS TOTAL1,878.01,481.0 1,396.9 1,422.457.5MB 1,615.9 1,646.7 -16.35%16,708.4 19,854.3 -15.84%City of Tucson MTSAZ Tucson
55.738.9 35.8 37.7 40.11.2 -10.86%443.9 469.8 -5.51%44.3AZ Yuma Yuma County Intergovernmental PT TOTAL
0.60.7 0.6 0.50.0DR 0.5 0.5 12.50%6.7 7.3 -8.22%Yuma County Intergovernmental PTAZ Yuma55.143.6 38.3 35.31.2MB 37.2 39.6 -11.14%437.2 462.5 -5.47%Yuma County Intergovernmental PTAZ Yuma
Modes: MB - Bus, DR - Demand Response, CR - Commuter Rail, HR - Heavy Rail, LR - Light Rail, AG - Automated Guideway, CC - Cable Car, FB - Ferry Boat, IP - Inclined Plane, IR - Intermediate Rail, MO - Monorail, TB - Trolleybus, VP - Vanpool

APTA PUBLIC TRANSPORTATION RIDERSHIP REPORT
State and Primary City
Transit Agency Mode
Average
Weekday Oct '15
Trips for Trips for
Nov '15
Trips for
Dec '15
Trips Thru
Dec '15
Trips for
Oct '14
Trips for
Nov '14
Trips for
Dec '14
Trips Thru
Dec '14 Quarterly
Change
Year-
Change
Fourth Quarter, 2015
(000's) (000's) (000's) (000's) (000's) (000's) (000's) (000's)(000's)
to-Date
11
7.510.2 13.2 5.2 8.10.4 66.83%125.4 87.7 42.99%11.3CA Alturas Modoc Transportation Agency TOTAL7.511.3 10.2 13.20.4MB 5.2 8.1 66.83%125.4 87.7 42.99%Modoc Transportation AgencyCA Alturas
280.1205.6 214.3 223.2 228.09.7 -6.63%2,840.7 2,984.3 -4.81%262.9CA Antioch Eastern Contra Costa Tr Auth TOTAL
12.311.5 9.9 10.80.5DR 10.5 9.8 -1.23%130.2 132.1 -1.44%Eastern Contra Costa Tr AuthCA Antioch267.8251.4 195.7 203.59.2MB 212.7 218.2 -6.88%2,710.5 2,852.2 -4.97%Eastern Contra Costa Tr AuthCA Antioch
574.3438.7 430.4 486.8 471.918.3 -9.05%5,756.3 5,649.8 1.89%525.1CA Bakersfield Golden Empire Transit District TOTAL
4.95.6 4.6 5.20.2DR 4.5 4.6 10.00%61.7 52.2 18.20%Golden Empire Transit DistrictCA Bakersfield569.4519.5 434.1 425.218.1MB 482.3 467.3 -9.23%5,694.6 5,597.6 1.73%Golden Empire Transit DistrictCA Bakersfield
319.80.0 0.0 243.9 232.60.0 -100.00%154.9 3,125.2 -95.04%0.0CA Chula Vista Chula Vista Transit TOTAL319.80.0 0.0 0.00.0MB 243.9 232.6 -100.00%154.9 3,125.2 -95.04%Chula Vista TransitCA Chula Vista
362.1298.6 299.3 284.7 292.713.8 1.93%3,797.4 3,629.6 4.62%359.7CA Concord Central Contra Costa TA TOTAL
14.313.5 11.4 12.10.5DR 11.5 12.6 -3.65%154.9 158.4 -2.21%Central Contra Costa TACA Concord347.8346.2 287.2 287.213.2MB 273.2 280.1 2.16%3,642.5 3,471.2 4.93%Central Contra Costa TACA Concord
470.5357.5 354.6 398.0 393.514.7 -9.71%4,786.4 5,025.3 -4.75%427.3CA Culver City Culver CityBus TOTAL470.5427.3 357.5 354.614.7MB 398.0 393.5 -9.71%4,786.4 5,025.3 -4.75%Culver CityBusCA Culver City
489.2417.9 204.4 378.6 343.117.7 -8.16%4,006.5 3,990.5 0.40%489.8CA Davis Unitrans TOTAL489.2489.8 417.9 204.417.7MB 378.6 343.1 -8.16%4,006.5 3,990.5 0.40%UnitransCA Davis
1,013.0899.1 905.9 791.3 817.237.3 7.65%10,756.8 10,536.6 2.09%1,017.1CA Fresno Fresno Area Express TOTAL
19.718.4 15.8 16.00.7DR 15.9 16.5 -3.65%206.7 209.5 -1.34%Fresno Area ExpressCA Fresno993.3998.7 883.3 889.936.6MB 775.4 800.7 7.88%10,550.1 10,327.1 2.16%Fresno Area ExpressCA Fresno
358.1287.0 274.0 291.1 277.112.3 -3.15%3,626.0 3,684.6 -1.59%336.1CA Gardena Gardena Municipal Bus Lines TOTAL
2.62.2 1.7 1.40.1DR 2.0 2.0 -19.70%24.4 28.0 -12.86%Gardena Municipal Bus LinesCA Gardena355.5333.9 285.3 272.612.2MB 289.1 275.1 -3.03%3,601.6 3,656.6 -1.50%Gardena Municipal Bus LinesCA Gardena
266.7199.2 196.6 216.1 210.3NA -9.62%2,504.1 2,486.4 0.71%230.6CA Hesperia Victor Valley Transit Authority TOTAL
14.713.3 11.6 12.6NADR 11.7 12.9 -4.58%153.1 149.6 2.34%Victor Valley Transit AuthorityCA Hesperia205.9169.9 146.7 137.9NAMB 167.6 156.2 -14.20%1,811.4 1,881.9 -3.75%Victor Valley Transit AuthorityCA Hesperia46.147.4 40.9 46.1NAVP 36.8 41.2 8.30%539.6 454.9 18.62%Victor Valley Transit AuthorityCA Hesperia
163.2135.7 131.6 127.6 127.56.1 3.47%1,727.2 1,690.9 2.15%165.5CA Livermore Livermore/Amador Valley TA TOTAL
4.35.1 5.0 4.80.2DR 3.7 3.8 26.27%60.4 48.5 24.54%Livermore/Amador Valley TACA Livermore158.9160.4 130.7 126.85.9MB 123.9 123.7 2.80%1,666.8 1,642.4 1.49%Livermore/Amador Valley TACA Livermore
Modes: MB - Bus, DR - Demand Response, CR - Commuter Rail, HR - Heavy Rail, LR - Light Rail, AG - Automated Guideway, CC - Cable Car, FB - Ferry Boat, IP - Inclined Plane, IR - Intermediate Rail, MO - Monorail, TB - Trolleybus, VP - Vanpool
APTA PUBLIC TRANSPORTATION RIDERSHIP REPORT
State and Primary City
Transit Agency Mode
Average
Weekday Oct '15
Trips for Trips for
Nov '15
Trips for
Dec '15
Trips Thru
Dec '15
Trips for
Oct '14
Trips for
Nov '14
Trips for
Dec '14
Trips Thru
Dec '14 Quarterly
Change
Year-
Change
Fourth Quarter, 2015
(000's) (000's) (000's) (000's) (000's) (000's) (000's) (000's)(000's)
to-Date
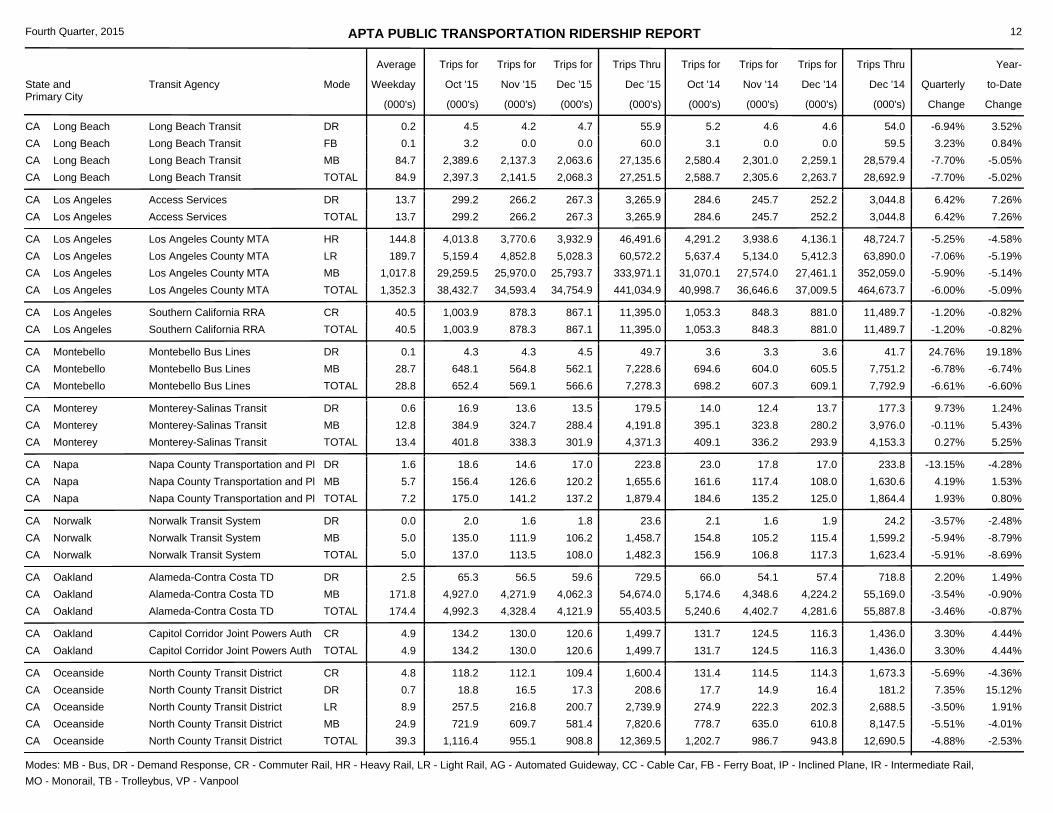
12
2,588.72,141.5 2,068.3 2,305.6 2,263.784.9 -7.70%27,251.5 28,692.9 -5.02%2,397.3CA Long Beach Long Beach Transit TOTAL
5.24.5 4.2 4.70.2DR 4.6 4.6 -6.94%55.9 54.0 3.52%Long Beach TransitCA Long Beach3.13.2 0.0 0.00.1FB 0.0 0.0 3.23%60.0 59.5 0.84%Long Beach TransitCA Long Beach
2,580.42,389.6 2,137.3 2,063.684.7MB 2,301.0 2,259.1 -7.70%27,135.6 28,579.4 -5.05%Long Beach TransitCA Long Beach
284.6266.2 267.3 245.7 252.213.7 6.42%3,265.9 3,044.8 7.26%299.2CA Los Angeles Access Services TOTAL284.6299.2 266.2 267.313.7DR 245.7 252.2 6.42%3,265.9 3,044.8 7.26%Access ServicesCA Los Angeles
40,998.734,593.4 34,754.9 36,646.6 37,009.51,352.3 -6.00%441,034.9 464,673.7 -5.09%38,432.7CA Los Angeles Los Angeles County MTA TOTAL
4,291.24,013.8 3,770.6 3,932.9144.8HR 3,938.6 4,136.1 -5.25%46,491.6 48,724.7 -4.58%Los Angeles County MTACA Los Angeles5,637.45,159.4 4,852.8 5,028.3189.7LR 5,134.0 5,412.3 -7.06%60,572.2 63,890.0 -5.19%Los Angeles County MTACA Los Angeles
31,070.129,259.5 25,970.0 25,793.71,017.8MB 27,574.0 27,461.1 -5.90%333,971.1 352,059.0 -5.14%Los Angeles County MTACA Los Angeles
1,053.3878.3 867.1 848.3 881.040.5 -1.20%11,395.0 11,489.7 -0.82%1,003.9CA Los Angeles Southern California RRA TOTAL1,053.31,003.9 878.3 867.140.5CR 848.3 881.0 -1.20%11,395.0 11,489.7 -0.82%Southern California RRACA Los Angeles
698.2569.1 566.6 607.3 609.128.8 -6.61%7,278.3 7,792.9 -6.60%652.4CA Montebello Montebello Bus Lines TOTAL
3.64.3 4.3 4.50.1DR 3.3 3.6 24.76%49.7 41.7 19.18%Montebello Bus LinesCA Montebello694.6648.1 564.8 562.128.7MB 604.0 605.5 -6.78%7,228.6 7,751.2 -6.74%Montebello Bus LinesCA Montebello
409.1338.3 301.9 336.2 293.913.4 0.27%4,371.3 4,153.3 5.25%401.8CA Monterey Monterey-Salinas Transit TOTAL
14.016.9 13.6 13.50.6DR 12.4 13.7 9.73%179.5 177.3 1.24%Monterey-Salinas TransitCA Monterey395.1384.9 324.7 288.412.8MB 323.8 280.2 -0.11%4,191.8 3,976.0 5.43%Monterey-Salinas TransitCA Monterey
184.6141.2 137.2 135.2 125.07.2 1.93%1,879.4 1,864.4 0.80%175.0CA Napa Napa County Transportation and Pl TOTAL
23.018.6 14.6 17.01.6DR 17.8 17.0 -13.15%223.8 233.8 -4.28%Napa County Transportation and PlCA Napa161.6156.4 126.6 120.25.7MB 117.4 108.0 4.19%1,655.6 1,630.6 1.53%Napa County Transportation and PlCA Napa
156.9113.5 108.0 106.8 117.35.0 -5.91%1,482.3 1,623.4 -8.69%137.0CA Norwalk Norwalk Transit System TOTAL
2.12.0 1.6 1.80.0DR 1.6 1.9 -3.57%23.6 24.2 -2.48%Norwalk Transit SystemCA Norwalk154.8135.0 111.9 106.25.0MB 105.2 115.4 -5.94%1,458.7 1,599.2 -8.79%Norwalk Transit SystemCA Norwalk
5,240.64,328.4 4,121.9 4,402.7 4,281.6174.4 -3.46%55,403.5 55,887.8 -0.87%4,992.3CA Oakland Alameda-Contra Costa TD TOTAL
66.065.3 56.5 59.62.5DR 54.1 57.4 2.20%729.5 718.8 1.49%Alameda-Contra Costa TDCA Oakland5,174.64,927.0 4,271.9 4,062.3171.8MB 4,348.6 4,224.2 -3.54%54,674.0 55,169.0 -0.90%Alameda-Contra Costa TDCA Oakland
131.7130.0 120.6 124.5 116.34.9 3.30%1,499.7 1,436.0 4.44%134.2CA Oakland Capitol Corridor Joint Powers Auth TOTAL131.7134.2 130.0 120.64.9CR 124.5 116.3 3.30%1,499.7 1,436.0 4.44%Capitol Corridor Joint Powers AuthCA Oakland
1,202.7955.1 908.8 986.7 943.839.3 -4.88%12,369.5 12,690.5 -2.53%1,116.4CA Oceanside North County Transit District TOTAL
131.4118.2 112.1 109.44.8CR 114.5 114.3 -5.69%1,600.4 1,673.3 -4.36%North County Transit DistrictCA Oceanside17.718.8 16.5 17.30.7DR 14.9 16.4 7.35%208.6 181.2 15.12%North County Transit DistrictCA Oceanside
274.9257.5 216.8 200.78.9LR 222.3 202.3 -3.50%2,739.9 2,688.5 1.91%North County Transit DistrictCA Oceanside778.7721.9 609.7 581.424.9MB 635.0 610.8 -5.51%7,820.6 8,147.5 -4.01%North County Transit DistrictCA Oceanside
Modes: MB - Bus, DR - Demand Response, CR - Commuter Rail, HR - Heavy Rail, LR - Light Rail, AG - Automated Guideway, CC - Cable Car, FB - Ferry Boat, IP - Inclined Plane, IR - Intermediate Rail, MO - Monorail, TB - Trolleybus, VP - Vanpool
APTA PUBLIC TRANSPORTATION RIDERSHIP REPORT
State and Primary City
Transit Agency Mode
Average
Weekday Oct '15
Trips for Trips for
Nov '15
Trips for
Dec '15
Trips Thru
Dec '15
Trips for
Oct '14
Trips for
Nov '14
Trips for
Dec '14
Trips Thru
Dec '14 Quarterly
Change
Year-
Change
Fourth Quarter, 2015
(000's) (000's) (000's) (000's) (000's) (000's) (000's) (000's)(000's)
to-Date
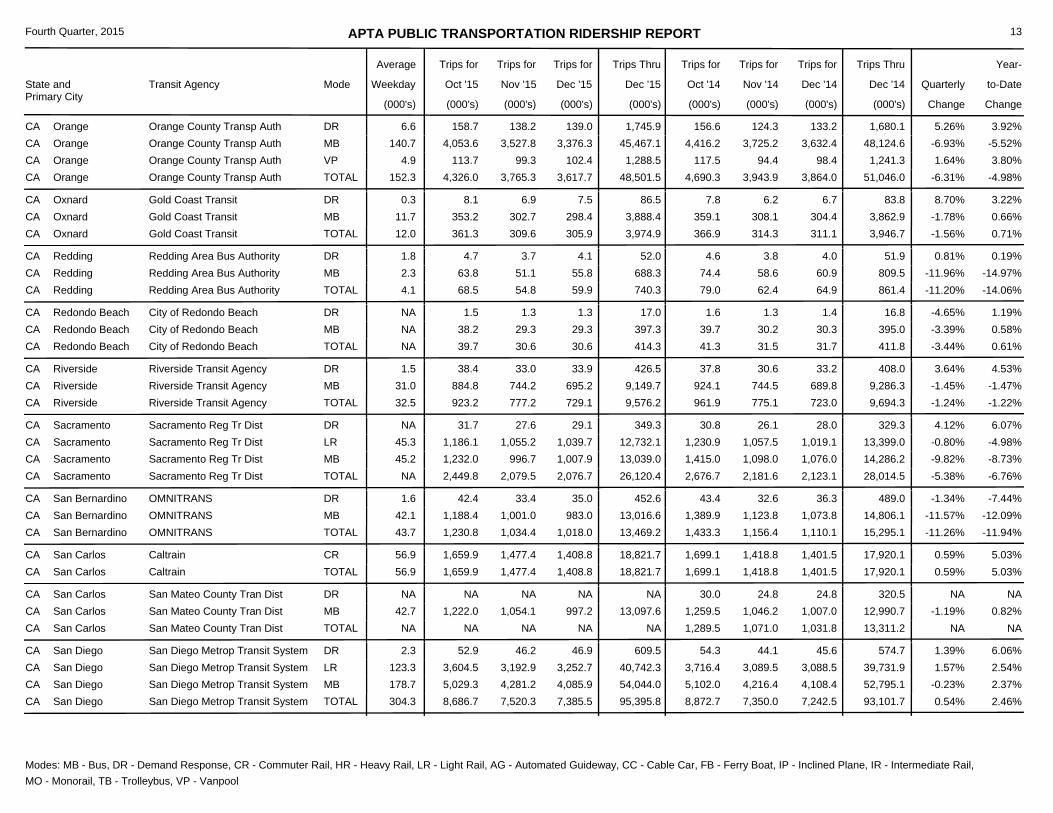
13
4,690.33,765.3 3,617.7 3,943.9 3,864.0152.3 -6.31%48,501.5 51,046.0 -4.98%4,326.0CA Orange Orange County Transp Auth TOTAL
156.6158.7 138.2 139.06.6DR 124.3 133.2 5.26%1,745.9 1,680.1 3.92%Orange County Transp AuthCA Orange4,416.24,053.6 3,527.8 3,376.3140.7MB 3,725.2 3,632.4 -6.93%45,467.1 48,124.6 -5.52%Orange County Transp AuthCA Orange
117.5113.7 99.3 102.44.9VP 94.4 98.4 1.64%1,288.5 1,241.3 3.80%Orange County Transp AuthCA Orange
366.9309.6 305.9 314.3 311.112.0 -1.56%3,974.9 3,946.7 0.71%361.3CA Oxnard Gold Coast Transit TOTAL
7.88.1 6.9 7.50.3DR 6.2 6.7 8.70%86.5 83.8 3.22%Gold Coast TransitCA Oxnard359.1353.2 302.7 298.411.7MB 308.1 304.4 -1.78%3,888.4 3,862.9 0.66%Gold Coast TransitCA Oxnard
79.054.8 59.9 62.4 64.94.1 -11.20%740.3 861.4 -14.06%68.5CA Redding Redding Area Bus Authority TOTAL
4.64.7 3.7 4.11.8DR 3.8 4.0 0.81%52.0 51.9 0.19%Redding Area Bus AuthorityCA Redding74.463.8 51.1 55.82.3MB 58.6 60.9 -11.96%688.3 809.5 -14.97%Redding Area Bus AuthorityCA Redding
41.330.6 30.6 31.5 31.7NA -3.44%414.3 411.8 0.61%39.7CA Redondo Beach City of Redondo Beach TOTAL
1.61.5 1.3 1.3NADR 1.3 1.4 -4.65%17.0 16.8 1.19%City of Redondo BeachCA Redondo Beach39.738.2 29.3 29.3NAMB 30.2 30.3 -3.39%397.3 395.0 0.58%City of Redondo BeachCA Redondo Beach
961.9777.2 729.1 775.1 723.032.5 -1.24%9,576.2 9,694.3 -1.22%923.2CA Riverside Riverside Transit Agency TOTAL
37.838.4 33.0 33.91.5DR 30.6 33.2 3.64%426.5 408.0 4.53%Riverside Transit AgencyCA Riverside924.1884.8 744.2 695.231.0MB 744.5 689.8 -1.45%9,149.7 9,286.3 -1.47%Riverside Transit AgencyCA Riverside
2,676.72,079.5 2,076.7 2,181.6 2,123.1NA -5.38%26,120.4 28,014.5 -6.76%2,449.8CA Sacramento Sacramento Reg Tr Dist TOTAL
30.831.7 27.6 29.1NADR 26.1 28.0 4.12%349.3 329.3 6.07%Sacramento Reg Tr DistCA Sacramento1,230.91,186.1 1,055.2 1,039.745.3LR 1,057.5 1,019.1 -0.80%12,732.1 13,399.0 -4.98%Sacramento Reg Tr DistCA Sacramento1,415.01,232.0 996.7 1,007.945.2MB 1,098.0 1,076.0 -9.82%13,039.0 14,286.2 -8.73%Sacramento Reg Tr DistCA Sacramento
1,433.31,034.4 1,018.0 1,156.4 1,110.143.7 -11.26%13,469.2 15,295.1 -11.94%1,230.8CA San Bernardino OMNITRANS TOTAL
43.442.4 33.4 35.01.6DR 32.6 36.3 -1.34%452.6 489.0 -7.44%OMNITRANSCA San Bernardino1,389.91,188.4 1,001.0 983.042.1MB 1,123.8 1,073.8 -11.57%13,016.6 14,806.1 -12.09%OMNITRANSCA San Bernardino
1,699.11,477.4 1,408.8 1,418.8 1,401.556.9 0.59%18,821.7 17,920.1 5.03%1,659.9CA San Carlos Caltrain TOTAL1,699.11,659.9 1,477.4 1,408.856.9CR 1,418.8 1,401.5 0.59%18,821.7 17,920.1 5.03%CaltrainCA San Carlos
1,289.5NA NA 1,071.0 1,031.8NA NANA 13,311.2 NANACA San Carlos San Mateo County Tran Dist TOTAL
30.0NA NA NANADR 24.8 24.8 NANA 320.5 NASan Mateo County Tran DistCA San Carlos1,259.51,222.0 1,054.1 997.242.7MB 1,046.2 1,007.0 -1.19%13,097.6 12,990.7 0.82%San Mateo County Tran DistCA San Carlos
8,872.77,520.3 7,385.5 7,350.0 7,242.5304.3 0.54%95,395.8 93,101.7 2.46%8,686.7CA San Diego San Diego Metrop Transit System TOTAL
54.352.9 46.2 46.92.3DR 44.1 45.6 1.39%609.5 574.7 6.06%San Diego Metrop Transit SystemCA San Diego3,716.43,604.5 3,192.9 3,252.7123.3LR 3,089.5 3,088.5 1.57%40,742.3 39,731.9 2.54%San Diego Metrop Transit SystemCA San Diego5,102.05,029.3 4,281.2 4,085.9178.7MB 4,216.4 4,108.4 -0.23%54,044.0 52,795.1 2.37%San Diego Metrop Transit SystemCA San Diego
Modes: MB - Bus, DR - Demand Response, CR - Commuter Rail, HR - Heavy Rail, LR - Light Rail, AG - Automated Guideway, CC - Cable Car, FB - Ferry Boat, IP - Inclined Plane, IR - Intermediate Rail, MO - Monorail, TB - Trolleybus, VP - Vanpool

APTA PUBLIC TRANSPORTATION RIDERSHIP REPORT
State and Primary City
Transit Agency Mode
Average
Weekday Oct '15
Trips for Trips for
Nov '15
Trips for
Dec '15
Trips Thru
Dec '15
Trips for
Oct '14
Trips for
Nov '14
Trips for
Dec '14
Trips Thru
Dec '14 Quarterly
Change
Year-
Change
Fourth Quarter, 2015
(000's) (000's) (000's) (000's) (000's) (000's) (000's) (000's)(000's)
to-Date
14
565.7448.7 437.9 447.2 442.619.1 -1.85%6,291.2 6,251.6 0.63%542.0CA San Francisco Golden Gate Bridge, Hwy & TD TOTAL
13.212.2 10.5 10.50.5DR 11.1 10.7 -5.14%139.2 138.8 0.29%Golden Gate Bridge, Hwy & TDCA San Francisco228.7210.8 168.4 160.97.3FB 164.9 163.7 -3.09%2,570.4 2,444.6 5.15%Golden Gate Bridge, Hwy & TDCA San Francisco323.8319.0 269.8 266.511.3MB 271.2 268.2 -0.92%3,581.6 3,668.2 -2.36%Golden Gate Bridge, Hwy & TDCA San Francisco
12,556.410,818.0 11,015.0 10,364.7 10,773.5455.9 1.32%136,060.6 132,287.3 2.85%12,304.8CA San Francisco San Francisco Bay Area RTD TOTAL
0.092.8 90.1 91.53.3AG 26.2 85.5 >100%1,016.1 111.7 >100%San Francisco Bay Area RTDCA San Francisco12,556.412,212.0 10,727.9 10,923.5452.6HR 10,338.5 10,688.0 0.84%135,044.5 132,175.6 2.17%San Francisco Bay Area RTDCA San Francisco
19,446.616,707.5 16,898.6 16,769.1 16,600.9658.5 0.13%213,946.3 221,998.7 -3.63%19,281.4CA San Francisco San Francisco Muni Rwy TOTAL
648.9661.9 495.0 446.517.7CC 485.3 437.8 2.00%6,910.0 7,213.7 -4.21%San Francisco Muni RwyCA San Francisco4,580.64,537.2 3,789.2 3,916.2156.0LR 3,805.8 3,847.4 0.07%52,122.6 54,135.0 -3.72%San Francisco Muni RwyCA San Francisco8,454.48,986.8 7,931.8 7,970.1314.4MB 7,626.2 7,531.9 5.40%97,432.1 97,269.2 0.17%San Francisco Muni RwyCA San Francisco5,762.75,095.5 4,491.5 4,565.8170.4TB 4,851.8 4,783.8 -8.09%57,481.6 63,380.8 -9.31%San Francisco Muni RwyCA San Francisco
207.6167.6 160.8 133.9 133.07.4 17.32%2,368.5 1,973.6 20.01%228.3CA San Francisco Water Emergency Tr Auth TOTAL207.6228.3 167.6 160.87.4FB 133.9 133.0 17.32%2,368.5 1,973.6 20.01%Water Emergency Tr AuthCA San Francisco
4,196.83,657.0 3,430.7 3,563.7 3,402.8144.8 1.75%45,419.3 44,846.1 1.28%4,271.0CA San Jose Santa Clara Valley Trp Auth TOTAL
67.364.4 54.1 49.52.4DR 55.8 56.2 -6.30%703.6 724.6 -2.90%Santa Clara Valley Trp AuthCA San Jose1,095.81,040.8 872.3 850.333.4LR 942.9 876.7 -5.21%11,030.4 11,363.7 -2.93%Santa Clara Valley Trp AuthCA San Jose3,033.73,165.8 2,730.6 2,530.9109.1MB 2,565.0 2,469.9 4.45%33,685.3 32,757.8 2.83%Santa Clara Valley Trp AuthCA San Jose
320.4248.0 236.4 261.6 242.310.3 -4.95%3,310.7 3,464.5 -4.44%299.1CA San Rafael Marin County Transit District TOTAL
12.811.8 10.1 10.10.4DR 10.7 10.3 -5.33%134.2 135.0 -0.59%Marin County Transit DistrictCA San Rafael307.6287.3 237.9 226.39.8MB 250.9 232.0 -4.93%3,176.5 3,329.5 -4.60%Marin County Transit DistrictCA San Rafael
781.1575.9 468.6 618.1 545.724.0 -9.91%7,246.6 7,626.7 -4.98%707.7CA Santa Barbara Santa Barbara MTD TOTAL
5.45.1 4.4 4.40.2DR 4.5 4.7 -4.79%56.5 57.7 -2.08%Santa Barbara MTDCA Santa Barbara775.7702.6 571.5 464.223.8MB 613.6 541.0 -9.95%7,190.1 7,569.0 -5.01%Santa Barbara MTDCA Santa Barbara
334.4260.7 239.3 276.0 258.110.7 -7.44%3,289.8 3,518.4 -6.50%303.9CA Santa Clarita Santa Clarita Transit TOTAL
10.18.6 7.3 7.30.4DR 8.4 8.6 -14.39%100.2 111.0 -9.73%Santa Clarita TransitCA Santa Clarita324.3295.3 253.4 232.010.4MB 267.6 249.5 -7.21%3,189.6 3,407.4 -6.39%Santa Clarita TransitCA Santa Clarita
NANA NA NA NANA NANA NA NANACA Santa Cruz Santa Cruz Metro Transit Dist TOTAL
NANA NA NANADR NA NA NANA NA NASanta Cruz Metro Transit DistCA Santa Cruz672.3445.7 509.8 324.619.6MB 515.0 407.9 -19.75%5,478.4 5,590.0 -2.00%Santa Cruz Metro Transit DistCA Santa Cruz
1,782.41,273.6 1,441.1 1,457.9 1,641.264.1 -15.48%17,653.2 18,617.7 -5.18%1,410.9CA Santa Monica Santa Monica's Big Blue Bus TOTAL
23.822.6 20.1 19.71.0DR 19.6 19.4 -0.64%251.1 247.1 1.62%Santa Monica's Big Blue BusCA Santa Monica1,758.61,388.3 1,253.5 1,421.463.1MB 1,438.3 1,621.8 -15.68%17,402.1 18,370.6 -5.27%Santa Monica's Big Blue BusCA Santa Monica
Modes: MB - Bus, DR - Demand Response, CR - Commuter Rail, HR - Heavy Rail, LR - Light Rail, AG - Automated Guideway, CC - Cable Car, FB - Ferry Boat, IP - Inclined Plane, IR - Intermediate Rail, MO - Monorail, TB - Trolleybus, VP - Vanpool
APTA PUBLIC TRANSPORTATION RIDERSHIP REPORT
State and Primary City
Transit Agency Mode
Average
Weekday Oct '15
Trips for Trips for
Nov '15
Trips for
Dec '15
Trips Thru
Dec '15
Trips for
Oct '14
Trips for
Nov '14
Trips for
Dec '14
Trips Thru
Dec '14 Quarterly
Change
Year-
Change
Fourth Quarter, 2015
(000's) (000's) (000's) (000's) (000's) (000's) (000's) (000's)(000's)
to-Date
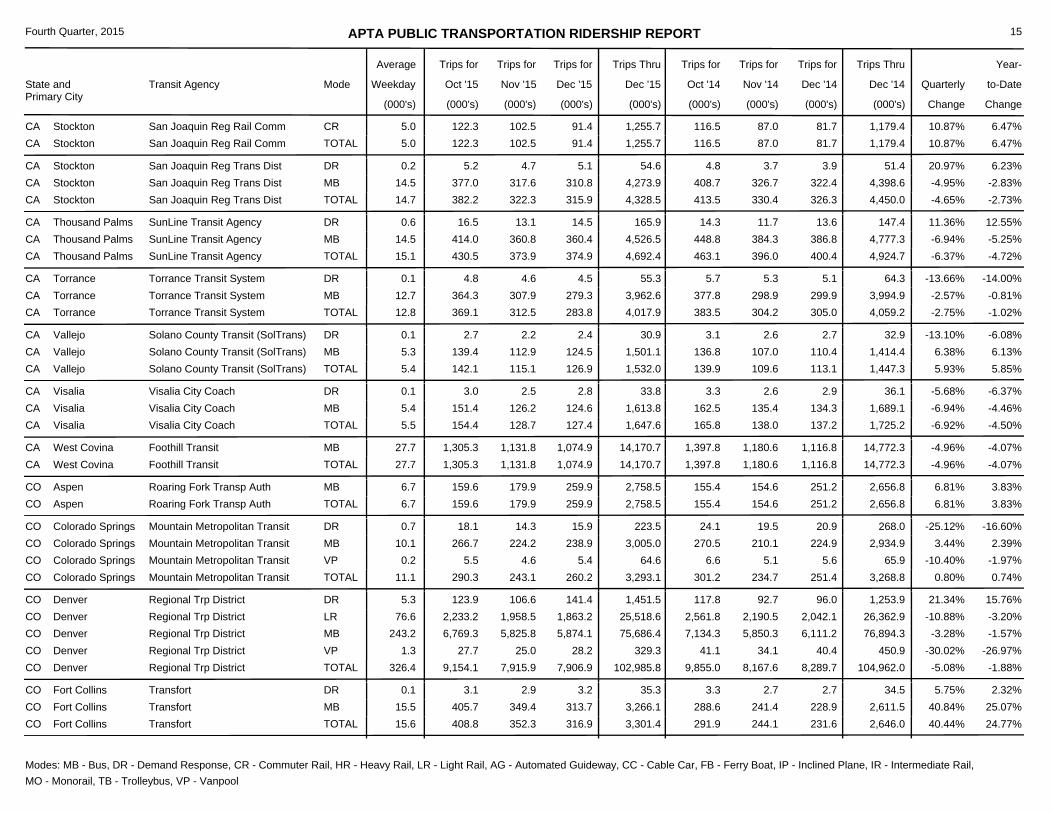
15
116.5102.5 91.4 87.0 81.75.0 10.87%1,255.7 1,179.4 6.47%122.3CA Stockton San Joaquin Reg Rail Comm TOTAL116.5122.3 102.5 91.45.0CR 87.0 81.7 10.87%1,255.7 1,179.4 6.47%San Joaquin Reg Rail CommCA Stockton
413.5322.3 315.9 330.4 326.314.7 -4.65%4,328.5 4,450.0 -2.73%382.2CA Stockton San Joaquin Reg Trans Dist TOTAL
4.85.2 4.7 5.10.2DR 3.7 3.9 20.97%54.6 51.4 6.23%San Joaquin Reg Trans DistCA Stockton408.7377.0 317.6 310.814.5MB 326.7 322.4 -4.95%4,273.9 4,398.6 -2.83%San Joaquin Reg Trans DistCA Stockton
463.1373.9 374.9 396.0 400.415.1 -6.37%4,692.4 4,924.7 -4.72%430.5CA Thousand Palms SunLine Transit Agency TOTAL
14.316.5 13.1 14.50.6DR 11.7 13.6 11.36%165.9 147.4 12.55%SunLine Transit AgencyCA Thousand Palms448.8414.0 360.8 360.414.5MB 384.3 386.8 -6.94%4,526.5 4,777.3 -5.25%SunLine Transit AgencyCA Thousand Palms
383.5312.5 283.8 304.2 305.012.8 -2.75%4,017.9 4,059.2 -1.02%369.1CA Torrance Torrance Transit System TOTAL
5.74.8 4.6 4.50.1DR 5.3 5.1 -13.66%55.3 64.3 -14.00%Torrance Transit SystemCA Torrance377.8364.3 307.9 279.312.7MB 298.9 299.9 -2.57%3,962.6 3,994.9 -0.81%Torrance Transit SystemCA Torrance
139.9115.1 126.9 109.6 113.15.4 5.93%1,532.0 1,447.3 5.85%142.1CA Vallejo Solano County Transit (SolTrans) TOTAL
3.12.7 2.2 2.40.1DR 2.6 2.7 -13.10%30.9 32.9 -6.08%Solano County Transit (SolTrans)CA Vallejo136.8139.4 112.9 124.55.3MB 107.0 110.4 6.38%1,501.1 1,414.4 6.13%Solano County Transit (SolTrans)CA Vallejo
165.8128.7 127.4 138.0 137.25.5 -6.92%1,647.6 1,725.2 -4.50%154.4CA Visalia Visalia City Coach TOTAL
3.33.0 2.5 2.80.1DR 2.6 2.9 -5.68%33.8 36.1 -6.37%Visalia City CoachCA Visalia162.5151.4 126.2 124.65.4MB 135.4 134.3 -6.94%1,613.8 1,689.1 -4.46%Visalia City CoachCA Visalia
1,397.81,131.8 1,074.9 1,180.6 1,116.827.7 -4.96%14,170.7 14,772.3 -4.07%1,305.3CA West Covina Foothill Transit TOTAL1,397.81,305.3 1,131.8 1,074.927.7MB 1,180.6 1,116.8 -4.96%14,170.7 14,772.3 -4.07%Foothill TransitCA West Covina
155.4179.9 259.9 154.6 251.26.7 6.81%2,758.5 2,656.8 3.83%159.6CO Aspen Roaring Fork Transp Auth TOTAL155.4159.6 179.9 259.96.7MB 154.6 251.2 6.81%2,758.5 2,656.8 3.83%Roaring Fork Transp AuthCO Aspen
301.2243.1 260.2 234.7 251.411.1 0.80%3,293.1 3,268.8 0.74%290.3CO Colorado Springs Mountain Metropolitan Transit TOTAL
24.118.1 14.3 15.90.7DR 19.5 20.9 -25.12%223.5 268.0 -16.60%Mountain Metropolitan TransitCO Colorado Springs270.5266.7 224.2 238.910.1MB 210.1 224.9 3.44%3,005.0 2,934.9 2.39%Mountain Metropolitan TransitCO Colorado Springs
6.65.5 4.6 5.40.2VP 5.1 5.6 -10.40%64.6 65.9 -1.97%Mountain Metropolitan TransitCO Colorado Springs
9,855.07,915.9 7,906.9 8,167.6 8,289.7326.4 -5.08%102,985.8 104,962.0 -1.88%9,154.1CO Denver Regional Trp District TOTAL
117.8123.9 106.6 141.45.3DR 92.7 96.0 21.34%1,451.5 1,253.9 15.76%Regional Trp DistrictCO Denver2,561.82,233.2 1,958.5 1,863.276.6LR 2,190.5 2,042.1 -10.88%25,518.6 26,362.9 -3.20%Regional Trp DistrictCO Denver7,134.36,769.3 5,825.8 5,874.1243.2MB 5,850.3 6,111.2 -3.28%75,686.4 76,894.3 -1.57%Regional Trp DistrictCO Denver
41.127.7 25.0 28.21.3VP 34.1 40.4 -30.02%329.3 450.9 -26.97%Regional Trp DistrictCO Denver
291.9352.3 316.9 244.1 231.615.6 40.44%3,301.4 2,646.0 24.77%408.8CO Fort Collins Transfort TOTAL
3.33.1 2.9 3.20.1DR 2.7 2.7 5.75%35.3 34.5 2.32%TransfortCO Fort Collins288.6405.7 349.4 313.715.5MB 241.4 228.9 40.84%3,266.1 2,611.5 25.07%TransfortCO Fort Collins
Modes: MB - Bus, DR - Demand Response, CR - Commuter Rail, HR - Heavy Rail, LR - Light Rail, AG - Automated Guideway, CC - Cable Car, FB - Ferry Boat, IP - Inclined Plane, IR - Intermediate Rail, MO - Monorail, TB - Trolleybus, VP - Vanpool

APTA PUBLIC TRANSPORTATION RIDERSHIP REPORT
State and Primary City
Transit Agency Mode
Average
Weekday Oct '15
Trips for Trips for
Nov '15
Trips for
Dec '15
Trips Thru
Dec '15
Trips for
Oct '14
Trips for
Nov '14
Trips for
Dec '14
Trips Thru
Dec '14 Quarterly
Change
Year-
Change
Fourth Quarter, 2015
(000's) (000's) (000's) (000's) (000's) (000's) (000's) (000's)(000's)
to-Date
16
82.259.9 66.7 69.4 74.02.7 -12.46%831.1 919.1 -9.57%70.9CO Grand Junction Mesa County Reg Transp Office TOTAL
1.51.5 1.4 1.50.1DR 1.2 1.3 10.00%17.5 17.4 0.57%Mesa County Reg Transp OfficeCO Grand Junction80.769.4 58.5 65.22.6MB 68.2 72.7 -12.86%813.6 901.7 -9.77%Mesa County Reg Transp OfficeCO Grand Junction
6.75.7 6.0 5.3 6.00.2 -0.56%70.8 69.9 1.29%6.2CT Hartford Connecticut DOT TOTAL6.76.2 5.7 6.00.2DR 5.3 6.0 -0.56%70.8 69.9 1.29%Connecticut DOTCT Hartford
2,605.02,247.0 2,308.3 2,153.5 2,295.194.1 1.15%27,759.1 27,747.4 0.04%2,579.4CT Hartford Connecticut Transit TOTAL2,605.02,579.4 2,247.0 2,308.394.1MB 2,153.5 2,295.1 1.15%27,759.1 27,747.4 0.04%Connecticut TransitCT Hartford
43.441.2 44.9 33.8 36.31.8 16.56%472.1 450.8 4.72%46.2CT Hartford Greater Hartford Tran Dist TOTAL43.446.2 41.2 44.91.8DR 33.8 36.3 16.56%472.1 450.8 4.72%Greater Hartford Tran DistCT Hartford
58.949.1 48.9 50.2 49.92.0 -5.35%610.0 658.3 -7.34%52.5CT New Haven Connecticut DOT TOTAL58.952.5 49.1 48.92.0CR 50.2 49.9 -5.35%610.0 658.3 -7.34%Connecticut DOTCT New Haven
23.720.4 22.2 20.4 22.4NA -3.76%130.2 129.8 0.31%21.4CT New Haven Greater New Haven Transit Dist TOTAL23.721.4 20.4 22.2NADR 20.4 22.4 -3.76%130.2 129.8 0.31%Greater New Haven Transit DistCT New Haven
181.2146.1 146.7 149.1 155.66.0 -5.45%1,842.7 1,917.5 -3.90%166.6CT Norwalk Norwalk Transit District TOTAL
10.210.1 9.1 9.80.4DR 8.4 9.2 4.32%112.6 108.7 3.59%Norwalk Transit DistrictCT Norwalk171.0156.5 137.0 136.95.6MB 140.7 146.4 -6.05%1,730.1 1,808.8 -4.35%Norwalk Transit DistrictCT Norwalk
36,897.729,227.2 29,539.8 30,360.1 31,101.71,261.6 -5.72%392,242.5 405,473.4 -3.26%33,966.0DC Washington Washington Metro Area TA TOTAL
24,698.922,471.1 19,008.2 19,316.7836.8HR 20,160.8 20,565.1 -7.07%261,435.2 271,160.0 -3.59%Washington Metro Area TADC Washington12,198.811,494.9 10,219.0 10,223.1424.9MB 10,199.3 10,536.6 -3.03%130,807.3 134,313.4 -2.61%Washington Metro Area TADC Washington
984.5754.7 781.1 785.2 842.134.0 -8.22%9,759.8 10,597.3 -7.90%861.2DE Wilmington Delaware Transit Corp TOTAL
94.488.5 76.1 82.43.6DR 74.9 82.6 -1.95%984.0 1,010.8 -2.65%Delaware Transit CorpDE Wilmington890.1772.7 678.6 698.730.4MB 710.3 759.5 -8.89%8,775.8 9,586.5 -8.46%Delaware Transit CorpDE Wilmington
165.2138.9 142.4 140.6 150.65.5 -3.97%1,844.0 1,902.7 -3.09%157.0FL Bradenton Manatee County Area Transit TOTAL
8.99.5 8.1 8.10.3DR 6.9 7.8 8.90%103.8 92.8 11.85%Manatee County Area TransitFL Bradenton156.3147.5 130.8 134.35.2MB 133.7 142.8 -4.67%1,740.2 1,809.9 -3.85%Manatee County Area TransitFL Bradenton
3,800.43,014.8 3,071.4 3,281.7 3,456.0123.8 -10.38%39,209.1 41,445.8 -5.40%3,358.3FL Fort Lauderdale Broward County Transit TOTAL
59.461.7 55.1 57.62.4DR 48.3 50.9 9.96%662.9 656.4 0.99%Broward County TransitFL Fort Lauderdale3,741.03,296.6 2,959.7 3,013.8121.4MB 3,233.4 3,405.1 -10.69%38,546.2 40,789.4 -5.50%Broward County TransitFL Fort Lauderdale
361.9281.3 301.8 316.1 349.811.3 -13.86%3,726.1 4,070.7 -8.47%302.2FL Fort Myers Lee Tran TOTAL
10.110.0 9.1 9.60.4DR 8.5 9.2 3.24%114.7 110.0 4.27%Lee Tran FL Fort Myers346.7290.6 270.4 290.511.0MB 302.4 336.3 -13.59%3,583.2 3,912.8 -8.42%Lee Tran FL Fort Myers
5.11.6 1.8 1.70.0VP 5.2 4.3 -65.07%28.2 47.9 -41.13%Lee Tran FL Fort Myers
Modes: MB - Bus, DR - Demand Response, CR - Commuter Rail, HR - Heavy Rail, LR - Light Rail, AG - Automated Guideway, CC - Cable Car, FB - Ferry Boat, IP - Inclined Plane, IR - Intermediate Rail, MO - Monorail, TB - Trolleybus, VP - Vanpool

APTA PUBLIC TRANSPORTATION RIDERSHIP REPORT
State and Primary City
Transit Agency Mode
Average
Weekday Oct '15
Trips for Trips for
Nov '15
Trips for
Dec '15
Trips Thru
Dec '15
Trips for
Oct '14
Trips for
Nov '14
Trips for
Dec '14
Trips Thru
Dec '14 Quarterly
Change
Year-
Change
Fourth Quarter, 2015
(000's) (000's) (000's) (000's) (000's) (000's) (000's) (000's)(000's)
to-Date
17
1,281.3884.6 631.9 904.1 697.145.7 -6.36%10,118.8 10,849.3 -6.73%1,182.7FL Gainesville Regional Transit System TOTAL
4.84.4 3.7 3.90.1DR 3.9 4.1 -6.25%50.0 51.6 -3.10%Regional Transit SystemFL Gainesville1,276.51,178.3 880.9 628.045.6MB 900.2 693.0 -6.36%10,068.8 10,797.7 -6.75%Regional Transit SystemFL Gainesville
1,245.01,078.5 1,120.9 993.9 1,201.545.0 -0.24%13,388.1 12,837.0 4.29%1,232.7FL Jacksonville Jacksonville Transp Auth TOTAL
116.7105.5 87.2 93.74.4AG 91.6 115.4 -11.52%1,279.4 1,221.6 4.73%Jacksonville Transp AuthFL Jacksonville35.033.0 29.8 30.71.2DR 29.1 29.1 0.32%373.1 372.0 0.30%Jacksonville Transp AuthFL Jacksonville
1,093.31,094.2 961.5 996.539.3MB 873.2 1,057.0 0.95%11,735.6 11,243.4 4.38%Jacksonville Transp AuthFL Jacksonville
9,771.48,204.9 NA 8,566.9 9,101.7NA NANA 109,294.6 NA9,035.2FL Miami Miami-Dade Transit Agency TOTAL
908.7899.4 828.6 882.834.6AG 768.6 859.9 2.90%10,011.1 9,949.2 0.62%Miami-Dade Transit AgencyFL Miami153.1146.8 131.0 129.75.5DR 129.4 131.8 -1.64%1,644.2 1,671.3 -1.62%Miami-Dade Transit AgencyFL Miami
1,976.11,930.4 1,761.8 1,813.575.3HR 1,706.4 1,810.8 0.23%21,923.0 21,722.1 0.92%Miami-Dade Transit AgencyFL Miami6,733.56,058.6 5,483.5 NANAMB 5,962.5 6,299.2 NANA 75,952.0 NAMiami-Dade Transit AgencyFL Miami
2,786.72,161.2 2,224.5 2,376.8 2,512.584.7 -11.85%28,314.1 29,969.1 -5.52%2,381.0FL Orlando Central Florida RTA TOTAL
66.663.2 56.5 57.72.3DR 56.9 60.1 -3.38%694.9 765.6 -9.23%Central Florida RTAFL Orlando2,690.32,286.2 2,074.8 2,137.081.1MB 2,293.7 2,424.6 -12.29%27,262.3 28,858.8 -5.53%Central Florida RTAFL Orlando
29.831.6 29.9 29.81.3VP 26.2 27.8 8.95%356.9 344.7 3.54%Central Florida RTAFL Orlando
74.170.5 80.6 60.5 79.8NA -0.98%958.8 612.0 56.67%61.2FL Orlando SunRail TOTAL74.161.2 70.5 80.6NACR 60.5 79.8 -0.98%958.8 612.0 56.67%SunRailFL Orlando
485.9436.2 448.5 431.4 448.718.0 -0.94%5,333.7 5,432.1 -1.81%468.4FL Pompano Beach South Florida RTA (Tri-Rail) TOTAL
390.7374.7 347.9 356.414.2CR 348.1 357.0 -1.53%4,240.6 4,389.6 -3.39%South Florida RTA (Tri-Rail)FL Pompano Beach95.293.7 88.3 92.13.8MB 83.3 91.7 1.44%1,093.1 1,042.5 4.85%South Florida RTA (Tri-Rail)FL Pompano Beach
270.6227.9 244.7 240.7 257.29.5 -6.08%2,860.0 3,046.0 -6.11%249.2FL Sarasota Sarasota County Area Transit TOTAL
16.416.5 14.5 15.10.7DR 13.8 14.5 3.13%169.8 173.6 -2.19%Sarasota County Area TransitFL Sarasota254.2232.7 213.4 229.68.8MB 226.9 242.7 -6.65%2,690.2 2,872.4 -6.34%Sarasota County Area TransitFL Sarasota
1,349.61,104.2 1,151.5 1,155.2 1,238.044.2 -6.35%14,661.3 14,650.8 0.07%1,249.6FL St. Petersburg Pinellas Suncoast Tran Auth TOTAL
28.528.3 25.3 26.31.0DR 24.8 26.6 0.00%320.4 318.4 0.63%Pinellas Suncoast Tran AuthFL St. Petersburg1,321.11,221.3 1,078.9 1,125.243.1MB 1,130.4 1,211.4 -6.48%14,340.9 14,332.4 0.06%Pinellas Suncoast Tran AuthFL St. Petersburg
481.3329.5 241.0 328.3 257.419.3 -7.80%3,867.8 4,267.0 -9.36%413.3FL Tallahassee StarMetro-City of Tallahassee TOTAL
8.88.1 6.7 6.93.1DR 6.6 6.8 -2.25%91.7 88.3 3.85%StarMetro-City of TallahasseeFL Tallahassee472.5405.2 322.8 234.116.3MB 321.7 250.6 -7.92%3,776.1 4,178.7 -9.63%StarMetro-City of TallahasseeFL Tallahassee
1,476.91,216.6 1,262.7 1,218.9 1,312.249.9 -4.58%15,172.4 15,544.9 -2.40%1,345.1FL Tampa Hillsborough Area Reg TA TOTAL
14.114.5 13.1 13.50.6DR 11.6 12.4 7.87%161.1 150.0 7.40%Hillsborough Area Reg TAFL Tampa23.923.5 19.3 26.50.6LR 21.6 26.1 -3.21%285.9 273.5 4.53%Hillsborough Area Reg TAFL Tampa
1,438.91,307.1 1,184.2 1,222.748.7MB 1,185.7 1,273.7 -4.73%14,725.4 15,121.4 -2.62%Hillsborough Area Reg TAFL Tampa
Modes: MB - Bus, DR - Demand Response, CR - Commuter Rail, HR - Heavy Rail, LR - Light Rail, AG - Automated Guideway, CC - Cable Car, FB - Ferry Boat, IP - Inclined Plane, IR - Intermediate Rail, MO - Monorail, TB - Trolleybus, VP - Vanpool

APTA PUBLIC TRANSPORTATION RIDERSHIP REPORT
State and Primary City
Transit Agency Mode
Average
Weekday Oct '15
Trips for Trips for
Nov '15
Trips for
Dec '15
Trips Thru
Dec '15
Trips for
Oct '14
Trips for
Nov '14
Trips for
Dec '14
Trips Thru
Dec '14 Quarterly
Change
Year-
Change
Fourth Quarter, 2015
(000's) (000's) (000's) (000's) (000's) (000's) (000's) (000's)(000's)
to-Date
18
NANA NA NA NANA NANA NA NANAFL West Palm Beach Palm Beach County STD TOTAL
NANA NA NANADR NA NA NANA NA NAPalm Beach County STDFL West Palm Beach928.8932.0 832.2 840.635.4MB 744.7 819.3 4.49%10,217.9 10,796.9 -5.36%Palm Beach County STDFL West Palm Beach
12,673.411,073.9 10,650.7 10,485.0 10,981.3432.9 -0.78%134,701.3 134,063.8 0.48%12,148.8GA Atlanta Metro Atlanta Rapid Tr Auth TOTAL
53.557.4 51.0 53.32.2DR 47.3 49.7 7.44%649.1 596.0 8.91%Metro Atlanta Rapid Tr AuthGA Atlanta6,752.76,619.0 5,797.4 5,820.2231.7HR 5,548.0 5,846.5 0.49%72,030.5 71,504.6 0.74%Metro Atlanta Rapid Tr AuthGA Atlanta5,867.25,472.4 5,225.5 4,777.2199.0MB 4,889.7 5,085.1 -2.32%62,021.7 61,963.2 0.09%Metro Atlanta Rapid Tr AuthGA Atlanta
6,235.05,481.2 5,688.6 5,590.7 5,784.1212.6 -2.66%68,884.2 71,230.8 -3.29%5,972.4HI Honolulu City & Cnty of Honolulu DOTS TOTAL
87.192.0 85.3 90.23.4DR 77.5 83.2 7.95%1,054.6 1,007.0 4.73%City & Cnty of Honolulu DOTSHI Honolulu6,147.95,880.4 5,395.9 5,598.4209.2MB 5,513.2 5,700.9 -2.81%67,829.6 70,223.8 -3.41%City & Cnty of Honolulu DOTSHI Honolulu
893.1637.9 510.2 627.1 560.429.5 -2.61%6,688.0 6,762.0 -1.09%878.2IA Ames Ames Transit Agency TOTAL
0.90.8 0.7 0.80.1DR 0.7 0.8 -4.17%11.0 11.1 -0.90%Ames Transit AgencyIA Ames892.2877.4 637.2 509.429.4MB 626.4 559.6 -2.61%6,677.0 6,750.9 -1.09%Ames Transit AgencyIA Ames
472.9369.4 360.8 360.6 364.418.4 -1.52%4,775.7 4,774.1 0.03%449.5IA Des Moines Des Moines Area Regional TA TOTAL
11.510.7 9.2 10.10.5DR 9.9 11.1 -7.69%132.8 141.5 -6.15%Des Moines Area Regional TAIA Des Moines439.0420.2 344.1 334.417.2MB 333.0 334.4 -0.70%4,423.9 4,396.2 0.63%Des Moines Area Regional TAIA Des Moines22.418.6 16.1 16.30.8VP 17.7 18.9 -13.56%219.0 236.4 -7.36%Des Moines Area Regional TAIA Des Moines
36.328.6 65.6 31.4 61.2NA -2.72%538.3 535.1 0.60%31.2ID Ketchum Mountain Rides Transportation Auth TOTAL
0.20.3 0.4 0.3NADR 0.5 0.3 0.00%4.1 2.6 57.69%Mountain Rides Transportation AuthID Ketchum31.027.0 25.5 62.6NAMB 27.0 57.9 -0.69%493.7 480.4 2.77%Mountain Rides Transportation AuthID Ketchum5.13.9 2.7 2.7NAVP 3.9 3.0 -22.50%40.5 52.1 -22.26%Mountain Rides Transportation AuthID Ketchum
3,602.62,983.9 2,971.3 2,973.6 3,079.1129.9 -2.77%37,415.4 38,943.8 -3.92%3,433.1IL Arlington Heights PACE Suburban Bus TOTAL
469.9455.8 422.1 431.718.4DR 412.3 434.5 -0.54%5,245.0 5,141.5 2.01%PACE Suburban BusIL Arlington Heights2,935.62,798.5 2,404.5 2,377.1103.8MB 2,405.1 2,471.6 -2.97%30,115.6 31,647.0 -4.84%PACE Suburban BusIL Arlington Heights
197.1178.8 157.3 162.57.8VP 156.2 173.0 -5.26%2,054.8 2,155.3 -4.66%PACE Suburban BusIL Arlington Heights
48,082.041,126.1 39,844.7 40,245.2 40,311.11,641.4 0.03%515,964.0 514,217.3 0.34%47,711.9IL Chicago Chicago Transit Authority TOTAL
0.00.0 0.0 0.00.0DR 0.0 0.0 0.00%0.0 0.0 NAChicago Transit AuthorityIL Chicago22,443.522,664.0 19,470.6 18,501.3772.9HR 18,760.5 18,365.8 1.79%241,676.0 238,100.2 1.50%Chicago Transit AuthorityIL Chicago25,638.525,047.9 21,655.5 21,343.4868.4MB 21,484.7 21,945.3 -1.48%274,288.0 276,117.1 -0.66%Chicago Transit AuthorityIL Chicago
6,455.55,905.2 5,747.3 6,004.8 6,022.8292.0 -3.36%73,071.1 74,381.9 -1.76%6,209.4IL Chicago Metra TOTAL6,455.56,209.4 5,905.2 5,747.3292.0CR 6,004.8 6,022.8 -3.36%73,071.1 74,381.9 -1.76%MetraIL Chicago
Modes: MB - Bus, DR - Demand Response, CR - Commuter Rail, HR - Heavy Rail, LR - Light Rail, AG - Automated Guideway, CC - Cable Car, FB - Ferry Boat, IP - Inclined Plane, IR - Intermediate Rail, MO - Monorail, TB - Trolleybus, VP - Vanpool

APTA PUBLIC TRANSPORTATION RIDERSHIP REPORT
State and Primary City
Transit Agency Mode
Average
Weekday Oct '15
Trips for Trips for
Nov '15
Trips for
Dec '15
Trips Thru
Dec '15
Trips for
Oct '14
Trips for
Nov '14
Trips for
Dec '14
Trips Thru
Dec '14 Quarterly
Change
Year-
Change
Fourth Quarter, 2015
(000's) (000's) (000's) (000's) (000's) (000's) (000's) (000's)(000's)
to-Date
19
287.5216.6 220.1 217.7 215.59.8 -3.18%2,819.7 2,896.7 -2.66%261.1IL Granite City Madison County Trans Dist TOTAL
6.25.7 4.8 5.10.2DR 5.1 5.5 -7.14%64.5 66.6 -3.15%Madison County Trans DistIL Granite City264.9244.5 202.4 206.49.1MB 200.5 197.9 -1.51%2,613.8 2,651.5 -1.42%Madison County Trans DistIL Granite City16.410.9 9.4 8.60.5VP 12.1 12.1 -28.82%141.4 178.6 -20.83%Madison County Trans DistIL Granite City
66.053.0 55.0 52.0 55.01.2 -2.31%680.0 664.0 2.41%61.0IL Harrisburg Rides Mass Transit District TOTAL66.061.0 53.0 55.01.2MB 52.0 55.0 -2.31%680.0 664.0 2.41%Rides Mass Transit DistrictIL Harrisburg
253.0149.8 129.1 176.2 159.86.9 -17.42%1,678.3 1,933.5 -13.20%207.5IL Macomb Go West Transit TOTAL253.0207.5 149.8 129.16.9MB 176.2 159.8 -17.42%1,678.3 1,933.5 -13.20%Go West TransitIL Macomb
309.3280.5 297.8 282.8 296.411.9 -0.44%3,527.3 3,518.6 0.25%306.3IL Moline Rock Island County MMTD TOTAL
6.46.1 5.9 6.10.2DR 5.5 6.0 1.12%72.0 70.2 2.56%Rock Island County MMTDIL Moline0.20.4 0.0 0.00.0FB 0.0 0.0 100.00%42.3 30.8 37.34%Rock Island County MMTDIL Moline
302.7299.8 274.6 291.711.7MB 277.3 290.4 -0.49%3,413.0 3,417.6 -0.13%Rock Island County MMTDIL Moline
298.5204.3 177.2 226.0 200.19.9 -10.17%2,603.0 2,738.1 -4.93%269.4IL Normal Bloomington-Normal Public Transit TOTAL
7.36.5 5.7 5.80.3DR 5.9 6.1 -6.74%71.9 71.4 0.70%Bloomington-Normal Public Transit IL Normal291.2262.9 198.6 171.49.6MB 220.1 194.0 -10.27%2,531.1 2,666.7 -5.08%Bloomington-Normal Public Transit IL Normal
346.7265.5 268.2 281.8 296.111.1 -9.31%3,400.1 3,578.7 -4.99%304.8IL Peoria Greater Peoria Mass Tr Dist TOTAL
14.813.0 13.4 11.60.5DR 11.9 12.7 -3.55%150.3 152.2 -1.25%Greater Peoria Mass Tr DistIL Peoria331.9291.8 252.1 256.610.6MB 269.9 283.4 -9.57%3,249.8 3,426.5 -5.16%Greater Peoria Mass Tr DistIL Peoria
169.5145.0 144.9 141.9 149.56.0 -1.93%1,809.4 1,883.9 -3.95%162.1IL Rockford Rockford Mass Transit Dist TOTAL
9.28.7 7.9 7.90.3DR 8.0 8.1 -3.16%100.9 101.5 -0.59%Rockford Mass Transit DistIL Rockford160.3153.4 137.1 137.05.7MB 133.9 141.4 -1.86%1,708.5 1,782.4 -4.15%Rockford Mass Transit DistIL Rockford
1,604.71,153.0 947.8 1,234.6 1,067.051.4 -8.40%13,108.7 13,614.0 -3.71%1,477.2IL Urbana Champaign-Urbana MTD TOTAL
16.316.1 12.1 12.20.5DR 13.7 12.4 -4.72%143.7 144.3 -0.42%Champaign-Urbana MTDIL Urbana1,588.41,461.1 1,140.9 935.650.8MB 1,220.9 1,054.6 -8.44%12,965.0 13,469.7 -3.75%Champaign-Urbana MTDIL Urbana
425.2326.2 270.4 316.7 286.214.7 -1.25%3,527.5 3,538.8 -0.32%418.6IN Bloomington Bloomington Public Trp Corp TOTAL
2.92.9 3.0 2.70.1DR 2.3 2.5 11.69%33.7 29.1 15.81%Bloomington Public Trp CorpIN Bloomington422.3415.7 323.2 267.714.6MB 314.4 283.7 -1.35%3,493.8 3,509.7 -0.45%Bloomington Public Trp CorpIN Bloomington
314.2272.7 303.9 274.4 308.811.7 -1.72%3,615.7 3,614.2 0.04%305.4IN Chesterton Northern IN Commuter TD TOTAL314.2305.4 272.7 303.911.7CR 274.4 308.8 -1.72%3,615.7 3,614.2 0.04%Northern IN Commuter TDIN Chesterton
189.1157.8 164.0 158.7 178.0NA -5.59%1,965.5 2,049.6 -4.10%174.6IN Fort Wayne Fort Wayne Public Tr Corp TOTAL
4.86.1 5.3 5.7NADR 3.8 4.4 31.54%67.3 54.0 24.63%Fort Wayne Public Tr CorpIN Fort Wayne184.3168.5 152.5 158.36.9MB 154.9 173.6 -6.53%1,898.2 1,995.6 -4.88%Fort Wayne Public Tr CorpIN Fort Wayne
Modes: MB - Bus, DR - Demand Response, CR - Commuter Rail, HR - Heavy Rail, LR - Light Rail, AG - Automated Guideway, CC - Cable Car, FB - Ferry Boat, IP - Inclined Plane, IR - Intermediate Rail, MO - Monorail, TB - Trolleybus, VP - Vanpool
APTA PUBLIC TRANSPORTATION RIDERSHIP REPORT
State and Primary City
Transit Agency Mode
Average
Weekday Oct '15
Trips for Trips for
Nov '15
Trips for
Dec '15
Trips Thru
Dec '15
Trips for
Oct '14
Trips for
Nov '14
Trips for
Dec '14
Trips Thru
Dec '14 Quarterly
Change
Year-
Change
Fourth Quarter, 2015
(000's) (000's) (000's) (000's) (000's) (000's) (000's) (000's)(000's)
to-Date
20
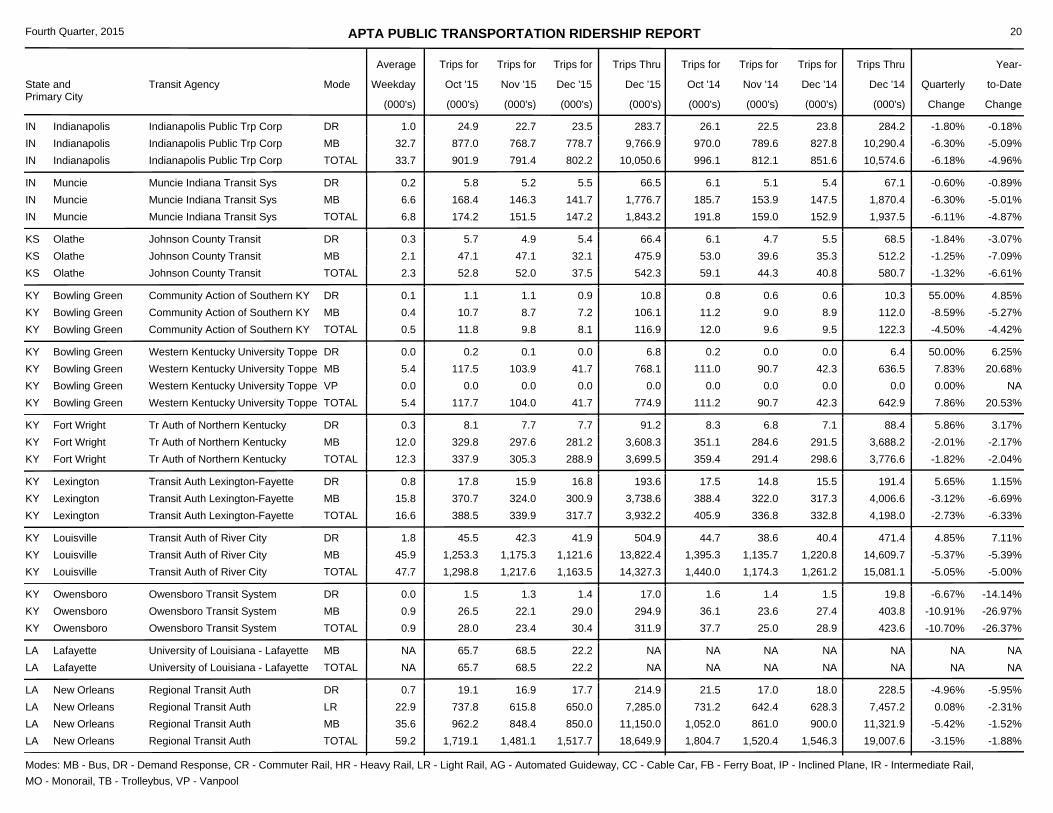
996.1791.4 802.2 812.1 851.633.7 -6.18%10,050.6 10,574.6 -4.96%901.9IN Indianapolis Indianapolis Public Trp Corp TOTAL
26.124.9 22.7 23.51.0DR 22.5 23.8 -1.80%283.7 284.2 -0.18%Indianapolis Public Trp CorpIN Indianapolis970.0877.0 768.7 778.732.7MB 789.6 827.8 -6.30%9,766.9 10,290.4 -5.09%Indianapolis Public Trp CorpIN Indianapolis
191.8151.5 147.2 159.0 152.96.8 -6.11%1,843.2 1,937.5 -4.87%174.2IN Muncie Muncie Indiana Transit Sys TOTAL
6.15.8 5.2 5.50.2DR 5.1 5.4 -0.60%66.5 67.1 -0.89%Muncie Indiana Transit SysIN Muncie185.7168.4 146.3 141.76.6MB 153.9 147.5 -6.30%1,776.7 1,870.4 -5.01%Muncie Indiana Transit SysIN Muncie
59.152.0 37.5 44.3 40.82.3 -1.32%542.3 580.7 -6.61%52.8KS Olathe Johnson County Transit TOTAL
6.15.7 4.9 5.40.3DR 4.7 5.5 -1.84%66.4 68.5 -3.07%Johnson County Transit KS Olathe53.047.1 47.1 32.12.1MB 39.6 35.3 -1.25%475.9 512.2 -7.09%Johnson County Transit KS Olathe
12.09.8 8.1 9.6 9.50.5 -4.50%116.9 122.3 -4.42%11.8KY Bowling Green Community Action of Southern KY TOTAL
0.81.1 1.1 0.90.1DR 0.6 0.6 55.00%10.8 10.3 4.85%Community Action of Southern KYKY Bowling Green11.210.7 8.7 7.20.4MB 9.0 8.9 -8.59%106.1 112.0 -5.27%Community Action of Southern KYKY Bowling Green
111.2104.0 41.7 90.7 42.35.4 7.86%774.9 642.9 20.53%117.7KY Bowling Green Western Kentucky University Toppe TOTAL
0.20.2 0.1 0.00.0DR 0.0 0.0 50.00%6.8 6.4 6.25%Western Kentucky University ToppeKY Bowling Green111.0117.5 103.9 41.75.4MB 90.7 42.3 7.83%768.1 636.5 20.68%Western Kentucky University ToppeKY Bowling Green
0.00.0 0.0 0.00.0VP 0.0 0.0 0.00%0.0 0.0 NAWestern Kentucky University ToppeKY Bowling Green
359.4305.3 288.9 291.4 298.612.3 -1.82%3,699.5 3,776.6 -2.04%337.9KY Fort Wright Tr Auth of Northern Kentucky TOTAL
8.38.1 7.7 7.70.3DR 6.8 7.1 5.86%91.2 88.4 3.17%Tr Auth of Northern KentuckyKY Fort Wright351.1329.8 297.6 281.212.0MB 284.6 291.5 -2.01%3,608.3 3,688.2 -2.17%Tr Auth of Northern KentuckyKY Fort Wright
405.9339.9 317.7 336.8 332.816.6 -2.73%3,932.2 4,198.0 -6.33%388.5KY Lexington Transit Auth Lexington-Fayette TOTAL
17.517.8 15.9 16.80.8DR 14.8 15.5 5.65%193.6 191.4 1.15%Transit Auth Lexington-FayetteKY Lexington388.4370.7 324.0 300.915.8MB 322.0 317.3 -3.12%3,738.6 4,006.6 -6.69%Transit Auth Lexington-FayetteKY Lexington
1,440.01,217.6 1,163.5 1,174.3 1,261.247.7 -5.05%14,327.3 15,081.1 -5.00%1,298.8KY Louisville Transit Auth of River City TOTAL
44.745.5 42.3 41.91.8DR 38.6 40.4 4.85%504.9 471.4 7.11%Transit Auth of River CityKY Louisville1,395.31,253.3 1,175.3 1,121.645.9MB 1,135.7 1,220.8 -5.37%13,822.4 14,609.7 -5.39%Transit Auth of River CityKY Louisville
37.723.4 30.4 25.0 28.90.9 -10.70%311.9 423.6 -26.37%28.0KY Owensboro Owensboro Transit System TOTAL
1.61.5 1.3 1.40.0DR 1.4 1.5 -6.67%17.0 19.8 -14.14%Owensboro Transit SystemKY Owensboro36.126.5 22.1 29.00.9MB 23.6 27.4 -10.91%294.9 403.8 -26.97%Owensboro Transit SystemKY Owensboro
NA68.5 22.2 NA NANA NANA NA NA65.7LA Lafayette University of Louisiana - Lafayette TOTALNA65.7 68.5 22.2NAMB NA NA NANA NA NAUniversity of Louisiana - LafayetteLA Lafayette
1,804.71,481.1 1,517.7 1,520.4 1,546.359.2 -3.15%18,649.9 19,007.6 -1.88%1,719.1LA New Orleans Regional Transit Auth TOTAL
21.519.1 16.9 17.70.7DR 17.0 18.0 -4.96%214.9 228.5 -5.95%Regional Transit AuthLA New Orleans731.2737.8 615.8 650.022.9LR 642.4 628.3 0.08%7,285.0 7,457.2 -2.31%Regional Transit AuthLA New Orleans
1,052.0962.2 848.4 850.035.6MB 861.0 900.0 -5.42%11,150.0 11,321.9 -1.52%Regional Transit AuthLA New Orleans
Modes: MB - Bus, DR - Demand Response, CR - Commuter Rail, HR - Heavy Rail, LR - Light Rail, AG - Automated Guideway, CC - Cable Car, FB - Ferry Boat, IP - Inclined Plane, IR - Intermediate Rail, MO - Monorail, TB - Trolleybus, VP - Vanpool

APTA PUBLIC TRANSPORTATION RIDERSHIP REPORT
State and Primary City
Transit Agency Mode
Average
Weekday Oct '15
Trips for Trips for
Nov '15
Trips for
Dec '15
Trips Thru
Dec '15
Trips for
Oct '14
Trips for
Nov '14
Trips for
Dec '14
Trips Thru
Dec '14 Quarterly
Change
Year-
Change
Fourth Quarter, 2015
(000's) (000's) (000's) (000's) (000's) (000's) (000's) (000's)(000's)
to-Date
21
454.8396.6 291.8 366.7 217.714.4 11.76%3,509.4 3,185.8 10.16%473.0MA Amherst UMass Transit Service TOTAL454.8473.0 396.6 291.814.4MB 366.7 217.7 11.76%3,509.4 3,185.8 10.16%UMass Transit ServiceMA Amherst
37,104.630,768.3 30,711.1 31,675.1 31,712.91,277.2 -2.85%390,267.3 400,147.0 -2.47%36,147.2MA Boston Massachusetts Bay Tr Auth TOTAL
3,211.43,020.0 2,646.1 2,789.4122.1CR 2,695.1 3,010.1 -5.17%32,592.5 36,087.6 -9.69%Massachusetts Bay Tr AuthMA Boston189.1191.4 177.6 182.67.0DR 169.6 179.9 2.41%2,134.4 2,131.3 0.15%Massachusetts Bay Tr AuthMA Boston120.6120.4 94.4 92.54.6FB 83.8 85.7 5.93%1,366.2 1,378.8 -0.91%Massachusetts Bay Tr AuthMA Boston
16,576.515,892.2 13,796.2 13,753.1569.2HR 14,029.0 13,869.0 -2.32%173,850.0 174,820.2 -0.55%Massachusetts Bay Tr AuthMA Boston6,540.65,515.0 4,801.2 4,844.2186.2LR 5,677.6 5,322.9 -13.57%66,344.1 69,378.4 -4.37%Massachusetts Bay Tr AuthMA Boston
10,350.511,292.9 9,145.9 8,939.6383.7MB 8,924.0 9,131.9 3.42%112,665.8 114,970.3 -2.00%Massachusetts Bay Tr AuthMA Boston115.9115.3 106.9 109.74.4TB 96.0 113.4 2.03%1,314.3 1,380.4 -4.79%Massachusetts Bay Tr AuthMA Boston
11,322.09,280.2 9,331.0 9,166.1 9,687.3382.1 -5.30%112,528.1 116,130.8 -3.10%9,965.3MD Baltimore Maryland Transit Admin TOTAL
860.8811.0 691.4 710.133.8CR 659.3 723.6 -1.39%9,149.9 9,364.8 -2.29%Maryland Transit AdminMD Baltimore225.6222.6 206.3 218.98.3DR 196.8 208.8 2.63%2,512.2 2,442.3 2.86%Maryland Transit AdminMD Baltimore
1,366.01,138.9 1,041.2 1,046.942.7HR 1,099.1 1,152.1 -10.79%12,948.4 14,555.1 -11.04%Maryland Transit AdminMD Baltimore847.7579.1 570.9 691.222.8LR 670.5 674.9 -16.05%6,888.5 8,092.3 -14.88%Maryland Transit AdminMD Baltimore
8,021.97,213.7 6,770.4 6,663.9274.4MB 6,540.4 6,927.9 -3.92%81,029.1 81,676.3 -0.79%Maryland Transit AdminMD Baltimore
NA294.4 192.8 NA NA11.2 NA2,956.6 NA NA370.8MD College Park Shuttle-UM Transit System TOTAL
NA0.0 0.0 0.00.0DR NA NA NA0.0 NA NAShuttle-UM Transit SystemMD College Park454.6370.8 294.4 192.811.2MB 368.8 255.2 -20.45%2,956.6 3,404.5 -13.16%Shuttle-UM Transit SystemMD College Park
2,464.81,996.7 2,036.9 2,069.3 2,122.282.1 -5.37%25,293.7 26,328.3 -3.93%2,265.5MD Rockville Montgomery County Ride-On TOTAL2,464.82,265.5 1,996.7 2,036.982.1MB 2,069.3 2,122.2 -5.37%25,293.7 26,328.3 -3.93%Montgomery County Ride-OnMD Rockville
41.639.6 38.0 35.2 36.61.3 5.38%426.7 494.9 -13.78%41.9ME Portland Northern NE Passenger RA TOTAL41.641.9 39.6 38.01.3CR 35.2 36.6 5.38%426.7 494.9 -13.78%Northern NE Passenger RAME Portland
681.9552.2 501.1 555.8 513.023.6 -3.78%6,526.6 6,660.2 -2.01%631.3MI Ann Arbor Ann Arbor Transportation Auth TOTAL
15.314.8 13.4 13.30.5DR 13.2 13.3 -0.72%150.0 168.1 -10.77%Ann Arbor Transportation AuthMI Ann Arbor666.6616.5 538.8 487.823.1MB 542.6 499.7 -3.85%6,376.6 6,492.1 -1.78%Ann Arbor Transportation AuthMI Ann Arbor
55.544.8 44.6 44.4 48.52.2 -4.78%546.5 557.9 -2.04%51.9MI Bay City Bay Metropolitan Transp Auth TOTAL
5.04.6 3.9 4.10.2DR 4.2 4.3 -6.67%51.5 52.8 -2.46%Bay Metropolitan Transp AuthMI Bay City50.547.3 40.9 40.52.0MB 40.2 44.2 -4.60%495.0 505.1 -2.00%Bay Metropolitan Transp AuthMI Bay City
2,456.4NA NA 1,978.9 2,017.4NA NANA 24,728.3 NANAMI Detroit City of Detroit Dept of Trp TOTAL
27.3NA NA NANADR 23.7 22.2 NANA 294.3 NACity of Detroit Dept of TrpMI Detroit2,429.12,589.1 2,234.6 2,210.491.7MB 1,955.2 1,995.2 10.26%24,911.0 24,434.0 1.95%City of Detroit Dept of TrpMI Detroit
Modes: MB - Bus, DR - Demand Response, CR - Commuter Rail, HR - Heavy Rail, LR - Light Rail, AG - Automated Guideway, CC - Cable Car, FB - Ferry Boat, IP - Inclined Plane, IR - Intermediate Rail, MO - Monorail, TB - Trolleybus, VP - Vanpool
APTA PUBLIC TRANSPORTATION RIDERSHIP REPORT
State and Primary City
Transit Agency Mode
Average
Weekday Oct '15
Trips for Trips for
Nov '15
Trips for
Dec '15
Trips Thru
Dec '15
Trips for
Oct '14
Trips for
Nov '14
Trips for
Dec '14
Trips Thru
Dec '14 Quarterly
Change
Year-
Change
Fourth Quarter, 2015
(000's) (000's) (000's) (000's) (000's) (000's) (000's) (000's)(000's)
to-Date
22
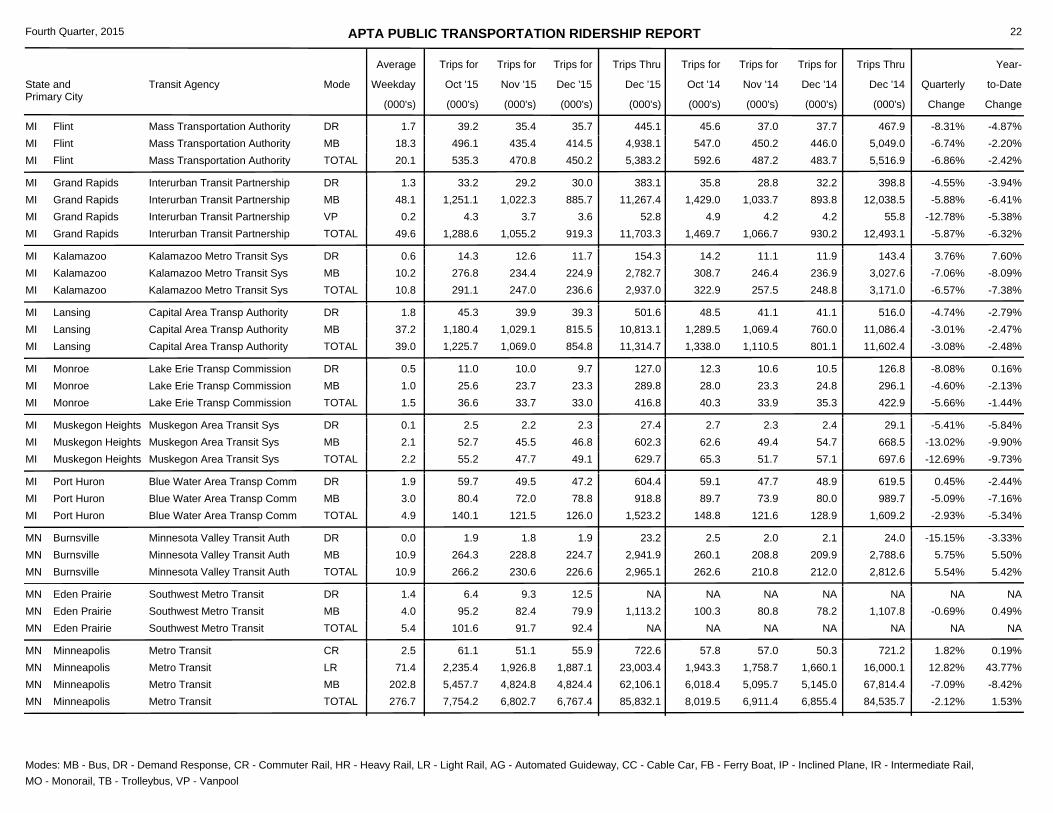
592.6470.8 450.2 487.2 483.720.1 -6.86%5,383.2 5,516.9 -2.42%535.3MI Flint Mass Transportation Authority TOTAL
45.639.2 35.4 35.71.7DR 37.0 37.7 -8.31%445.1 467.9 -4.87%Mass Transportation AuthorityMI Flint547.0496.1 435.4 414.518.3MB 450.2 446.0 -6.74%4,938.1 5,049.0 -2.20%Mass Transportation AuthorityMI Flint
1,469.71,055.2 919.3 1,066.7 930.249.6 -5.87%11,703.3 12,493.1 -6.32%1,288.6MI Grand Rapids Interurban Transit Partnership TOTAL
35.833.2 29.2 30.01.3DR 28.8 32.2 -4.55%383.1 398.8 -3.94%Interurban Transit PartnershipMI Grand Rapids1,429.01,251.1 1,022.3 885.748.1MB 1,033.7 893.8 -5.88%11,267.4 12,038.5 -6.41%Interurban Transit PartnershipMI Grand Rapids
4.94.3 3.7 3.60.2VP 4.2 4.2 -12.78%52.8 55.8 -5.38%Interurban Transit PartnershipMI Grand Rapids
322.9247.0 236.6 257.5 248.810.8 -6.57%2,937.0 3,171.0 -7.38%291.1MI Kalamazoo Kalamazoo Metro Transit Sys TOTAL
14.214.3 12.6 11.70.6DR 11.1 11.9 3.76%154.3 143.4 7.60%Kalamazoo Metro Transit SysMI Kalamazoo308.7276.8 234.4 224.910.2MB 246.4 236.9 -7.06%2,782.7 3,027.6 -8.09%Kalamazoo Metro Transit SysMI Kalamazoo
1,338.01,069.0 854.8 1,110.5 801.139.0 -3.08%11,314.7 11,602.4 -2.48%1,225.7MI Lansing Capital Area Transp Authority TOTAL
48.545.3 39.9 39.31.8DR 41.1 41.1 -4.74%501.6 516.0 -2.79%Capital Area Transp AuthorityMI Lansing1,289.51,180.4 1,029.1 815.537.2MB 1,069.4 760.0 -3.01%10,813.1 11,086.4 -2.47%Capital Area Transp AuthorityMI Lansing
40.333.7 33.0 33.9 35.31.5 -5.66%416.8 422.9 -1.44%36.6MI Monroe Lake Erie Transp Commission TOTAL
12.311.0 10.0 9.70.5DR 10.6 10.5 -8.08%127.0 126.8 0.16%Lake Erie Transp CommissionMI Monroe28.025.6 23.7 23.31.0MB 23.3 24.8 -4.60%289.8 296.1 -2.13%Lake Erie Transp CommissionMI Monroe
65.347.7 49.1 51.7 57.12.2 -12.69%629.7 697.6 -9.73%55.2MI Muskegon Heights Muskegon Area Transit Sys TOTAL
2.72.5 2.2 2.30.1DR 2.3 2.4 -5.41%27.4 29.1 -5.84%Muskegon Area Transit SysMI Muskegon Heights62.652.7 45.5 46.82.1MB 49.4 54.7 -13.02%602.3 668.5 -9.90%Muskegon Area Transit SysMI Muskegon Heights
148.8121.5 126.0 121.6 128.94.9 -2.93%1,523.2 1,609.2 -5.34%140.1MI Port Huron Blue Water Area Transp Comm TOTAL
59.159.7 49.5 47.21.9DR 47.7 48.9 0.45%604.4 619.5 -2.44%Blue Water Area Transp CommMI Port Huron89.780.4 72.0 78.83.0MB 73.9 80.0 -5.09%918.8 989.7 -7.16%Blue Water Area Transp CommMI Port Huron
262.6230.6 226.6 210.8 212.010.9 5.54%2,965.1 2,812.6 5.42%266.2MN Burnsville Minnesota Valley Transit Auth TOTAL
2.51.9 1.8 1.90.0DR 2.0 2.1 -15.15%23.2 24.0 -3.33%Minnesota Valley Transit AuthMN Burnsville260.1264.3 228.8 224.710.9MB 208.8 209.9 5.75%2,941.9 2,788.6 5.50%Minnesota Valley Transit AuthMN Burnsville
NA91.7 92.4 NA NA5.4 NANA NA NA101.6MN Eden Prairie Southwest Metro Transit TOTAL
NA6.4 9.3 12.51.4DR NA NA NANA NA NASouthwest Metro TransitMN Eden Prairie100.395.2 82.4 79.94.0MB 80.8 78.2 -0.69%1,113.2 1,107.8 0.49%Southwest Metro TransitMN Eden Prairie
8,019.56,802.7 6,767.4 6,911.4 6,855.4276.7 -2.12%85,832.1 84,535.7 1.53%7,754.2MN Minneapolis Metro Transit TOTAL
57.861.1 51.1 55.92.5CR 57.0 50.3 1.82%722.6 721.2 0.19%Metro TransitMN Minneapolis1,943.32,235.4 1,926.8 1,887.171.4LR 1,758.7 1,660.1 12.82%23,003.4 16,000.1 43.77%Metro TransitMN Minneapolis6,018.45,457.7 4,824.8 4,824.4202.8MB 5,095.7 5,145.0 -7.09%62,106.1 67,814.4 -8.42%Metro TransitMN Minneapolis
Modes: MB - Bus, DR - Demand Response, CR - Commuter Rail, HR - Heavy Rail, LR - Light Rail, AG - Automated Guideway, CC - Cable Car, FB - Ferry Boat, IP - Inclined Plane, IR - Intermediate Rail, MO - Monorail, TB - Trolleybus, VP - Vanpool
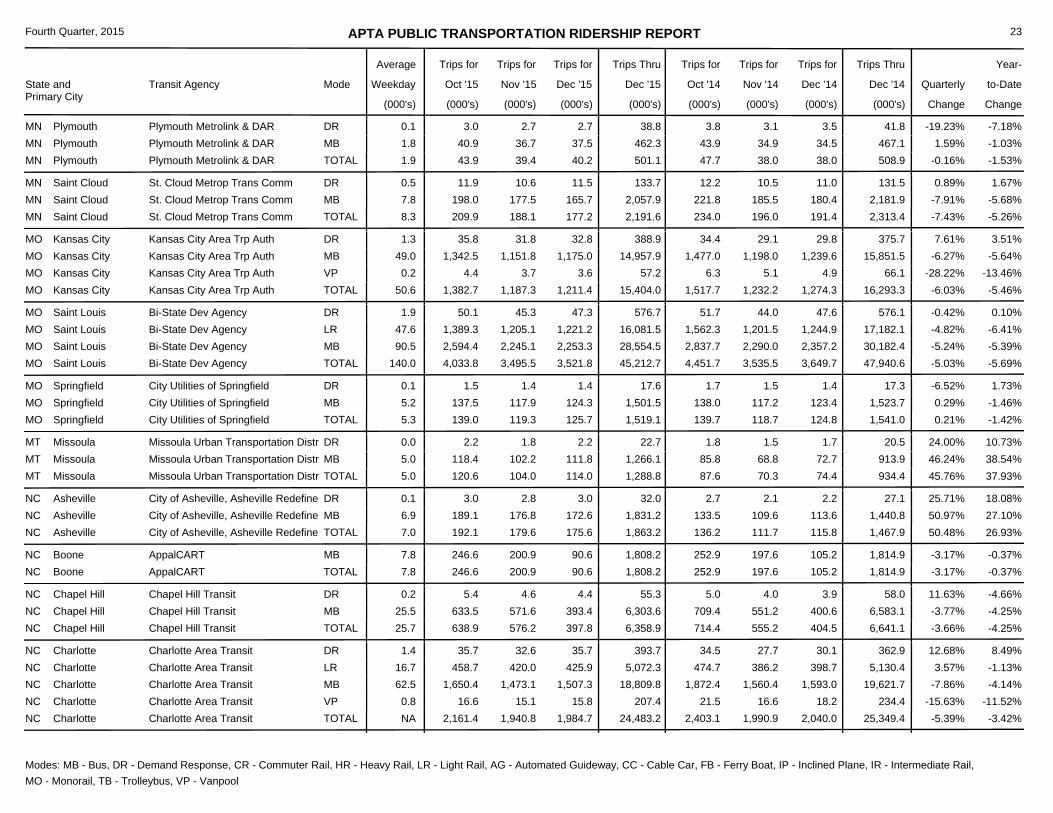
APTA PUBLIC TRANSPORTATION RIDERSHIP REPORT
State and Primary City
Transit Agency Mode
Average
Weekday Oct '15
Trips for Trips for
Nov '15
Trips for
Dec '15
Trips Thru
Dec '15
Trips for
Oct '14
Trips for
Nov '14
Trips for
Dec '14
Trips Thru
Dec '14 Quarterly
Change
Year-
Change
Fourth Quarter, 2015
(000's) (000's) (000's) (000's) (000's) (000's) (000's) (000's)(000's)
to-Date
23
47.739.4 40.2 38.0 38.01.9 -0.16%501.1 508.9 -1.53%43.9MN Plymouth Plymouth Metrolink & DAR TOTAL
3.83.0 2.7 2.70.1DR 3.1 3.5 -19.23%38.8 41.8 -7.18%Plymouth Metrolink & DARMN Plymouth43.940.9 36.7 37.51.8MB 34.9 34.5 1.59%462.3 467.1 -1.03%Plymouth Metrolink & DARMN Plymouth
234.0188.1 177.2 196.0 191.48.3 -7.43%2,191.6 2,313.4 -5.26%209.9MN Saint Cloud St. Cloud Metrop Trans Comm TOTAL
12.211.9 10.6 11.50.5DR 10.5 11.0 0.89%133.7 131.5 1.67%St. Cloud Metrop Trans CommMN Saint Cloud221.8198.0 177.5 165.77.8MB 185.5 180.4 -7.91%2,057.9 2,181.9 -5.68%St. Cloud Metrop Trans CommMN Saint Cloud
1,517.71,187.3 1,211.4 1,232.2 1,274.350.6 -6.03%15,404.0 16,293.3 -5.46%1,382.7MO Kansas City Kansas City Area Trp Auth TOTAL
34.435.8 31.8 32.81.3DR 29.1 29.8 7.61%388.9 375.7 3.51%Kansas City Area Trp AuthMO Kansas City1,477.01,342.5 1,151.8 1,175.049.0MB 1,198.0 1,239.6 -6.27%14,957.9 15,851.5 -5.64%Kansas City Area Trp AuthMO Kansas City
6.34.4 3.7 3.60.2VP 5.1 4.9 -28.22%57.2 66.1 -13.46%Kansas City Area Trp AuthMO Kansas City
4,451.73,495.5 3,521.8 3,535.5 3,649.7140.0 -5.03%45,212.7 47,940.6 -5.69%4,033.8MO Saint Louis Bi-State Dev Agency TOTAL
51.750.1 45.3 47.31.9DR 44.0 47.6 -0.42%576.7 576.1 0.10%Bi-State Dev AgencyMO Saint Louis1,562.31,389.3 1,205.1 1,221.247.6LR 1,201.5 1,244.9 -4.82%16,081.5 17,182.1 -6.41%Bi-State Dev AgencyMO Saint Louis2,837.72,594.4 2,245.1 2,253.390.5MB 2,290.0 2,357.2 -5.24%28,554.5 30,182.4 -5.39%Bi-State Dev AgencyMO Saint Louis
139.7119.3 125.7 118.7 124.85.3 0.21%1,519.1 1,541.0 -1.42%139.0MO Springfield City Utilities of Springfield TOTAL
1.71.5 1.4 1.40.1DR 1.5 1.4 -6.52%17.6 17.3 1.73%City Utilities of SpringfieldMO Springfield138.0137.5 117.9 124.35.2MB 117.2 123.4 0.29%1,501.5 1,523.7 -1.46%City Utilities of SpringfieldMO Springfield
87.6104.0 114.0 70.3 74.45.0 45.76%1,288.8 934.4 37.93%120.6MT Missoula Missoula Urban Transportation Distr TOTAL
1.82.2 1.8 2.20.0DR 1.5 1.7 24.00%22.7 20.5 10.73%Missoula Urban Transportation DistrMT Missoula85.8118.4 102.2 111.85.0MB 68.8 72.7 46.24%1,266.1 913.9 38.54%Missoula Urban Transportation DistrMT Missoula
136.2179.6 175.6 111.7 115.87.0 50.48%1,863.2 1,467.9 26.93%192.1NC Asheville City of Asheville, Asheville Redefine TOTAL
2.73.0 2.8 3.00.1DR 2.1 2.2 25.71%32.0 27.1 18.08%City of Asheville, Asheville RedefineNC Asheville133.5189.1 176.8 172.66.9MB 109.6 113.6 50.97%1,831.2 1,440.8 27.10%City of Asheville, Asheville RedefineNC Asheville
252.9200.9 90.6 197.6 105.27.8 -3.17%1,808.2 1,814.9 -0.37%246.6NC Boone AppalCART TOTAL252.9246.6 200.9 90.67.8MB 197.6 105.2 -3.17%1,808.2 1,814.9 -0.37%AppalCARTNC Boone
714.4576.2 397.8 555.2 404.525.7 -3.66%6,358.9 6,641.1 -4.25%638.9NC Chapel Hill Chapel Hill Transit TOTAL
5.05.4 4.6 4.40.2DR 4.0 3.9 11.63%55.3 58.0 -4.66%Chapel Hill TransitNC Chapel Hill709.4633.5 571.6 393.425.5MB 551.2 400.6 -3.77%6,303.6 6,583.1 -4.25%Chapel Hill TransitNC Chapel Hill
2,403.11,940.8 1,984.7 1,990.9 2,040.0NA -5.39%24,483.2 25,349.4 -3.42%2,161.4NC Charlotte Charlotte Area Transit TOTAL
34.535.7 32.6 35.71.4DR 27.7 30.1 12.68%393.7 362.9 8.49%Charlotte Area TransitNC Charlotte474.7458.7 420.0 425.916.7LR 386.2 398.7 3.57%5,072.3 5,130.4 -1.13%Charlotte Area TransitNC Charlotte
1,872.41,650.4 1,473.1 1,507.362.5MB 1,560.4 1,593.0 -7.86%18,809.8 19,621.7 -4.14%Charlotte Area TransitNC Charlotte21.516.6 15.1 15.80.8VP 16.6 18.2 -15.63%207.4 234.4 -11.52%Charlotte Area TransitNC Charlotte
Modes: MB - Bus, DR - Demand Response, CR - Commuter Rail, HR - Heavy Rail, LR - Light Rail, AG - Automated Guideway, CC - Cable Car, FB - Ferry Boat, IP - Inclined Plane, IR - Intermediate Rail, MO - Monorail, TB - Trolleybus, VP - Vanpool
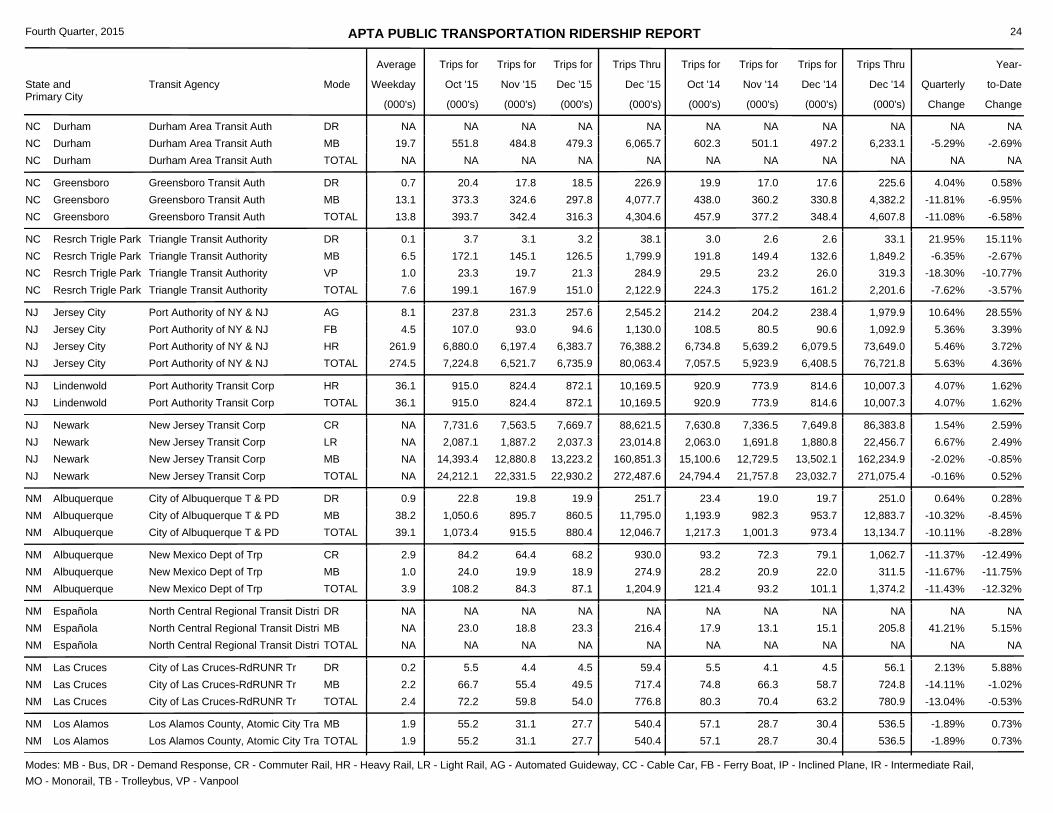
APTA PUBLIC TRANSPORTATION RIDERSHIP REPORT
State and Primary City
Transit Agency Mode
Average
Weekday Oct '15
Trips for Trips for
Nov '15
Trips for
Dec '15
Trips Thru
Dec '15
Trips for
Oct '14
Trips for
Nov '14
Trips for
Dec '14
Trips Thru
Dec '14 Quarterly
Change
Year-
Change
Fourth Quarter, 2015
(000's) (000's) (000's) (000's) (000's) (000's) (000's) (000's)(000's)
to-Date
24
NANA NA NA NANA NANA NA NANANC Durham Durham Area Transit Auth TOTAL
NANA NA NANADR NA NA NANA NA NADurham Area Transit AuthNC Durham602.3551.8 484.8 479.319.7MB 501.1 497.2 -5.29%6,065.7 6,233.1 -2.69%Durham Area Transit AuthNC Durham
457.9342.4 316.3 377.2 348.413.8 -11.08%4,304.6 4,607.8 -6.58%393.7NC Greensboro Greensboro Transit Auth TOTAL
19.920.4 17.8 18.50.7DR 17.0 17.6 4.04%226.9 225.6 0.58%Greensboro Transit AuthNC Greensboro438.0373.3 324.6 297.813.1MB 360.2 330.8 -11.81%4,077.7 4,382.2 -6.95%Greensboro Transit AuthNC Greensboro
224.3167.9 151.0 175.2 161.27.6 -7.62%2,122.9 2,201.6 -3.57%199.1NC Resrch Trigle Park Triangle Transit Authority TOTAL
3.03.7 3.1 3.20.1DR 2.6 2.6 21.95%38.1 33.1 15.11%Triangle Transit AuthorityNC Resrch Trigle Park191.8172.1 145.1 126.56.5MB 149.4 132.6 -6.35%1,799.9 1,849.2 -2.67%Triangle Transit AuthorityNC Resrch Trigle Park29.523.3 19.7 21.31.0VP 23.2 26.0 -18.30%284.9 319.3 -10.77%Triangle Transit AuthorityNC Resrch Trigle Park
7,057.56,521.7 6,735.9 5,923.9 6,408.5274.5 5.63%80,063.4 76,721.8 4.36%7,224.8NJ Jersey City Port Authority of NY & NJ TOTAL
214.2237.8 231.3 257.68.1AG 204.2 238.4 10.64%2,545.2 1,979.9 28.55%Port Authority of NY & NJNJ Jersey City108.5107.0 93.0 94.64.5FB 80.5 90.6 5.36%1,130.0 1,092.9 3.39%Port Authority of NY & NJNJ Jersey City
6,734.86,880.0 6,197.4 6,383.7261.9HR 5,639.2 6,079.5 5.46%76,388.2 73,649.0 3.72%Port Authority of NY & NJNJ Jersey City
920.9824.4 872.1 773.9 814.636.1 4.07%10,169.5 10,007.3 1.62%915.0NJ Lindenwold Port Authority Transit Corp TOTAL920.9915.0 824.4 872.136.1HR 773.9 814.6 4.07%10,169.5 10,007.3 1.62%Port Authority Transit CorpNJ Lindenwold
24,794.422,331.5 22,930.2 21,757.8 23,032.7NA -0.16%272,487.6 271,075.4 0.52%24,212.1NJ Newark New Jersey Transit Corp TOTAL
7,630.87,731.6 7,563.5 7,669.7NACR 7,336.5 7,649.8 1.54%88,621.5 86,383.8 2.59%New Jersey Transit CorpNJ Newark2,063.02,087.1 1,887.2 2,037.3NALR 1,691.8 1,880.8 6.67%23,014.8 22,456.7 2.49%New Jersey Transit CorpNJ Newark
15,100.614,393.4 12,880.8 13,223.2NAMB 12,729.5 13,502.1 -2.02%160,851.3 162,234.9 -0.85%New Jersey Transit CorpNJ Newark
1,217.3915.5 880.4 1,001.3 973.439.1 -10.11%12,046.7 13,134.7 -8.28%1,073.4NM Albuquerque City of Albuquerque T & PD TOTAL
23.422.8 19.8 19.90.9DR 19.0 19.7 0.64%251.7 251.0 0.28%City of Albuquerque T & PDNM Albuquerque1,193.91,050.6 895.7 860.538.2MB 982.3 953.7 -10.32%11,795.0 12,883.7 -8.45%City of Albuquerque T & PDNM Albuquerque
121.484.3 87.1 93.2 101.13.9 -11.43%1,204.9 1,374.2 -12.32%108.2NM Albuquerque New Mexico Dept of Trp TOTAL
93.284.2 64.4 68.22.9CR 72.3 79.1 -11.37%930.0 1,062.7 -12.49%New Mexico Dept of TrpNM Albuquerque28.224.0 19.9 18.91.0MB 20.9 22.0 -11.67%274.9 311.5 -11.75%New Mexico Dept of TrpNM Albuquerque
NANA NA NA NANA NANA NA NANANM Española North Central Regional Transit Distri TOTAL
NANA NA NANADR NA NA NANA NA NANorth Central Regional Transit DistriNM Española17.923.0 18.8 23.3NAMB 13.1 15.1 41.21%216.4 205.8 5.15%North Central Regional Transit DistriNM Española
80.359.8 54.0 70.4 63.22.4 -13.04%776.8 780.9 -0.53%72.2NM Las Cruces City of Las Cruces-RdRUNR Tr TOTAL
5.55.5 4.4 4.50.2DR 4.1 4.5 2.13%59.4 56.1 5.88%City of Las Cruces-RdRUNR TrNM Las Cruces74.866.7 55.4 49.52.2MB 66.3 58.7 -14.11%717.4 724.8 -1.02%City of Las Cruces-RdRUNR TrNM Las Cruces
57.131.1 27.7 28.7 30.41.9 -1.89%540.4 536.5 0.73%55.2NM Los Alamos Los Alamos County, Atomic City Tra TOTAL57.155.2 31.1 27.71.9MB 28.7 30.4 -1.89%540.4 536.5 0.73%Los Alamos County, Atomic City TraNM Los Alamos
Modes: MB - Bus, DR - Demand Response, CR - Commuter Rail, HR - Heavy Rail, LR - Light Rail, AG - Automated Guideway, CC - Cable Car, FB - Ferry Boat, IP - Inclined Plane, IR - Intermediate Rail, MO - Monorail, TB - Trolleybus, VP - Vanpool

APTA PUBLIC TRANSPORTATION RIDERSHIP REPORT
State and Primary City
Transit Agency Mode
Average
Weekday Oct '15
Trips for Trips for
Nov '15
Trips for
Dec '15
Trips Thru
Dec '15
Trips for
Oct '14
Trips for
Nov '14
Trips for
Dec '14
Trips Thru
Dec '14 Quarterly
Change
Year-
Change
Fourth Quarter, 2015
(000's) (000's) (000's) (000's) (000's) (000's) (000's) (000's)(000's)
to-Date
25
5,861.45,393.3 5,380.9 5,082.8 5,100.0200.5 5.66%67,517.4 62,920.1 7.31%6,178.1NV Las Vegas RTC of Southern Nevada TOTAL
110.1112.9 100.0 105.24.2DR 94.1 102.1 3.85%1,261.0 1,200.0 5.08%RTC of Southern NevadaNV Las Vegas5,751.36,065.2 5,293.3 5,275.7196.3MB 4,988.7 4,997.9 5.70%66,256.4 61,720.1 7.35%RTC of Southern NevadaNV Las Vegas
751.8635.3 648.3 666.8 682.725.3 -4.84%8,195.0 8,482.6 -3.39%716.1NV Reno Regional Transportation Comm TOTAL
21.119.2 17.5 19.20.8DR 17.5 19.1 -3.12%222.8 235.7 -5.47%Regional Transportation CommNV Reno730.7696.9 617.8 629.124.5MB 649.3 663.6 -4.88%7,972.2 8,246.9 -3.33%Regional Transportation CommNV Reno
33.747.9 119.6 35.9 88.72.2 27.23%684.9 714.4 -4.13%33.9NV Stateline Tahoe Transportation District TOTAL
1.51.4 1.3 1.50.1DR 1.3 1.4 0.00%16.0 16.3 -1.84%Tahoe Transportation DistrictNV Stateline32.232.5 46.6 118.12.1MB 34.6 87.3 27.97%668.9 698.1 -4.18%Tahoe Transportation DistrictNV Stateline
1,669.51,440.0 1,430.4 1,391.5 1,415.958.9 -0.24%16,890.7 16,917.0 -0.16%1,595.8NY Albany Capital District Transp Auth TOTAL
28.528.5 25.7 26.71.0DR 24.5 26.5 1.76%309.4 315.2 -1.84%Capital District Transp AuthNY Albany1,641.01,567.3 1,414.3 1,403.757.9MB 1,367.0 1,389.4 -0.28%16,581.3 16,601.8 -0.12%Capital District Transp AuthNY Albany
2,497.42,422.1 2,418.6 1,975.3 2,229.1102.0 12.26%28,307.0 26,313.2 7.58%2,682.5NY Buffalo Niagara Frontier Trp Auth TOTAL
16.816.5 15.3 15.70.7DR 12.4 15.1 7.22%183.1 177.3 3.27%Niagara Frontier Trp AuthNY Buffalo430.2465.8 418.6 414.217.1LR 346.7 402.3 10.13%5,218.7 4,300.5 21.35%Niagara Frontier Trp AuthNY Buffalo
2,050.42,200.2 1,988.2 1,988.784.1MB 1,616.2 1,811.7 12.76%22,905.2 21,835.4 4.90%Niagara Frontier Trp AuthNY Buffalo
462.7389.4 278.8 389.1 300.615.2 -1.90%4,247.5 4,363.8 -2.67%462.3NY Ithaca Tompkins Consol Area Transit TOTAL
5.84.9 4.3 4.40.2DR 4.5 4.9 -10.53%59.1 62.9 -6.04%Tompkins Consol Area TransitNY Ithaca456.5457.2 384.9 274.315.0MB 384.3 295.4 -1.74%4,185.4 4,296.7 -2.59%Tompkins Consol Area TransitNY Ithaca
0.40.2 0.2 0.10.0VP 0.3 0.3 -50.00%3.0 4.2 -28.57%Tompkins Consol Area TransitNY Ithaca
8,760.07,880.3 8,442.1 7,770.9 8,536.4333.6 -1.05%98,699.4 98,393.7 0.31%8,480.5NY New York MTA Long Island Rail Road TOTAL8,760.08,480.5 7,880.3 8,442.1333.6CR 7,770.9 8,536.4 -1.05%98,699.4 98,393.7 0.31%MTA Long Island Rail RoadNY New York
7,685.87,023.2 7,661.3 6,709.6 7,529.8307.0 2.07%86,285.9 84,980.9 1.54%7,694.0NY New York MTA Metro-North Railroad TOTAL
7,634.17,642.5 6,978.5 7,615.6304.8CR 6,668.8 7,485.9 2.06%85,747.6 84,468.8 1.51%MTA Metro-North RailroadNY New York18.917.5 14.9 14.20.7FB 13.3 13.4 2.19%160.3 149.2 7.44%MTA Metro-North RailroadNY New York32.834.0 29.8 31.51.5MB 27.5 30.5 4.96%378.0 362.9 4.16%MTA Metro-North RailroadNY New York
327,974.3292,765.6 302,845.0 287,200.9 302,398.611,696.9 0.22%3,556,355.0 3,562,103.7 -0.16%323,942.6NY New York MTA New York City Transit TOTAL
792.5771.5 721.8 747.027.6DR 716.0 752.8 -0.93%8,828.5 8,884.3 -0.63%MTA New York City TransitNY New York253,204.6252,993.8 228,292.2 237,783.69,144.7HR 223,055.6 236,759.7 0.85%2,772,647.2 2,758,485.0 0.51%MTA New York City TransitNY New York73,977.270,177.3 63,751.6 64,314.42,524.6MB 63,429.3 64,886.1 -2.00%774,879.3 794,734.4 -2.50%MTA New York City TransitNY New York
808.8715.3 755.1 668.6 702.632.9 5.45%8,559.4 8,301.9 3.10%828.5NY New York MTA Staten Island Railway TOTAL808.8828.5 715.3 755.132.9HR 668.6 702.6 5.45%8,559.4 8,301.9 3.10%MTA Staten Island RailwayNY New York
Modes: MB - Bus, DR - Demand Response, CR - Commuter Rail, HR - Heavy Rail, LR - Light Rail, AG - Automated Guideway, CC - Cable Car, FB - Ferry Boat, IP - Inclined Plane, IR - Intermediate Rail, MO - Monorail, TB - Trolleybus, VP - Vanpool

APTA PUBLIC TRANSPORTATION RIDERSHIP REPORT
State and Primary City
Transit Agency Mode
Average
Weekday Oct '15
Trips for Trips for
Nov '15
Trips for
Dec '15
Trips Thru
Dec '15
Trips for
Oct '14
Trips for
Nov '14
Trips for
Dec '14
Trips Thru
Dec '14 Quarterly
Change
Year-
Change
Fourth Quarter, 2015
(000's) (000's) (000's) (000's) (000's) (000's) (000's) (000's)(000's)
to-Date
26
2,088.51,812.8 1,854.2 1,705.1 1,843.4NA 1.11%22,972.8 22,544.4 1.90%2,032.6NY New York New York City DOT TOTAL
2,033.71,981.4 1,767.5 1,809.1NAFB 1,661.8 1,797.8 1.18%22,391.2 21,976.4 1.89%New York City DOTNY New York54.851.2 45.3 45.12.2MB 43.3 45.6 -1.46%581.6 568.0 2.39%New York City DOTNY New York
508.5431.2 431.3 424.4 435.418.4 -0.68%5,316.9 5,455.7 -2.54%496.5OH Akron METRO Regional Transit Authority TOTAL
24.924.5 21.3 22.50.8DR 20.2 22.4 1.19%265.2 251.8 5.32%METRO Regional Transit AuthorityOH Akron483.6472.0 409.9 408.817.6MB 404.2 413.0 -0.78%5,051.7 5,203.9 -2.92%METRO Regional Transit AuthorityOH Akron
256.4201.1 204.9 218.5 222.710.0 -8.94%2,488.5 2,723.3 -8.62%229.2OH Canton Stark Area RTA TOTAL
14.814.2 12.2 12.10.6DR 12.2 12.2 -1.79%137.1 142.6 -3.86%Stark Area RTAOH Canton241.6215.0 188.9 192.89.3MB 206.3 210.5 -9.37%2,351.4 2,580.7 -8.89%Stark Area RTAOH Canton
4.03.4 3.8 3.1 3.70.2 2.78%43.1 44.1 -2.27%3.9OH Chardon Geauga County Transit TOTAL4.03.9 3.4 3.80.2DR 3.1 3.7 2.78%43.1 44.1 -2.27%Geauga County TransitOH Chardon
1,635.11,318.0 1,307.0 1,297.8 1,349.7NA -2.76%16,174.6 16,619.0 -2.67%1,539.3OH Cincinnati Southwest Ohio RTA TOTAL
19.419.0 17.0 17.4NADR 15.7 16.5 3.49%210.5 198.0 6.31%Southwest Ohio RTAOH Cincinnati1,615.71,520.3 1,301.0 1,289.659.5MB 1,282.1 1,333.2 -2.84%15,964.1 16,421.0 -2.78%Southwest Ohio RTAOH Cincinnati
4,809.23,833.6 3,817.7 3,969.3 4,136.6NA -7.01%46,860.6 49,086.9 -4.54%4,358.9OH Cleveland Greater Cleveland Reg TA TOTAL
53.243.7 39.6 41.0NADR 47.0 48.6 -16.47%543.6 594.2 -8.52%Greater Cleveland Reg TAOH Cleveland597.1620.2 552.6 543.8NAHR 524.9 529.1 3.97%6,437.6 6,203.2 3.78%Greater Cleveland Reg TAOH Cleveland277.4243.7 218.2 247.3NALR 198.2 255.6 -3.01%2,608.1 2,778.6 -6.14%Greater Cleveland Reg TAOH Cleveland
3,881.53,451.3 3,023.2 2,985.6NAMB 3,199.2 3,303.3 -8.90%37,271.3 39,510.9 -5.67%Greater Cleveland Reg TAOH Cleveland
1,868.21,605.1 1,552.9 1,541.0 1,548.865.4 0.13%19,153.9 19,279.3 -0.65%1,806.2OH Columbus Central Ohio Transit Auth TOTAL
23.922.2 20.5 21.10.9DR 20.4 21.7 -3.33%254.9 258.4 -1.35%Central Ohio Transit AuthOH Columbus1,844.31,784.0 1,584.6 1,531.864.5MB 1,520.6 1,527.1 0.17%18,899.0 19,020.9 -0.64%Central Ohio Transit AuthOH Columbus
969.7811.2 798.7 824.9 835.932.3 -4.04%10,000.3 10,393.6 -3.78%914.2OH Dayton Greater Dayton Regional TA TOTAL
17.918.3 17.0 17.10.8DR 15.9 17.4 2.34%207.1 201.1 2.98%Greater Dayton Regional TAOH Dayton689.1649.5 575.8 566.422.8MB 585.7 592.6 -4.05%7,099.8 7,493.1 -5.25%Greater Dayton Regional TAOH Dayton262.7246.4 218.4 215.28.7TB 223.3 225.9 -4.48%2,693.4 2,699.4 -0.22%Greater Dayton Regional TAOH Dayton
6.87.3 7.9 5.6 6.40.3 23.94%82.3 68.2 20.67%8.1OH Delaware Delaware Area Transit Agency TOTAL6.88.1 7.3 7.90.3MB 5.6 6.4 23.94%82.3 68.2 20.67%Delaware Area Transit AgencyOH Delaware
69.560.1 60.2 56.7 59.72.9 -1.02%737.8 752.9 -2.01%63.7OH Grand River LAKETRAN TOTAL
23.323.7 21.6 22.31.1DR 19.6 21.0 5.79%269.8 259.4 4.01%LAKETRANOH Grand River46.240.0 38.5 37.91.9MB 37.1 38.7 -4.59%468.0 493.5 -5.17%LAKETRANOH Grand River
212.6154.3 108.2 163.9 94.3NA -2.44%1,535.0 1,530.3 0.31%196.8OH Kent Portage Area Reg Trp Auth TOTAL
10.29.8 8.6 8.4NADR 8.2 8.1 1.13%102.6 101.9 0.69%Portage Area Reg Trp AuthOH Kent202.4187.0 145.7 99.8NAMB 155.7 86.2 -2.66%1,432.4 1,428.4 0.28%Portage Area Reg Trp AuthOH Kent
Modes: MB - Bus, DR - Demand Response, CR - Commuter Rail, HR - Heavy Rail, LR - Light Rail, AG - Automated Guideway, CC - Cable Car, FB - Ferry Boat, IP - Inclined Plane, IR - Intermediate Rail, MO - Monorail, TB - Trolleybus, VP - Vanpool

APTA PUBLIC TRANSPORTATION RIDERSHIP REPORT
State and Primary City
Transit Agency Mode
Average
Weekday Oct '15
Trips for Trips for
Nov '15
Trips for
Dec '15
Trips Thru
Dec '15
Trips for
Oct '14
Trips for
Nov '14
Trips for
Dec '14
Trips Thru
Dec '14 Quarterly
Change
Year-
Change
Fourth Quarter, 2015
(000's) (000's) (000's) (000's) (000's) (000's) (000's) (000's)(000's)
to-Date
27
309.2NA NA 250.1 267.2NA NANA 3,224.1 NANAOH Toledo Toledo Area Reg Transit Auth TOTAL
31.426.7 24.1 24.51.0DR 26.9 27.3 -12.03%326.8 332.2 -1.63%Toledo Area Reg Transit AuthOH Toledo277.8NA NA NANAMB 223.2 239.9 NANA 2,891.9 NAToledo Area Reg Transit AuthOH Toledo
45.632.3 32.8 35.6 38.31.3 -13.81%423.4 471.1 -10.13%37.9OK Lawton Lawton Area Tr System (LATS) TOTAL45.637.9 32.3 32.81.3MB 35.6 38.3 -13.81%423.4 471.1 -10.13%Lawton Area Tr System (LATS)OK Lawton
294.1253.8 260.3 233.3 257.611.5 2.47%3,223.2 3,025.3 6.54%290.3OK Oklahoma City Central Oklahoma TA TOTAL
5.05.3 4.8 4.70.2DR 4.2 4.5 8.03%57.4 57.5 -0.17%Central Oklahoma TAOK Oklahoma City289.1285.0 249.0 255.611.3MB 229.1 253.1 2.37%3,165.8 2,967.8 6.67%Central Oklahoma TAOK Oklahoma City
1,153.1905.6 770.6 938.5 808.0NA -7.38%10,435.7 11,311.0 -7.74%1,009.3OR Eugene Lane Transit District TOTAL
15.716.9 15.0 14.8NADR 14.9 15.3 1.74%194.5 197.8 -1.67%Lane Transit District OR Eugene1,137.4992.4 890.6 755.835.2MB 923.6 792.7 -7.53%10,241.2 11,113.2 -7.85%Lane Transit District OR Eugene
9,230.88,024.1 8,033.2 7,698.7 8,121.4319.3 0.19%101,634.3 101,733.3 -0.10%9,041.8OR Portland Tri-County Metro Trp Dist TOTAL
46.541.0 34.4 35.01.7CR 34.2 36.9 -6.12%461.0 501.1 -8.00%Tri-County Metro Trp DistOR Portland94.792.8 84.7 88.83.6DR 78.7 86.9 2.31%1,051.0 1,035.0 1.55%Tri-County Metro Trp DistOR Portland
3,366.33,571.4 3,146.8 3,227.6122.9LR 2,792.9 3,007.4 8.50%38,494.5 38,164.6 0.86%Tri-County Metro Trp DistOR Portland5,723.35,336.6 4,758.2 4,681.8191.0MB 4,792.9 4,990.2 -4.71%61,627.8 62,032.6 -0.65%Tri-County Metro Trp DistOR Portland
346.3237.4 246.8 253.0 273.412.3 -10.85%3,387.3 3,533.4 -4.13%293.8OR Salem Salem-Keizer Transit TOTAL
14.613.4 10.8 12.60.6DR 10.1 13.3 -3.16%153.8 157.8 -2.53%Salem-Keizer TransitOR Salem331.7280.4 226.6 234.211.7MB 242.9 260.1 -11.20%3,233.5 3,375.6 -4.21%Salem-Keizer TransitOR Salem
32.623.2 25.3 24.2 26.51.2 -7.68%325.8 366.0 -10.98%28.4OR Wilsonville South Metro Area Rapid Transit TOTAL32.628.4 23.2 25.31.2MB 24.2 26.5 -7.68%325.8 366.0 -10.98%South Metro Area Rapid TransitOR Wilsonville
513.2444.5 475.2 426.2 454.522.0 1.40%5,341.3 5,465.5 -2.27%493.7PA Allentown Lehigh & Northampton Trp Auth TOTAL
39.138.0 35.5 40.61.8DR 32.2 35.6 6.74%430.2 417.9 2.94%Lehigh & Northampton Trp AuthPA Allentown474.1455.7 409.0 434.620.3MB 394.0 418.9 0.96%4,911.1 5,047.6 -2.70%Lehigh & Northampton Trp AuthPA Allentown
313.3NA NA 250.7 220.7NA NANA 3,121.2 NA290.5PA Erie Erie Metropolitan Transit Authority TOTAL313.3290.5 NA NANAMB 250.7 220.7 NANA 3,121.2 NAErie Metropolitan Transit AuthorityPA Erie
267.4203.0 208.2 209.9 228.89.3 -8.21%2,650.2 2,878.3 -7.92%236.9PA Harrisburg Cumberland-Dauphin-Harrisburg TA TOTAL
18.117.5 15.4 16.50.7DR 15.4 17.0 -2.18%201.5 197.8 1.87%Cumberland-Dauphin-Harrisburg TAPA Harrisburg249.3219.4 187.6 191.78.7MB 194.5 211.8 -8.68%2,448.7 2,680.5 -8.65%Cumberland-Dauphin-Harrisburg TAPA Harrisburg
121.6123.2 123.2 114.7 119.24.6 4.33%1,374.8 1,340.6 2.55%124.5PA Harris-Phil Penn DOT (Keystone) TOTAL121.6124.5 123.2 123.24.6CR 114.7 119.2 4.33%1,374.8 1,340.6 2.55%Penn DOT (Keystone)PA Harris-Phil
Modes: MB - Bus, DR - Demand Response, CR - Commuter Rail, HR - Heavy Rail, LR - Light Rail, AG - Automated Guideway, CC - Cable Car, FB - Ferry Boat, IP - Inclined Plane, IR - Intermediate Rail, MO - Monorail, TB - Trolleybus, VP - Vanpool

APTA PUBLIC TRANSPORTATION RIDERSHIP REPORT
State and Primary City
Transit Agency Mode
Average
Weekday Oct '15
Trips for Trips for
Nov '15
Trips for
Dec '15
Trips Thru
Dec '15
Trips for
Oct '14
Trips for
Nov '14
Trips for
Dec '14
Trips Thru
Dec '14 Quarterly
Change
Year-
Change
Fourth Quarter, 2015
(000's) (000's) (000's) (000's) (000's) (000's) (000's) (000's)(000's)
to-Date
28
109.189.5 92.3 87.0 93.43.1 -1.52%1,121.6 1,132.2 -0.94%103.3PA Johnstown Cambria County Transit Auth TOTAL
0.30.5 0.4 0.40.0DR 0.4 0.5 8.33%6.0 3.9 53.85%Cambria County Transit AuthPA Johnstown7.87.0 4.4 3.00.1IP 3.5 2.0 8.27%55.2 63.7 -13.34%Cambria County Transit AuthPA Johnstown
101.095.8 84.7 88.93.0MB 83.1 90.9 -2.04%1,060.4 1,064.6 -0.39%Cambria County Transit AuthPA Johnstown
218.2185.0 185.6 180.7 184.611.1 -1.18%2,205.3 2,242.6 -1.66%206.0PA Lancaster Red Rose Transit Authority TOTAL
28.024.5 21.6 22.94.3DR 23.2 26.4 -11.08%293.1 307.4 -4.65%Red Rose Transit AuthorityPA Lancaster190.2181.5 163.4 162.76.8MB 157.5 158.2 0.34%1,912.2 1,935.2 -1.19%Red Rose Transit AuthorityPA Lancaster
35.130.2 32.4 28.7 32.21.4 0.10%386.4 368.9 4.74%33.5PA Lebanon County of Lebanon Tr Auth TOTAL
4.34.6 4.1 4.40.2DR 3.5 3.9 11.97%51.6 45.5 13.41%County of Lebanon Tr AuthPA Lebanon30.828.9 26.1 28.01.2MB 25.2 28.3 -1.54%334.8 323.4 3.53%County of Lebanon Tr AuthPA Lebanon
33,536.627,526.4 28,206.8 27,833.4 28,849.6NA -5.25%335,859.1 345,315.8 -2.74%29,751.0PA Philadelphia Southeastern Penn TA TOTAL
3,671.33,476.7 2,947.4 3,251.6134.3CR 2,972.9 3,137.5 -1.08%37,804.6 37,876.0 -0.19%Southeastern Penn TAPA Philadelphia166.0135.6 175.6 138.56.0DR 151.6 155.2 -4.89%1,784.4 1,816.2 -1.75%Southeastern Penn TAPA Philadelphia
9,752.58,734.7 8,440.2 8,771.1343.8HR 8,169.3 8,389.3 -1.39%100,093.8 99,763.0 0.33%Southeastern Penn TAPA Philadelphia2,721.92,923.5 2,725.6 2,866.5111.6LR 2,177.4 2,246.8 19.16%26,742.5 25,405.1 5.26%Southeastern Penn TAPA Philadelphia
16,575.913,903.9 12,705.1 12,600.4533.6MB 13,809.0 14,346.7 -12.35%162,984.4 173,766.2 -6.20%Southeastern Penn TAPA Philadelphia649.0576.6 532.5 578.722.4TB 553.2 574.1 -4.98%6,449.4 6,689.3 -3.59%Southeastern Penn TAPA Philadelphia
6,017.35,120.0 4,927.2 5,014.7 4,932.7NA -0.41%64,343.1 63,380.4 1.52%5,851.4PA Pittsburgh Port Auth of Allegheny Co TOTAL
148.5129.0 120.2 126.5NADR 124.5 132.5 -7.35%1,512.0 1,581.8 -4.41%Port Auth of Allegheny CoPA Pittsburgh112.366.3 70.3 75.9NAIP 97.4 103.7 -32.20%1,189.7 1,345.3 -11.57%Port Auth of Allegheny CoPA Pittsburgh757.9713.5 663.5 665.4NALR 625.6 641.4 0.86%8,132.9 8,166.1 -0.41%Port Auth of Allegheny CoPA Pittsburgh
4,998.64,942.6 4,266.0 4,059.4NAMB 4,167.2 4,055.1 0.36%53,508.5 52,287.2 2.34%Port Auth of Allegheny CoPA Pittsburgh
319.1259.5 271.6 259.5 278.311.1 -4.64%3,195.7 3,418.8 -6.53%286.0PA Reading Berks Area Reading Trp Auth TOTAL
22.923.2 20.8 21.81.0DR 18.4 20.2 6.99%255.3 244.4 4.46%Berks Area Reading Trp AuthPA Reading296.2262.8 238.7 249.810.1MB 241.1 258.1 -5.54%2,940.4 3,174.4 -7.37%Berks Area Reading Trp AuthPA Reading
92.575.5 80.1 74.5 80.83.6 -1.49%982.4 975.2 0.74%88.5PA Rochester Beaver County Transit Authority TOTAL
7.17.0 6.2 6.60.3DR 5.8 6.6 1.54%77.0 79.4 -3.02%Beaver County Transit AuthorityPA Rochester85.481.5 69.3 73.53.3MB 68.7 74.2 -1.75%905.4 895.8 1.07%Beaver County Transit AuthorityPA Rochester
992.0650.0 494.0 704.4 584.327.5 -9.85%7,284.6 7,566.5 -3.73%912.1PA State College Centre Area Transp Auth TOTAL
2.72.3 2.3 2.30.1DR 2.8 2.7 -15.85%30.9 33.6 -8.04%Centre Area Transp AuthPA State College969.8892.0 633.4 478.027.3MB 684.6 564.3 -9.70%7,048.9 7,318.4 -3.68%Centre Area Transp AuthPA State College19.517.8 14.3 13.70.1VP 17.0 17.3 -14.87%204.8 214.5 -4.52%Centre Area Transp AuthPA State College
Modes: MB - Bus, DR - Demand Response, CR - Commuter Rail, HR - Heavy Rail, LR - Light Rail, AG - Automated Guideway, CC - Cable Car, FB - Ferry Boat, IP - Inclined Plane, IR - Intermediate Rail, MO - Monorail, TB - Trolleybus, VP - Vanpool

APTA PUBLIC TRANSPORTATION RIDERSHIP REPORT
State and Primary City
Transit Agency Mode
Average
Weekday Oct '15
Trips for Trips for
Nov '15
Trips for
Dec '15
Trips Thru
Dec '15
Trips for
Oct '14
Trips for
Nov '14
Trips for
Dec '14
Trips Thru
Dec '14 Quarterly
Change
Year-
Change
Fourth Quarter, 2015
(000's) (000's) (000's) (000's) (000's) (000's) (000's) (000's)(000's)
to-Date
29
113.8100.7 109.7 101.0 109.44.4 -0.74%1,299.8 1,321.9 -1.67%111.4PA Williamsport Williamsport Bureau of Tr TOTAL
0.10.1 0.1 0.10.1DR 0.1 0.1 0.00%1.2 1.2 0.00%Williamsport Bureau of TrPA Williamsport113.7111.3 100.6 109.64.3MB 100.9 109.3 -0.74%1,298.6 1,320.7 -1.67%Williamsport Bureau of TrPA Williamsport
NANA NA NA NANA NANA NA NANAPA York York County Transp Auth TOTAL
NANA NA NANADR NA NA NANA NA NAYork County Transp AuthPA YorkNANA NA NANAMB NA NA NANA NA NAYork County Transp AuthPA York0.00.0 0.0 0.00.0VP 0.0 0.0 0.00%0.0 0.0 NAYork County Transp AuthPA York
1,045.6772.5 724.1 828.9 771.135.9 -10.44%9,766.4 11,718.4 -16.66%872.9PR San Juan Puerto Rico DOT TOTAL
912.0819.2 694.0 652.732.8HR 682.0 631.0 -2.66%8,538.2 10,087.5 -15.36%Puerto Rico DOTPR San Juan133.653.7 78.5 71.43.1MB 146.9 140.1 -51.59%1,228.2 1,630.9 -24.69%Puerto Rico DOTPR San Juan
498.6361.2 371.4 391.5 385.815.0 -13.04%4,814.0 4,999.7 -3.71%376.9SC Charleston Charleston Area RTA TOTAL
6.95.9 5.5 5.80.2DR 5.8 6.5 -10.42%76.8 75.3 1.99%Charleston Area RTASC Charleston491.7371.0 355.7 365.614.8MB 385.7 379.3 -13.08%4,737.2 4,924.4 -3.80%Charleston Area RTASC Charleston
52.242.5 25.5 38.2 26.29.5 -2.40%423.2 489.6 -13.56%45.8SC Clemson Clemson Area Transit TOTAL52.245.8 42.5 25.59.5MB 38.2 26.2 -2.40%423.2 489.6 -13.56%Clemson Area TransitSC Clemson
103.678.0 81.5 80.9 86.1NA -6.25%1,006.4 1,082.5 -7.03%94.2SD Sioux Falls Sioux Area Metro TOTAL
11.510.8 9.2 10.0NADR 9.6 10.4 -4.76%121.3 132.5 -8.45%Sioux Area MetroSD Sioux Falls92.183.4 68.8 71.5NAMB 71.3 75.7 -6.44%885.1 950.0 -6.83%Sioux Area MetroSD Sioux Falls
271.7230.3 220.3 226.0 214.5NA 4.58%3,119.5 3,111.0 0.27%294.2TN Chattanooga Chattanooga Area RTA TOTAL
4.14.4 3.7 3.8NADR 3.5 3.7 5.31%48.4 47.8 1.26%Chattanooga Area RTATN Chattanooga20.244.3 23.8 21.1NAIP 24.7 17.0 44.10%441.2 399.5 10.44%Chattanooga Area RTATN Chattanooga
247.4245.5 202.8 195.4NAMB 197.8 193.8 0.74%2,629.9 2,663.7 -1.27%Chattanooga Area RTATN Chattanooga
66.053.7 58.1 56.3 61.72.4 -5.60%701.4 731.8 -4.15%61.9TN Clarksville Clarksville Transit System TOTAL
2.82.8 2.4 2.30.1DR 2.2 2.3 2.74%29.1 29.3 -0.68%Clarksville Transit SystemTN Clarksville63.259.1 51.3 55.82.3MB 54.1 59.4 -5.94%672.3 702.5 -4.30%Clarksville Transit SystemTN Clarksville
10.26.2 5.5 7.6 6.8NA -23.98%74.0 84.4 -12.32%7.0TN Franklin Franklin Transit Authority TOTAL10.27.0 6.2 5.5NAMB 7.6 6.8 -23.98%74.0 84.4 -12.32%Franklin Transit AuthorityTN Franklin
279.1232.5 238.9 229.6 240.810.5 -0.95%2,920.0 2,882.1 1.32%271.0TN Knoxville Knoxville Area Transit TOTAL
4.95.4 4.8 5.00.2DR 3.9 4.0 18.75%56.1 52.5 6.86%Knoxville Area TransitTN Knoxville274.2265.6 227.7 233.910.3MB 225.7 236.8 -1.29%2,863.9 2,829.6 1.21%Knoxville Area TransitTN Knoxville
775.0651.1 710.0 639.6 711.126.9 -1.50%7,956.5 8,443.9 -5.77%732.7TN Memphis Memphis Area Transit Auth TOTAL
21.718.9 17.1 17.80.7DR 17.7 18.8 -7.56%217.7 244.2 -10.85%Memphis Area Transit AuthTN Memphis0.00.0 0.0 0.00.0LR 0.0 0.0 0.00%0.0 485.1 -100.00%Memphis Area Transit AuthTN Memphis
753.3713.8 634.0 692.226.2MB 621.9 692.3 -1.33%7,738.8 7,714.6 0.31%Memphis Area Transit AuthTN Memphis
Modes: MB - Bus, DR - Demand Response, CR - Commuter Rail, HR - Heavy Rail, LR - Light Rail, AG - Automated Guideway, CC - Cable Car, FB - Ferry Boat, IP - Inclined Plane, IR - Intermediate Rail, MO - Monorail, TB - Trolleybus, VP - Vanpool

APTA PUBLIC TRANSPORTATION RIDERSHIP REPORT
State and Primary City
Transit Agency Mode
Average
Weekday Oct '15
Trips for Trips for
Nov '15
Trips for
Dec '15
Trips Thru
Dec '15
Trips for
Oct '14
Trips for
Nov '14
Trips for
Dec '14
Trips Thru
Dec '14 Quarterly
Change
Year-
Change
Fourth Quarter, 2015
(000's) (000's) (000's) (000's) (000's) (000's) (000's) (000's)(000's)
to-Date
30
929.0796.8 791.3 790.2 809.2NA -1.67%9,739.2 10,098.4 -3.56%898.0TN Nashville Metropolitan Transit Auth TOTAL
37.439.2 33.7 37.1NADR 33.6 34.7 4.07%424.9 416.4 2.04%Metropolitan Transit AuthTN Nashville891.6858.8 763.1 754.2NAMB 756.6 774.5 -1.92%9,314.3 9,682.0 -3.80%Metropolitan Transit AuthTN Nashville
60.248.2 48.4 45.3 48.2NA -0.65%625.8 636.1 -1.62%56.1TN Nashville Regional Transp Auth TOTAL
26.926.4 22.7 21.6NACR 18.9 20.6 6.48%273.7 256.7 6.62%Regional Transp AuthTN Nashville18.616.8 14.3 14.6NAMB 14.1 15.0 -4.19%201.5 202.6 -0.54%Regional Transp AuthTN Nashville14.712.9 11.2 12.2NAVP 12.3 12.6 -8.33%150.6 176.8 -14.82%Regional Transp AuthTN Nashville
3,678.53,046.5 2,284.8 3,076.3 2,299.3108.0 -2.88%33,523.6 33,782.6 -0.77%3,461.6TX Austin Capital Metropolitan Trp Auth TOTAL
81.985.2 57.4 49.32.8CR 61.7 49.9 -0.83%839.6 782.1 7.35%Capital Metropolitan Trp AuthTX Austin58.959.6 54.1 56.22.2DR 50.8 54.3 3.60%681.1 643.6 5.83%Capital Metropolitan Trp AuthTX Austin
3,508.53,284.6 2,902.8 2,147.5101.4MB 2,943.0 2,168.6 -3.31%31,638.9 32,099.0 -1.43%Capital Metropolitan Trp AuthTX Austin29.232.2 32.2 31.81.5VP 20.8 26.5 25.75%364.0 257.9 41.14%Capital Metropolitan Trp AuthTX Austin
573.6447.8 451.4 454.9 484.622.3 -4.98%5,771.0 5,950.7 -3.02%538.6TX Corpus Christi Corpus Christi Regional TA TOTAL
17.518.3 16.0 16.70.8DR 13.9 15.6 8.51%198.0 193.1 2.54%Corpus Christi Regional TATX Corpus Christi0.00.0 0.0 0.00.0FB 0.0 0.0 0.00%71.7 84.1 -14.74%Corpus Christi Regional TATX Corpus Christi
555.6519.2 430.7 433.621.5MB 440.5 468.2 -5.52%5,471.6 5,650.9 -3.17%Corpus Christi Regional TATX Corpus Christi0.51.1 1.1 1.10.0VP 0.5 0.8 83.33%29.7 22.6 31.42%Corpus Christi Regional TATX Corpus Christi
7,142.15,270.2 5,324.5 5,337.4 5,457.0231.0 -2.83%67,514.8 69,377.9 -2.69%6,834.7TX Dallas Dallas Area Rapid Transit TOTAL
71.973.1 63.4 65.12.8DR 58.3 61.5 5.16%791.7 765.9 3.37%Dallas Area Rapid TransitTX Dallas3,335.13,437.1 2,373.3 2,357.9104.8LR 2,222.1 2,369.2 3.05%30,116.6 29,884.2 0.78%Dallas Area Rapid TransitTX Dallas3,664.33,251.2 2,764.2 2,823.1120.0MB 2,996.7 2,956.7 -8.10%35,714.9 37,868.8 -5.69%Dallas Area Rapid TransitTX Dallas
70.873.3 69.3 78.43.4VP 60.3 69.6 10.11%891.6 859.0 3.80%Dallas Area Rapid TransitTX Dallas
245.2161.3 168.9 164.6 171.28.1 -1.62%2,164.3 2,293.5 -5.63%241.4TX Dallas-Ft Worth Trinity Railway Express TOTAL245.2241.4 161.3 168.98.1CR 164.6 171.2 -1.62%2,164.3 2,293.5 -5.63%Trinity Railway ExpressTX Dallas-Ft Worth
1,465.71,233.3 1,201.5 1,324.8 1,343.644.7 -7.76%15,690.4 16,762.4 -6.40%1,378.7TX El Paso El Paso Mass Transit Dept TOTAL
21.322.0 19.6 19.50.8DR 18.4 18.7 4.62%241.3 231.0 4.46%El Paso Mass Transit DeptTX El Paso1,444.41,356.7 1,213.7 1,182.043.9MB 1,306.4 1,324.9 -7.93%15,449.1 16,531.4 -6.55%El Paso Mass Transit DeptTX El Paso
811.0606.8 649.8 670.0 700.924.6 -9.00%8,184.9 8,773.6 -6.71%729.0TX Fort Worth Fort Worth Trp Auth TOTAL
34.933.5 29.0 32.21.3DR 29.2 31.3 -0.73%382.3 380.3 0.53%Fort Worth Trp AuthTX Fort Worth721.5655.6 540.4 580.221.5MB 595.7 620.5 -8.33%7,288.1 7,779.8 -6.32%Fort Worth Trp AuthTX Fort Worth54.639.9 37.4 37.41.8VP 45.1 49.1 -22.92%514.5 613.5 -16.14%Fort Worth Trp AuthTX Fort Worth
Modes: MB - Bus, DR - Demand Response, CR - Commuter Rail, HR - Heavy Rail, LR - Light Rail, AG - Automated Guideway, CC - Cable Car, FB - Ferry Boat, IP - Inclined Plane, IR - Intermediate Rail, MO - Monorail, TB - Trolleybus, VP - Vanpool

APTA PUBLIC TRANSPORTATION RIDERSHIP REPORT
State and Primary City
Transit Agency Mode
Average
Weekday Oct '15
Trips for Trips for
Nov '15
Trips for
Dec '15
Trips Thru
Dec '15
Trips for
Oct '14
Trips for
Nov '14
Trips for
Dec '14
Trips Thru
Dec '14 Quarterly
Change
Year-
Change
Fourth Quarter, 2015
(000's) (000's) (000's) (000's) (000's) (000's) (000's) (000's)(000's)
to-Date
31
8,081.37,260.3 7,261.6 6,599.4 6,764.1306.7 6.02%87,199.2 85,785.4 1.65%8,214.8TX Houston Metro Tr Auth of Harris Co TOTAL
176.1171.0 152.9 160.76.4DR 146.9 155.9 1.19%1,901.1 1,896.7 0.23%Metro Tr Auth of Harris CoTX Houston1,223.61,652.9 1,465.6 1,430.260.6LR 1,024.1 1,052.1 37.85%16,500.4 13,300.7 24.06%Metro Tr Auth of Harris CoTX Houston6,453.46,178.8 5,460.8 5,499.2231.0MB 5,242.7 5,368.3 0.44%66,356.7 68,116.2 -2.58%Metro Tr Auth of Harris CoTX Houston
228.2212.1 181.0 171.58.8VP 185.7 187.8 -6.17%2,441.0 2,471.8 -1.25%Metro Tr Auth of Harris CoTX Houston
408.2310.1 153.2 293.0 167.613.3 -1.24%2,973.9 2,907.1 2.30%394.7TX Lewisville Denton County Transportation Auth TOTAL
59.265.4 45.8 38.71.9CR 43.4 39.4 5.56%557.7 570.1 -2.18%Denton County Transportation AuthTX Lewisville3.02.6 2.3 2.30.1DR 2.3 2.5 -7.69%30.4 31.9 -4.70%Denton County Transportation AuthTX Lewisville
346.0326.7 262.0 112.211.3MB 247.3 125.7 -2.52%2,385.8 2,305.1 3.50%Denton County Transportation AuthTX Lewisville
36.428.7 32.7 32.9 31.27.9 -5.87%370.2 411.0 -9.93%33.2TX Odessa Midland Odessa Urban Transit Distri TOTAL
2.54.4 3.5 3.21.0DR 2.4 2.1 58.57%33.3 26.0 28.08%Midland Odessa Urban Transit DistriTX Odessa33.928.8 25.2 29.56.9MB 30.5 29.1 -10.70%336.9 385.0 -12.49%Midland Odessa Urban Transit DistriTX Odessa
12.810.2 10.8 10.3 10.8NA -0.29%123.7 134.9 -8.30%12.8TX Port Arthur Port Arthur Transit TOTAL
1.01.0 0.8 0.9NADR 0.8 0.9 0.00%10.4 11.1 -6.31%Port Arthur TransitTX Port Arthur11.811.8 9.4 9.9NAMB 9.5 9.9 -0.32%113.3 123.8 -8.48%Port Arthur TransitTX Port Arthur
4,128.23,268.7 3,335.6 3,350.0 3,498.1132.4 -6.13%41,537.4 43,895.7 -5.37%3,699.7TX San Antonio VIA Metropolitan Transit TOTAL
100.2100.9 90.7 93.74.1DR 82.3 89.0 5.08%1,112.9 1,068.2 4.18%VIA Metropolitan TransitTX San Antonio4,028.03,598.8 3,178.0 3,241.9128.4MB 3,267.7 3,409.1 -6.41%40,424.5 42,827.5 -5.61%VIA Metropolitan TransitTX San Antonio
37.227.9 26.4 26.0 28.21.5 -1.75%381.0 385.2 -1.09%35.5TX Sugar Land Fort Bend County Public Transporta TOTAL
10.811.3 9.4 10.10.5DR 8.0 9.2 10.00%122.5 114.1 7.36%Fort Bend County Public TransportaTX Sugar Land26.424.2 18.5 16.31.0MB 18.0 19.0 -6.94%258.5 271.1 -4.65%Fort Bend County Public TransportaTX Sugar Land
219.1157.0 133.8 160.5 140.77.3 -4.46%1,876.0 1,971.1 -4.82%206.3UT Logan Logan/Cache Valley TD TOTAL
2.52.4 2.3 2.30.1DR 2.3 2.4 -2.78%26.8 28.3 -5.30%Logan/Cache Valley TDUT Logan216.6203.9 154.7 131.57.2MB 158.2 138.3 -4.48%1,849.2 1,942.8 -4.82%Logan/Cache Valley TDUT Logan
64.361.0 225.7 60.4 204.13.7 5.32%1,813.7 1,813.8 -0.01%59.6UT Park City Park City Transit TOTAL
1.21.2 1.0 1.10.0DR 1.0 1.1 0.00%8.6 8.6 0.00%Park City TransitUT Park City63.158.4 60.0 224.63.7MB 59.4 203.0 5.38%1,805.1 1,805.2 -0.01%Park City TransitUT Park City
4,287.53,733.6 3,884.8 3,605.8 3,943.6165.8 1.55%46,577.6 45,078.4 3.33%4,401.6UT Salt Lake City Utah Transit Authority TOTAL
420.9443.3 373.7 421.917.6CR 360.6 401.0 4.77%4,645.3 4,416.1 5.19%Utah Transit AuthorityUT Salt Lake City80.279.0 68.2 69.43.5DR 63.5 63.8 4.39%860.9 811.8 6.05%Utah Transit AuthorityUT Salt Lake City
1,848.21,886.4 1,623.1 1,725.867.3LR 1,609.1 1,738.3 0.76%19,704.3 19,868.7 -0.83%Utah Transit AuthorityUT Salt Lake City1,823.31,873.9 1,552.5 1,555.871.9MB 1,454.8 1,641.8 1.27%19,943.4 18,581.0 7.33%Utah Transit AuthorityUT Salt Lake City
114.9119.0 116.1 111.95.5VP 117.8 98.7 4.71%1,423.7 1,400.8 1.63%Utah Transit AuthorityUT Salt Lake City
Modes: MB - Bus, DR - Demand Response, CR - Commuter Rail, HR - Heavy Rail, LR - Light Rail, AG - Automated Guideway, CC - Cable Car, FB - Ferry Boat, IP - Inclined Plane, IR - Intermediate Rail, MO - Monorail, TB - Trolleybus, VP - Vanpool

APTA PUBLIC TRANSPORTATION RIDERSHIP REPORT
State and Primary City
Transit Agency Mode
Average
Weekday Oct '15
Trips for Trips for
Nov '15
Trips for
Dec '15
Trips Thru
Dec '15
Trips for
Oct '14
Trips for
Nov '14
Trips for
Dec '14
Trips Thru
Dec '14 Quarterly
Change
Year-
Change
Fourth Quarter, 2015
(000's) (000's) (000's) (000's) (000's) (000's) (000's) (000's)(000's)
to-Date
32
42.835.9 36.9 36.2 37.71.6 -1.54%471.9 458.7 2.88%42.1UT St. George City of St. George TOTAL
1.00.9 0.8 0.80.0DR 0.9 1.1 -16.67%10.5 10.3 1.94%City of St. GeorgeUT St. George41.841.2 35.1 36.11.6MB 35.3 36.6 -1.14%461.4 448.4 2.90%City of St. GeorgeUT St. George
392.6315.0 319.6 315.4 326.413.4 -2.71%4,209.5 4,280.5 -1.66%371.8VA Alexandria Alexandria Transit Company TOTAL392.6371.8 315.0 319.613.4MB 315.4 326.4 -2.71%4,209.5 4,280.5 -1.66%Alexandria Transit CompanyVA Alexandria
415.6325.0 338.2 317.6 358.2NA -4.67%4,374.0 4,513.5 -3.09%377.2VA Alexandria Virginia Railway Express TOTAL415.6377.2 325.0 338.2NACR 317.6 358.2 -4.67%4,374.0 4,513.5 -3.09%Virginia Railway ExpressVA Alexandria
270.3227.7 253.7 216.9 234.210.3 2.51%2,939.1 2,949.3 -0.35%258.1VA Arlington Arlington Transit (ART) TOTAL
10.69.5 8.4 8.70.3DR 10.0 9.8 -12.50%105.5 116.6 -9.52%Arlington Transit (ART)VA Arlington259.7248.6 219.3 245.010.0MB 206.9 224.4 3.17%2,833.6 2,832.7 0.03%Arlington Transit (ART)VA Arlington
79.457.1 53.6 60.2 55.2NA -7.96%716.9 806.8 -11.14%68.6VA Fairfax City of Fairfax CUE Bus TOTAL79.468.6 57.1 53.6NAMB 60.2 55.2 -7.96%716.9 806.8 -11.14%City of Fairfax CUE BusVA Fairfax
903.9723.6 732.0 738.0 768.230.0 -5.61%9,348.5 10,335.1 -9.55%819.3VA Fairfax Fairfax County Dept of Transp TOTAL903.9819.3 723.6 732.030.0MB 738.0 768.2 -5.61%9,348.5 10,335.1 -9.55%Fairfax County Dept of TranspVA Fairfax
1,606.61,164.0 1,223.7 1,281.6 1,325.549.1 -11.60%15,624.1 17,409.5 -10.26%1,337.2VA Hampton Hampton Roads Transit TOTAL
30.330.6 27.9 28.71.2DR 25.2 26.9 5.83%333.8 320.5 4.15%Hampton Roads TransitVA Hampton24.916.5 16.6 12.30.5FB 17.1 12.8 -17.15%251.9 323.4 -22.11%Hampton Roads TransitVA Hampton
167.5117.1 74.4 102.03.7LR 123.4 124.2 -29.29%1,397.9 1,695.9 -17.57%Hampton Roads TransitVA Hampton1,374.91,167.5 1,039.4 1,075.643.6MB 1,108.9 1,154.0 -9.77%13,562.5 14,938.4 -9.21%Hampton Roads TransitVA Hampton
9.05.5 5.7 5.10.3VP 7.0 7.6 -30.93%78.0 131.3 -40.59%Hampton Roads TransitVA Hampton
376.1212.4 161.7 297.2 163.1NA -25.14%2,396.7 2,736.7 -12.42%252.0VA Lynchburg Greater Lynchburg Transit Co TOTAL
0.00.0 0.0 0.0NADR 0.0 0.0 0.00%0.0 0.0 NAGreater Lynchburg Transit CoVA Lynchburg376.1252.0 212.4 161.7NAMB 297.2 163.1 -25.14%2,396.7 2,736.7 -12.42%Greater Lynchburg Transit CoVA Lynchburg
235.7185.1 235.6 178.0 217.8NA 5.45%2,576.6 2,479.9 3.90%245.2VA Williamsburg Williamsburg Area Transport TOTAL
0.60.9 0.8 0.7NADR 0.5 0.6 41.18%9.0 5.6 60.71%Williamsburg Area TransportVA Williamsburg235.1244.3 184.3 234.93.0MB 177.5 217.2 5.35%2,567.6 2,474.3 3.77%Williamsburg Area TransportVA Williamsburg
299.6216.8 221.4 229.6 241.811.4 -10.23%2,904.8 3,165.6 -8.24%253.9VA Woodbridge PRTC Omni-Ride TOTAL299.6253.9 216.8 221.411.4MB 229.6 241.8 -10.23%2,904.8 3,165.6 -8.24%PRTC Omni-RideVA Woodbridge
273.9211.4 210.1 221.7 220.79.8 -6.90%2,650.6 2,615.7 1.33%245.4VT Burlington Chittenden County TA TOTAL
5.04.6 3.9 4.10.1DR 4.3 4.4 -8.03%51.8 55.8 -7.17%Chittenden County TAVT Burlington268.9240.8 207.5 206.09.7MB 217.4 216.3 -6.87%2,598.8 2,559.9 1.52%Chittenden County TAVT Burlington
Modes: MB - Bus, DR - Demand Response, CR - Commuter Rail, HR - Heavy Rail, LR - Light Rail, AG - Automated Guideway, CC - Cable Car, FB - Ferry Boat, IP - Inclined Plane, IR - Intermediate Rail, MO - Monorail, TB - Trolleybus, VP - Vanpool

APTA PUBLIC TRANSPORTATION RIDERSHIP REPORT
State and Primary City
Transit Agency Mode
Average
Weekday Oct '15
Trips for Trips for
Nov '15
Trips for
Dec '15
Trips Thru
Dec '15
Trips for
Oct '14
Trips for
Nov '14
Trips for
Dec '14
Trips Thru
Dec '14 Quarterly
Change
Year-
Change
Fourth Quarter, 2015
(000's) (000's) (000's) (000's) (000's) (000's) (000's) (000's)(000's)
to-Date
33
346.9276.6 277.6 278.4 293.110.7 -3.16%3,813.2 3,806.7 0.17%335.2WA Bremerton Kitsap Transit TOTAL
28.326.5 21.6 22.71.0DR 22.3 24.5 -5.73%305.6 298.9 2.24%Kitsap TransitWA Bremerton40.643.8 36.1 34.51.7FB 32.1 31.9 9.37%492.8 458.1 7.57%Kitsap TransitWA Bremerton
257.8248.2 204.5 205.47.2MB 208.2 219.0 -3.93%2,809.4 2,817.4 -0.28%Kitsap TransitWA Bremerton20.216.7 14.4 15.00.7VP 15.8 17.7 -14.15%205.4 232.3 -11.58%Kitsap TransitWA Bremerton
191.9154.9 155.9 156.6 159.710.4 -2.52%2,037.4 2,060.1 -1.10%184.6WA Everett Everett Transit System TOTAL
9.69.1 8.1 8.84.0DR 8.4 9.0 -3.70%107.0 106.8 0.19%Everett Transit SystemWA Everett182.3175.5 146.8 147.16.4MB 148.2 150.7 -2.45%1,930.4 1,953.3 -1.17%Everett Transit SystemWA Everett
961.1805.2 774.9 754.7 754.135.8 2.40%10,040.7 9,798.4 2.47%949.1WA Everett Snohomish County PTBA TOTAL
17.817.2 14.4 15.80.6DR 14.6 15.5 -1.04%190.4 192.6 -1.14%Snohomish County PTBAWA Everett858.6851.7 719.0 692.631.7MB 673.0 670.5 2.78%8,941.8 8,682.1 2.99%Snohomish County PTBAWA Everett84.780.2 71.8 66.53.4VP 67.1 68.1 -0.64%908.5 923.7 -1.65%Snohomish County PTBAWA Everett
519.2397.4 384.1 417.9 418.4NA -7.95%5,127.3 5,369.5 -4.51%466.3WA Olympia Intercity Transit TOTAL
14.314.7 13.0 13.7NADR 11.9 13.1 5.34%161.6 154.6 4.53%Intercity TransitWA Olympia436.9394.5 336.3 317.314.6MB 352.2 343.5 -7.46%4,280.8 4,468.9 -4.21%Intercity TransitWA Olympia68.057.1 48.1 53.17.0VP 53.8 61.8 -13.78%684.9 746.0 -8.19%Intercity TransitWA Olympia
382.5294.9 293.8 292.6 309.914.4 -6.68%3,720.8 4,027.2 -7.61%330.5WA Richland Ben Franklin Transit TOTAL
34.839.5 36.9 38.01.8DR 26.7 30.9 23.81%462.1 379.3 21.83%Ben Franklin TransitWA Richland275.0225.4 193.0 185.89.4MB 203.2 212.9 -12.57%2,477.5 2,824.0 -12.27%Ben Franklin TransitWA Richland72.765.6 65.0 70.03.1VP 62.7 66.1 -0.45%781.2 823.9 -5.18%Ben Franklin TransitWA Richland
11,526.610,174.6 9,919.0 9,809.6 9,809.1419.4 1.23%126,277.1 125,312.8 0.77%11,434.0WA Seattle King County Dept of Trp TOTAL
98.786.5 76.7 78.63.2DR 82.9 83.5 -8.79%994.2 1,081.6 -8.08%King County Dept of TrpWA Seattle58.947.6 41.5 43.01.8LR 50.3 53.8 -18.96%622.0 707.7 -12.11%King County Dept of TrpWA Seattle
9,260.39,327.6 8,305.7 8,046.3330.3MB 7,980.4 7,901.6 2.14%102,332.1 100,644.5 1.68%King County Dept of TrpWA Seattle1,810.51,615.1 1,467.1 1,458.269.7TB 1,442.1 1,508.3 -4.63%18,766.9 19,464.4 -3.58%King County Dept of TrpWA Seattle
298.2357.2 283.6 292.914.4VP 253.9 261.9 14.71%3,561.9 3,414.6 4.31%King County Dept of TrpWA Seattle
2,996.12,743.1 2,762.6 2,547.9 2,644.6118.1 5.81%34,845.8 32,829.8 6.14%3,158.6WA Seattle Sound Transit TOTAL
345.3362.2 320.0 312.515.0CR 282.6 285.0 8.96%3,797.6 3,362.8 12.93%Sound TransitWA Seattle5.23.8 3.4 3.50.1DR 4.3 4.3 -22.46%46.1 56.4 -18.26%Sound TransitWA Seattle
1,013.41,149.6 1,003.8 1,028.041.0LR 891.2 958.6 11.11%12,688.3 11,915.9 6.48%Sound TransitWA Seattle1,632.21,643.0 1,415.9 1,418.662.0MB 1,369.8 1,396.7 1.79%18,313.8 17,494.7 4.68%Sound TransitWA Seattle
39.530.1 30.2 30.5 30.38.2 -2.19%395.6 406.2 -2.61%37.8WA Seattle University of Washington TOTAL39.537.8 30.1 30.28.2MB 30.5 30.3 -2.19%395.6 406.2 -2.61%University of WashingtonWA Seattle
Modes: MB - Bus, DR - Demand Response, CR - Commuter Rail, HR - Heavy Rail, LR - Light Rail, AG - Automated Guideway, CC - Cable Car, FB - Ferry Boat, IP - Inclined Plane, IR - Intermediate Rail, MO - Monorail, TB - Trolleybus, VP - Vanpool
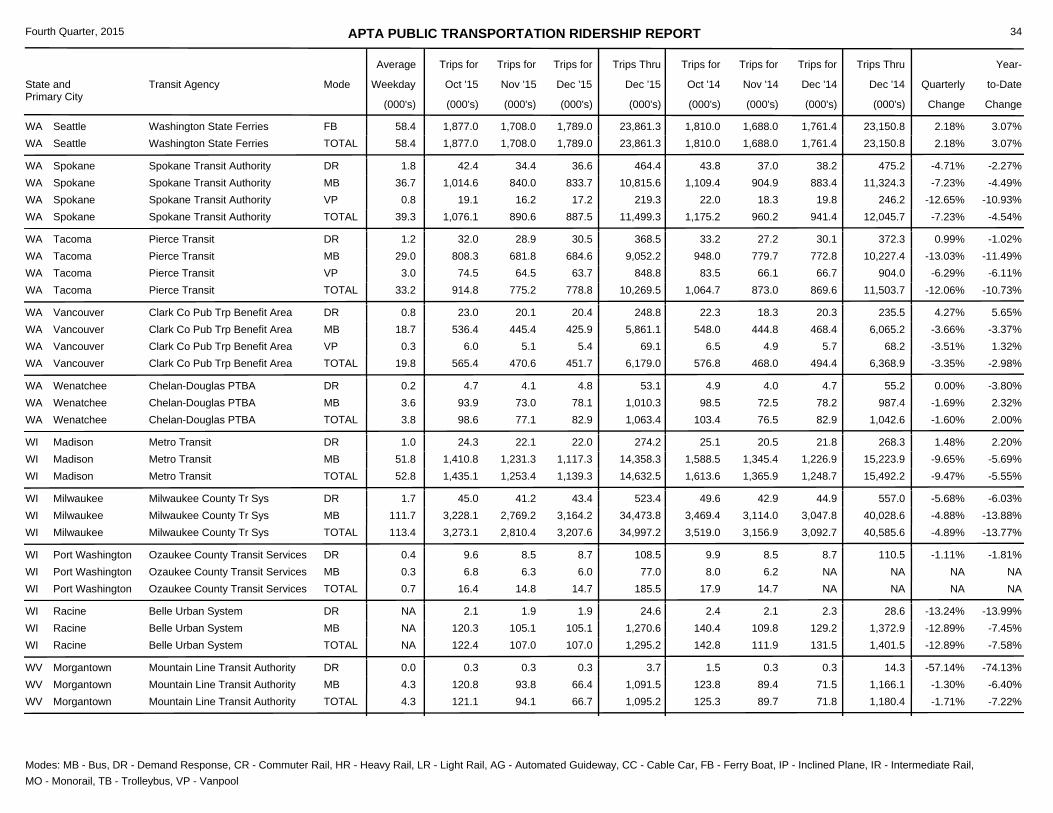
APTA PUBLIC TRANSPORTATION RIDERSHIP REPORT
State and Primary City
Transit Agency Mode
Average
Weekday Oct '15
Trips for Trips for
Nov '15
Trips for
Dec '15
Trips Thru
Dec '15
Trips for
Oct '14
Trips for
Nov '14
Trips for
Dec '14
Trips Thru
Dec '14 Quarterly
Change
Year-
Change
Fourth Quarter, 2015
(000's) (000's) (000's) (000's) (000's) (000's) (000's) (000's)(000's)
to-Date
34
1,810.01,708.0 1,789.0 1,688.0 1,761.458.4 2.18%23,861.3 23,150.8 3.07%1,877.0WA Seattle Washington State Ferries TOTAL1,810.01,877.0 1,708.0 1,789.058.4FB 1,688.0 1,761.4 2.18%23,861.3 23,150.8 3.07%Washington State FerriesWA Seattle
1,175.2890.6 887.5 960.2 941.439.3 -7.23%11,499.3 12,045.7 -4.54%1,076.1WA Spokane Spokane Transit Authority TOTAL
43.842.4 34.4 36.61.8DR 37.0 38.2 -4.71%464.4 475.2 -2.27%Spokane Transit AuthorityWA Spokane1,109.41,014.6 840.0 833.736.7MB 904.9 883.4 -7.23%10,815.6 11,324.3 -4.49%Spokane Transit AuthorityWA Spokane
22.019.1 16.2 17.20.8VP 18.3 19.8 -12.65%219.3 246.2 -10.93%Spokane Transit AuthorityWA Spokane
1,064.7775.2 778.8 873.0 869.633.2 -12.06%10,269.5 11,503.7 -10.73%914.8WA Tacoma Pierce Transit TOTAL
33.232.0 28.9 30.51.2DR 27.2 30.1 0.99%368.5 372.3 -1.02%Pierce TransitWA Tacoma948.0808.3 681.8 684.629.0MB 779.7 772.8 -13.03%9,052.2 10,227.4 -11.49%Pierce TransitWA Tacoma83.574.5 64.5 63.73.0VP 66.1 66.7 -6.29%848.8 904.0 -6.11%Pierce TransitWA Tacoma
576.8470.6 451.7 468.0 494.419.8 -3.35%6,179.0 6,368.9 -2.98%565.4WA Vancouver Clark Co Pub Trp Benefit Area TOTAL
22.323.0 20.1 20.40.8DR 18.3 20.3 4.27%248.8 235.5 5.65%Clark Co Pub Trp Benefit AreaWA Vancouver548.0536.4 445.4 425.918.7MB 444.8 468.4 -3.66%5,861.1 6,065.2 -3.37%Clark Co Pub Trp Benefit AreaWA Vancouver
6.56.0 5.1 5.40.3VP 4.9 5.7 -3.51%69.1 68.2 1.32%Clark Co Pub Trp Benefit AreaWA Vancouver
103.477.1 82.9 76.5 82.93.8 -1.60%1,063.4 1,042.6 2.00%98.6WA Wenatchee Chelan-Douglas PTBA TOTAL
4.94.7 4.1 4.80.2DR 4.0 4.7 0.00%53.1 55.2 -3.80%Chelan-Douglas PTBAWA Wenatchee98.593.9 73.0 78.13.6MB 72.5 78.2 -1.69%1,010.3 987.4 2.32%Chelan-Douglas PTBAWA Wenatchee
1,613.61,253.4 1,139.3 1,365.9 1,248.752.8 -9.47%14,632.5 15,492.2 -5.55%1,435.1WI Madison Metro Transit TOTAL
25.124.3 22.1 22.01.0DR 20.5 21.8 1.48%274.2 268.3 2.20%Metro TransitWI Madison1,588.51,410.8 1,231.3 1,117.351.8MB 1,345.4 1,226.9 -9.65%14,358.3 15,223.9 -5.69%Metro TransitWI Madison
3,519.02,810.4 3,207.6 3,156.9 3,092.7113.4 -4.89%34,997.2 40,585.6 -13.77%3,273.1WI Milwaukee Milwaukee County Tr Sys TOTAL
49.645.0 41.2 43.41.7DR 42.9 44.9 -5.68%523.4 557.0 -6.03%Milwaukee County Tr SysWI Milwaukee3,469.43,228.1 2,769.2 3,164.2111.7MB 3,114.0 3,047.8 -4.88%34,473.8 40,028.6 -13.88%Milwaukee County Tr SysWI Milwaukee
17.914.8 14.7 14.7 NA0.7 NA185.5 NA NA16.4WI Port Washington Ozaukee County Transit Services TOTAL
9.99.6 8.5 8.70.4DR 8.5 8.7 -1.11%108.5 110.5 -1.81%Ozaukee County Transit ServicesWI Port Washington8.06.8 6.3 6.00.3MB 6.2 NA NA77.0 NA NAOzaukee County Transit ServicesWI Port Washington
142.8107.0 107.0 111.9 131.5NA -12.89%1,295.2 1,401.5 -7.58%122.4WI Racine Belle Urban System TOTAL
2.42.1 1.9 1.9NADR 2.1 2.3 -13.24%24.6 28.6 -13.99%Belle Urban SystemWI Racine140.4120.3 105.1 105.1NAMB 109.8 129.2 -12.89%1,270.6 1,372.9 -7.45%Belle Urban SystemWI Racine
125.394.1 66.7 89.7 71.84.3 -1.71%1,095.2 1,180.4 -7.22%121.1WV Morgantown Mountain Line Transit Authority TOTAL
1.50.3 0.3 0.30.0DR 0.3 0.3 -57.14%3.7 14.3 -74.13%Mountain Line Transit AuthorityWV Morgantown123.8120.8 93.8 66.44.3MB 89.4 71.5 -1.30%1,091.5 1,166.1 -6.40%Mountain Line Transit AuthorityWV Morgantown
Modes: MB - Bus, DR - Demand Response, CR - Commuter Rail, HR - Heavy Rail, LR - Light Rail, AG - Automated Guideway, CC - Cable Car, FB - Ferry Boat, IP - Inclined Plane, IR - Intermediate Rail, MO - Monorail, TB - Trolleybus, VP - Vanpool
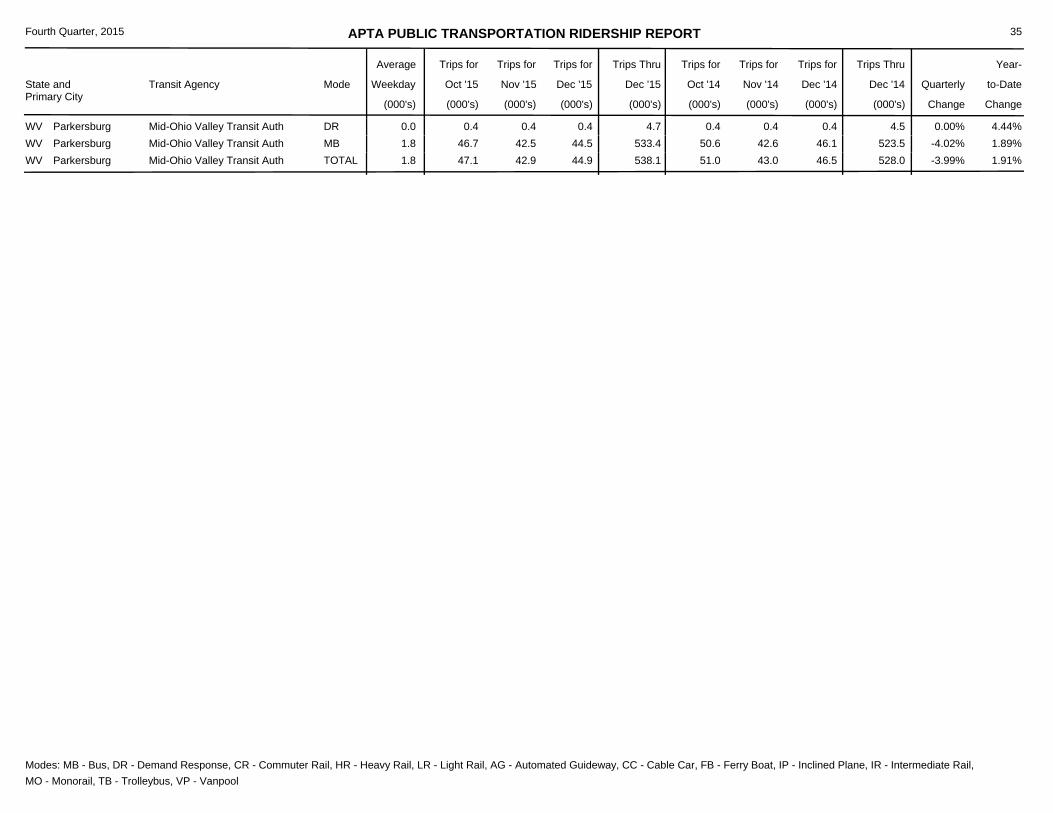
APTA PUBLIC TRANSPORTATION RIDERSHIP REPORT
State and Primary City
Transit Agency Mode
Average
Weekday Oct '15
Trips for Trips for
Nov '15
Trips for
Dec '15
Trips Thru
Dec '15
Trips for
Oct '14
Trips for
Nov '14
Trips for
Dec '14
Trips Thru
Dec '14 Quarterly
Change
Year-
Change
Fourth Quarter, 2015
(000's) (000's) (000's) (000's) (000's) (000's) (000's) (000's)(000's)
to-Date
35
51.042.9 44.9 43.0 46.51.8 -3.99%538.1 528.0 1.91%47.1WV Parkersburg Mid-Ohio Valley Transit Auth TOTAL
0.40.4 0.4 0.40.0DR 0.4 0.4 0.00%4.7 4.5 4.44%Mid-Ohio Valley Transit AuthWV Parkersburg50.646.7 42.5 44.51.8MB 42.6 46.1 -4.02%533.4 523.5 1.89%Mid-Ohio Valley Transit AuthWV Parkersburg
Modes: MB - Bus, DR - Demand Response, CR - Commuter Rail, HR - Heavy Rail, LR - Light Rail, AG - Automated Guideway, CC - Cable Car, FB - Ferry Boat, IP - Inclined Plane, IR - Intermediate Rail, MO - Monorail, TB - Trolleybus, VP - Vanpool

APTA PUBLIC TRANSPORTATION RIDERSHIP REPORT
Province and City Transit Agency Mode
Average
Weekday Oct '15
Trips for Trips for
Nov '15
Trips for
Dec '15
Trips Thru
Dec '15
Trips for
Oct '14
Trips for
Nov '14
Trips for
Dec '14
Trips Thru
Dec '14 Quarterly
Change
Year-
Change
Fourth Quarter, 2015
(000's) (000's) (000's) (000's) (000's) (000's) (000's) (000's)(000's)
to-Date
36
CANADA
14,632.9 13,320.2 15,783.0 15,488.0 14,152.4582.5 -4.53%170,807.7 173,255.7 -1.41%15,410.6AB Calgary Calgary Transit TOTAL
7,982.7 8,053.6 7,326.1301.7LR 8,197.1 8,539.3 7,803.0 -4.80%89,378.5 90,930.0 -1.71%Calgary TransitAB Calgary7,427.9 6,579.3 5,994.1280.7MB 7,585.9 6,948.7 6,349.4 -4.23%81,429.2 82,325.7 -1.09%Calgary TransitAB Calgary
13,153.5 12,666.6 13,550.2 13,293.3 12,789.4NA -1.27%141,953.6 143,041.2 -0.76%13,308.0AB Edmonton Edmonton Transit System TOTAL
3,313.7 3,275.2 3,154.0NALR 3,374.0 3,310.1 3,184.6 -1.27%35,346.4 34,751.4 1.71%Edmonton Transit SystemAB Edmonton9,994.3 9,878.3 9,512.6NAMB 10,176.2 9,983.2 9,604.8 -1.27%106,607.2 108,289.8 -1.55%Edmonton Transit SystemAB Edmonton
6.5 5.2 6.6 6.5 5.1NA 3.85%69.0 58.2 18.56%7.2AB Leduc City of Leduc, Leduc Transit Service TOTAL7.2 6.5 5.2NAMB 6.6 6.5 5.1 3.85%69.0 58.2 18.56%City of Leduc, Leduc Transit ServiceAB Leduc
2,610.4 2,567.1 2,797.8 2,597.3 2,631.5101.0 -1.47%29,375.7 29,627.1 -0.85%2,731.2BC Victoria BC Transit TOTAL
32.5 32.4 31.21.2DR 34.5 32.5 32.3 -3.22%394.7 400.9 -1.55%BC TransitBC Victoria2,698.7 2,578.0 2,535.999.8MB 2,763.3 2,564.8 2,599.2 -1.45%28,981.0 29,226.2 -0.84%BC TransitBC Victoria
87.3 81.9 103.4 93.1 87.60.1 -7.36%1,001.9 1,098.0 -8.75%94.0MB Brandon City of Brandon TOTAL94.0 87.3 81.90.1MB 103.4 93.1 87.6 -7.36%1,001.9 1,098.0 -8.75%City of BrandonMB Brandon
2,002.4 1,676.2 2,000.0 1,823.3 1,717.578.2 2.97%21,178.5 20,518.1 3.22%2,026.6ON Brampton Brampton Transit TOTAL2,026.6 2,002.4 1,676.278.2MB 2,000.0 1,823.3 1,717.5 2.97%21,178.5 20,518.1 3.22%Brampton TransitON Brampton
350.4 300.6 371.7 357.3 305.617.3 -3.10%3,866.3 4,058.1 -4.73%351.5ON Oakville Oakville Transit TOTAL
9.0 9.3 8.73.8DR 7.9 7.6 7.2 18.94%98.0 84.3 16.25%Oakville TransitON Oakville342.5 341.1 291.913.5MB 363.8 349.7 298.4 -3.60%3,768.3 3,973.8 -5.17%Oakville TransitON Oakville
13,401.7 12,388.8 13,510.3 12,870.3 12,111.9540.1 2.11%140,416.9 140,726.2 -0.22%13,513.9ON Ottawa OC Transpo/Para Transpo TOTAL
80.6 80.7 72.63.1DR 76.2 74.1 69.5 6.41%897.8 883.8 1.58%OC Transpo/Para TranspoON Ottawa435.9 470.1 308.517.0LR 319.1 298.2 282.1 35.03%3,631.4 3,012.7 20.54%OC Transpo/Para TranspoON Ottawa
12,997.4 12,850.9 12,007.7520.1MB 13,115.0 12,498.0 11,760.3 1.29%135,887.7 136,829.7 -0.69%OC Transpo/Para TranspoON Ottawa
1,928.7 1,776.2 2,198.0 1,978.0 1,736.478.3 -2.77%22,115.5 22,445.6 -1.47%2,044.0ON Richmond Hill York Region Transit TOTAL2,044.0 1,928.7 1,776.278.3MB 2,198.0 1,978.0 1,736.4 -2.77%22,115.5 22,445.6 -1.47%York Region TransitON Richmond Hill
75,465.4 69,536.1 79,035.0 76,236.3 68,265.92,783.3 -0.71%859,920.2 860,978.7 -0.12%76,956.1ON Toronto Toronto Transit Commission TOTAL
286.7 304.3 315.211.3DR 256.2 272.1 266.7 13.99%3,534.5 3,126.8 13.04%Toronto Transit CommissionON Toronto28,211.6 27,942.8 26,222.01,037.4HR 28,643.9 27,838.5 25,835.1 0.07%317,099.5 312,185.9 1.57%Toronto Transit CommissionON Toronto
834.6 821.7 771.828.7IR 894.8 900.5 832.0 -7.58%10,156.0 12,552.6 -19.09%Toronto Transit CommissionON Toronto8,650.0 8,367.8 7,854.8308.9LR 8,351.8 8,219.1 7,615.4 2.84%96,641.7 91,588.2 5.52%Toronto Transit CommissionON Toronto
38,973.2 38,028.8 34,372.31,397.0MB 40,888.3 39,006.1 33,716.7 -1.97%432,488.5 441,525.2 -2.05%Toronto Transit CommissionON Toronto
1,844.0 1,810.5 1,837.6 1,659.3 1,746.785.3 5.53%20,350.1 19,322.1 5.32%1,879.1QC Montreal Agence Metropolitaine de Transport TOTAL
1,735.2 1,698.7 1,694.579.0CR 1,684.8 1,523.2 1,636.8 5.85%18,824.3 17,786.7 5.83%Agence Metropolitaine de TransportQC Montreal143.9 145.3 116.06.3MB 152.8 136.1 109.9 1.60%1,525.8 1,535.4 -0.63%Agence Metropolitaine de TransportQC Montreal
Modes: MB - Bus, DR - Demand Response, CR - Commuter Rail, HR - Heavy Rail, LR - Light Rail, AG - Automated Guideway, CC - Cable Car, FB - Ferry Boat, IP - Inclined Plane, IR - Intermediate Rail, MO - Monorail, TB - Trolleybus, VP - Vanpool
Recommended