Global Futures and Strategic Foresight Analysis at CGIAR: Application of the geo-spatial bio-economic modeling framework to inform decision making
S Nedumaran, G Sika, D Enahoro, Keith Wiebe and Cynthia Bantilan CGIAR Research Program on Policies, Institutions and Markets
On behalf of the CG centers working on GFSFBernardo Creamer, Ulrich Kleinwechter, Guy Hareau, Daniel Mason-D'Croz, Nelgen Signe, Roberto Telleria
ICAE Conference 9-14 August Milan, Italy
Outline
Global Futures and Strategic Foresight (GFSF)
Why foresight analysis?
Framework developed in GFSF
Case studies undertaken by CG centres
ICRISAT – Evaluation of Groundnut Promising technologies
CIP – Evaluation of Potato promising technologies
CIMMYT - Impact of climate change on production and food security of maize systems in SSA
ILRI - Quantification of global livestock futures
Summary and way forward

CG centers partners in GFSF
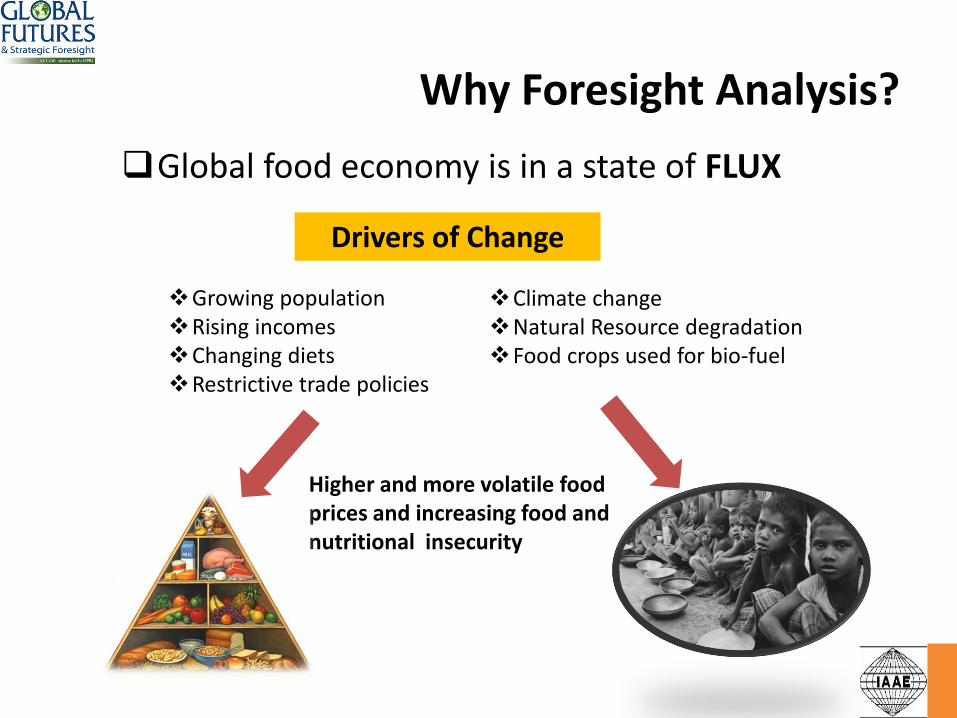
Why Foresight Analysis?
Global food economy is in a state of FLUX
Growing populationRising incomesChanging dietsRestrictive trade policies
Climate changeNatural Resource degradationFood crops used for bio-fuel
Higher and more volatile food prices and increasing food and nutritional insecurity
Drivers of Change

0
500
1000
1500
2000
2500
3000
1971 1973 1975 1977 1979 1981 1983 1985 1987 1989 1991 1993 1995 1997 1999 2001 2003 2005 2007 2009 2011 2013
US
$ p
er M
etri
c to
n
Groundnuts Oil Soybeans Maize Sorghum Rice, Thai 5%
Prices for Agricultural Commodities, 1971-2013
Stable and low
Source: World Bank (2014)
Note: Price are in real 2010 US$.
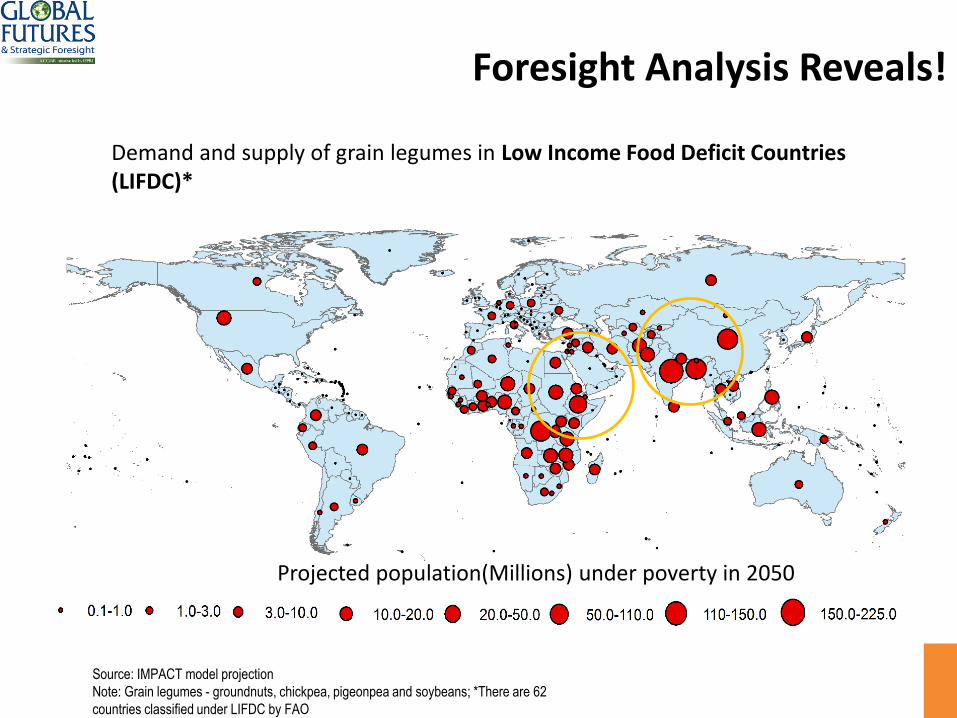
Foresight Analysis Reveals!
0
20000
40000
60000
80000
100000
120000
2010 2015 2020 2025 2030 2035 2040 2045 2050
'00
0 m
etri
c to
n
Supply Demand
Demand and supply of grain legumes in Low Income Food Deficit Countries (LIFDC)*
Source: IMPACT model projection
Note: Grain legumes - groundnuts, chickpea, pigeonpea and soybeans; *There are 62
countries classified under LIFDC by FAO
Projected population(Millions) under poverty in 2050

Goal of Global Futures and Strategic Foresight
Increasing the yield by developing crop
varieties with promising traits
Increased production, reduces the prices,
increase the consumption
Reduce malnutrition and Poverty
To support increases in agricultural productivity and environmental sustainability by evaluating promising technologies, investments, and policy reforms
Evaluation of selected promising technologies under development in CG centers
Source: Nelson et al., PNAS (2014)
Modeling climate impacts on agriculture:Incorporating economic effects
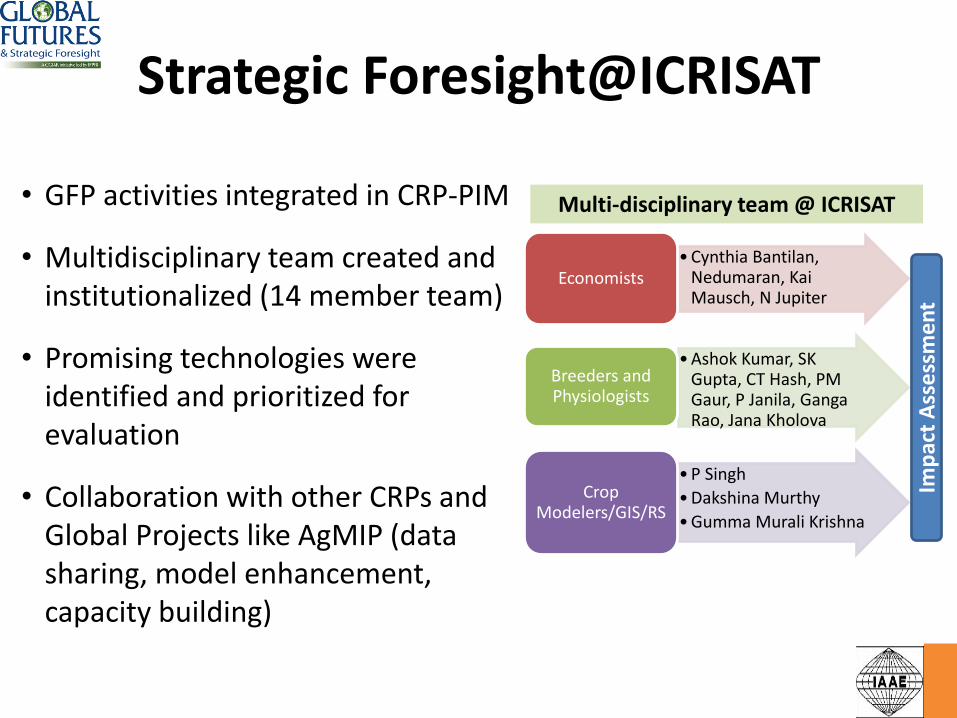
Strategic Foresight@ICRISAT
• GFP activities integrated in CRP-PIM
• Multidisciplinary team created and institutionalized (14 member team)
• Promising technologies were identified and prioritized for evaluation
• Collaboration with other CRPs and Global Projects like AgMIP (data sharing, model enhancement, capacity building)
Multi-disciplinary team @ ICRISAT
• Cynthia Bantilan, Nedumaran, Kai Mausch, N Jupiter
Economists
• Ashok Kumar, SK Gupta, CT Hash, PM Gaur, P Janila, Ganga Rao, Jana Kholova
Breeders and Physiologists
• P Singh
• Dakshina Murthy
• Gumma Murali Krishna
Crop Modelers/GIS/RS
Imp
act
Ass
ess
men
t

Integrated Model Framework
Hydrology model-WSM
Climate model
Source: Rosegrant et al. (2012)
Crop model

Evaluation of Promising Technologies: Virtual Cultivars
Target of the crop improvement scientists – develop promising technologies with higher yield
Pote
nti
al Y
ield
(K
g/h
a)
2014 2020
Incorporating the traits in elite cultivars
better root system
Extr
act
mo
re w
ater
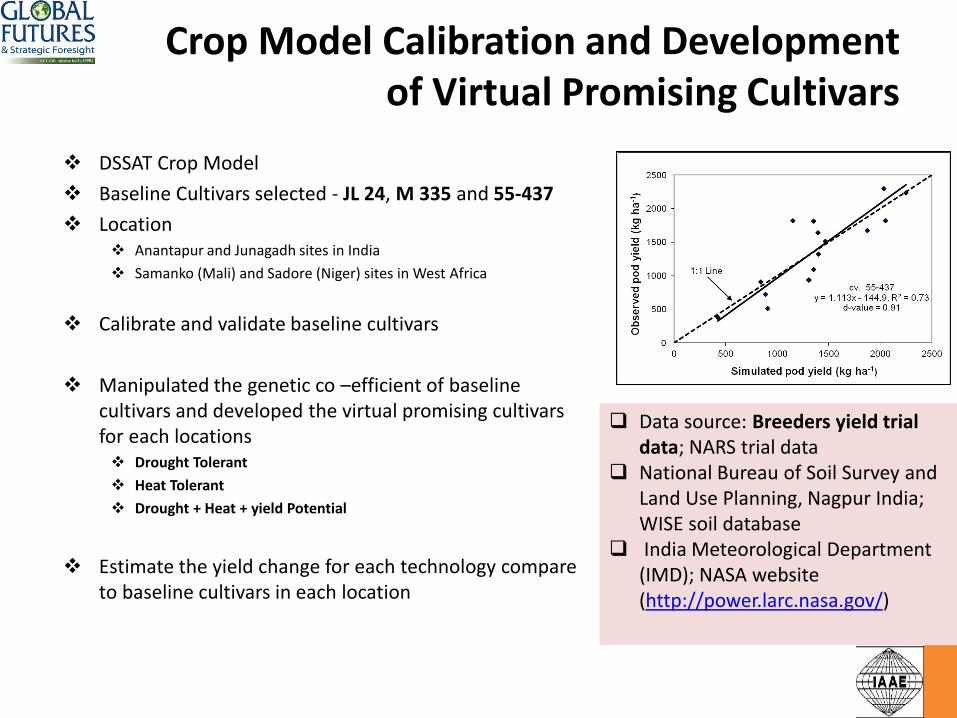
Crop Model Calibration and Development of Virtual Promising Cultivars
DSSAT Crop Model
Baseline Cultivars selected - JL 24, M 335 and 55-437
Location Anantapur and Junagadh sites in India
Samanko (Mali) and Sadore (Niger) sites in West Africa
Calibrate and validate baseline cultivars
Manipulated the genetic co –efficient of baseline cultivars and developed the virtual promising cultivars for each locations Drought Tolerant
Heat Tolerant
Drought + Heat + yield Potential
Estimate the yield change for each technology compare to baseline cultivars in each location
Data source: Breeders yield trial data; NARS trial data
National Bureau of Soil Survey and Land Use Planning, Nagpur India; WISE soil database
India Meteorological Department (IMD); NASA website (http://power.larc.nasa.gov/)
1171
1225
1270
1477
1100
1150
1200
1250
1300
1350
1400
1450
1500
JL 24 DroughtTolerance
Heat Tolerance Drought + Heattolerance +
Yield potential
Kg
/ha
1228
12711246
1451
1100
1150
1200
1250
1300
1350
1400
1450
1500
JL 24 DroughtTolerance
Heat Tolerance Drought + Heattolerance + Yield
potential
Kg/
ha
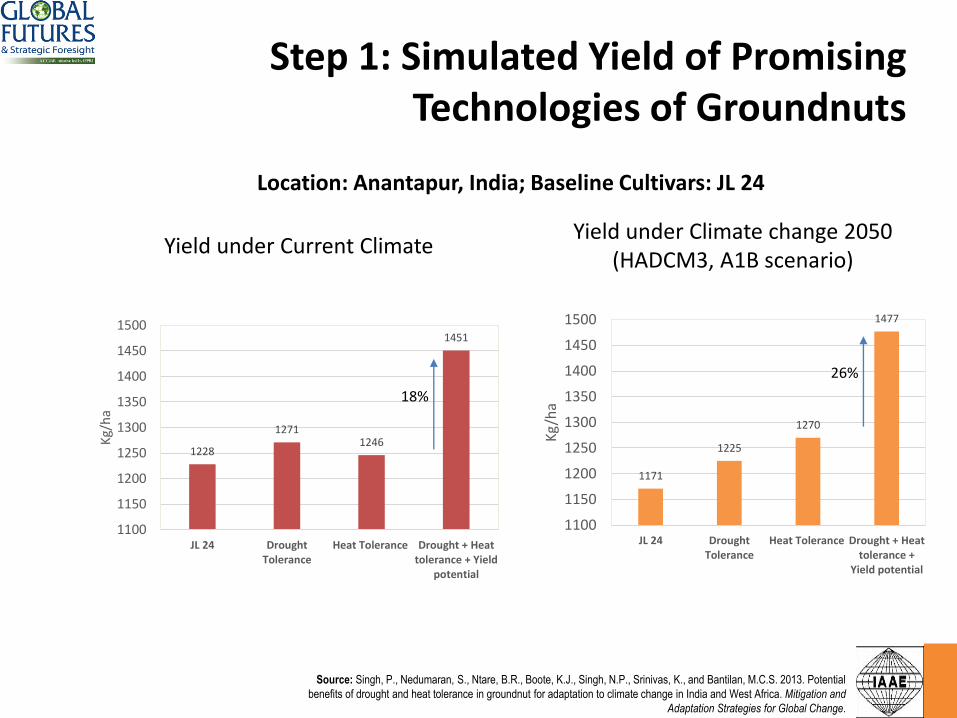
Step 1: Simulated Yield of Promising Technologies of Groundnuts
Source: Singh, P., Nedumaran, S., Ntare, B.R., Boote, K.J., Singh, N.P., Srinivas, K., and Bantilan, M.C.S. 2013. Potential
benefits of drought and heat tolerance in groundnut for adaptation to climate change in India and West Africa. Mitigation and
Adaptation Strategies for Global Change.
18%
Yield under Current Climate
26%
Yield under Climate change 2050 (HADCM3, A1B scenario)
Location: Anantapur, India; Baseline Cultivars: JL 24
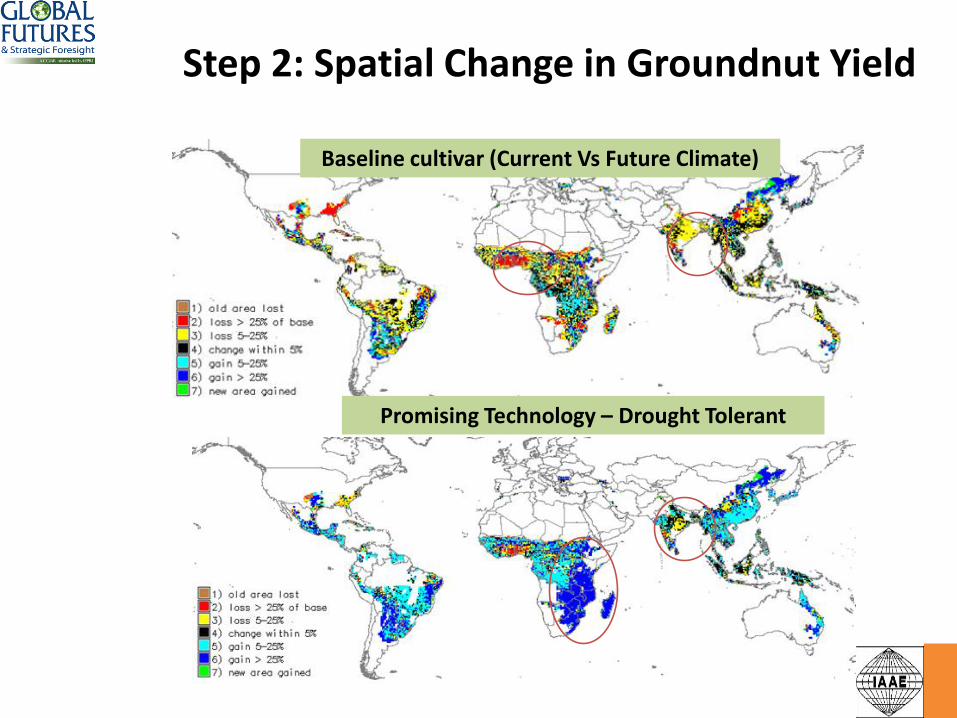
Step 2: Spatial Change in Groundnut Yield
Baseline cultivar (Current Vs Future Climate)
Promising Technology – Drought Tolerant

Step 3: Technology Development and Adoption Pathway Framework
2012 2018 2035
India60%
Nigeria40%
20372020
Research lag Adoption lag
Promising Technologies of Groundnut development
Technology developmentTechnology dissemination and
adoptionOutcomes and
Impacts
• Change in Production
• Change in prices• Change in
consumption • Poverty level
Nedumaran et al. (2013)
Target countries
Target countriesProduction share (%)
Burkina Faso 1.2
Ghana 1.62
India 12.99
Malawi 0.7
Mali 1.01
Myanmar 3.84
Niger 0.51
Nigeria 10.72
Tanzania 1.73
Uganda 0.76
Vietnam 1.84
Total 36.92
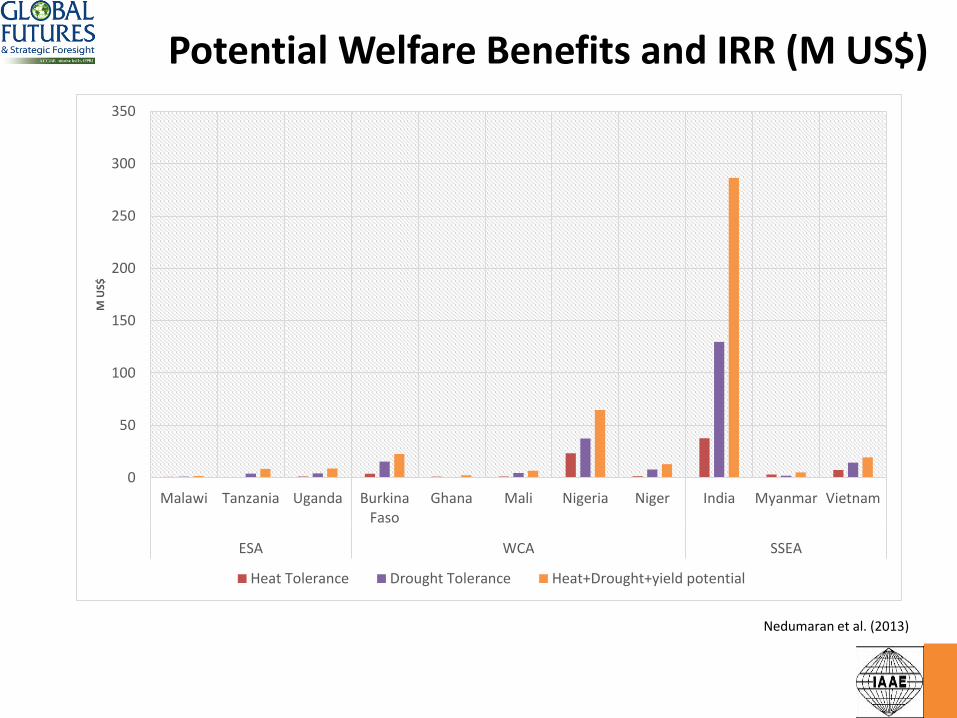
Potential Welfare Benefits and IRR (M US$)
TechnologiesNet Benefits
(M US$)IRR (%)
Heat Tolerant 302.39 30
Drought Tolerant 784.08 38
Heat + Drought + Yield
Potential1519.76 42
Nedumaran et al. (2013)
0
50
100
150
200
250
300
350
Malawi Tanzania Uganda BurkinaFaso
Ghana Mali Nigeria Niger India Myanmar Vietnam
ESA WCA SSEA
M U
S$
Heat Tolerance Drought Tolerance Heat+Drought+yield potential
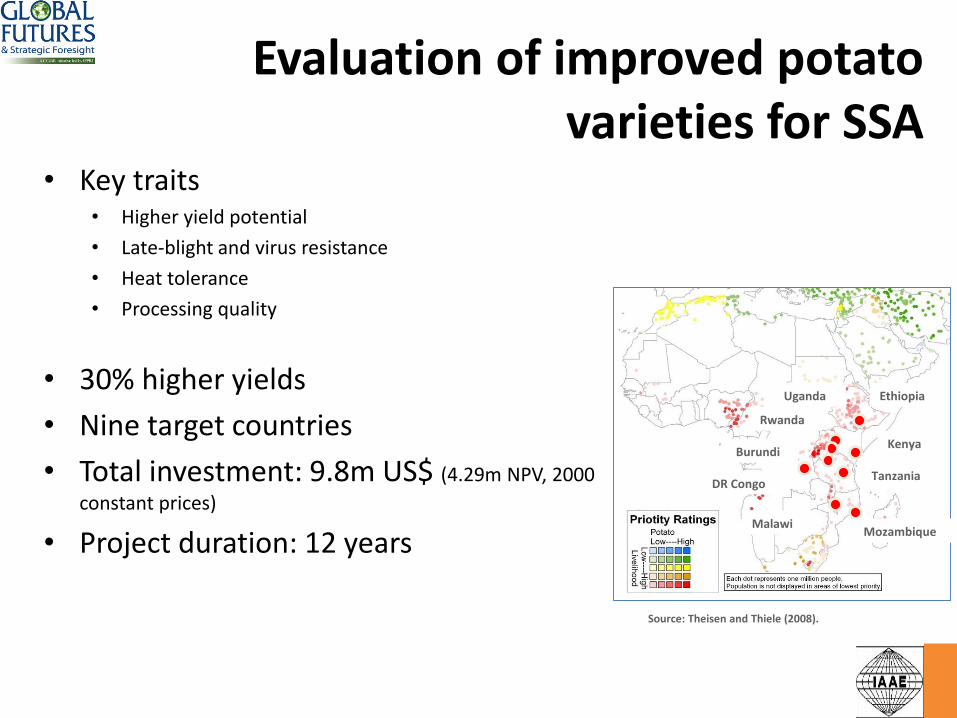
Evaluation of improved potato varieties for SSA
• Key traits• Higher yield potential
• Late-blight and virus resistance
• Heat tolerance
• Processing quality
• 30% higher yields
• Nine target countries
• Total investment: 9.8m US$ (4.29m NPV, 2000
constant prices)
• Project duration: 12 years
Source: Theisen and Thiele (2008).
EthiopiaUganda
Rwanda
Burundi
DR Congo
Kenya
Tanzania
MozambiqueMalawi
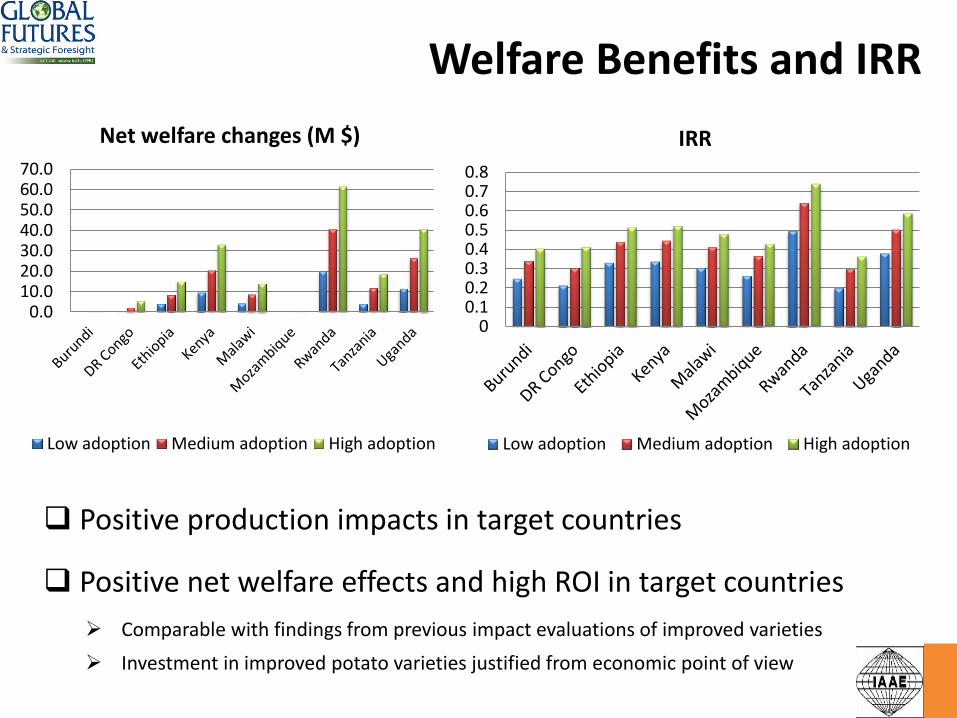
Welfare Benefits and IRR
0.010.020.030.040.050.060.070.0
Net welfare changes (M $)
Low adoption Medium adoption High adoption
00.10.20.30.40.50.60.70.8
IRR
Low adoption Medium adoption High adoption
Positive production impacts in target countries
Positive net welfare effects and high ROI in target countries
Comparable with findings from previous impact evaluations of improved varieties
Investment in improved potato varieties justified from economic point of view
Strategic Foresight @ CIMMYT:Impact of Climate change on Maize
Production in SSA

GCM monthly gridded data
Regional/global crop productivity under various climate models and
technologies
Evaluated DSSAT model
DSSAT Crop
Model
Site/farm level simulation
Site soil
Daily site
climate
Crop
Crop management
Model calibration
Model evaluation
27 FAO soil groups
daily pixel climate
Cropmanagement
Weather generator
Crop per MME
Evaluated DSSAT model
Evaluated IMPACT model
GIS
GIS
Projections on population and income growth
Trade-offs (elasticities) on inputs, production and consumption patterns
Projections on trade barriers
Projected world and domestic prices
Projected demand, supply and net trade
Nutrition results
DSSAT Spatial DSSAT IMPACT
Bio-economic modelling framework

Changes in yield and area of maize under low N level in SSA by 2050 (a & b) and 2080 (c & d) relative to the baseline (2000) using climate projection from CSIRO and MIROC global circulation models under the A1B emission scenario
Impact of Alternate Climate Scenarios on Maize
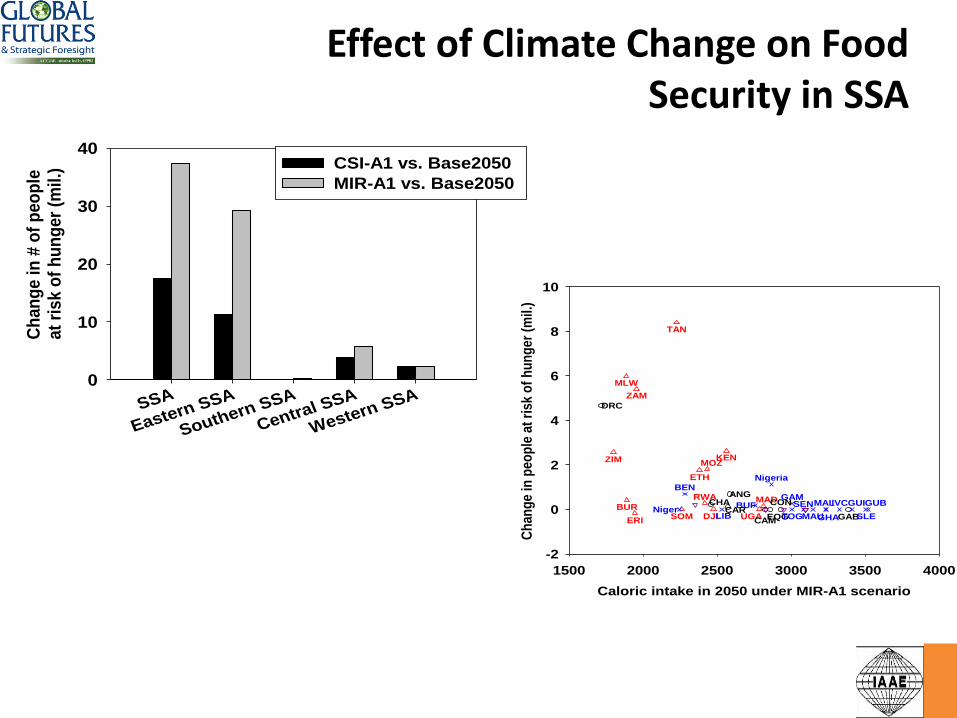
SSA
Eastern SSA
Southern SSA
Central SSA
Western SSA0
10
20
30
40CSI-A1 vs. Base2050
MIR-A1 vs. Base2050
Ch
an
ge in
# o
f p
eo
ple
at
risk o
f h
un
ger
(mil
.)
Caloric intake in 2050 under MIR-A1 scenario
1500 2000 2500 3000 3500 4000
Ch
ang
e in
pe
op
le a
t ri
sk o
f h
un
ge
r (m
il.)
-2
0
2
4
6
8
10
BURDJI
ERI
ETH
KEN
MAD
MLW
MOZ
RWA
SOM
TAN
UGA
ZAM
ZIM
ANG
CAM
CARCHA CON
DRC
EQG GAB
BEN
BUFGAM
GHA
GUIGUBIVC
LIB
MAL
MAUNiger
Nigeria
SEN
SLETOG
Effect of Climate Change on Food Security in SSA

Summary
Maize production in SSA
Reduction of up to 12% and 20% by 2050 and 2080, respectively
Sahel and southern Africa: reduction in maize yields due to increasing temperatures and decreasing rainfall
Highlands in eastern Africa: increase in maize production due to small changes in rainfall and increasing temperature
Food security in SSA: hardest-hit is eastern Africa; DRC in central Africa and Nigeria in western Africa
Tesfaye et al., 2015
Strategic Foresight @ ILRIGlobal Livestock Futures
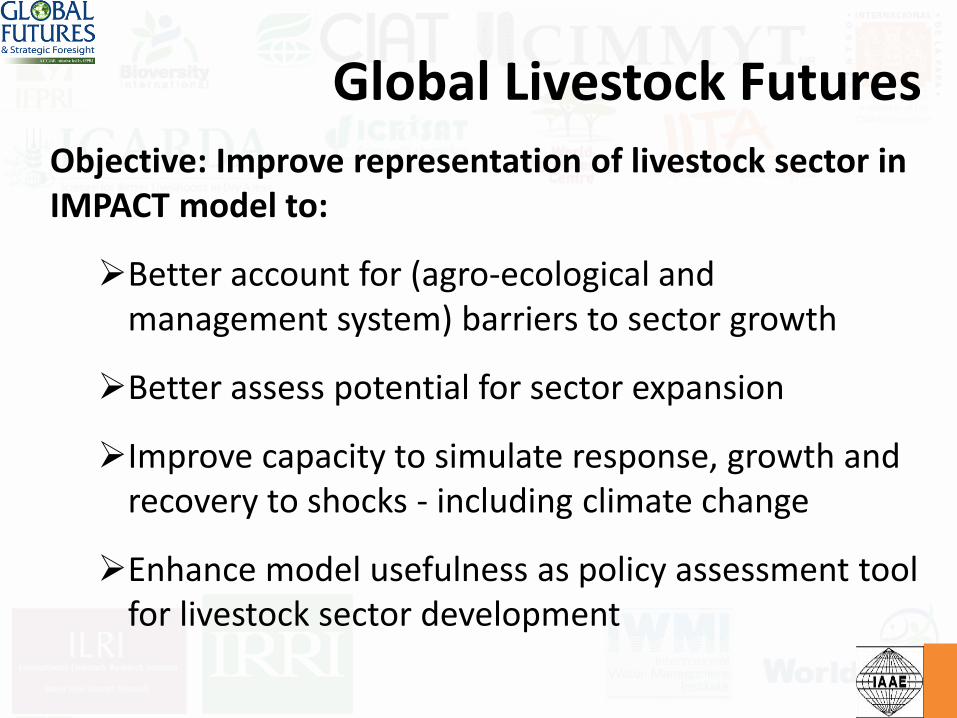
Global Livestock FuturesObjective: Improve representation of livestock sector in IMPACT model to:
Better account for (agro-ecological and management system) barriers to sector growth
Better assess potential for sector expansion
Improve capacity to simulate response, growth and recovery to shocks - including climate change
Enhance model usefulness as policy assessment tool for livestock sector development
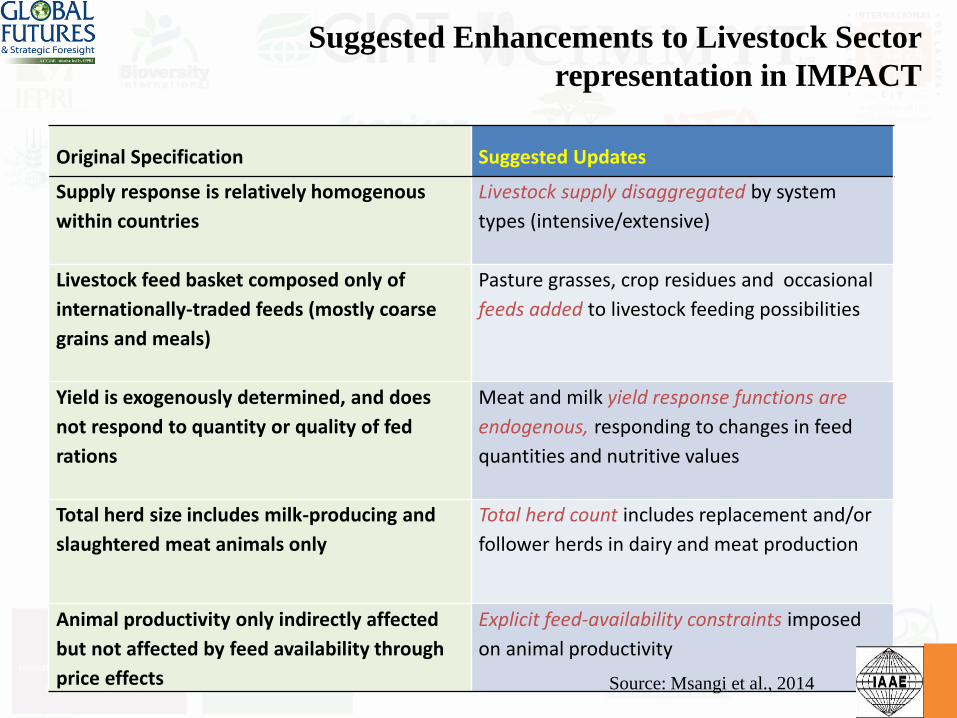
Original Specification Suggested Updates
Supply response is relatively homogenous
within countries
Livestock supply disaggregated by system
types (intensive/extensive)
Livestock feed basket composed only of
internationally-traded feeds (mostly coarse
grains and meals)
Pasture grasses, crop residues and occasional
feeds added to livestock feeding possibilities
Yield is exogenously determined, and does
not respond to quantity or quality of fed
rations
Meat and milk yield response functions are
endogenous, responding to changes in feed
quantities and nutritive values
Total herd size includes milk-producing and
slaughtered meat animals only
Total herd count includes replacement and/or
follower herds in dairy and meat production
Animal productivity only indirectly affected
but not affected by feed availability through
price effects
Explicit feed-availability constraints imposed
on animal productivity
Source: Msangi et al., 2014
Suggested Enhancements to Livestock Sector
representation in IMPACT
Source: Msangi et al., 2014
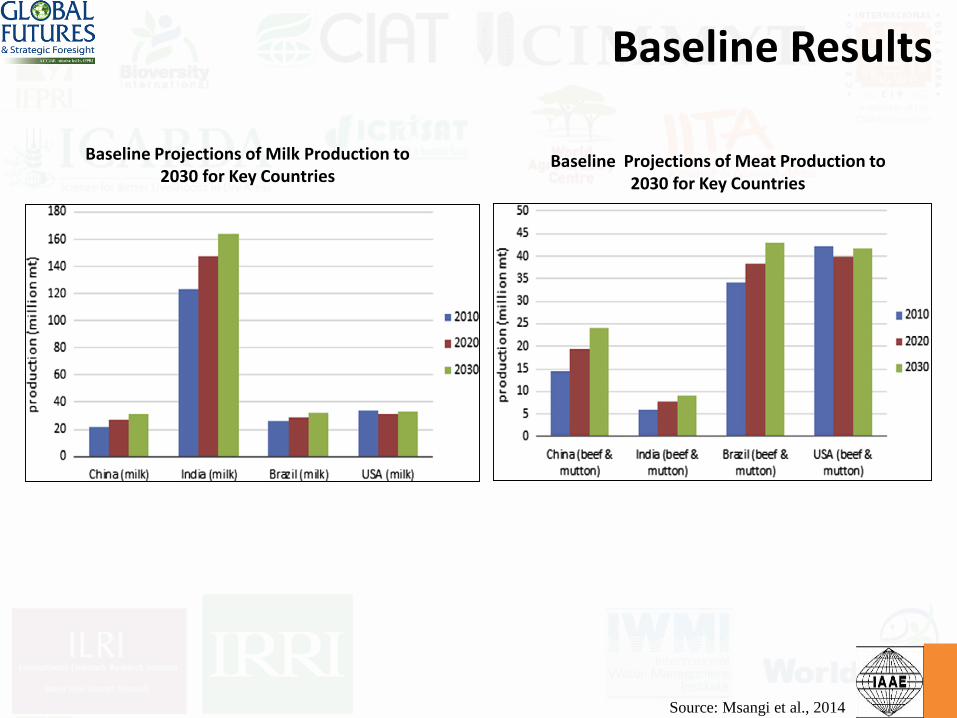
Baseline Projections of Meat Production to 2030 for Key Countries
Baseline Projections of Milk Production to 2030 for Key Countries
Baseline Results
Summary
More dynamic growth for meat and lamb production in China, milk in India; Brazil meat production to surpass US by 2030
Supply-side response to growing demand for livestock products is more constrained in the enhanced model
Growth in feed demand and pressure on land resources more apparent, with important implications for the more extensive production systems

Way forward
Evaluate the additional promising technologies (biotic stress tolerant and management options) with current GF/PIM Strategic foresight tool
Provide evidence to better targeting of technology and inform priority setting for CG centres and CRPs
Identify and collaborate with pest and diseases modelling team
Consider linking results from global models with household data for ex ante impact assessment at lower scales
Gender lens in foresight analysis and technology evaluation
Development of ‘stand alone’ module in IMPACT with enhanced representation of livestock
Test current and alternative (technology and policy) strategies for livestock sector development under a range of plausible future scenarios - including global climate change
Thank you!
Recommended